Cities with the Lowest Poverty Level Among Married Couples in Alabama
RELATED REPORTS & OPTIONS
Lowest Poverty | Married Couple
Alabama
Compare Cities
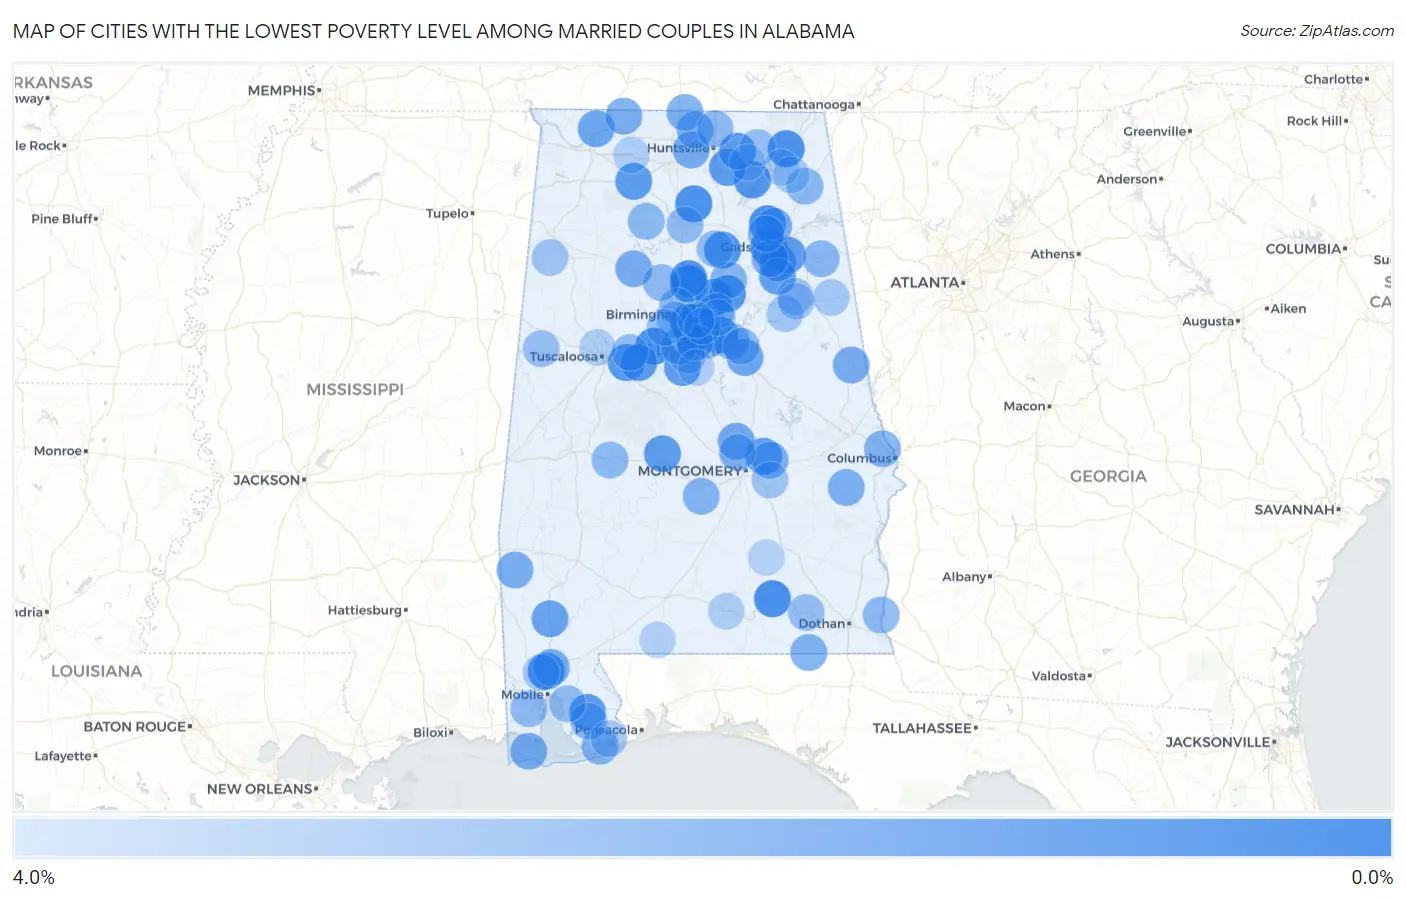
Map of Cities with the Lowest Poverty Level Among Married Couples in Alabama
4.0%
0.0%
Cities with the Lowest Poverty Level Among Married Couples in Alabama
| City | Married Couples Poverty | vs State | vs National | |
| 1. | Homewood | 0.063% | 5.1%(-5.00)#1 | 4.5%(-4.40)#3 |
| 2. | Morris | 0.33% | 5.1%(-4.74)#2 | 4.5%(-4.14)#82 |
| 3. | Attalla | 0.45% | 5.1%(-4.61)#3 | 4.5%(-4.01)#194 |
| 4. | Trussville | 0.46% | 5.1%(-4.60)#4 | 4.5%(-4.00)#207 |
| 5. | Sardis City | 0.49% | 5.1%(-4.57)#5 | 4.5%(-3.97)#233 |
| 6. | Elba | 0.49% | 5.1%(-4.57)#6 | 4.5%(-3.97)#234 |
| 7. | Lake View | 0.53% | 5.1%(-4.54)#7 | 4.5%(-3.94)#274 |
| 8. | Eva | 0.59% | 5.1%(-4.47)#8 | 4.5%(-3.87)#366 |
| 9. | Satsuma | 0.60% | 5.1%(-4.46)#9 | 4.5%(-3.86)#381 |
| 10. | Hollywood | 0.61% | 5.1%(-4.46)#10 | 4.5%(-3.85)#388 |
| 11. | Kimberly | 0.71% | 5.1%(-4.36)#11 | 4.5%(-3.75)#536 |
| 12. | Rosa | 0.76% | 5.1%(-4.30)#12 | 4.5%(-3.70)#652 |
| 13. | Margaret | 0.77% | 5.1%(-4.30)#13 | 4.5%(-3.69)#672 |
| 14. | Westover | 0.82% | 5.1%(-4.25)#14 | 4.5%(-3.64)#792 |
| 15. | Grant | 0.82% | 5.1%(-4.24)#15 | 4.5%(-3.64)#803 |
| 16. | Meadowbrook | 0.83% | 5.1%(-4.24)#16 | 4.5%(-3.63)#822 |
| 17. | Coaling | 0.88% | 5.1%(-4.18)#17 | 4.5%(-3.58)#921 |
| 18. | Southside | 0.94% | 5.1%(-4.13)#18 | 4.5%(-3.52)#1,054 |
| 19. | Vance | 0.94% | 5.1%(-4.13)#19 | 4.5%(-3.52)#1,056 |
| 20. | Vestavia Hills | 0.96% | 5.1%(-4.10)#20 | 4.5%(-3.50)#1,114 |
| 21. | Owens Cross Roads | 0.97% | 5.1%(-4.10)#21 | 4.5%(-3.49)#1,129 |
| 22. | Robertsdale | 0.97% | 5.1%(-4.10)#22 | 4.5%(-3.49)#1,131 |
| 23. | Moulton | 1.00% | 5.1%(-4.07)#23 | 4.5%(-3.46)#1,199 |
| 24. | Gurley | 1.0% | 5.1%(-4.07)#24 | 4.5%(-3.46)#1,208 |
| 25. | Valley Grande | 1.0% | 5.1%(-4.04)#25 | 4.5%(-3.43)#1,280 |
| 26. | Glencoe | 1.0% | 5.1%(-4.02)#26 | 4.5%(-3.42)#1,310 |
| 27. | Montevallo | 1.1% | 5.1%(-4.01)#27 | 4.5%(-3.40)#1,338 |
| 28. | Redland | 1.1% | 5.1%(-3.94)#28 | 4.5%(-3.34)#1,490 |
| 29. | Ohatchee | 1.2% | 5.1%(-3.90)#29 | 4.5%(-3.30)#1,589 |
| 30. | Mcintosh | 1.3% | 5.1%(-3.80)#30 | 4.5%(-3.20)#1,845 |
| 31. | Oak Grove | 1.4% | 5.1%(-3.68)#31 | 4.5%(-3.08)#2,165 |
| 32. | St Florian | 1.4% | 5.1%(-3.64)#32 | 4.5%(-3.03)#2,284 |
| 33. | Deatsville | 1.5% | 5.1%(-3.57)#33 | 4.5%(-2.97)#2,448 |
| 34. | Hoover | 1.6% | 5.1%(-3.46)#34 | 4.5%(-2.85)#2,773 |
| 35. | Roanoke | 1.6% | 5.1%(-3.45)#35 | 4.5%(-2.85)#2,800 |
| 36. | Madison | 1.6% | 5.1%(-3.44)#36 | 4.5%(-2.84)#2,812 |
| 37. | Dauphin Island | 1.6% | 5.1%(-3.42)#37 | 4.5%(-2.81)#2,888 |
| 38. | Whitesboro | 1.6% | 5.1%(-3.42)#38 | 4.5%(-2.81)#2,890 |
| 39. | Jasper | 1.7% | 5.1%(-3.41)#39 | 4.5%(-2.81)#2,901 |
| 40. | Millry | 1.7% | 5.1%(-3.40)#40 | 4.5%(-2.80)#2,935 |
| 41. | Harvest | 1.7% | 5.1%(-3.39)#41 | 4.5%(-2.79)#2,950 |
| 42. | Lexington | 1.7% | 5.1%(-3.37)#42 | 4.5%(-2.77)#2,998 |
| 43. | Creola | 1.7% | 5.1%(-3.36)#43 | 4.5%(-2.76)#3,030 |
| 44. | Hurtsboro | 1.7% | 5.1%(-3.34)#44 | 4.5%(-2.74)#3,079 |
| 45. | Emerald Mountain | 1.7% | 5.1%(-3.33)#45 | 4.5%(-2.72)#3,111 |
| 46. | Ardmore | 1.7% | 5.1%(-3.33)#46 | 4.5%(-2.72)#3,113 |
| 47. | Black | 1.8% | 5.1%(-3.28)#47 | 4.5%(-2.68)#3,240 |
| 48. | Millbrook | 1.8% | 5.1%(-3.24)#48 | 4.5%(-2.63)#3,351 |
| 49. | Rainbow City | 1.8% | 5.1%(-3.22)#49 | 4.5%(-2.62)#3,383 |
| 50. | Smiths Station | 1.9% | 5.1%(-3.16)#50 | 4.5%(-2.55)#3,538 |
| 51. | Orange Beach | 2.0% | 5.1%(-3.12)#51 | 4.5%(-2.51)#3,624 |
| 52. | Mosses | 2.0% | 5.1%(-3.11)#52 | 4.5%(-2.50)#3,655 |
| 53. | Piedmont | 2.0% | 5.1%(-3.03)#53 | 4.5%(-2.43)#3,834 |
| 54. | Chelsea | 2.0% | 5.1%(-3.02)#54 | 4.5%(-2.42)#3,867 |
| 55. | Carlisle Rockledge | 2.0% | 5.1%(-3.02)#55 | 4.5%(-2.42)#3,873 |
| 56. | Harpersville | 2.1% | 5.1%(-2.99)#56 | 4.5%(-2.39)#3,938 |
| 57. | Springville | 2.1% | 5.1%(-2.99)#57 | 4.5%(-2.39)#3,956 |
| 58. | Leeds | 2.1% | 5.1%(-2.96)#58 | 4.5%(-2.36)#4,030 |
| 59. | Forestdale | 2.1% | 5.1%(-2.96)#59 | 4.5%(-2.35)#4,056 |
| 60. | Columbia | 2.1% | 5.1%(-2.95)#60 | 4.5%(-2.35)#4,066 |
| 61. | Pine Ridge | 2.1% | 5.1%(-2.94)#61 | 4.5%(-2.33)#4,103 |
| 62. | Addison | 2.1% | 5.1%(-2.92)#62 | 4.5%(-2.32)#4,142 |
| 63. | Uniontown | 2.2% | 5.1%(-2.91)#63 | 4.5%(-2.30)#4,190 |
| 64. | Alabaster | 2.2% | 5.1%(-2.91)#64 | 4.5%(-2.30)#4,194 |
| 65. | Helena | 2.2% | 5.1%(-2.88)#65 | 4.5%(-2.28)#4,253 |
| 66. | Meridianville | 2.2% | 5.1%(-2.86)#66 | 4.5%(-2.26)#4,289 |
| 67. | Sumiton | 2.2% | 5.1%(-2.86)#67 | 4.5%(-2.26)#4,293 |
| 68. | Summerdale | 2.2% | 5.1%(-2.85)#68 | 4.5%(-2.25)#4,322 |
| 69. | Childersburg | 2.2% | 5.1%(-2.84)#69 | 4.5%(-2.24)#4,332 |
| 70. | Tillmans Corner | 2.2% | 5.1%(-2.83)#70 | 4.5%(-2.23)#4,381 |
| 71. | Cullman | 2.3% | 5.1%(-2.78)#71 | 4.5%(-2.18)#4,517 |
| 72. | Pelham | 2.3% | 5.1%(-2.76)#72 | 4.5%(-2.16)#4,565 |
| 73. | Cleveland | 2.3% | 5.1%(-2.74)#73 | 4.5%(-2.14)#4,601 |
| 74. | Daphne | 2.3% | 5.1%(-2.74)#74 | 4.5%(-2.13)#4,621 |
| 75. | Fairfield | 2.4% | 5.1%(-2.70)#75 | 4.5%(-2.10)#4,716 |
| 76. | Brookwood | 2.4% | 5.1%(-2.69)#76 | 4.5%(-2.08)#4,753 |
| 77. | Carrollton | 2.4% | 5.1%(-2.65)#77 | 4.5%(-2.04)#4,861 |
| 78. | Level Plains | 2.4% | 5.1%(-2.62)#78 | 4.5%(-2.02)#4,955 |
| 79. | Pleasant Groves | 2.5% | 5.1%(-2.57)#79 | 4.5%(-1.96)#5,070 |
| 80. | Hueytown | 2.5% | 5.1%(-2.53)#80 | 4.5%(-1.92)#5,170 |
| 81. | Pike Road | 2.6% | 5.1%(-2.45)#81 | 4.5%(-1.84)#5,374 |
| 82. | West End Cobb Town | 2.6% | 5.1%(-2.45)#82 | 4.5%(-1.84)#5,376 |
| 83. | Beaverton | 2.6% | 5.1%(-2.43)#83 | 4.5%(-1.83)#5,418 |
| 84. | Munford | 2.7% | 5.1%(-2.39)#84 | 4.5%(-1.79)#5,495 |
| 85. | Hobson City | 2.7% | 5.1%(-2.39)#85 | 4.5%(-1.78)#5,510 |
| 86. | Saraland | 2.8% | 5.1%(-2.31)#86 | 4.5%(-1.71)#5,689 |
| 87. | Perdido Beach | 2.8% | 5.1%(-2.31)#87 | 4.5%(-1.70)#5,706 |
| 88. | Heflin | 2.8% | 5.1%(-2.29)#88 | 4.5%(-1.68)#5,744 |
| 89. | Brook Highland | 2.8% | 5.1%(-2.28)#89 | 4.5%(-1.68)#5,785 |
| 90. | Powell | 2.8% | 5.1%(-2.23)#90 | 4.5%(-1.62)#5,890 |
| 91. | Andalusia | 3.0% | 5.1%(-2.07)#91 | 4.5%(-1.47)#6,253 |
| 92. | Northport | 3.0% | 5.1%(-2.02)#92 | 4.5%(-1.42)#6,369 |
| 93. | Section | 3.1% | 5.1%(-2.00)#93 | 4.5%(-1.39)#6,425 |
| 94. | Dunnavant | 3.1% | 5.1%(-2.00)#94 | 4.5%(-1.39)#6,429 |
| 95. | North Courtland | 3.1% | 5.1%(-1.99)#95 | 4.5%(-1.38)#6,444 |
| 96. | Calera | 3.1% | 5.1%(-1.98)#96 | 4.5%(-1.37)#6,466 |
| 97. | Brewton | 3.1% | 5.1%(-1.97)#97 | 4.5%(-1.36)#6,488 |
| 98. | Mountain Brook | 3.1% | 5.1%(-1.92)#98 | 4.5%(-1.31)#6,613 |
| 99. | Goshen | 3.2% | 5.1%(-1.89)#99 | 4.5%(-1.29)#6,665 |
| 100. | Woodville | 3.2% | 5.1%(-1.86)#100 | 4.5%(-1.25)#6,738 |
Common Questions
What are the Top 10 Cities with the Lowest Poverty Level Among Married Couples in Alabama?
Top 10 Cities with the Lowest Poverty Level Among Married Couples in Alabama are:
#1
0.063%
#2
0.33%
#3
0.45%
#4
0.46%
#5
0.49%
#6
0.49%
#7
0.53%
#8
0.59%
#9
0.60%
#10
0.61%
What city has the Lowest Poverty Level Among Married Couples in Alabama?
Homewood has the Lowest Poverty Level Among Married Couples in Alabama with 0.063%.
What is the Poverty Level Among Married Couples in the State of Alabama?
Poverty Level Among Married Couples in Alabama is 5.1%.
What is the Poverty Level Among Married Couples in the United States?
Poverty Level Among Married Couples in the United States is 4.5%.