Day Valley, CA Map & Demographics
Day Valley Map
Day Valley Overview
$63,226
PER CAPITA INCOME
$163,625
AVG FAMILY INCOME
$143,295
AVG HOUSEHOLD INCOME
68.2%
WAGE / INCOME GAP [ % ]
31.8¢/ $1
WAGE / INCOME GAP [ $ ]
0.46
INEQUALITY / GINI INDEX
3,252
TOTAL POPULATION
1,497
MALE POPULATION
1,755
FEMALE POPULATION
85.30
MALES / 100 FEMALES
117.23
FEMALES / 100 MALES
54.7
MEDIAN AGE
3.0
AVG FAMILY SIZE
2.6
AVG HOUSEHOLD SIZE
1,363
LABOR FORCE [ PEOPLE ]
51.4%
PERCENT IN LABOR FORCE
4.5%
UNEMPLOYMENT RATE
Income in Day Valley
Income Overview in Day Valley
Per Capita Income in Day Valley is $63,226, while median incomes of families and households are $163,625 and $143,295 respectively.
| Characteristic | Number | Measure |
| Per Capita Income | 3,252 | $63,226 |
| Median Family Income | 900 | $163,625 |
| Mean Family Income | 900 | $183,018 |
| Median Household Income | 1,237 | $143,295 |
| Mean Household Income | 1,237 | $160,482 |
| Income Deficit | 900 | $0 |
| Wage / Income Gap (%) | 3,252 | 68.20% |
| Wage / Income Gap ($) | 3,252 | 31.80¢ per $1 |
| Gini / Inequality Index | 3,252 | 0.46 |
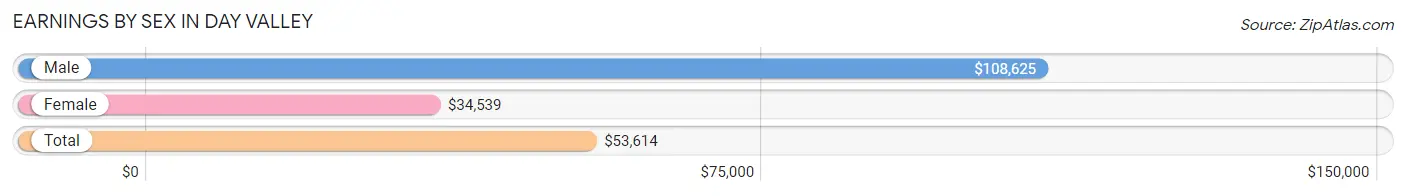
Earnings by Sex in Day Valley
Average Earnings in Day Valley are $53,614, $108,625 for men and $34,539 for women, a difference of 68.2%.
| Sex | Number | Average Earnings |
| Male | 775 (54.2%) | $108,625 |
| Female | 656 (45.8%) | $34,539 |
| Total | 1,431 (100.0%) | $53,614 |
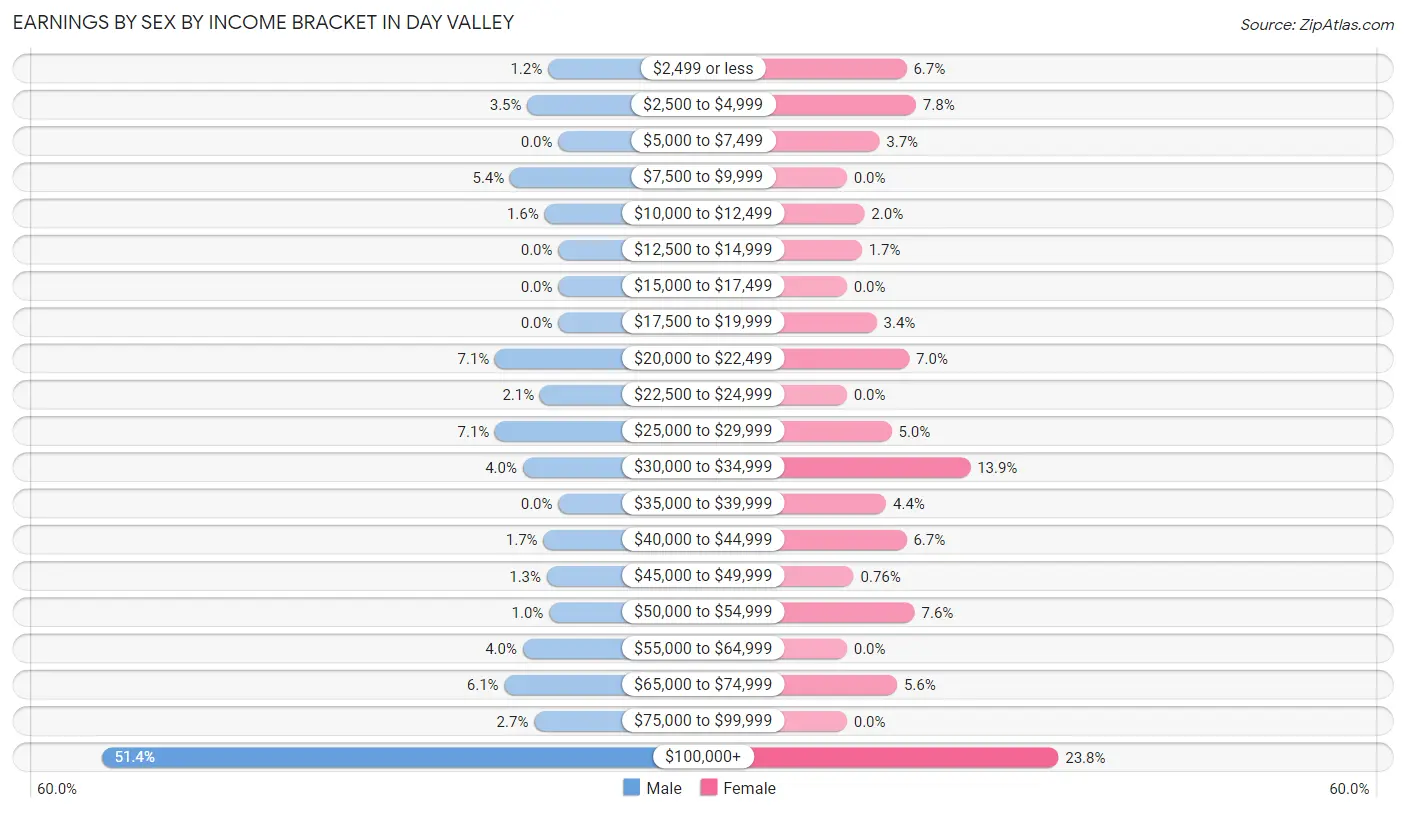
Earnings by Sex by Income Bracket in Day Valley
The most common earnings brackets in Day Valley are $100,000+ for men (398 | 51.3%) and $100,000+ for women (156 | 23.8%).
| Income | Male | Female |
| $2,499 or less | 9 (1.2%) | 44 (6.7%) |
| $2,500 to $4,999 | 27 (3.5%) | 51 (7.8%) |
| $5,000 to $7,499 | 0 (0.0%) | 24 (3.7%) |
| $7,500 to $9,999 | 42 (5.4%) | 0 (0.0%) |
| $10,000 to $12,499 | 12 (1.5%) | 13 (2.0%) |
| $12,500 to $14,999 | 0 (0.0%) | 11 (1.7%) |
| $15,000 to $17,499 | 0 (0.0%) | 0 (0.0%) |
| $17,500 to $19,999 | 0 (0.0%) | 22 (3.4%) |
| $20,000 to $22,499 | 55 (7.1%) | 46 (7.0%) |
| $22,500 to $24,999 | 16 (2.1%) | 0 (0.0%) |
| $25,000 to $29,999 | 55 (7.1%) | 33 (5.0%) |
| $30,000 to $34,999 | 31 (4.0%) | 91 (13.9%) |
| $35,000 to $39,999 | 0 (0.0%) | 29 (4.4%) |
| $40,000 to $44,999 | 13 (1.7%) | 44 (6.7%) |
| $45,000 to $49,999 | 10 (1.3%) | 5 (0.8%) |
| $50,000 to $54,999 | 8 (1.0%) | 50 (7.6%) |
| $55,000 to $64,999 | 31 (4.0%) | 0 (0.0%) |
| $65,000 to $74,999 | 47 (6.1%) | 37 (5.6%) |
| $75,000 to $99,999 | 21 (2.7%) | 0 (0.0%) |
| $100,000+ | 398 (51.3%) | 156 (23.8%) |
| Total | 775 (100.0%) | 656 (100.0%) |
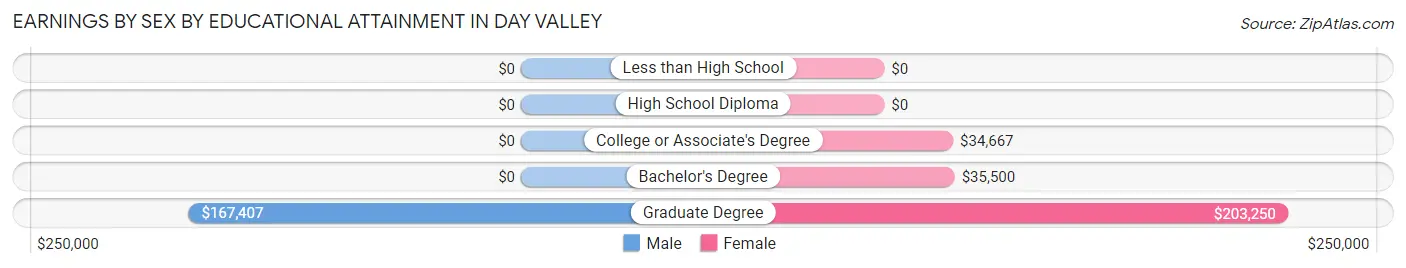
Earnings by Sex by Educational Attainment in Day Valley
Average earnings in Day Valley are $113,145 for men and $37,112 for women, a difference of 67.2%. Men with an educational attainment of graduate degree enjoy the highest average annual earnings of $167,407, while those with graduate degree education earn the least with $167,407. Women with an educational attainment of graduate degree earn the most with the average annual earnings of $203,250, while those with college or associate's degree education have the smallest earnings of $34,667.
| Educational Attainment | Male Income | Female Income |
| Less than High School | - | - |
| High School Diploma | - | - |
| College or Associate's Degree | - | - |
| Bachelor's Degree | - | - |
| Graduate Degree | $167,407 | $203,250 |
| Total | $113,145 | $37,112 |
Family Income in Day Valley
Family Income Brackets in Day Valley
According to the Day Valley family income data, there are 353 families falling into the $200,000+ income range, which is the most common income bracket and makes up 39.2% of all families.
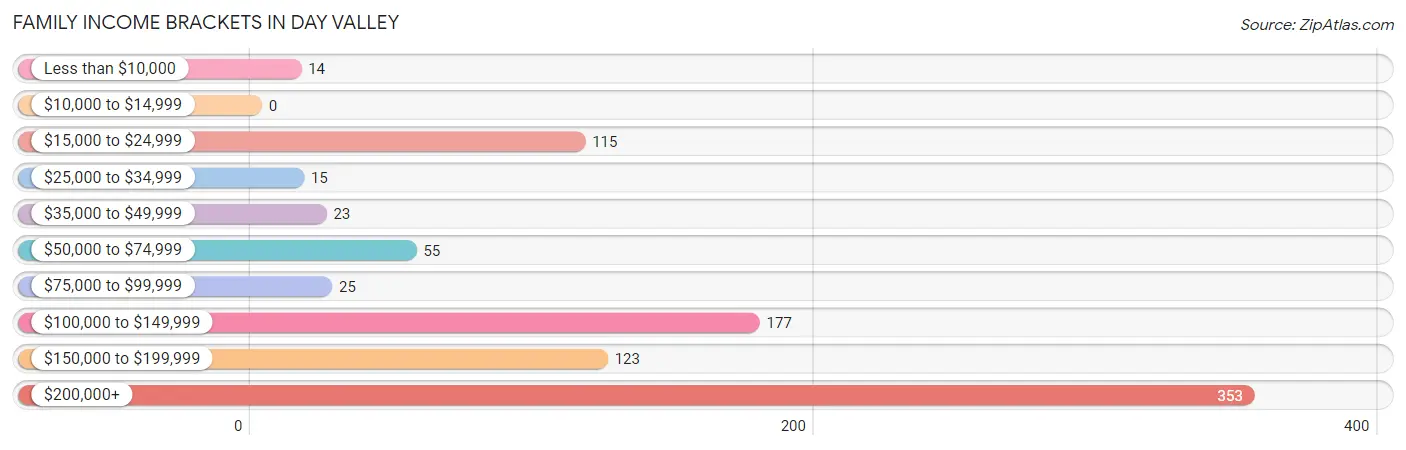
| Income Bracket | # Families | % Families |
| Less than $10,000 | 14 | 1.6% |
| $10,000 to $14,999 | 0 | 0.0% |
| $15,000 to $24,999 | 115 | 12.8% |
| $25,000 to $34,999 | 15 | 1.7% |
| $35,000 to $49,999 | 23 | 2.6% |
| $50,000 to $74,999 | 55 | 6.1% |
| $75,000 to $99,999 | 25 | 2.8% |
| $100,000 to $149,999 | 177 | 19.7% |
| $150,000 to $199,999 | 123 | 13.7% |
| $200,000+ | 353 | 39.2% |
Family Income by Famaliy Size in Day Valley
3-person families (138 | 15.3%) account for the highest median family income in Day Valley with $223,500 per family, while 3-person families (138 | 15.3%) have the highest median income of $74,500 per family member.
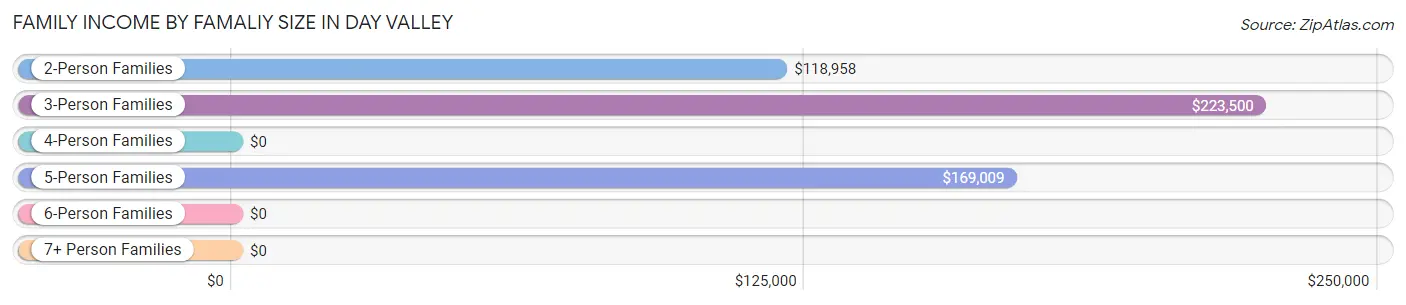
| Income Bracket | # Families | Median Income |
| 2-Person Families | 507 (56.3%) | $118,958 |
| 3-Person Families | 138 (15.3%) | $223,500 |
| 4-Person Families | 130 (14.4%) | $0 |
| 5-Person Families | 88 (9.8%) | $169,009 |
| 6-Person Families | 29 (3.2%) | $0 |
| 7+ Person Families | 8 (0.9%) | $0 |
| Total | 900 (100.0%) | $163,625 |
Family Income by Number of Earners in Day Valley
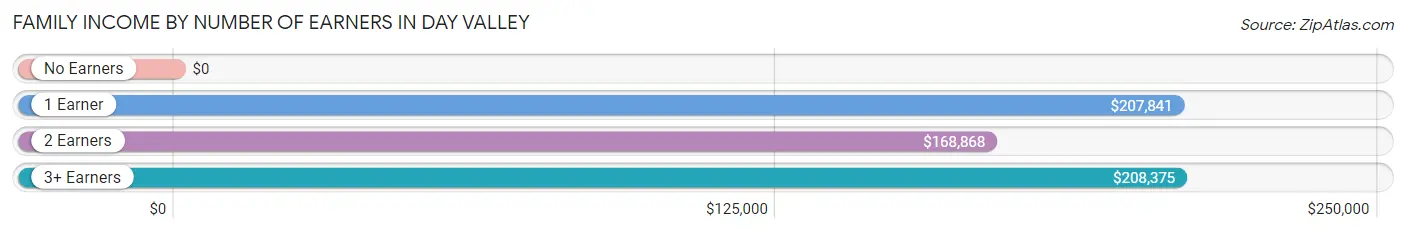
| Number of Earners | # Families | Median Income |
| No Earners | 280 (31.1%) | $0 |
| 1 Earner | 261 (29.0%) | $207,841 |
| 2 Earners | 282 (31.3%) | $168,868 |
| 3+ Earners | 77 (8.6%) | $208,375 |
| Total | 900 (100.0%) | $163,625 |
Household Income in Day Valley
Household Income Brackets in Day Valley
With 400 households falling in the category, the $200,000+ income range is the most frequent in Day Valley, accounting for 32.3% of all households. In contrast, only 17 households (1.4%) fall into the $10,000 to $14,999 income bracket, making it the least populous group.
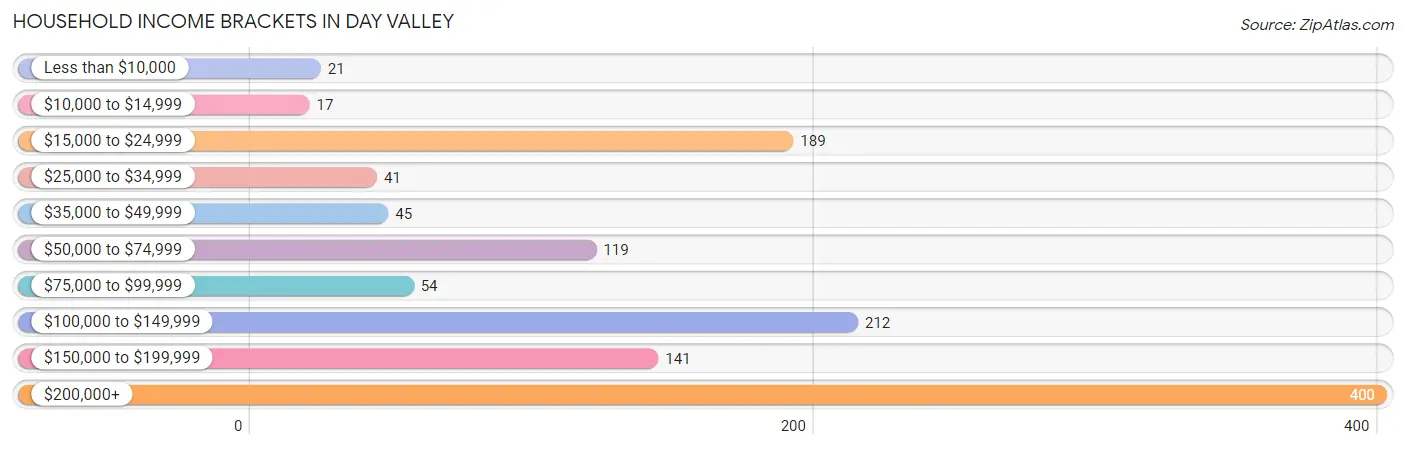
| Income Bracket | # Households | % Households |
| Less than $10,000 | 21 | 1.7% |
| $10,000 to $14,999 | 17 | 1.4% |
| $15,000 to $24,999 | 189 | 15.3% |
| $25,000 to $34,999 | 41 | 3.3% |
| $35,000 to $49,999 | 45 | 3.6% |
| $50,000 to $74,999 | 119 | 9.6% |
| $75,000 to $99,999 | 54 | 4.4% |
| $100,000 to $149,999 | 212 | 17.1% |
| $150,000 to $199,999 | 141 | 11.4% |
| $200,000+ | 400 | 32.3% |
Household Income by Householder Age in Day Valley
The median household income in Day Valley is $143,295, with the highest median household income of $174,625 found in the 45 to 64 years age bracket for the primary householder. A total of 459 households (37.1%) fall into this category.
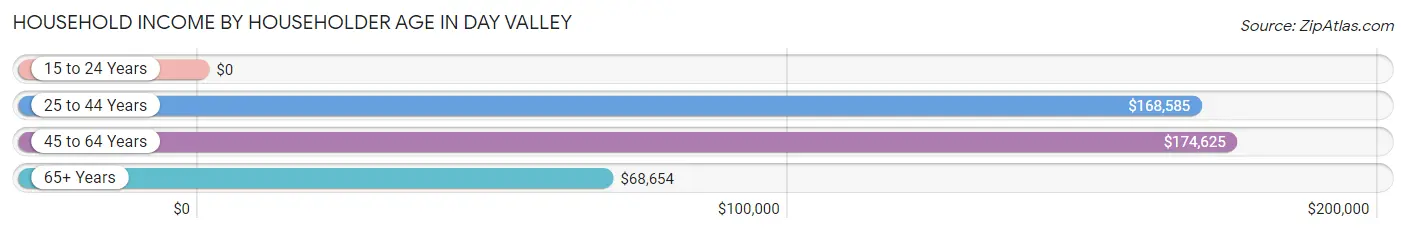
| Income Bracket | # Households | Median Income |
| 15 to 24 Years | 0 (0.0%) | $0 |
| 25 to 44 Years | 158 (12.8%) | $168,585 |
| 45 to 64 Years | 459 (37.1%) | $174,625 |
| 65+ Years | 620 (50.1%) | $68,654 |
| Total | 1,237 (100.0%) | $143,295 |
Poverty in Day Valley
Income Below Poverty by Sex and Age in Day Valley
With 3.2% poverty level for males and 6.2% for females among the residents of Day Valley, 25 to 34 year old males and 18 to 24 year old females are the most vulnerable to poverty, with 15 males (12.7%) and 10 females (22.7%) in their respective age groups living below the poverty level.
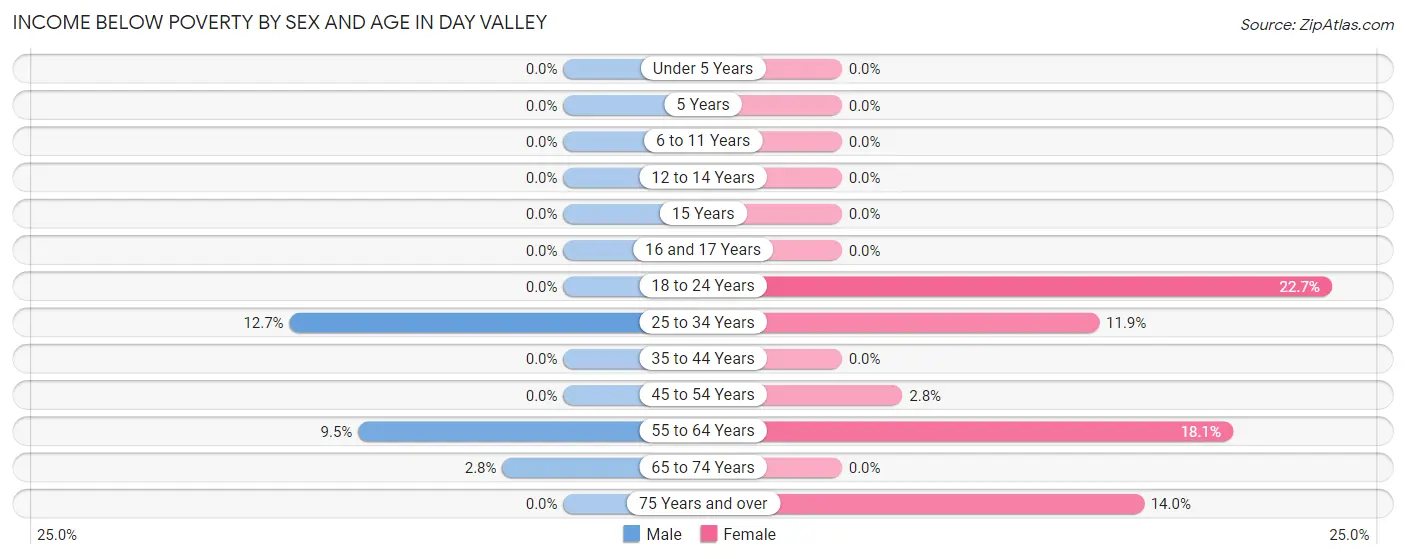
| Age Bracket | Male | Female |
| Under 5 Years | 0 (0.0%) | 0 (0.0%) |
| 5 Years | 0 (0.0%) | 0 (0.0%) |
| 6 to 11 Years | 0 (0.0%) | 0 (0.0%) |
| 12 to 14 Years | 0 (0.0%) | 0 (0.0%) |
| 15 Years | 0 (0.0%) | 0 (0.0%) |
| 16 and 17 Years | 0 (0.0%) | 0 (0.0%) |
| 18 to 24 Years | 0 (0.0%) | 10 (22.7%) |
| 25 to 34 Years | 15 (12.7%) | 16 (11.9%) |
| 35 to 44 Years | 0 (0.0%) | 0 (0.0%) |
| 45 to 54 Years | 0 (0.0%) | 5 (2.8%) |
| 55 to 64 Years | 26 (9.5%) | 41 (18.1%) |
| 65 to 74 Years | 7 (2.8%) | 0 (0.0%) |
| 75 Years and over | 0 (0.0%) | 36 (14.0%) |
| Total | 48 (3.2%) | 108 (6.2%) |
Income Above Poverty by Sex and Age in Day Valley
According to the poverty statistics in Day Valley, males aged under 5 years and females aged under 5 years are the age groups that are most secure financially, with 100.0% of males and 100.0% of females in these age groups living above the poverty line.
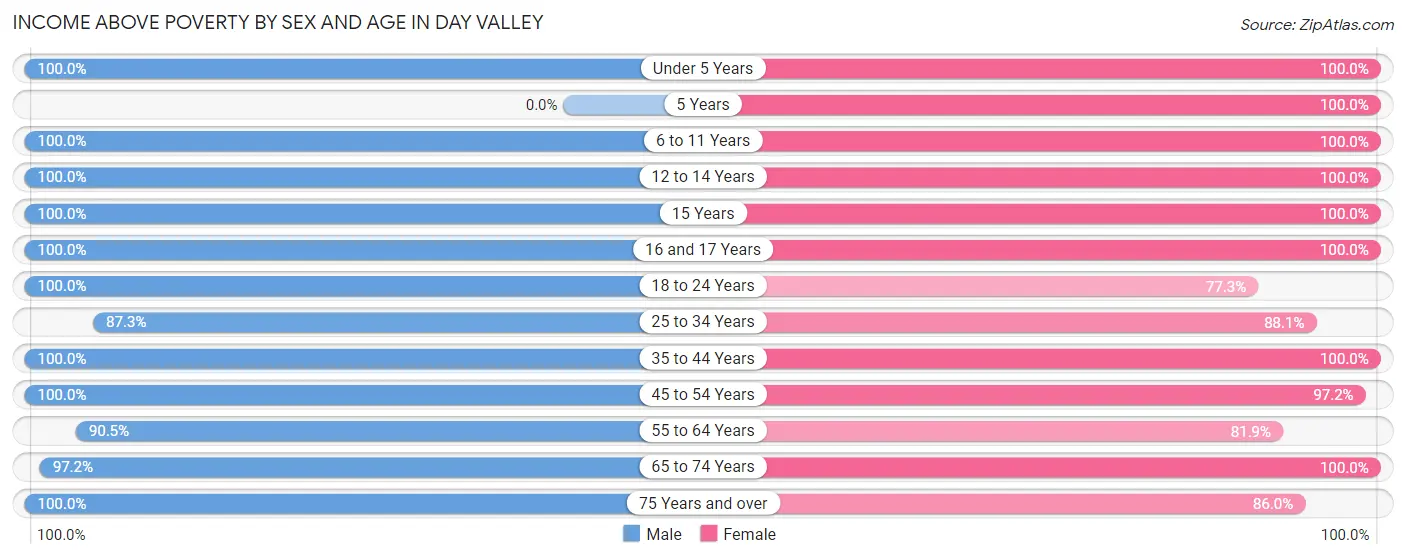
| Age Bracket | Male | Female |
| Under 5 Years | 53 (100.0%) | 56 (100.0%) |
| 5 Years | 0 (0.0%) | 43 (100.0%) |
| 6 to 11 Years | 40 (100.0%) | 140 (100.0%) |
| 12 to 14 Years | 111 (100.0%) | 65 (100.0%) |
| 15 Years | 62 (100.0%) | 17 (100.0%) |
| 16 and 17 Years | 9 (100.0%) | 19 (100.0%) |
| 18 to 24 Years | 27 (100.0%) | 34 (77.3%) |
| 25 to 34 Years | 103 (87.3%) | 118 (88.1%) |
| 35 to 44 Years | 131 (100.0%) | 222 (100.0%) |
| 45 to 54 Years | 159 (100.0%) | 173 (97.2%) |
| 55 to 64 Years | 247 (90.5%) | 185 (81.9%) |
| 65 to 74 Years | 240 (97.2%) | 352 (100.0%) |
| 75 Years and over | 253 (100.0%) | 221 (86.0%) |
| Total | 1,435 (96.8%) | 1,645 (93.8%) |
Income Below Poverty Among Married-Couple Families in Day Valley
The poverty statistics for married-couple families in Day Valley show that 0.9% or 7 of the total 755 families live below the poverty line. Families with no children have the highest poverty rate of 1.4%, comprising of 7 families. On the other hand, families with 1 or 2 children have the lowest poverty rate of 0.0%, which includes 0 families.
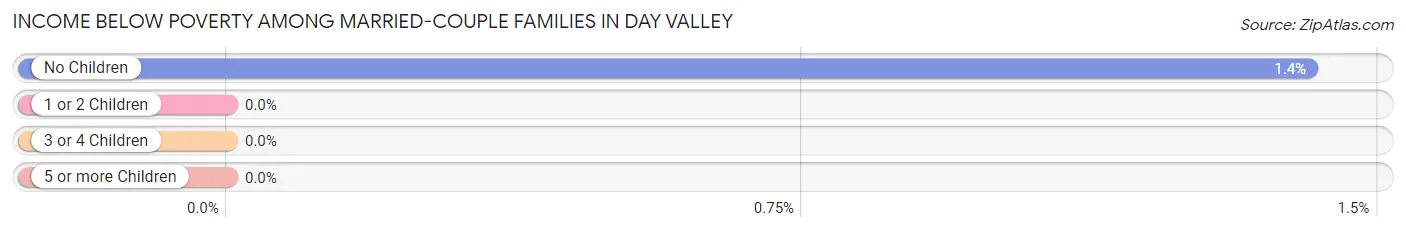
| Children | Above Poverty | Below Poverty |
| No Children | 489 (98.6%) | 7 (1.4%) |
| 1 or 2 Children | 175 (100.0%) | 0 (0.0%) |
| 3 or 4 Children | 84 (100.0%) | 0 (0.0%) |
| 5 or more Children | 0 (0.0%) | 0 (0.0%) |
| Total | 748 (99.1%) | 7 (0.9%) |
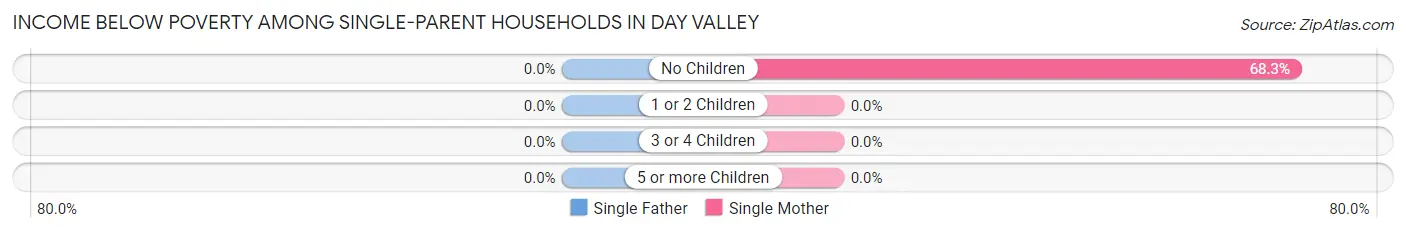
Income Below Poverty Among Single-Parent Households in Day Valley
| Children | Single Father | Single Mother |
| No Children | 0 (0.0%) | 43 (68.2%) |
| 1 or 2 Children | 0 (0.0%) | 0 (0.0%) |
| 3 or 4 Children | 0 (0.0%) | 0 (0.0%) |
| 5 or more Children | 0 (0.0%) | 0 (0.0%) |
| Total | 0 (0.0%) | 43 (44.8%) |
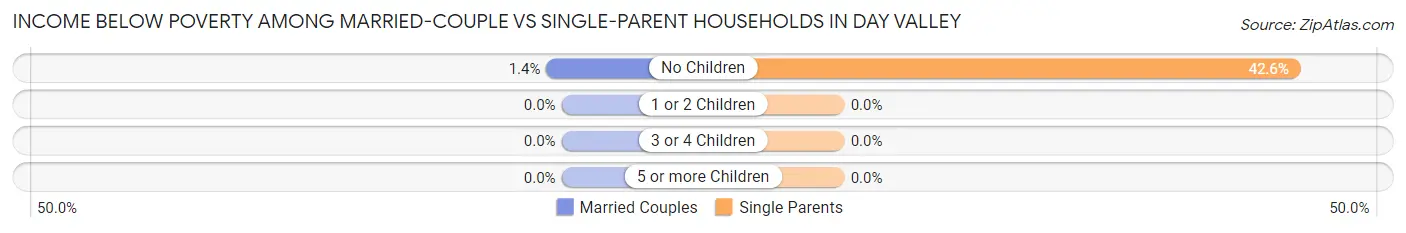
Income Below Poverty Among Married-Couple vs Single-Parent Households in Day Valley
The poverty data for Day Valley shows that 7 of the married-couple family households (0.9%) and 43 of the single-parent households (29.7%) are living below the poverty level. Within the married-couple family households, those with no children have the highest poverty rate, with 7 households (1.4%) falling below the poverty line. Among the single-parent households, those with no children have the highest poverty rate, with 43 household (42.6%) living below poverty.
| Children | Married-Couple Families | Single-Parent Households |
| No Children | 7 (1.4%) | 43 (42.6%) |
| 1 or 2 Children | 0 (0.0%) | 0 (0.0%) |
| 3 or 4 Children | 0 (0.0%) | 0 (0.0%) |
| 5 or more Children | 0 (0.0%) | 0 (0.0%) |
| Total | 7 (0.9%) | 43 (29.7%) |
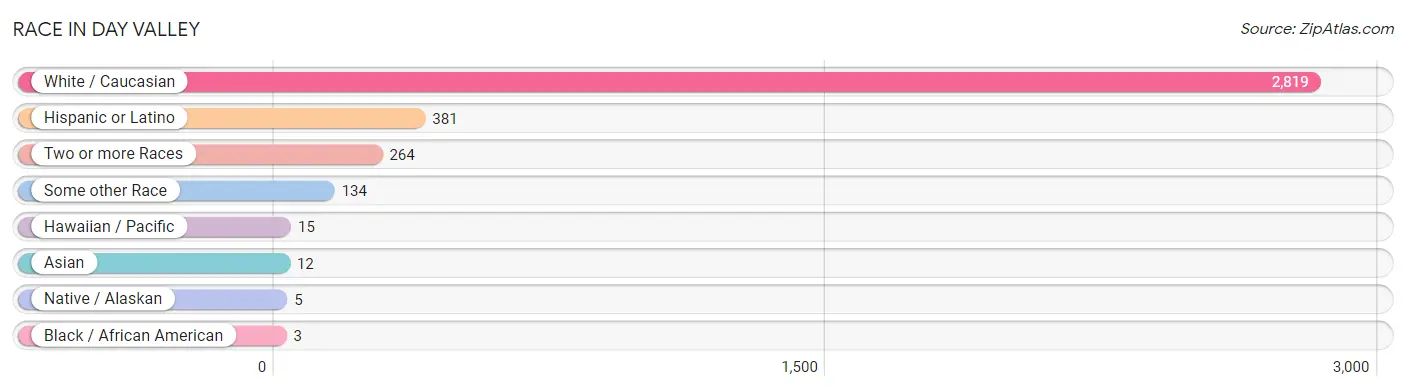
Race in Day Valley
The most populous races in Day Valley are White / Caucasian (2,819 | 86.7%), Hispanic or Latino (381 | 11.7%), and Two or more Races (264 | 8.1%).
| Race | # Population | % Population |
| Asian | 12 | 0.4% |
| Black / African American | 3 | 0.1% |
| Hawaiian / Pacific | 15 | 0.5% |
| Hispanic or Latino | 381 | 11.7% |
| Native / Alaskan | 5 | 0.2% |
| White / Caucasian | 2,819 | 86.7% |
| Two or more Races | 264 | 8.1% |
| Some other Race | 134 | 4.1% |
| Total | 3,252 | 100.0% |
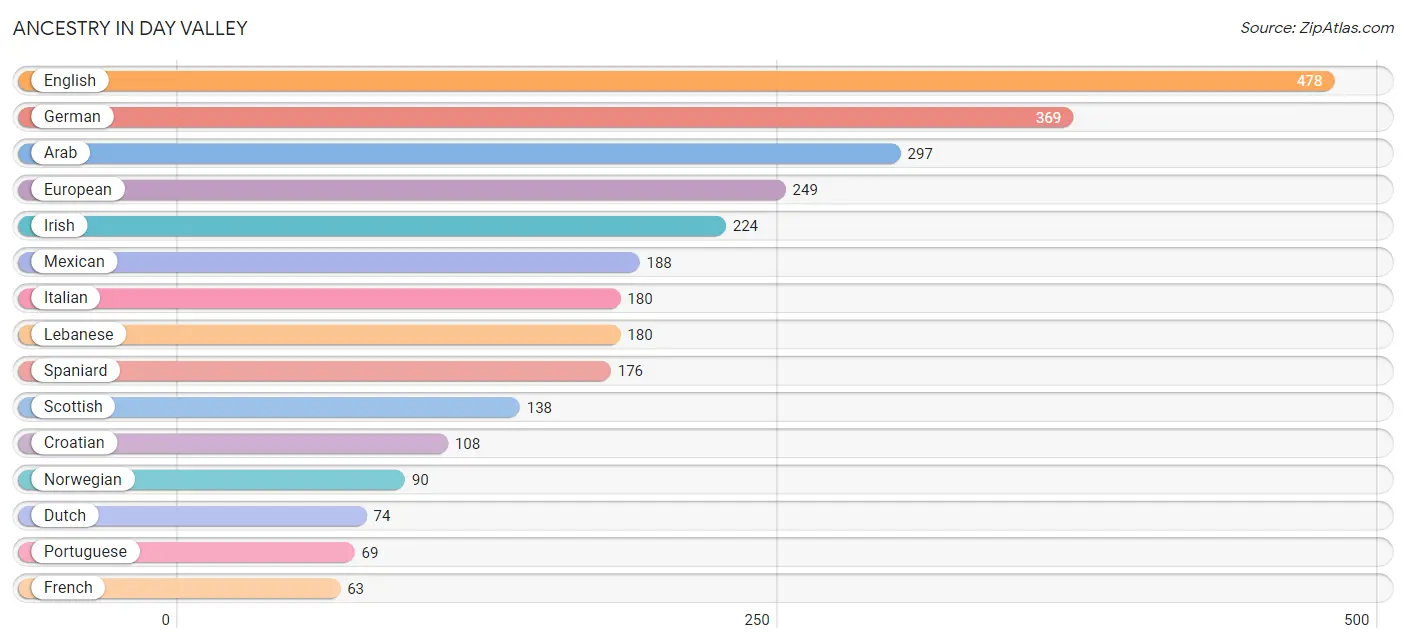
Ancestry in Day Valley
The most populous ancestries reported in Day Valley are English (478 | 14.7%), German (369 | 11.4%), Arab (297 | 9.1%), European (249 | 7.7%), and Irish (224 | 6.9%), together accounting for 49.7% of all Day Valley residents.
| Ancestry | # Population | % Population |
| American | 50 | 1.5% |
| Arab | 297 | 9.1% |
| Barbadian | 3 | 0.1% |
| Basque | 10 | 0.3% |
| Bhutanese | 15 | 0.5% |
| British | 25 | 0.8% |
| Cherokee | 18 | 0.5% |
| Croatian | 108 | 3.3% |
| Czech | 21 | 0.6% |
| Danish | 38 | 1.2% |
| Dutch | 74 | 2.3% |
| Eastern European | 37 | 1.1% |
| English | 478 | 14.7% |
| European | 249 | 7.7% |
| Finnish | 9 | 0.3% |
| French | 63 | 1.9% |
| French Canadian | 4 | 0.1% |
| German | 369 | 11.4% |
| Greek | 19 | 0.6% |
| Hungarian | 31 | 0.9% |
| Indian (Asian) | 37 | 1.1% |
| Irish | 224 | 6.9% |
| Iroquois | 8 | 0.3% |
| Italian | 180 | 5.5% |
| Lebanese | 180 | 5.5% |
| Lithuanian | 38 | 1.2% |
| Mexican | 188 | 5.8% |
| Native Hawaiian | 51 | 1.6% |
| Northern European | 63 | 1.9% |
| Norwegian | 90 | 2.8% |
| Portuguese | 69 | 2.1% |
| Russian | 11 | 0.3% |
| Scandinavian | 9 | 0.3% |
| Scotch-Irish | 26 | 0.8% |
| Scottish | 138 | 4.2% |
| Serbian | 20 | 0.6% |
| Spaniard | 176 | 5.4% |
| Swedish | 39 | 1.2% |
| Swiss | 47 | 1.5% |
| Tongan | 17 | 0.5% |
| Ukrainian | 10 | 0.3% |
| Welsh | 10 | 0.3% | View All 42 Rows |
Immigrants in Day Valley
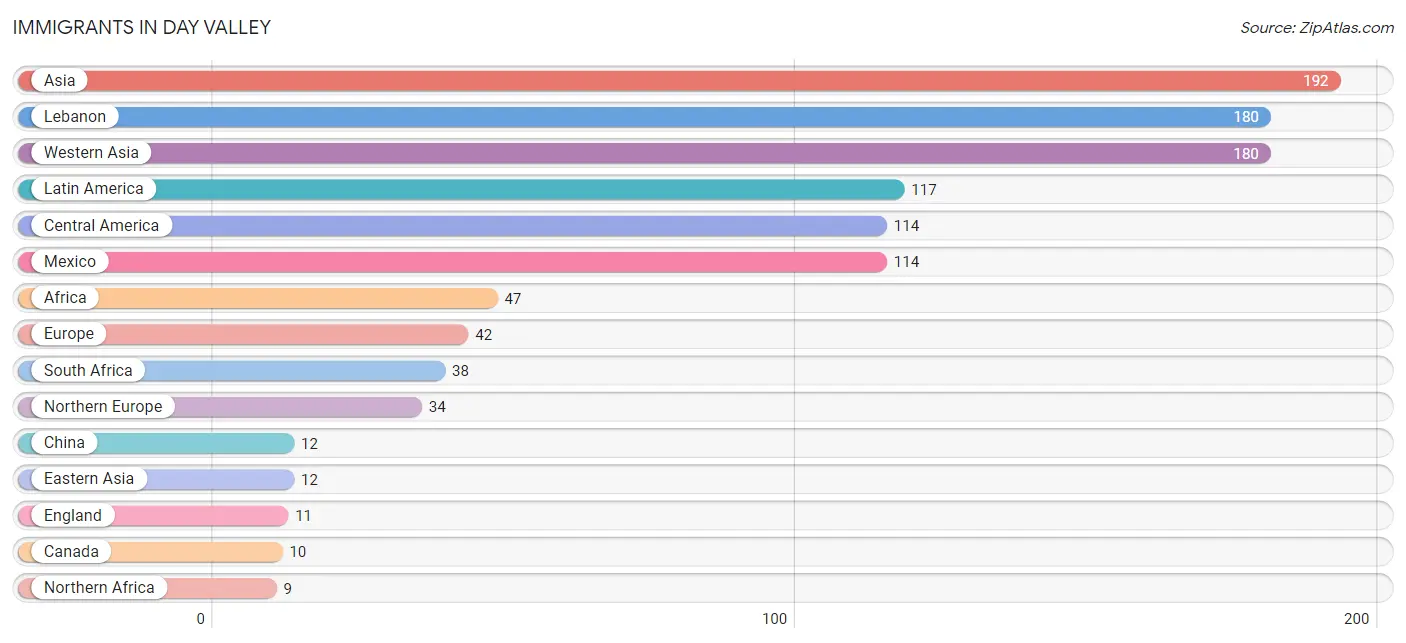
The most numerous immigrant groups reported in Day Valley came from Asia (192 | 5.9%), Lebanon (180 | 5.5%), Western Asia (180 | 5.5%), Latin America (117 | 3.6%), and Central America (114 | 3.5%), together accounting for 24.1% of all Day Valley residents.
| Immigration Origin | # Population | % Population |
| Africa | 47 | 1.5% |
| Asia | 192 | 5.9% |
| Barbados | 3 | 0.1% |
| Canada | 10 | 0.3% |
| Caribbean | 3 | 0.1% |
| Central America | 114 | 3.5% |
| China | 12 | 0.4% |
| Eastern Asia | 12 | 0.4% |
| Eastern Europe | 8 | 0.3% |
| England | 11 | 0.3% |
| Europe | 42 | 1.3% |
| Latin America | 117 | 3.6% |
| Lebanon | 180 | 5.5% |
| Mexico | 114 | 3.5% |
| Northern Africa | 9 | 0.3% |
| Northern Europe | 34 | 1.1% |
| Romania | 8 | 0.3% |
| South Africa | 38 | 1.2% |
| Western Asia | 180 | 5.5% | View All 19 Rows |
Sex and Age in Day Valley
Sex and Age in Day Valley
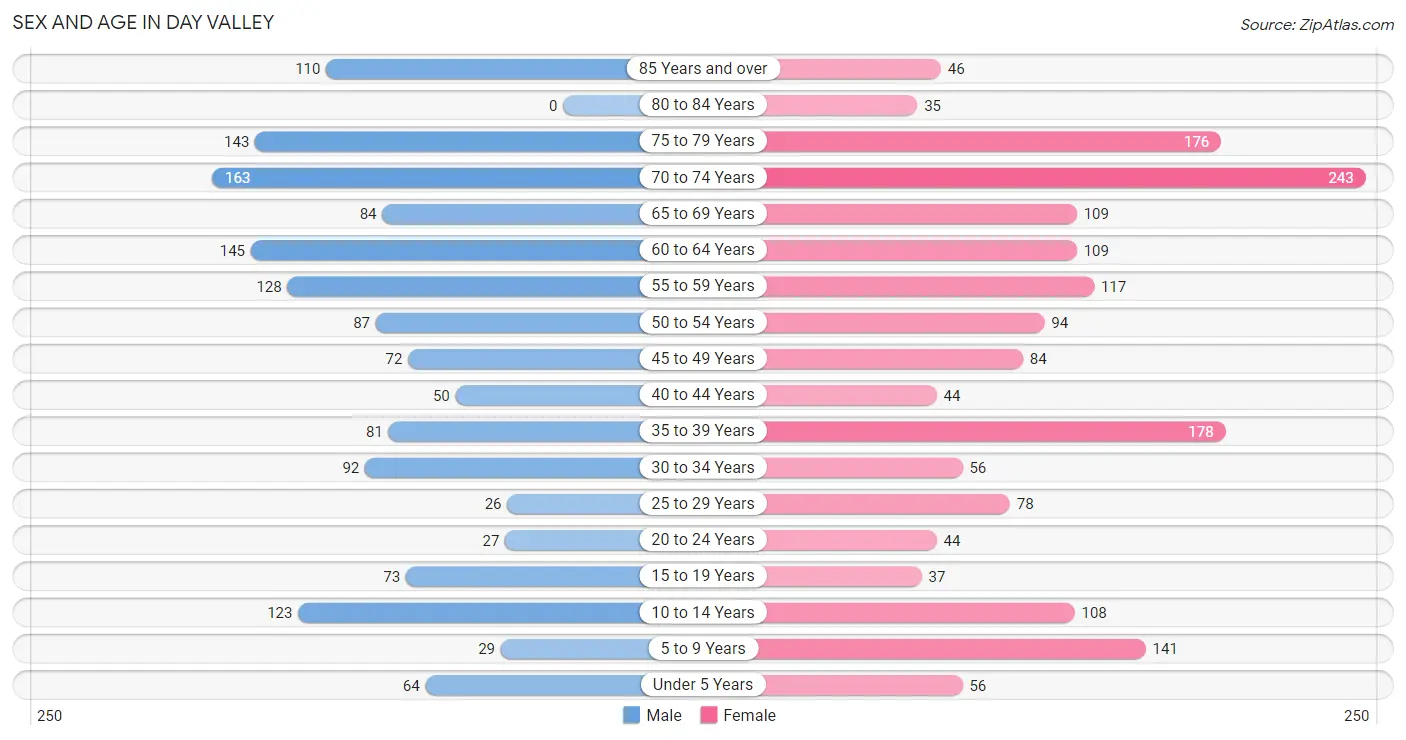
The most populous age groups in Day Valley are 70 to 74 Years (163 | 10.9%) for men and 70 to 74 Years (243 | 13.9%) for women.
| Age Bracket | Male | Female |
| Under 5 Years | 64 (4.3%) | 56 (3.2%) |
| 5 to 9 Years | 29 (1.9%) | 141 (8.0%) |
| 10 to 14 Years | 123 (8.2%) | 108 (6.1%) |
| 15 to 19 Years | 73 (4.9%) | 37 (2.1%) |
| 20 to 24 Years | 27 (1.8%) | 44 (2.5%) |
| 25 to 29 Years | 26 (1.7%) | 78 (4.4%) |
| 30 to 34 Years | 92 (6.1%) | 56 (3.2%) |
| 35 to 39 Years | 81 (5.4%) | 178 (10.1%) |
| 40 to 44 Years | 50 (3.3%) | 44 (2.5%) |
| 45 to 49 Years | 72 (4.8%) | 84 (4.8%) |
| 50 to 54 Years | 87 (5.8%) | 94 (5.4%) |
| 55 to 59 Years | 128 (8.6%) | 117 (6.7%) |
| 60 to 64 Years | 145 (9.7%) | 109 (6.2%) |
| 65 to 69 Years | 84 (5.6%) | 109 (6.2%) |
| 70 to 74 Years | 163 (10.9%) | 243 (13.9%) |
| 75 to 79 Years | 143 (9.6%) | 176 (10.0%) |
| 80 to 84 Years | 0 (0.0%) | 35 (2.0%) |
| 85 Years and over | 110 (7.3%) | 46 (2.6%) |
| Total | 1,497 (100.0%) | 1,755 (100.0%) |
Families and Households in Day Valley
Median Family Size in Day Valley
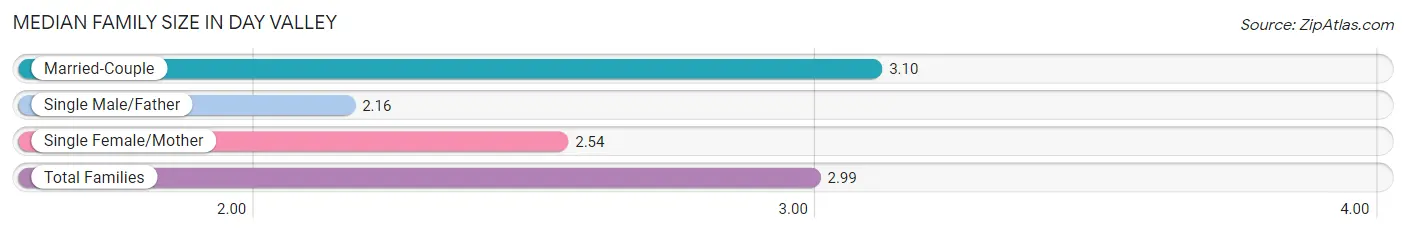
The median family size in Day Valley is 2.99 persons per family, with married-couple families (755 | 83.9%) accounting for the largest median family size of 3.1 persons per family. On the other hand, single male/father families (49 | 5.4%) represent the smallest median family size with 2.16 persons per family.
| Family Type | # Families | Family Size |
| Married-Couple | 755 (83.9%) | 3.10 |
| Single Male/Father | 49 (5.4%) | 2.16 |
| Single Female/Mother | 96 (10.7%) | 2.54 |
| Total Families | 900 (100.0%) | 2.99 |
Median Household Size in Day Valley
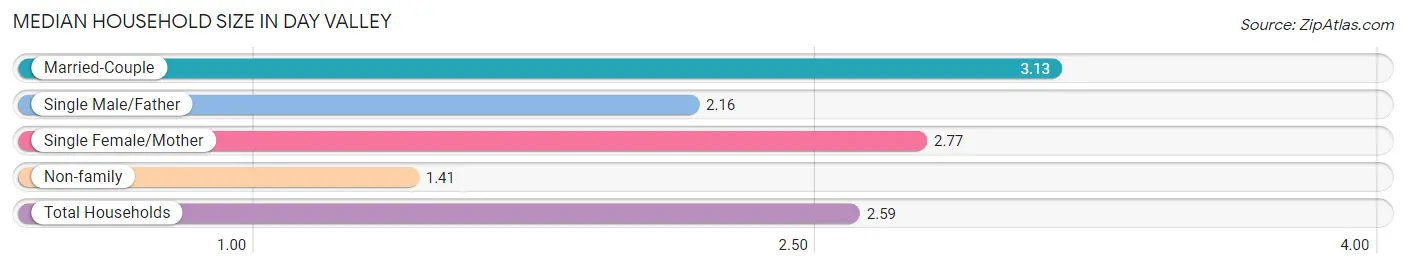
The median household size in Day Valley is 2.59 persons per household, with married-couple households (755 | 61.0%) accounting for the largest median household size of 3.13 persons per household. non-family households (337 | 27.2%) represent the smallest median household size with 1.41 persons per household.
| Household Type | # Households | Household Size |
| Married-Couple | 755 (61.0%) | 3.13 |
| Single Male/Father | 49 (4.0%) | 2.16 |
| Single Female/Mother | 96 (7.8%) | 2.77 |
| Non-family | 337 (27.2%) | 1.41 |
| Total Households | 1,237 (100.0%) | 2.59 |
Household Size by Marriage Status in Day Valley
Out of a total of 1,237 households in Day Valley, 900 (72.8%) are family households, while 337 (27.2%) are nonfamily households. The most numerous type of family households are 2-person households, comprising 507, and the most common type of nonfamily households are 1-person households, comprising 250.
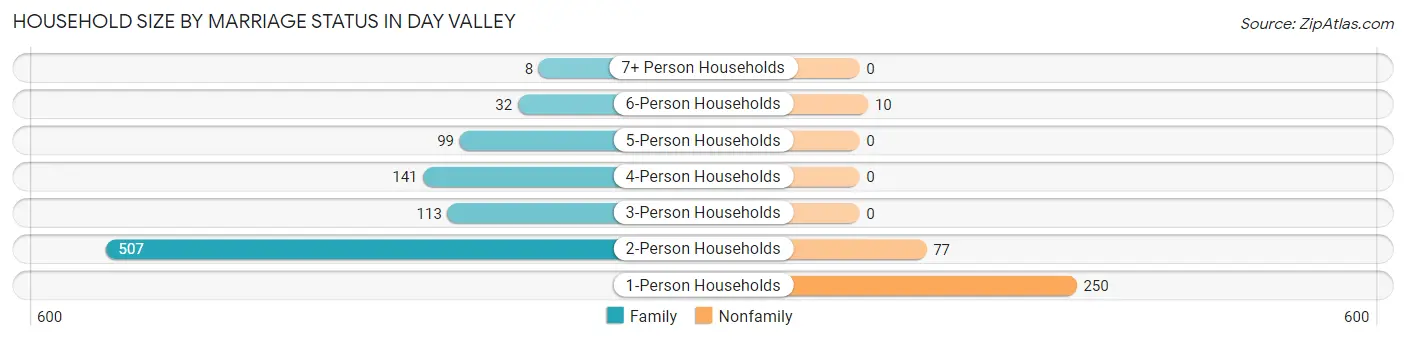
| Household Size | Family Households | Nonfamily Households |
| 1-Person Households | - | 250 (20.2%) |
| 2-Person Households | 507 (41.0%) | 77 (6.2%) |
| 3-Person Households | 113 (9.1%) | 0 (0.0%) |
| 4-Person Households | 141 (11.4%) | 0 (0.0%) |
| 5-Person Households | 99 (8.0%) | 0 (0.0%) |
| 6-Person Households | 32 (2.6%) | 10 (0.8%) |
| 7+ Person Households | 8 (0.6%) | 0 (0.0%) |
| Total | 900 (72.8%) | 337 (27.2%) |
Female Fertility in Day Valley
Fertility by Age in Day Valley
Average fertility rate in Day Valley is 31.0 births per 1,000 women. Women in the age bracket of 35 to 50 years have the highest fertility rate with 51.0 births per 1,000 women. Women in the age bracket of 35 to 50 years acount for 100.0% of all women with births.
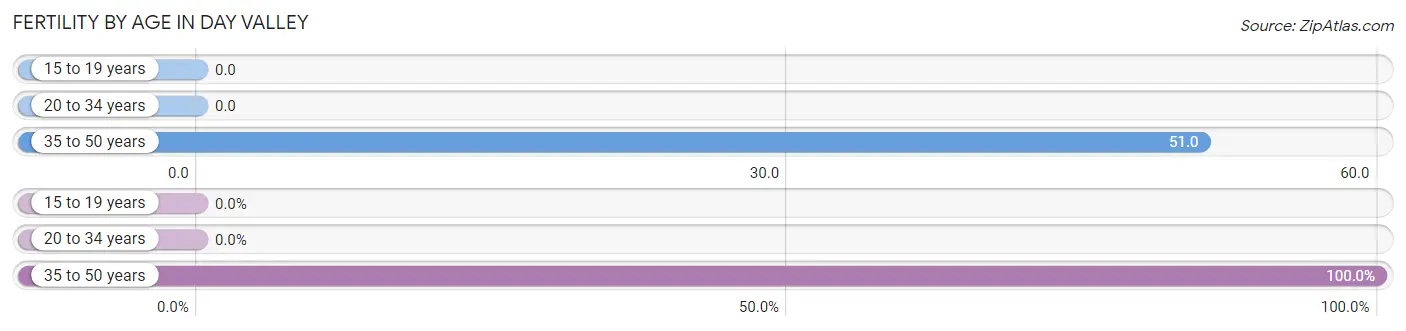
| Age Bracket | Women with Births | Births / 1,000 Women |
| 15 to 19 years | 0 (0.0%) | 0.0 |
| 20 to 34 years | 0 (0.0%) | 0.0 |
| 35 to 50 years | 17 (100.0%) | 51.0 |
| Total | 17 (100.0%) | 31.0 |
Fertility by Age by Marriage Status in Day Valley
35.3% of women with births (17) in Day Valley are married. The highest percentage of unmarried women with births falls into 35 to 50 years age bracket with 64.7% of them unmarried at the time of birth, while the lowest percentage of unmarried women with births belong to 35 to 50 years age bracket with 64.7% of them unmarried.
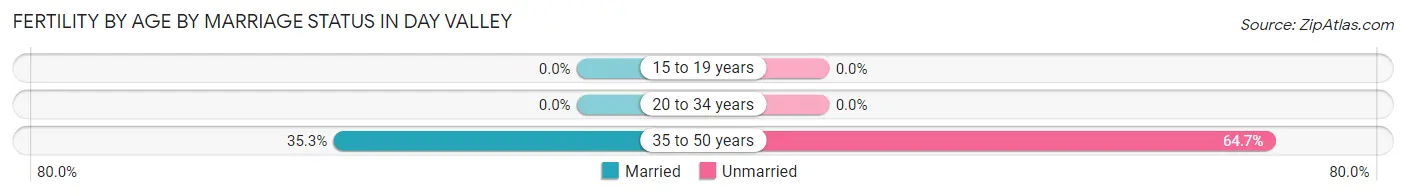
| Age Bracket | Married | Unmarried |
| 15 to 19 years | 0 (0.0%) | 0 (0.0%) |
| 20 to 34 years | 0 (0.0%) | 0 (0.0%) |
| 35 to 50 years | 6 (35.3%) | 11 (64.7%) |
| Total | 6 (35.3%) | 11 (64.7%) |
Fertility by Education in Day Valley
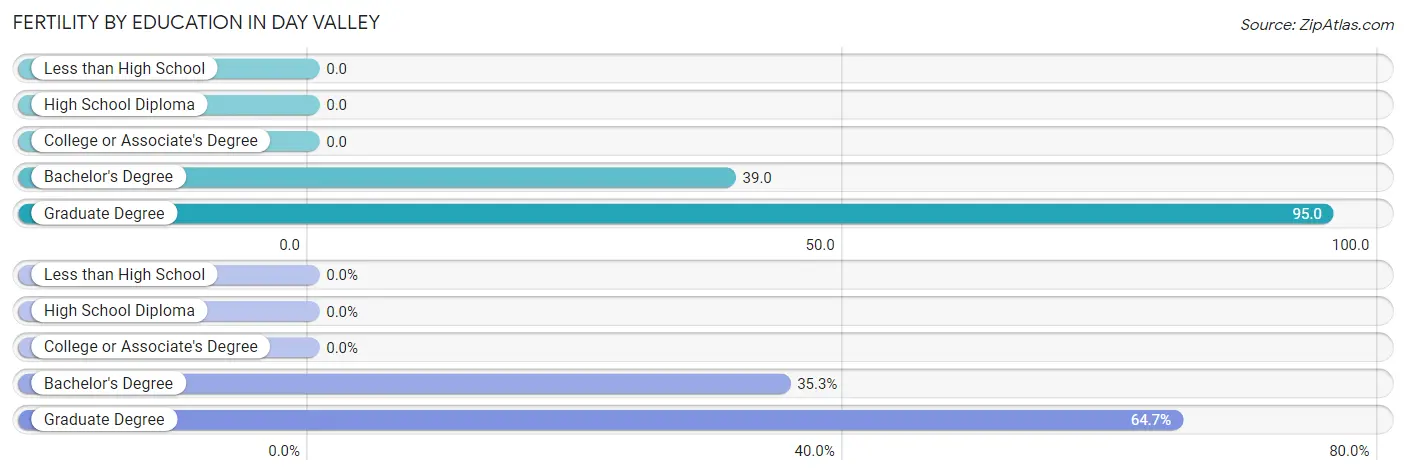
| Educational Attainment | Women with Births | Births / 1,000 Women |
| Less than High School | 0 (0.0%) | 0.0 |
| High School Diploma | 0 (0.0%) | 0.0 |
| College or Associate's Degree | 0 (0.0%) | 0.0 |
| Bachelor's Degree | 6 (35.3%) | 39.0 |
| Graduate Degree | 11 (64.7%) | 95.0 |
| Total | 17 (100.0%) | 31.0 |
Fertility by Education by Marriage Status in Day Valley
64.7% of women with births in Day Valley are unmarried. Women with the educational attainment of bachelor's degree are most likely to be married with 100.0% of them married at childbirth, while women with the educational attainment of graduate degree are least likely to be married with 100.0% of them unmarried at childbirth.
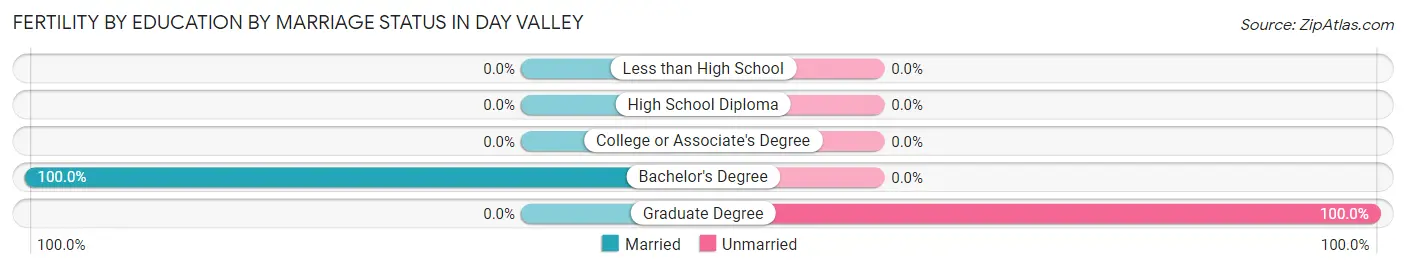
| Educational Attainment | Married | Unmarried |
| Less than High School | 0 (0.0%) | 0 (0.0%) |
| High School Diploma | 0 (0.0%) | 0 (0.0%) |
| College or Associate's Degree | 0 (0.0%) | 0 (0.0%) |
| Bachelor's Degree | 6 (100.0%) | 0 (0.0%) |
| Graduate Degree | 0 (0.0%) | 11 (100.0%) |
| Total | 6 (35.3%) | 11 (64.7%) |
Employment Characteristics in Day Valley
Employment by Class of Employer in Day Valley
Among the 1,292 employed individuals in Day Valley, private company employees (613 | 47.4%), self-employed (not incorporated) (300 | 23.2%), and local government employees (112 | 8.7%) make up the most common classes of employment.
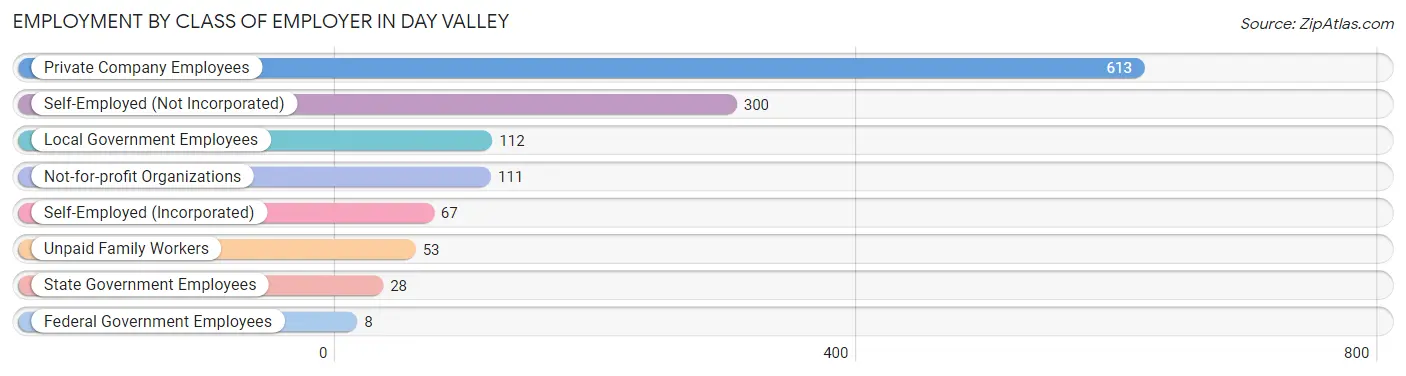
| Employer Class | # Employees | % Employees |
| Private Company Employees | 613 | 47.4% |
| Self-Employed (Incorporated) | 67 | 5.2% |
| Self-Employed (Not Incorporated) | 300 | 23.2% |
| Not-for-profit Organizations | 111 | 8.6% |
| Local Government Employees | 112 | 8.7% |
| State Government Employees | 28 | 2.2% |
| Federal Government Employees | 8 | 0.6% |
| Unpaid Family Workers | 53 | 4.1% |
| Total | 1,292 | 100.0% |
Employment Status by Age in Day Valley
According to the labor force statistics for Day Valley, out of the total population over 16 years of age (2,651), 51.4% or 1,363 individuals are in the labor force, with 4.5% or 61 of them unemployed. The age group with the highest labor force participation rate is 20 to 24 years, with 100.0% or 71 individuals in the labor force. Within the labor force, the 16 to 19 years age range has the highest percentage of unemployed individuals, with 100.0% or 19 of them being unemployed.
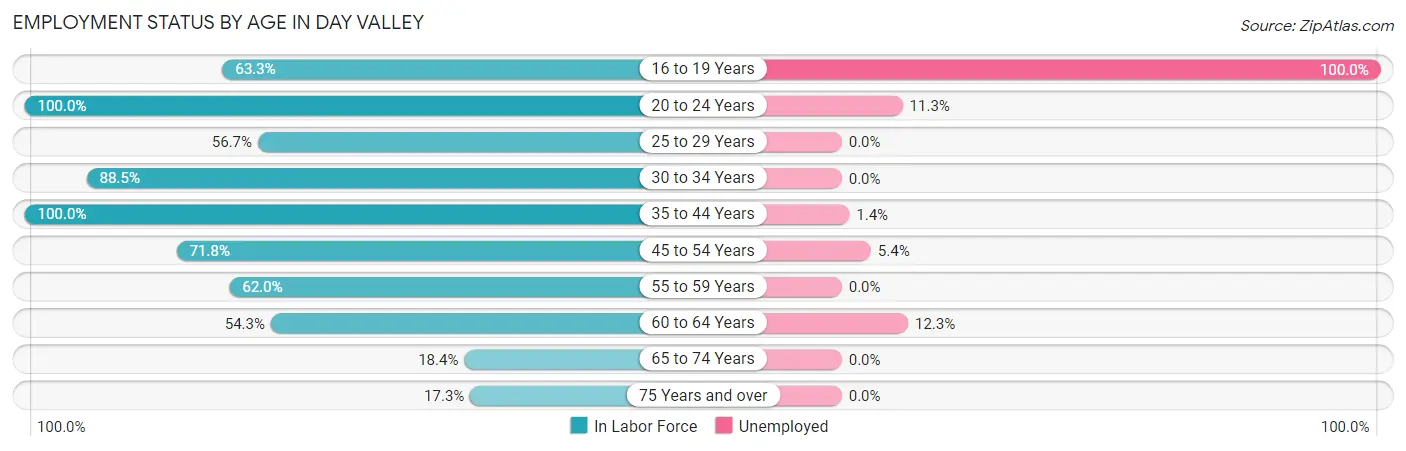
| Age Bracket | In Labor Force | Unemployed |
| 16 to 19 Years | 19 (63.3%) | 19 (100.0%) |
| 20 to 24 Years | 71 (100.0%) | 8 (11.3%) |
| 25 to 29 Years | 59 (56.7%) | 0 (0.0%) |
| 30 to 34 Years | 131 (88.5%) | 0 (0.0%) |
| 35 to 44 Years | 353 (100.0%) | 5 (1.4%) |
| 45 to 54 Years | 242 (71.8%) | 13 (5.4%) |
| 55 to 59 Years | 152 (62.0%) | 0 (0.0%) |
| 60 to 64 Years | 138 (54.3%) | 17 (12.3%) |
| 65 to 74 Years | 110 (18.4%) | 0 (0.0%) |
| 75 Years and over | 88 (17.3%) | 0 (0.0%) |
| Total | 1,363 (51.4%) | 61 (4.5%) |
Employment Status by Educational Attainment in Day Valley
According to labor force statistics for Day Valley, 74.6% of individuals (1,075) out of the total population between 25 and 64 years of age (1,441) are in the labor force, with 3.3% or 35 of them being unemployed. The group with the highest labor force participation rate are those with the educational attainment of bachelor's degree or higher, with 81.2% or 612 individuals in the labor force. Within the labor force, individuals with less than high school education have the highest percentage of unemployment, with 38.6% or 17 of them being unemployed.
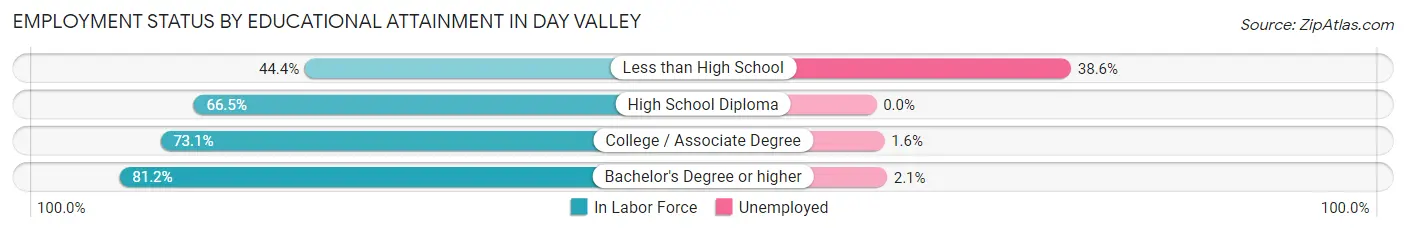
| Educational Attainment | In Labor Force | Unemployed |
| Less than High School | 44 (44.4%) | 38 (38.6%) |
| High School Diploma | 109 (66.5%) | 0 (0.0%) |
| College / Associate Degree | 310 (73.1%) | 7 (1.6%) |
| Bachelor's Degree or higher | 612 (81.2%) | 16 (2.1%) |
| Total | 1,075 (74.6%) | 48 (3.3%) |
Employment Occupations by Sex in Day Valley
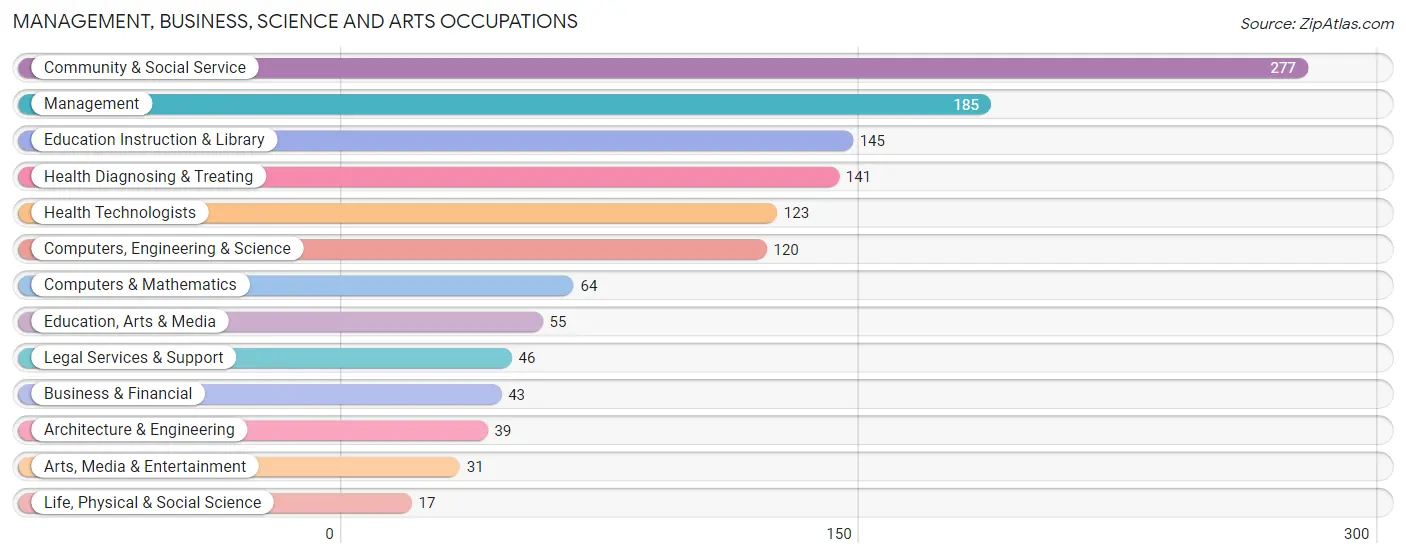
Management, Business, Science and Arts Occupations
The most common Management, Business, Science and Arts occupations in Day Valley are Community & Social Service (277 | 21.3%), Management (185 | 14.2%), Education Instruction & Library (145 | 11.2%), Health Diagnosing & Treating (141 | 10.8%), and Health Technologists (123 | 9.5%).
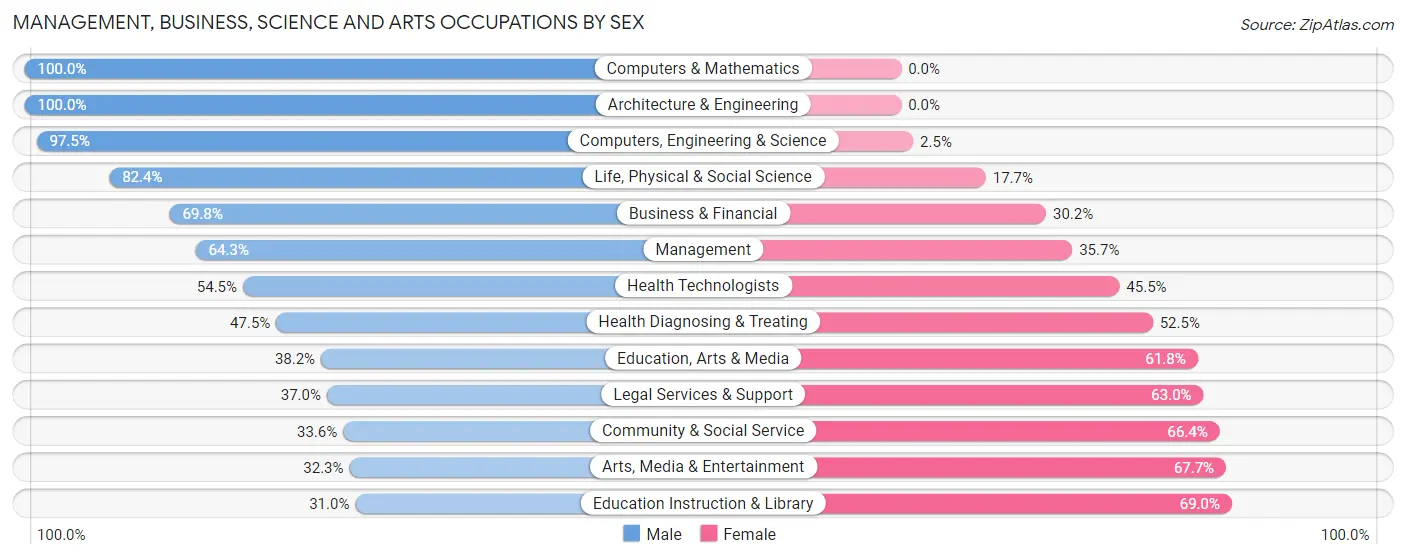
Management, Business, Science and Arts Occupations by Sex
Within the Management, Business, Science and Arts occupations in Day Valley, the most male-oriented occupations are Computers & Mathematics (100.0%), Architecture & Engineering (100.0%), and Computers, Engineering & Science (97.5%), while the most female-oriented occupations are Education Instruction & Library (69.0%), Arts, Media & Entertainment (67.7%), and Community & Social Service (66.4%).
| Occupation | Male | Female |
| Management | 119 (64.3%) | 66 (35.7%) |
| Business & Financial | 30 (69.8%) | 13 (30.2%) |
| Computers, Engineering & Science | 117 (97.5%) | 3 (2.5%) |
| Computers & Mathematics | 64 (100.0%) | 0 (0.0%) |
| Architecture & Engineering | 39 (100.0%) | 0 (0.0%) |
| Life, Physical & Social Science | 14 (82.4%) | 3 (17.6%) |
| Community & Social Service | 93 (33.6%) | 184 (66.4%) |
| Education, Arts & Media | 21 (38.2%) | 34 (61.8%) |
| Legal Services & Support | 17 (37.0%) | 29 (63.0%) |
| Education Instruction & Library | 45 (31.0%) | 100 (69.0%) |
| Arts, Media & Entertainment | 10 (32.3%) | 21 (67.7%) |
| Health Diagnosing & Treating | 67 (47.5%) | 74 (52.5%) |
| Health Technologists | 67 (54.5%) | 56 (45.5%) |
| Total (Category) | 426 (55.6%) | 340 (44.4%) |
| Total (Overall) | 705 (54.2%) | 596 (45.8%) |
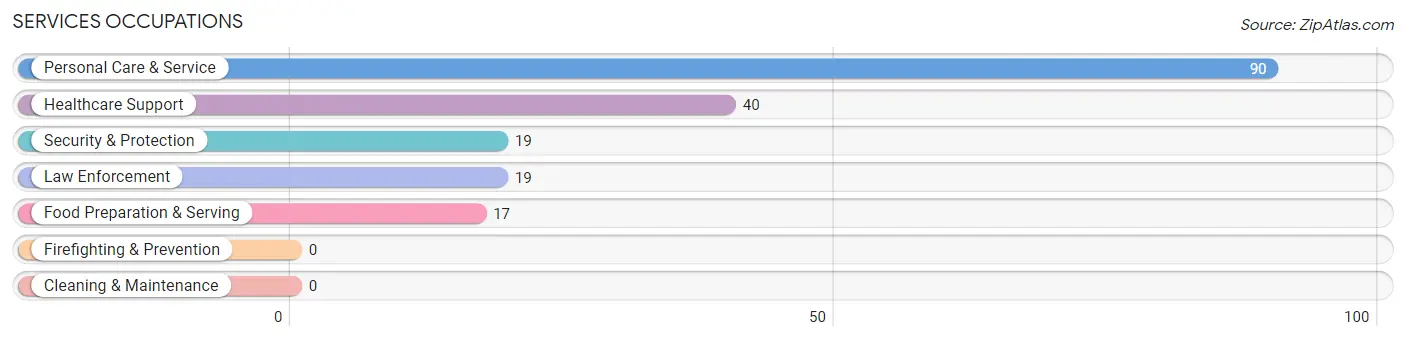
Services Occupations
The most common Services occupations in Day Valley are Personal Care & Service (90 | 6.9%), Healthcare Support (40 | 3.1%), Security & Protection (19 | 1.5%), Law Enforcement (19 | 1.5%), and Food Preparation & Serving (17 | 1.3%).
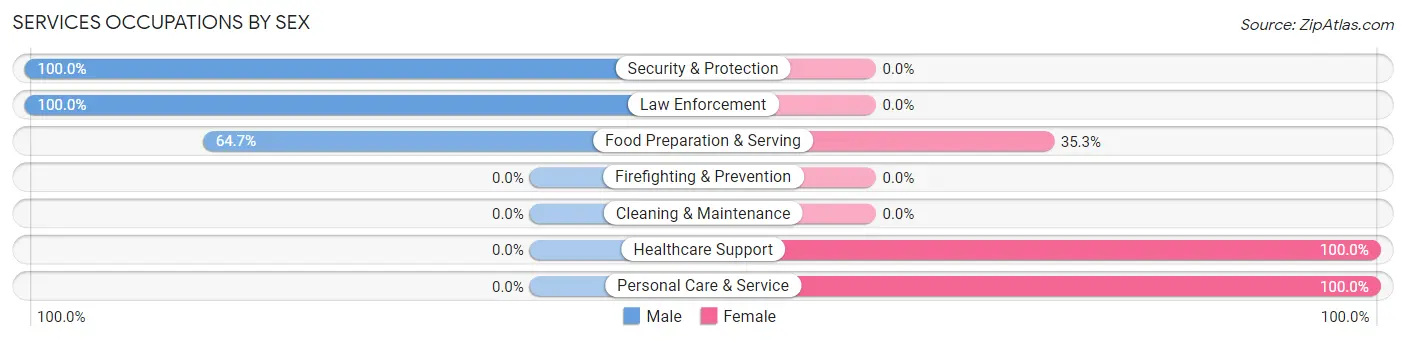
Services Occupations by Sex
Within the Services occupations in Day Valley, the most male-oriented occupations are Security & Protection (100.0%), Law Enforcement (100.0%), and Food Preparation & Serving (64.7%), while the most female-oriented occupations are Healthcare Support (100.0%), Personal Care & Service (100.0%), and Food Preparation & Serving (35.3%).
| Occupation | Male | Female |
| Healthcare Support | 0 (0.0%) | 40 (100.0%) |
| Security & Protection | 19 (100.0%) | 0 (0.0%) |
| Firefighting & Prevention | 0 (0.0%) | 0 (0.0%) |
| Law Enforcement | 19 (100.0%) | 0 (0.0%) |
| Food Preparation & Serving | 11 (64.7%) | 6 (35.3%) |
| Cleaning & Maintenance | 0 (0.0%) | 0 (0.0%) |
| Personal Care & Service | 0 (0.0%) | 90 (100.0%) |
| Total (Category) | 30 (18.1%) | 136 (81.9%) |
| Total (Overall) | 705 (54.2%) | 596 (45.8%) |
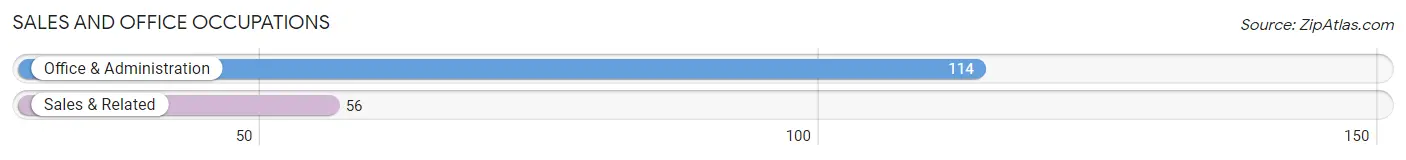
Sales and Office Occupations
The most common Sales and Office occupations in Day Valley are Office & Administration (114 | 8.8%), and Sales & Related (56 | 4.3%).
Sales and Office Occupations by Sex
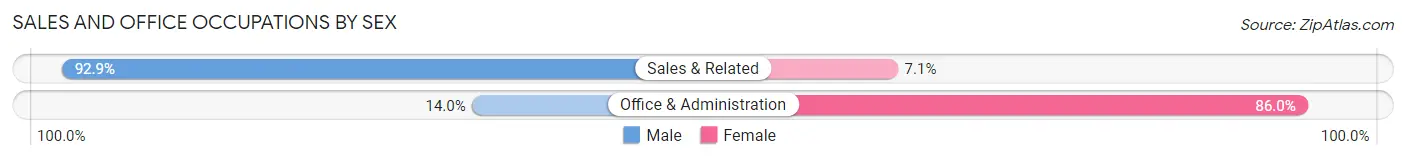
| Occupation | Male | Female |
| Sales & Related | 52 (92.9%) | 4 (7.1%) |
| Office & Administration | 16 (14.0%) | 98 (86.0%) |
| Total (Category) | 68 (40.0%) | 102 (60.0%) |
| Total (Overall) | 705 (54.2%) | 596 (45.8%) |
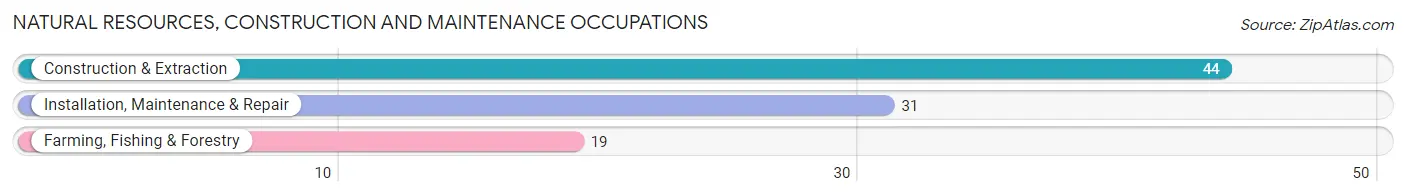
Natural Resources, Construction and Maintenance Occupations
The most common Natural Resources, Construction and Maintenance occupations in Day Valley are Construction & Extraction (44 | 3.4%), Installation, Maintenance & Repair (31 | 2.4%), and Farming, Fishing & Forestry (19 | 1.5%).
Natural Resources, Construction and Maintenance Occupations by Sex
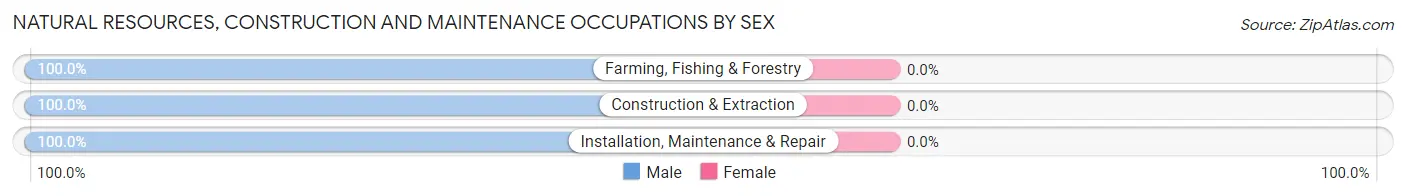
| Occupation | Male | Female |
| Farming, Fishing & Forestry | 19 (100.0%) | 0 (0.0%) |
| Construction & Extraction | 44 (100.0%) | 0 (0.0%) |
| Installation, Maintenance & Repair | 31 (100.0%) | 0 (0.0%) |
| Total (Category) | 94 (100.0%) | 0 (0.0%) |
| Total (Overall) | 705 (54.2%) | 596 (45.8%) |
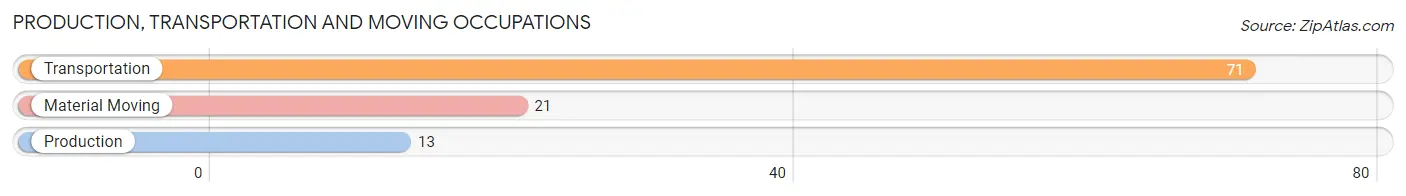
Production, Transportation and Moving Occupations
The most common Production, Transportation and Moving occupations in Day Valley are Transportation (71 | 5.5%), Material Moving (21 | 1.6%), and Production (13 | 1.0%).
Production, Transportation and Moving Occupations by Sex
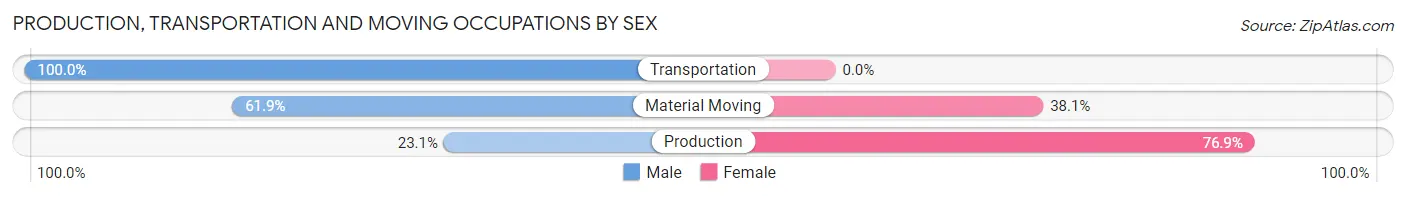
| Occupation | Male | Female |
| Production | 3 (23.1%) | 10 (76.9%) |
| Transportation | 71 (100.0%) | 0 (0.0%) |
| Material Moving | 13 (61.9%) | 8 (38.1%) |
| Total (Category) | 87 (82.9%) | 18 (17.1%) |
| Total (Overall) | 705 (54.2%) | 596 (45.8%) |
Employment Industries by Sex in Day Valley
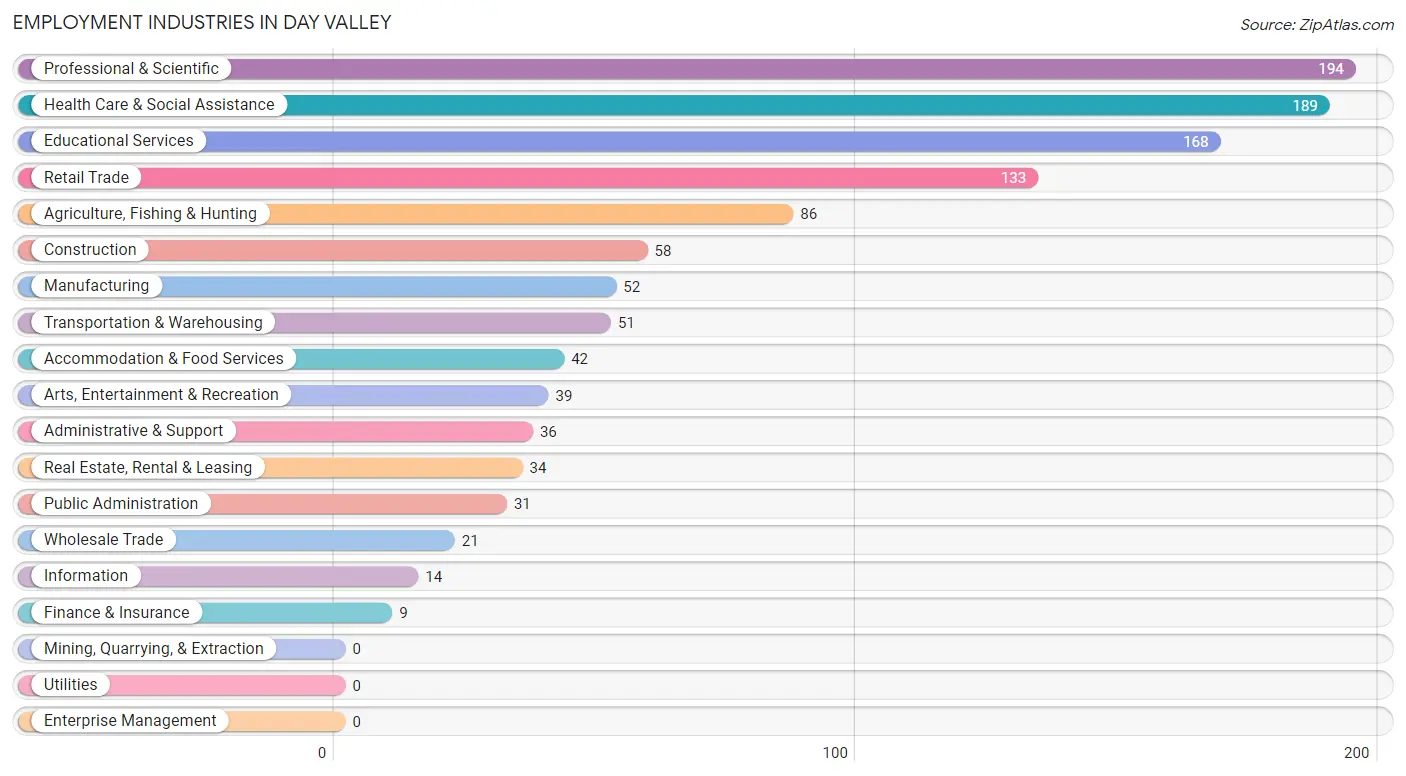
Employment Industries in Day Valley
The major employment industries in Day Valley include Professional & Scientific (194 | 14.9%), Health Care & Social Assistance (189 | 14.5%), Educational Services (168 | 12.9%), Retail Trade (133 | 10.2%), and Agriculture, Fishing & Hunting (86 | 6.6%).
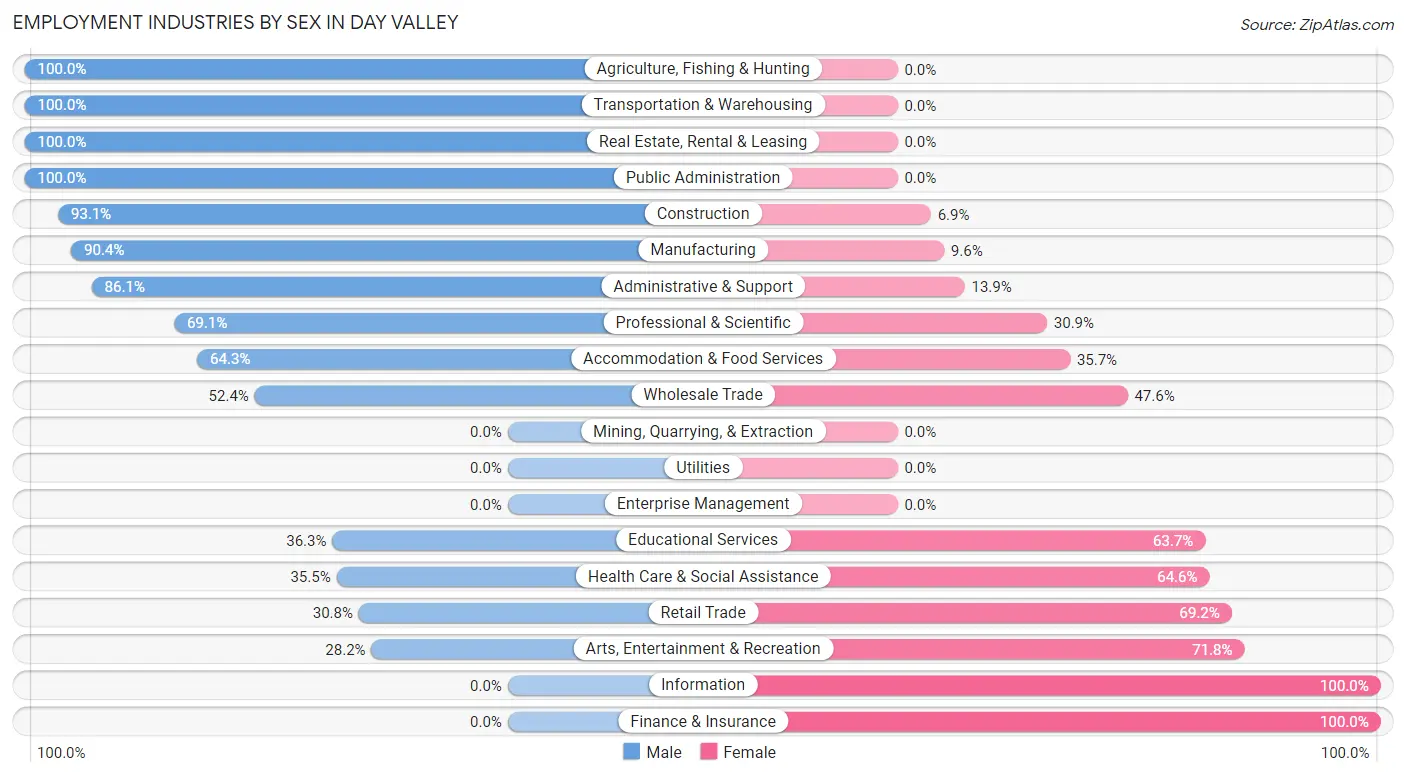
Employment Industries by Sex in Day Valley
The Day Valley industries that see more men than women are Agriculture, Fishing & Hunting (100.0%), Transportation & Warehousing (100.0%), and Real Estate, Rental & Leasing (100.0%), whereas the industries that tend to have a higher number of women are Information (100.0%), Finance & Insurance (100.0%), and Arts, Entertainment & Recreation (71.8%).
| Industry | Male | Female |
| Agriculture, Fishing & Hunting | 86 (100.0%) | 0 (0.0%) |
| Mining, Quarrying, & Extraction | 0 (0.0%) | 0 (0.0%) |
| Construction | 54 (93.1%) | 4 (6.9%) |
| Manufacturing | 47 (90.4%) | 5 (9.6%) |
| Wholesale Trade | 11 (52.4%) | 10 (47.6%) |
| Retail Trade | 41 (30.8%) | 92 (69.2%) |
| Transportation & Warehousing | 51 (100.0%) | 0 (0.0%) |
| Utilities | 0 (0.0%) | 0 (0.0%) |
| Information | 0 (0.0%) | 14 (100.0%) |
| Finance & Insurance | 0 (0.0%) | 9 (100.0%) |
| Real Estate, Rental & Leasing | 34 (100.0%) | 0 (0.0%) |
| Professional & Scientific | 134 (69.1%) | 60 (30.9%) |
| Enterprise Management | 0 (0.0%) | 0 (0.0%) |
| Administrative & Support | 31 (86.1%) | 5 (13.9%) |
| Educational Services | 61 (36.3%) | 107 (63.7%) |
| Health Care & Social Assistance | 67 (35.4%) | 122 (64.5%) |
| Arts, Entertainment & Recreation | 11 (28.2%) | 28 (71.8%) |
| Accommodation & Food Services | 27 (64.3%) | 15 (35.7%) |
| Public Administration | 31 (100.0%) | 0 (0.0%) |
| Total | 705 (54.2%) | 596 (45.8%) |
Education in Day Valley
School Enrollment in Day Valley
The most common levels of schooling among the 700 students in Day Valley are middle school (173 | 24.7%), college / undergraduate (140 | 20.0%), and elementary school (118 | 16.9%).
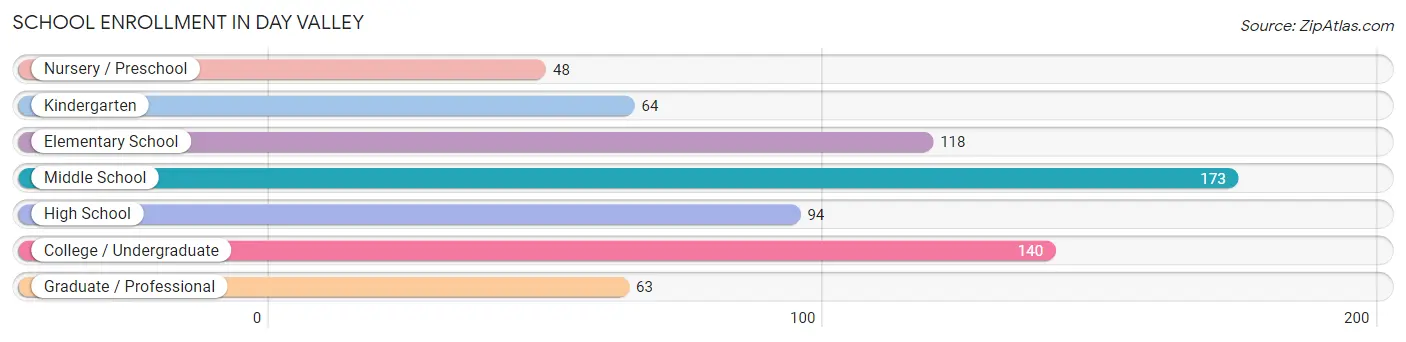
| School Level | # Students | % Students |
| Nursery / Preschool | 48 | 6.9% |
| Kindergarten | 64 | 9.1% |
| Elementary School | 118 | 16.9% |
| Middle School | 173 | 24.7% |
| High School | 94 | 13.4% |
| College / Undergraduate | 140 | 20.0% |
| Graduate / Professional | 63 | 9.0% |
| Total | 700 | 100.0% |
School Enrollment by Age by Funding Source in Day Valley
Out of a total of 700 students who are enrolled in schools in Day Valley, 163 (23.3%) attend a private institution, while the remaining 537 (76.7%) are enrolled in public schools. The age group of 3 to 4 year olds has the highest likelihood of being enrolled in private schools, with 41 (85.4% in the age bracket) enrolled. Conversely, the age group of 20 to 24 year olds has the lowest likelihood of being enrolled in a private school, with 42 (100.0% in the age bracket) attending a public institution.
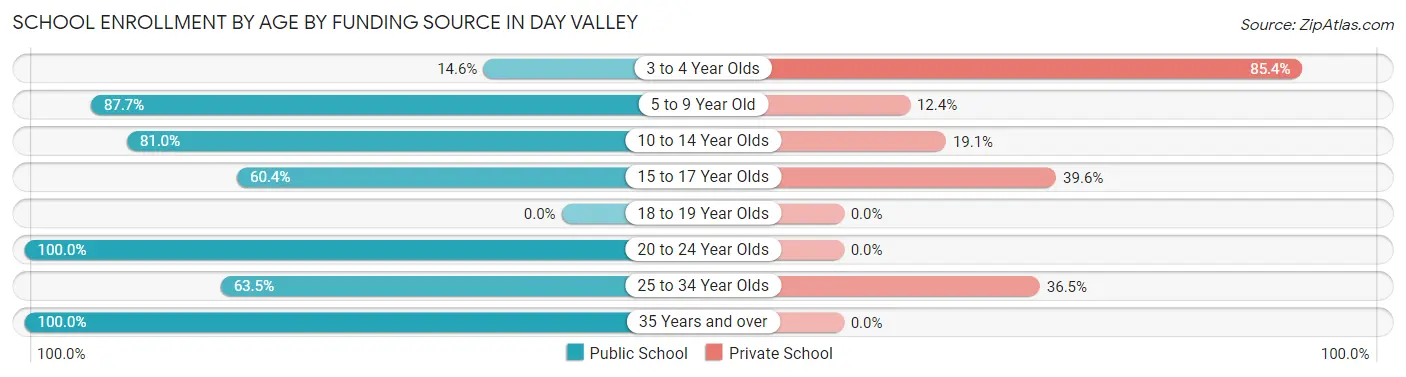
| Age Bracket | Public School | Private School |
| 3 to 4 Year Olds | 7 (14.6%) | 41 (85.4%) |
| 5 to 9 Year Old | 149 (87.6%) | 21 (12.3%) |
| 10 to 14 Year Olds | 187 (80.9%) | 44 (19.1%) |
| 15 to 17 Year Olds | 29 (60.4%) | 19 (39.6%) |
| 18 to 19 Year Olds | 0 (0.0%) | 0 (0.0%) |
| 20 to 24 Year Olds | 42 (100.0%) | 0 (0.0%) |
| 25 to 34 Year Olds | 66 (63.5%) | 38 (36.5%) |
| 35 Years and over | 57 (100.0%) | 0 (0.0%) |
| Total | 537 (76.7%) | 163 (23.3%) |
Educational Attainment by Field of Study in Day Valley
Social sciences (326 | 21.6%), bio, nature & agricultural (208 | 13.8%), business (165 | 10.9%), literature & languages (114 | 7.5%), and liberal arts & history (107 | 7.1%) are the most common fields of study among 1,509 individuals in Day Valley who have obtained a bachelor's degree or higher.
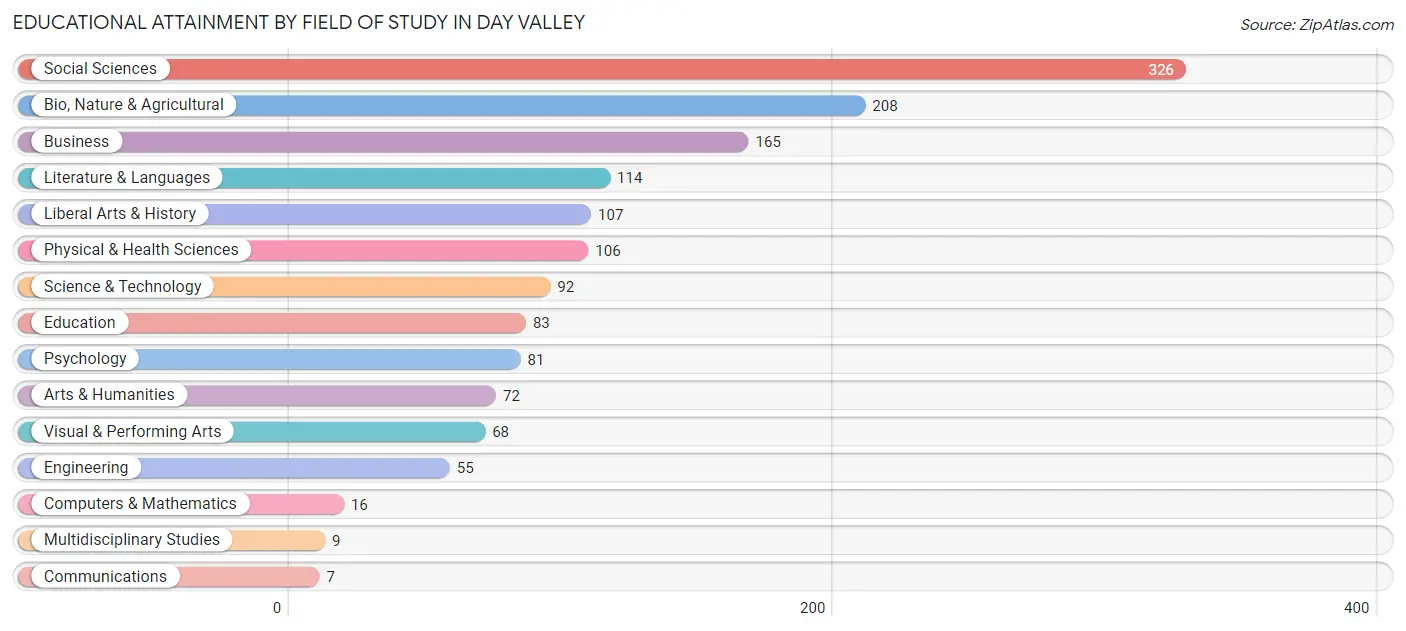
| Field of Study | # Graduates | % Graduates |
| Computers & Mathematics | 16 | 1.1% |
| Bio, Nature & Agricultural | 208 | 13.8% |
| Physical & Health Sciences | 106 | 7.0% |
| Psychology | 81 | 5.4% |
| Social Sciences | 326 | 21.6% |
| Engineering | 55 | 3.6% |
| Multidisciplinary Studies | 9 | 0.6% |
| Science & Technology | 92 | 6.1% |
| Business | 165 | 10.9% |
| Education | 83 | 5.5% |
| Literature & Languages | 114 | 7.5% |
| Liberal Arts & History | 107 | 7.1% |
| Visual & Performing Arts | 68 | 4.5% |
| Communications | 7 | 0.5% |
| Arts & Humanities | 72 | 4.8% |
| Total | 1,509 | 100.0% |
Transportation & Commute in Day Valley
Vehicle Availability by Sex in Day Valley
The most prevalent vehicle ownership categories in Day Valley are males with 2 vehicles (227, accounting for 32.3%) and females with 2 vehicles (196, making up 40.3%).
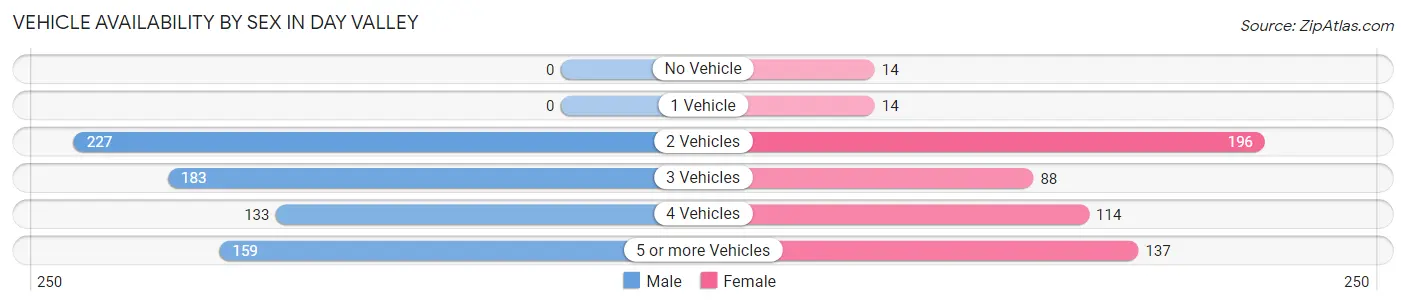
| Vehicles Available | Male | Female |
| No Vehicle | 0 (0.0%) | 14 (2.5%) |
| 1 Vehicle | 0 (0.0%) | 14 (2.5%) |
| 2 Vehicles | 227 (32.3%) | 196 (34.8%) |
| 3 Vehicles | 183 (26.1%) | 88 (15.6%) |
| 4 Vehicles | 133 (19.0%) | 114 (20.3%) |
| 5 or more Vehicles | 159 (22.7%) | 137 (24.3%) |
| Total | 702 (100.0%) | 563 (100.0%) |
Commute Time in Day Valley
The most frequently occuring commute durations in Day Valley are 15 to 19 minutes (251 commuters, 23.9%), 60 to 89 minutes (169 commuters, 16.1%), and 20 to 24 minutes (132 commuters, 12.6%).
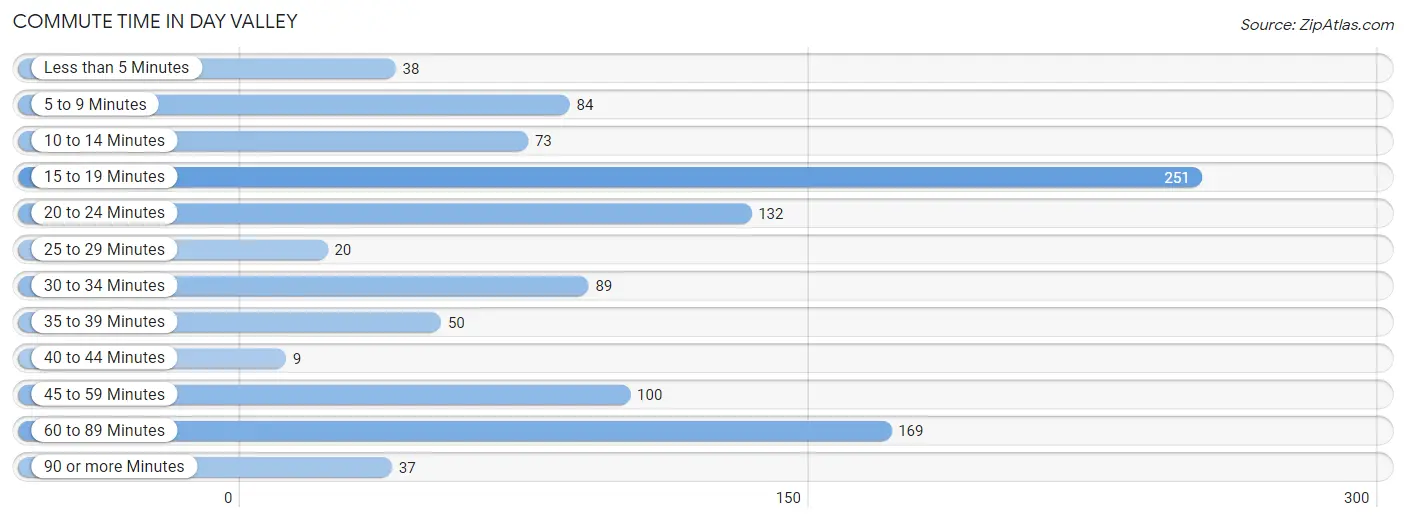
| Commute Time | # Commuters | % Commuters |
| Less than 5 Minutes | 38 | 3.6% |
| 5 to 9 Minutes | 84 | 8.0% |
| 10 to 14 Minutes | 73 | 6.9% |
| 15 to 19 Minutes | 251 | 23.9% |
| 20 to 24 Minutes | 132 | 12.6% |
| 25 to 29 Minutes | 20 | 1.9% |
| 30 to 34 Minutes | 89 | 8.5% |
| 35 to 39 Minutes | 50 | 4.8% |
| 40 to 44 Minutes | 9 | 0.9% |
| 45 to 59 Minutes | 100 | 9.5% |
| 60 to 89 Minutes | 169 | 16.1% |
| 90 or more Minutes | 37 | 3.5% |
Commute Time by Sex in Day Valley
The most common commute times in Day Valley are 15 to 19 minutes (136 commuters, 22.0%) for males and 15 to 19 minutes (115 commuters, 26.5%) for females.
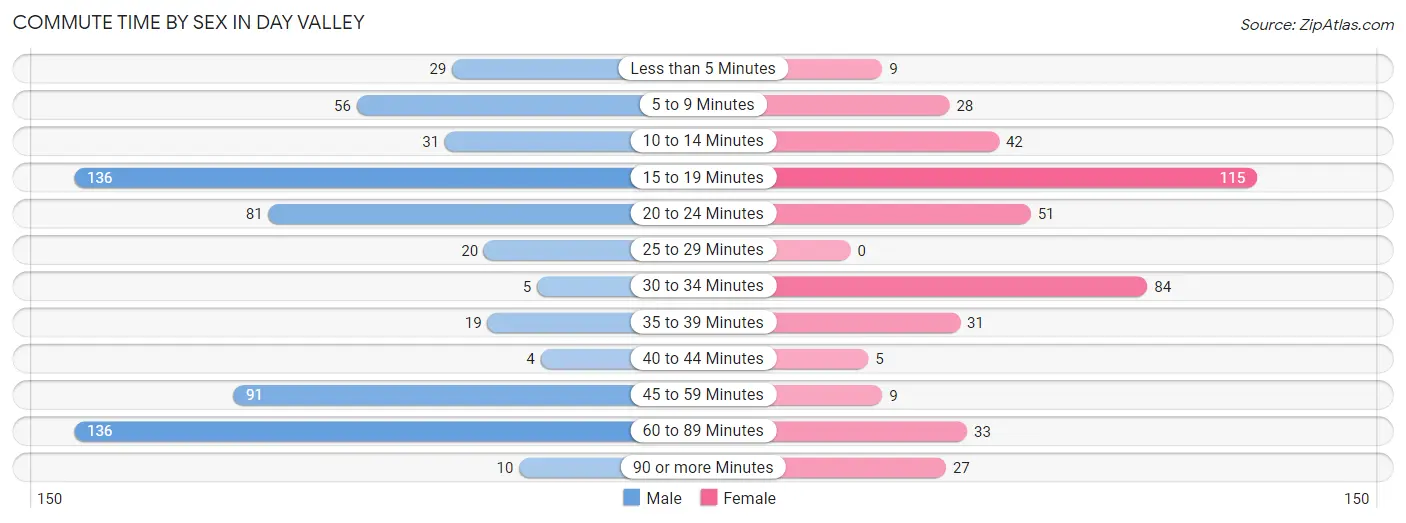
| Commute Time | Male | Female |
| Less than 5 Minutes | 29 (4.7%) | 9 (2.1%) |
| 5 to 9 Minutes | 56 (9.1%) | 28 (6.5%) |
| 10 to 14 Minutes | 31 (5.0%) | 42 (9.7%) |
| 15 to 19 Minutes | 136 (22.0%) | 115 (26.5%) |
| 20 to 24 Minutes | 81 (13.1%) | 51 (11.7%) |
| 25 to 29 Minutes | 20 (3.2%) | 0 (0.0%) |
| 30 to 34 Minutes | 5 (0.8%) | 84 (19.4%) |
| 35 to 39 Minutes | 19 (3.1%) | 31 (7.1%) |
| 40 to 44 Minutes | 4 (0.6%) | 5 (1.1%) |
| 45 to 59 Minutes | 91 (14.7%) | 9 (2.1%) |
| 60 to 89 Minutes | 136 (22.0%) | 33 (7.6%) |
| 90 or more Minutes | 10 (1.6%) | 27 (6.2%) |
Time of Departure to Work by Sex in Day Valley
The most frequent times of departure to work in Day Valley are 7:00 AM to 7:29 AM (155, 25.1%) for males and 7:30 AM to 7:59 AM (109, 25.1%) for females.
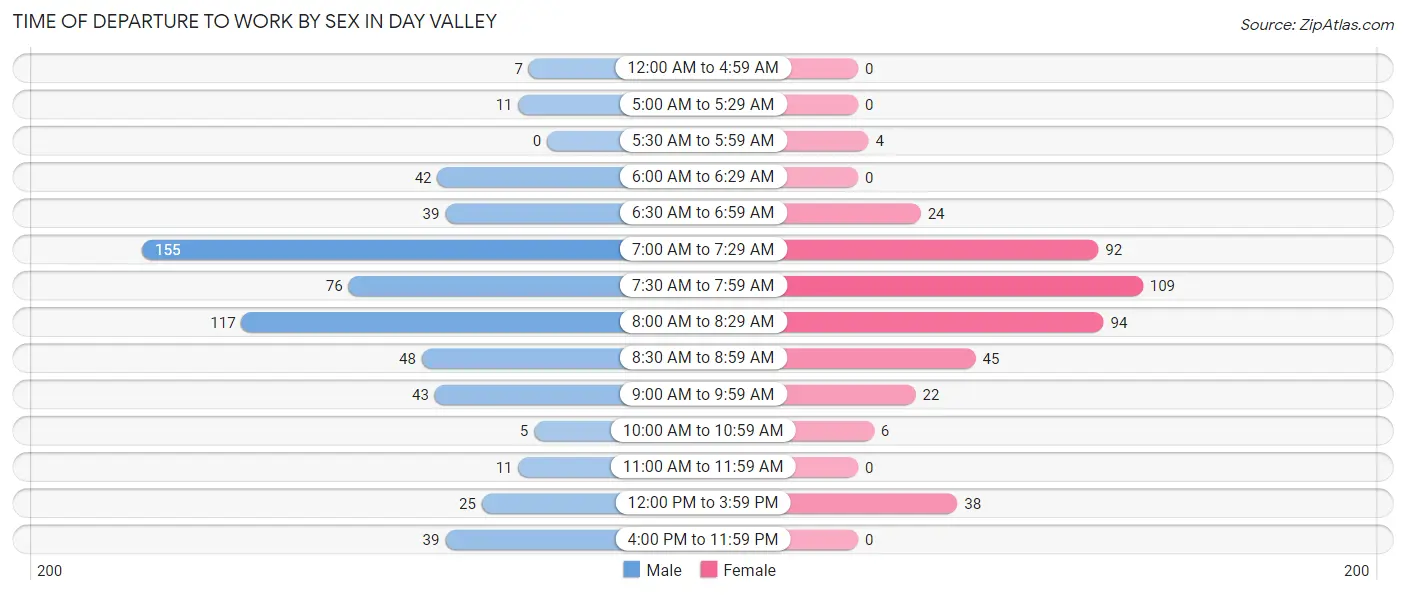
| Time of Departure | Male | Female |
| 12:00 AM to 4:59 AM | 7 (1.1%) | 0 (0.0%) |
| 5:00 AM to 5:29 AM | 11 (1.8%) | 0 (0.0%) |
| 5:30 AM to 5:59 AM | 0 (0.0%) | 4 (0.9%) |
| 6:00 AM to 6:29 AM | 42 (6.8%) | 0 (0.0%) |
| 6:30 AM to 6:59 AM | 39 (6.3%) | 24 (5.5%) |
| 7:00 AM to 7:29 AM | 155 (25.1%) | 92 (21.2%) |
| 7:30 AM to 7:59 AM | 76 (12.3%) | 109 (25.1%) |
| 8:00 AM to 8:29 AM | 117 (18.9%) | 94 (21.7%) |
| 8:30 AM to 8:59 AM | 48 (7.8%) | 45 (10.4%) |
| 9:00 AM to 9:59 AM | 43 (7.0%) | 22 (5.1%) |
| 10:00 AM to 10:59 AM | 5 (0.8%) | 6 (1.4%) |
| 11:00 AM to 11:59 AM | 11 (1.8%) | 0 (0.0%) |
| 12:00 PM to 3:59 PM | 25 (4.1%) | 38 (8.8%) |
| 4:00 PM to 11:59 PM | 39 (6.3%) | 0 (0.0%) |
| Total | 618 (100.0%) | 434 (100.0%) |
Housing Occupancy in Day Valley
Occupancy by Ownership in Day Valley
Of the total 1,237 dwellings in Day Valley, owner-occupied units account for 1,119 (90.5%), while renter-occupied units make up 118 (9.5%).
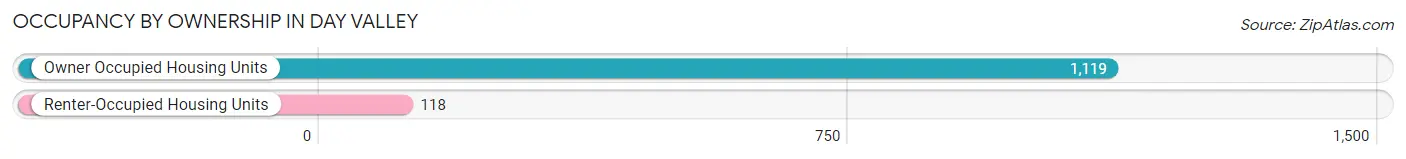
| Occupancy | # Housing Units | % Housing Units |
| Owner Occupied Housing Units | 1,119 | 90.5% |
| Renter-Occupied Housing Units | 118 | 9.5% |
| Total Occupied Housing Units | 1,237 | 100.0% |
Occupancy by Household Size in Day Valley
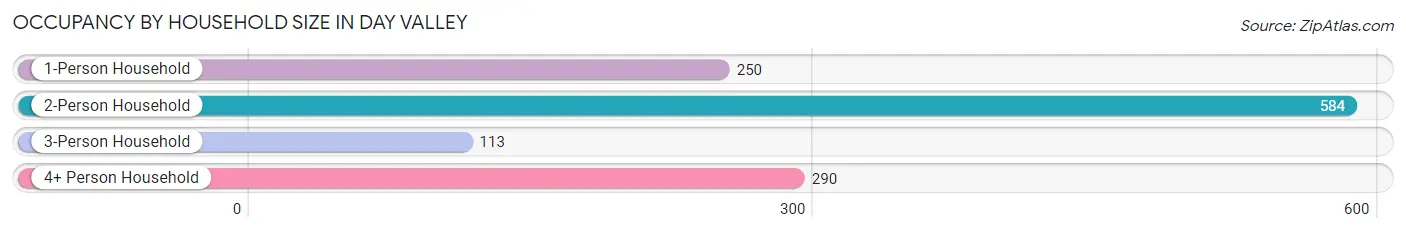
| Household Size | # Housing Units | % Housing Units |
| 1-Person Household | 250 | 20.2% |
| 2-Person Household | 584 | 47.2% |
| 3-Person Household | 113 | 9.1% |
| 4+ Person Household | 290 | 23.4% |
| Total Housing Units | 1,237 | 100.0% |
Occupancy by Ownership by Household Size in Day Valley
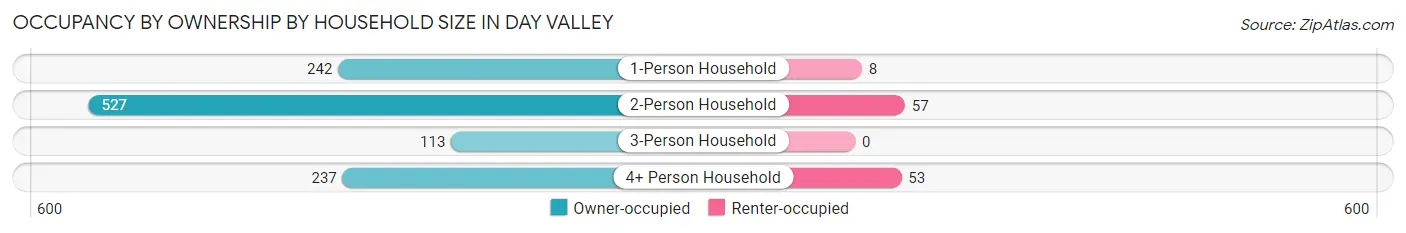
| Household Size | Owner-occupied | Renter-occupied |
| 1-Person Household | 242 (96.8%) | 8 (3.2%) |
| 2-Person Household | 527 (90.2%) | 57 (9.8%) |
| 3-Person Household | 113 (100.0%) | 0 (0.0%) |
| 4+ Person Household | 237 (81.7%) | 53 (18.3%) |
| Total Housing Units | 1,119 (90.5%) | 118 (9.5%) |
Occupancy by Educational Attainment in Day Valley
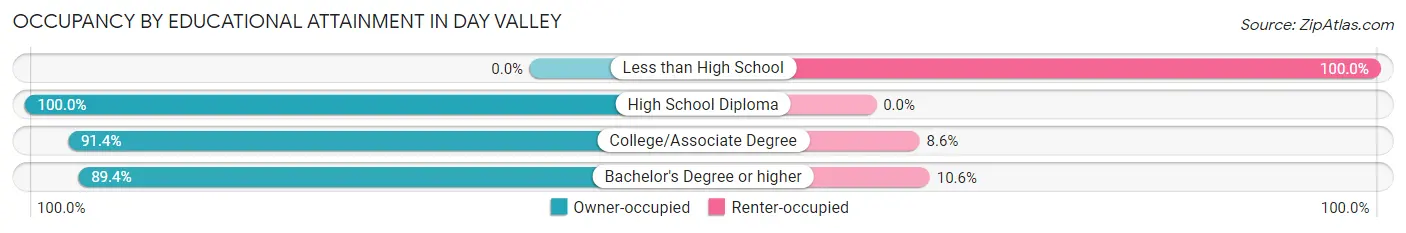
| Household Size | Owner-occupied | Renter-occupied |
| Less than High School | 0 (0.0%) | 14 (100.0%) |
| High School Diploma | 177 (100.0%) | 0 (0.0%) |
| College/Associate Degree | 329 (91.4%) | 31 (8.6%) |
| Bachelor's Degree or higher | 613 (89.4%) | 73 (10.6%) |
Occupancy by Age of Householder in Day Valley
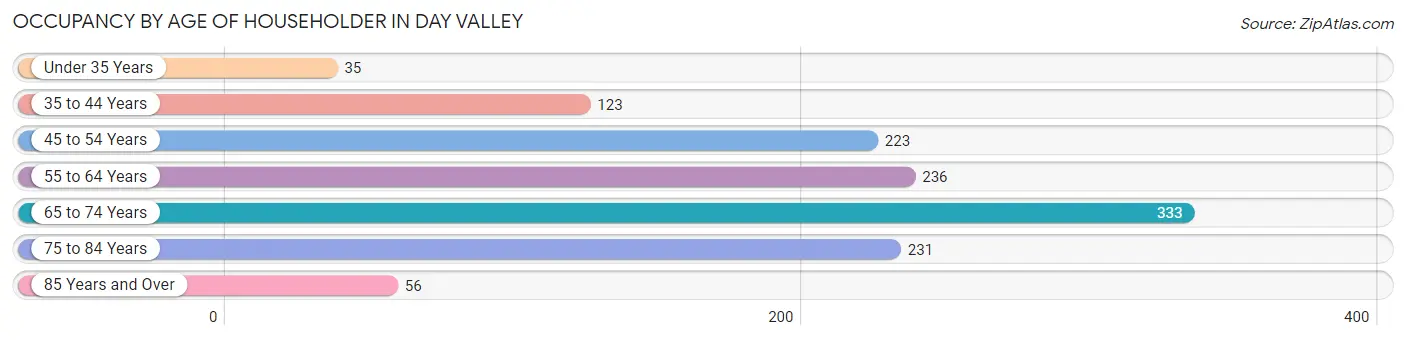
| Age Bracket | # Households | % Households |
| Under 35 Years | 35 | 2.8% |
| 35 to 44 Years | 123 | 9.9% |
| 45 to 54 Years | 223 | 18.0% |
| 55 to 64 Years | 236 | 19.1% |
| 65 to 74 Years | 333 | 26.9% |
| 75 to 84 Years | 231 | 18.7% |
| 85 Years and Over | 56 | 4.5% |
| Total | 1,237 | 100.0% |
Housing Finances in Day Valley
Median Income by Occupancy in Day Valley
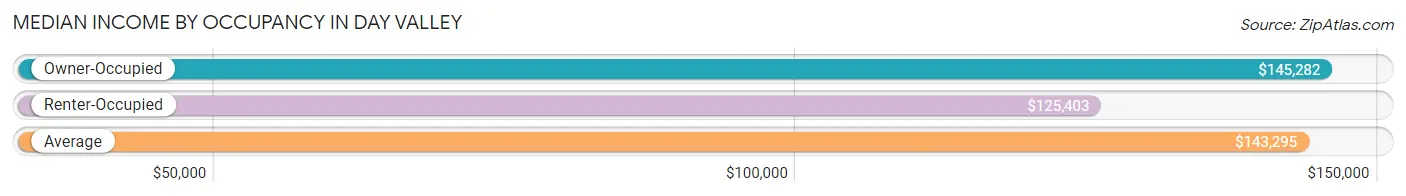
| Occupancy Type | # Households | Median Income |
| Owner-Occupied | 1,119 (90.5%) | $145,282 |
| Renter-Occupied | 118 (9.5%) | $125,403 |
| Average | 1,237 (100.0%) | $143,295 |
Occupancy by Householder Income Bracket in Day Valley
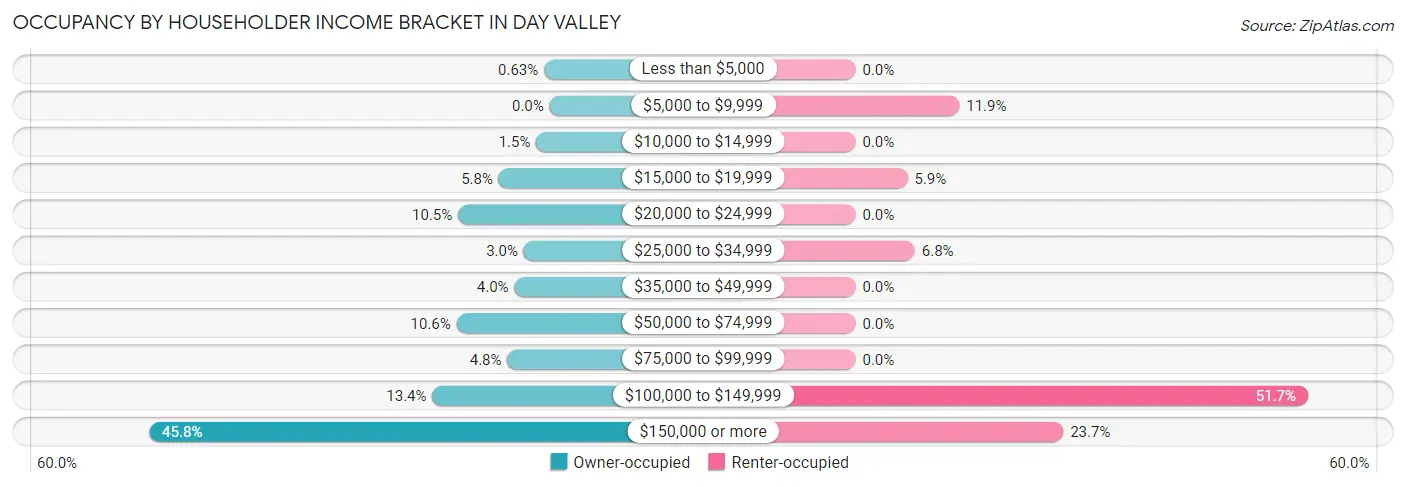
| Income Bracket | Owner-occupied | Renter-occupied |
| Less than $5,000 | 7 (0.6%) | 0 (0.0%) |
| $5,000 to $9,999 | 0 (0.0%) | 14 (11.9%) |
| $10,000 to $14,999 | 17 (1.5%) | 0 (0.0%) |
| $15,000 to $19,999 | 65 (5.8%) | 7 (5.9%) |
| $20,000 to $24,999 | 117 (10.5%) | 0 (0.0%) |
| $25,000 to $34,999 | 33 (2.9%) | 8 (6.8%) |
| $35,000 to $49,999 | 45 (4.0%) | 0 (0.0%) |
| $50,000 to $74,999 | 119 (10.6%) | 0 (0.0%) |
| $75,000 to $99,999 | 54 (4.8%) | 0 (0.0%) |
| $100,000 to $149,999 | 150 (13.4%) | 61 (51.7%) |
| $150,000 or more | 512 (45.8%) | 28 (23.7%) |
| Total | 1,119 (100.0%) | 118 (100.0%) |
Monthly Housing Cost Tiers in Day Valley
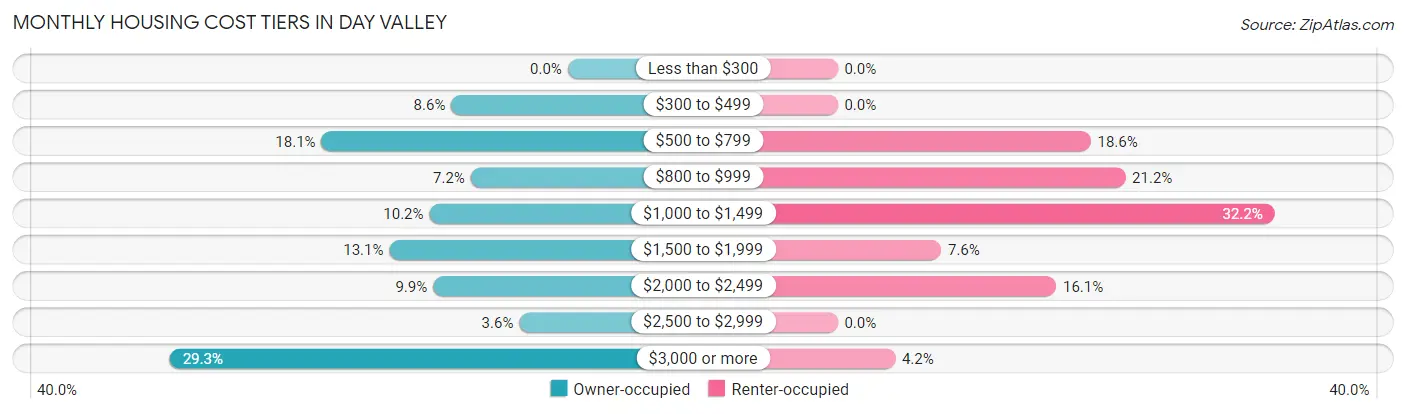
| Monthly Cost | Owner-occupied | Renter-occupied |
| Less than $300 | 0 (0.0%) | 0 (0.0%) |
| $300 to $499 | 96 (8.6%) | 0 (0.0%) |
| $500 to $799 | 203 (18.1%) | 22 (18.6%) |
| $800 to $999 | 80 (7.1%) | 25 (21.2%) |
| $1,000 to $1,499 | 114 (10.2%) | 38 (32.2%) |
| $1,500 to $1,999 | 147 (13.1%) | 9 (7.6%) |
| $2,000 to $2,499 | 111 (9.9%) | 19 (16.1%) |
| $2,500 to $2,999 | 40 (3.6%) | 0 (0.0%) |
| $3,000 or more | 328 (29.3%) | 5 (4.2%) |
| Total | 1,119 (100.0%) | 118 (100.0%) |
Physical Housing Characteristics in Day Valley
Housing Structures in Day Valley
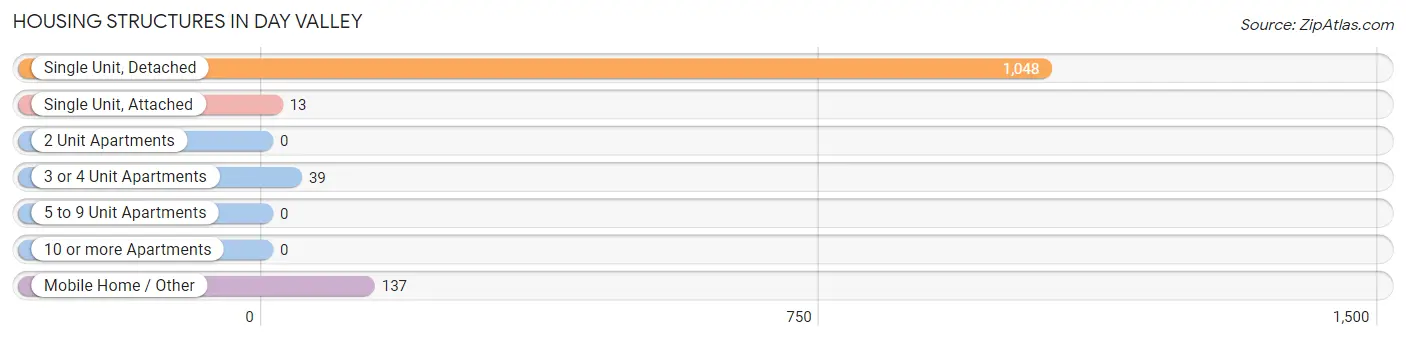
| Structure Type | # Housing Units | % Housing Units |
| Single Unit, Detached | 1,048 | 84.7% |
| Single Unit, Attached | 13 | 1.1% |
| 2 Unit Apartments | 0 | 0.0% |
| 3 or 4 Unit Apartments | 39 | 3.2% |
| 5 to 9 Unit Apartments | 0 | 0.0% |
| 10 or more Apartments | 0 | 0.0% |
| Mobile Home / Other | 137 | 11.1% |
| Total | 1,237 | 100.0% |
Housing Structures by Occupancy in Day Valley
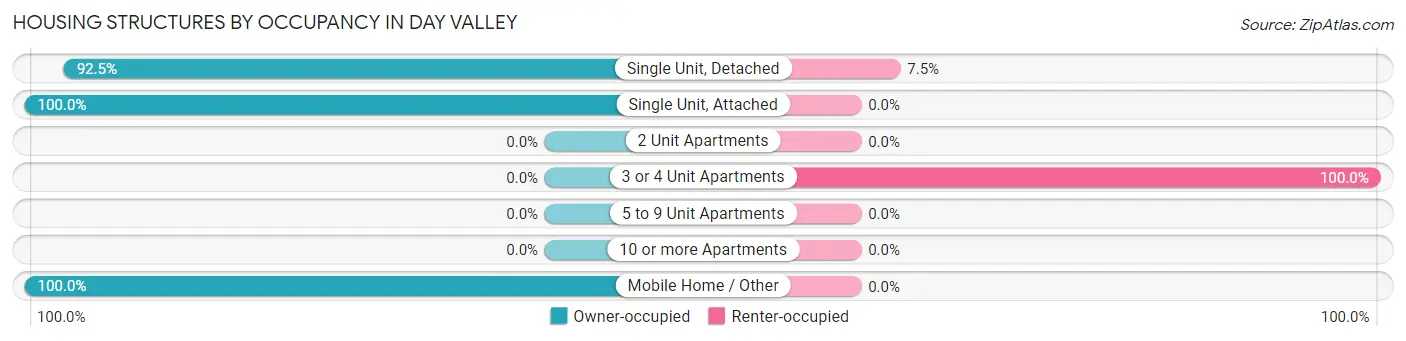
| Structure Type | Owner-occupied | Renter-occupied |
| Single Unit, Detached | 969 (92.5%) | 79 (7.5%) |
| Single Unit, Attached | 13 (100.0%) | 0 (0.0%) |
| 2 Unit Apartments | 0 (0.0%) | 0 (0.0%) |
| 3 or 4 Unit Apartments | 0 (0.0%) | 39 (100.0%) |
| 5 to 9 Unit Apartments | 0 (0.0%) | 0 (0.0%) |
| 10 or more Apartments | 0 (0.0%) | 0 (0.0%) |
| Mobile Home / Other | 137 (100.0%) | 0 (0.0%) |
| Total | 1,119 (90.5%) | 118 (9.5%) |
Housing Structures by Number of Rooms in Day Valley
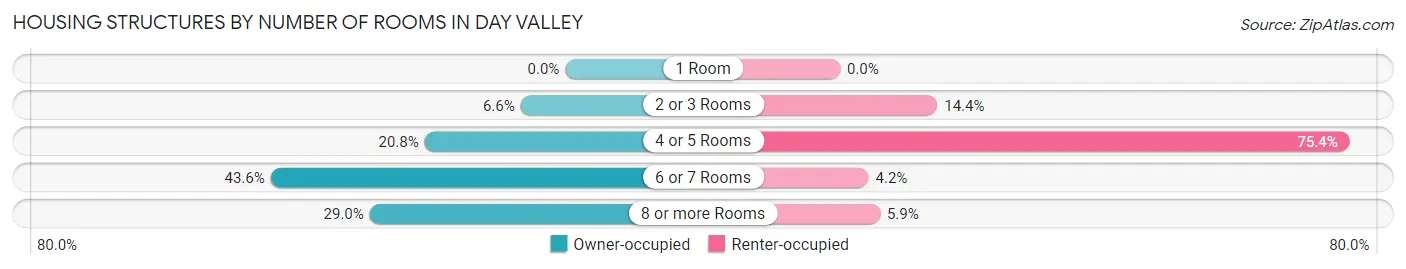
| Number of Rooms | Owner-occupied | Renter-occupied |
| 1 Room | 0 (0.0%) | 0 (0.0%) |
| 2 or 3 Rooms | 74 (6.6%) | 17 (14.4%) |
| 4 or 5 Rooms | 233 (20.8%) | 89 (75.4%) |
| 6 or 7 Rooms | 488 (43.6%) | 5 (4.2%) |
| 8 or more Rooms | 324 (28.9%) | 7 (5.9%) |
| Total | 1,119 (100.0%) | 118 (100.0%) |
Housing Structure by Heating Type in Day Valley
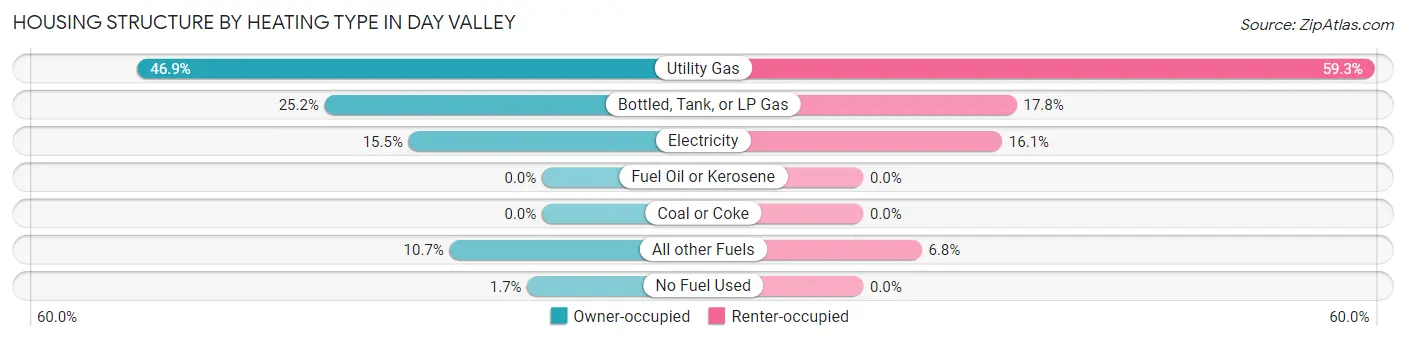
| Heating Type | Owner-occupied | Renter-occupied |
| Utility Gas | 525 (46.9%) | 70 (59.3%) |
| Bottled, Tank, or LP Gas | 282 (25.2%) | 21 (17.8%) |
| Electricity | 173 (15.5%) | 19 (16.1%) |
| Fuel Oil or Kerosene | 0 (0.0%) | 0 (0.0%) |
| Coal or Coke | 0 (0.0%) | 0 (0.0%) |
| All other Fuels | 120 (10.7%) | 8 (6.8%) |
| No Fuel Used | 19 (1.7%) | 0 (0.0%) |
| Total | 1,119 (100.0%) | 118 (100.0%) |
Household Vehicle Usage in Day Valley
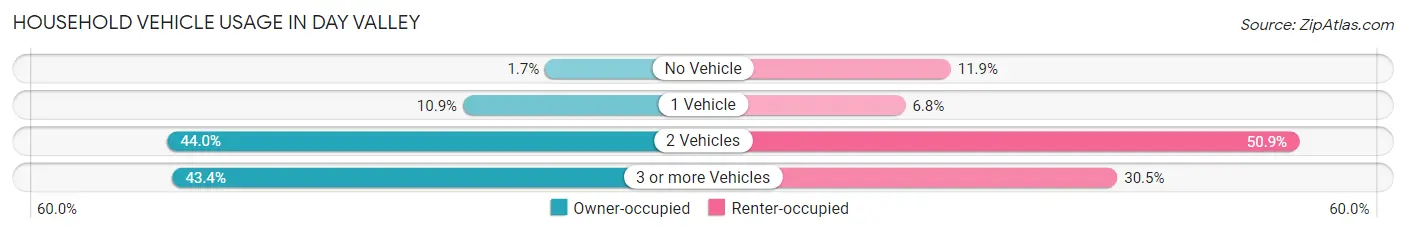
| Vehicles per Household | Owner-occupied | Renter-occupied |
| No Vehicle | 19 (1.7%) | 14 (11.9%) |
| 1 Vehicle | 122 (10.9%) | 8 (6.8%) |
| 2 Vehicles | 492 (44.0%) | 60 (50.8%) |
| 3 or more Vehicles | 486 (43.4%) | 36 (30.5%) |
| Total | 1,119 (100.0%) | 118 (100.0%) |
Real Estate & Mortgages in Day Valley
Real Estate and Mortgage Overview in Day Valley
| Characteristic | Without Mortgage | With Mortgage |
| Housing Units | 649 | 470 |
| Median Property Value | $1,074,500 | $1,171,600 |
| Median Household Income | $77,721 | $299 |
| Monthly Housing Costs | $855 | $328 |
| Real Estate Taxes | $4,927 | $0 |
Property Value by Mortgage Status in Day Valley
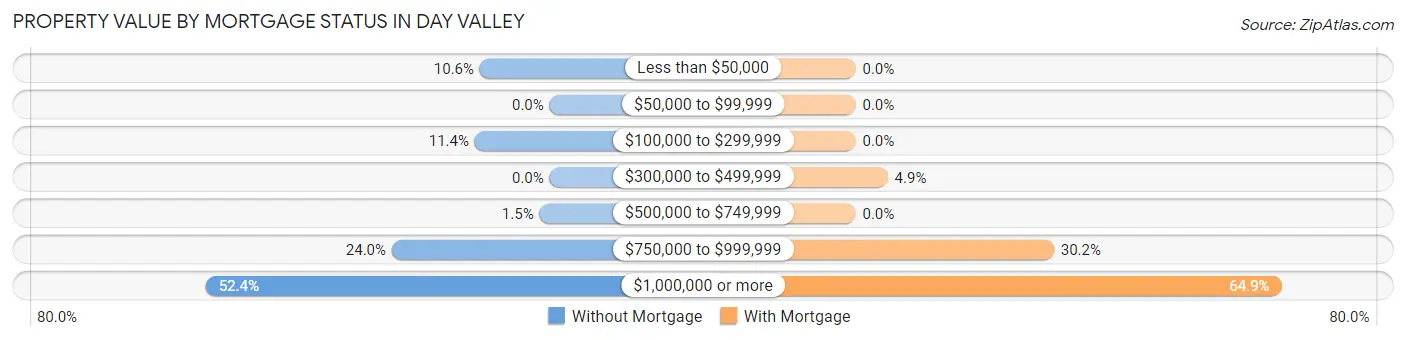
| Property Value | Without Mortgage | With Mortgage |
| Less than $50,000 | 69 (10.6%) | 0 (0.0%) |
| $50,000 to $99,999 | 0 (0.0%) | 0 (0.0%) |
| $100,000 to $299,999 | 74 (11.4%) | 0 (0.0%) |
| $300,000 to $499,999 | 0 (0.0%) | 23 (4.9%) |
| $500,000 to $749,999 | 10 (1.5%) | 0 (0.0%) |
| $750,000 to $999,999 | 156 (24.0%) | 142 (30.2%) |
| $1,000,000 or more | 340 (52.4%) | 305 (64.9%) |
| Total | 649 (100.0%) | 470 (100.0%) |
Household Income by Mortgage Status in Day Valley
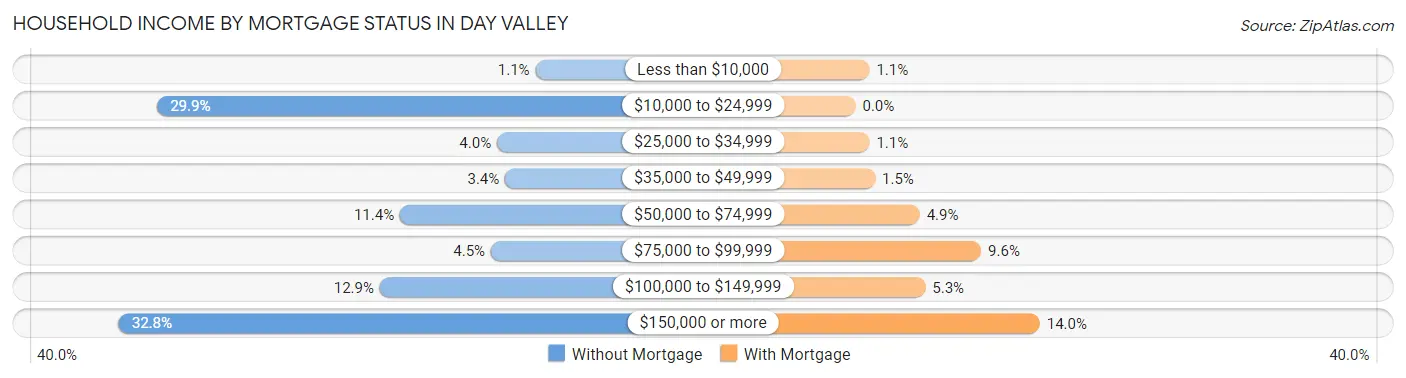
| Household Income | Without Mortgage | With Mortgage |
| Less than $10,000 | 7 (1.1%) | 5 (1.1%) |
| $10,000 to $24,999 | 194 (29.9%) | 0 (0.0%) |
| $25,000 to $34,999 | 26 (4.0%) | 5 (1.1%) |
| $35,000 to $49,999 | 22 (3.4%) | 7 (1.5%) |
| $50,000 to $74,999 | 74 (11.4%) | 23 (4.9%) |
| $75,000 to $99,999 | 29 (4.5%) | 45 (9.6%) |
| $100,000 to $149,999 | 84 (12.9%) | 25 (5.3%) |
| $150,000 or more | 213 (32.8%) | 66 (14.0%) |
| Total | 649 (100.0%) | 470 (100.0%) |
Property Value to Household Income Ratio in Day Valley
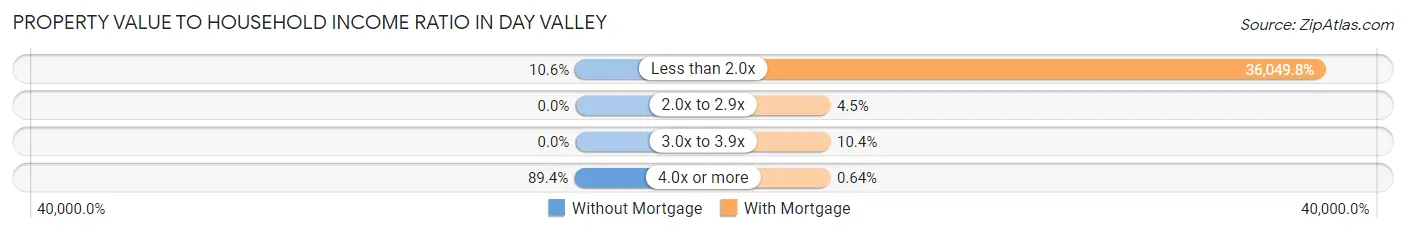
| Value-to-Income Ratio | Without Mortgage | With Mortgage |
| Less than 2.0x | 69 (10.6%) | 169,434 (36,049.8%) |
| 2.0x to 2.9x | 0 (0.0%) | 21 (4.5%) |
| 3.0x to 3.9x | 0 (0.0%) | 49 (10.4%) |
| 4.0x or more | 580 (89.4%) | 3 (0.6%) |
| Total | 649 (100.0%) | 470 (100.0%) |
Real Estate Taxes by Mortgage Status in Day Valley
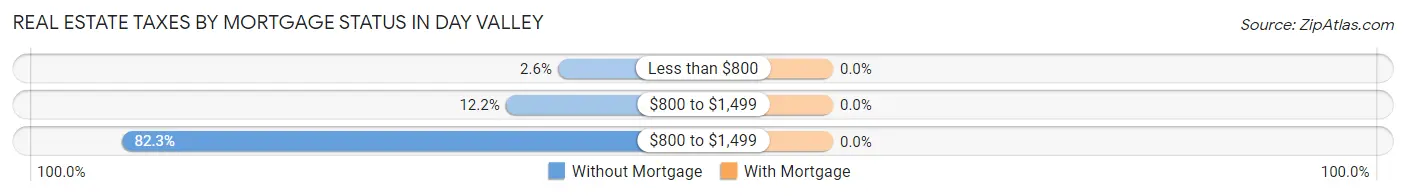
| Property Taxes | Without Mortgage | With Mortgage |
| Less than $800 | 17 (2.6%) | 0 (0.0%) |
| $800 to $1,499 | 79 (12.2%) | 0 (0.0%) |
| $800 to $1,499 | 534 (82.3%) | 0 (0.0%) |
| Total | 649 (100.0%) | 470 (100.0%) |
Health & Disability in Day Valley
Health Insurance Coverage by Age in Day Valley
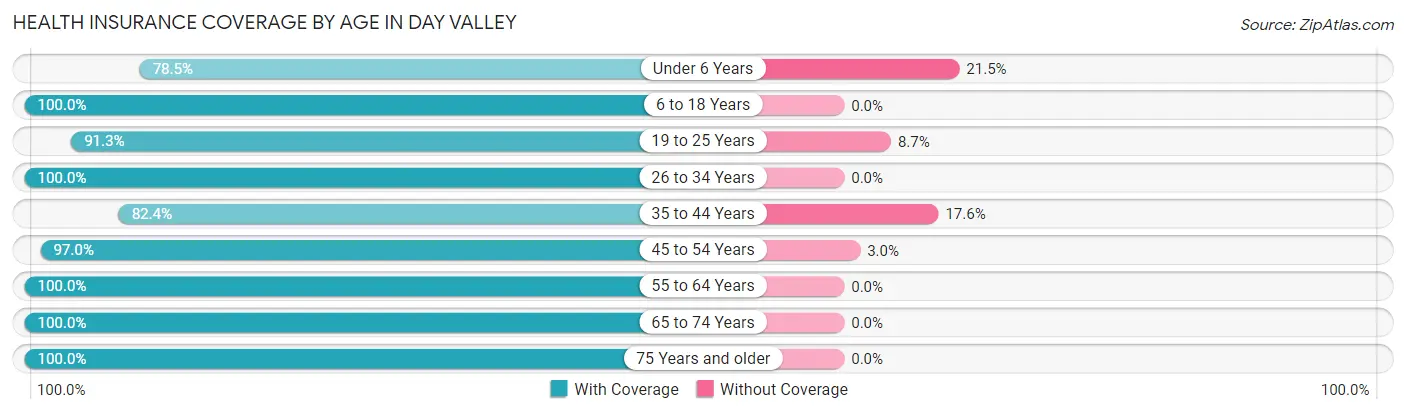
| Age Bracket | With Coverage | Without Coverage |
| Under 6 Years | 128 (78.5%) | 35 (21.5%) |
| 6 to 18 Years | 463 (100.0%) | 0 (0.0%) |
| 19 to 25 Years | 105 (91.3%) | 10 (8.7%) |
| 26 to 34 Years | 208 (100.0%) | 0 (0.0%) |
| 35 to 44 Years | 291 (82.4%) | 62 (17.6%) |
| 45 to 54 Years | 327 (97.0%) | 10 (3.0%) |
| 55 to 64 Years | 499 (100.0%) | 0 (0.0%) |
| 65 to 74 Years | 599 (100.0%) | 0 (0.0%) |
| 75 Years and older | 510 (100.0%) | 0 (0.0%) |
| Total | 3,130 (96.4%) | 117 (3.6%) |
Health Insurance Coverage by Citizenship Status in Day Valley
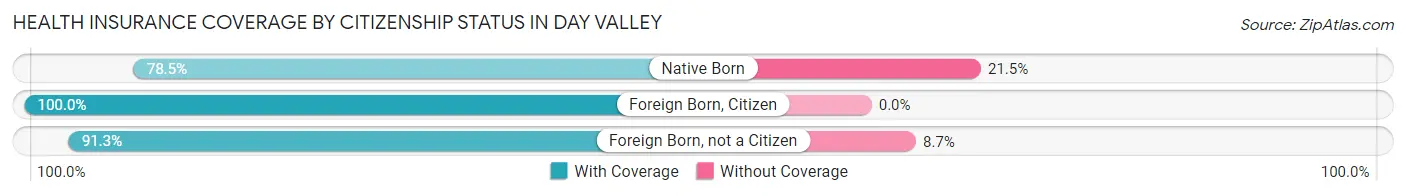
| Citizenship Status | With Coverage | Without Coverage |
| Native Born | 128 (78.5%) | 35 (21.5%) |
| Foreign Born, Citizen | 463 (100.0%) | 0 (0.0%) |
| Foreign Born, not a Citizen | 105 (91.3%) | 10 (8.7%) |
Health Insurance Coverage by Household Income in Day Valley
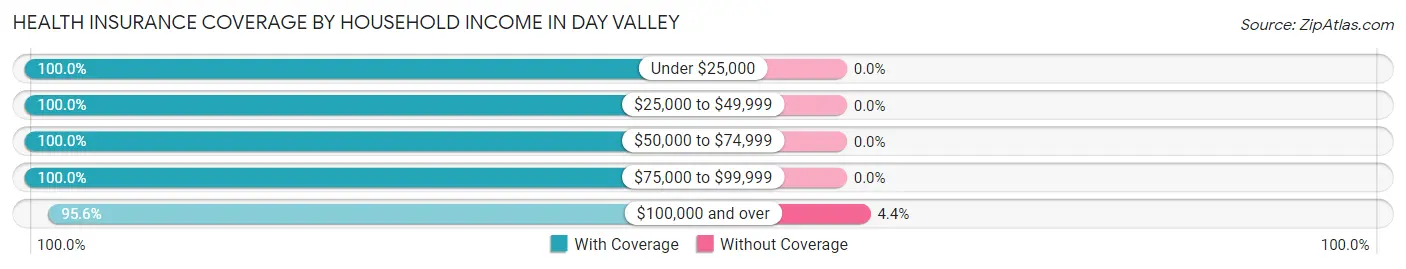
| Household Income | With Coverage | Without Coverage |
| Under $25,000 | 388 (100.0%) | 0 (0.0%) |
| $25,000 to $49,999 | 118 (100.0%) | 0 (0.0%) |
| $50,000 to $74,999 | 216 (100.0%) | 0 (0.0%) |
| $75,000 to $99,999 | 80 (100.0%) | 0 (0.0%) |
| $100,000 and over | 2,301 (95.6%) | 107 (4.4%) |
Public vs Private Health Insurance Coverage by Age in Day Valley
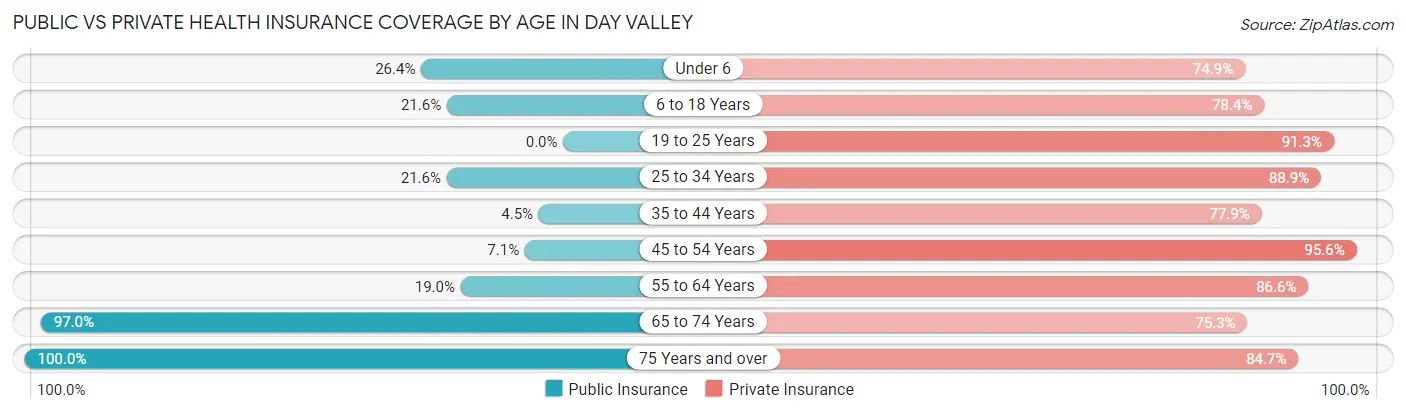
| Age Bracket | Public Insurance | Private Insurance |
| Under 6 | 43 (26.4%) | 122 (74.9%) |
| 6 to 18 Years | 100 (21.6%) | 363 (78.4%) |
| 19 to 25 Years | 0 (0.0%) | 105 (91.3%) |
| 25 to 34 Years | 45 (21.6%) | 185 (88.9%) |
| 35 to 44 Years | 16 (4.5%) | 275 (77.9%) |
| 45 to 54 Years | 24 (7.1%) | 322 (95.6%) |
| 55 to 64 Years | 95 (19.0%) | 432 (86.6%) |
| 65 to 74 Years | 581 (97.0%) | 451 (75.3%) |
| 75 Years and over | 510 (100.0%) | 432 (84.7%) |
| Total | 1,414 (43.5%) | 2,687 (82.8%) |
Disability Status by Sex by Age in Day Valley
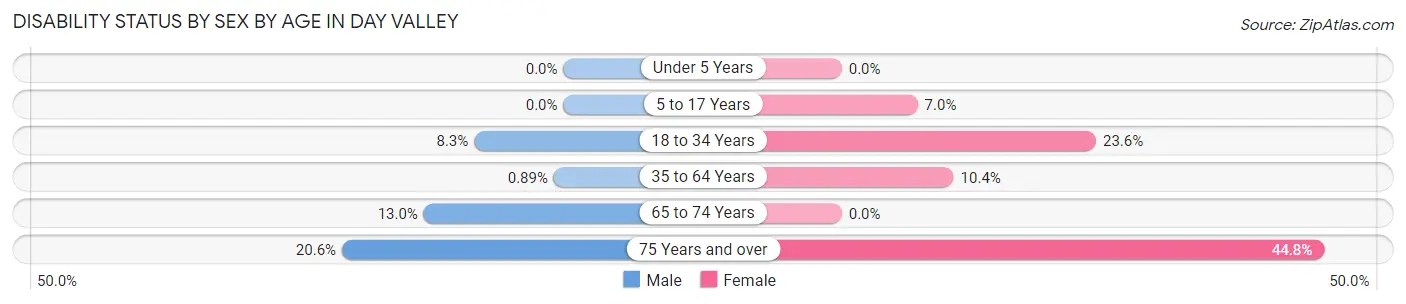
| Age Bracket | Male | Female |
| Under 5 Years | 0 (0.0%) | 0 (0.0%) |
| 5 to 17 Years | 0 (0.0%) | 20 (7.0%) |
| 18 to 34 Years | 12 (8.3%) | 42 (23.6%) |
| 35 to 64 Years | 5 (0.9%) | 65 (10.4%) |
| 65 to 74 Years | 32 (13.0%) | 0 (0.0%) |
| 75 Years and over | 52 (20.5%) | 115 (44.8%) |
Disability Class by Sex by Age in Day Valley
Disability Class: Hearing Difficulty
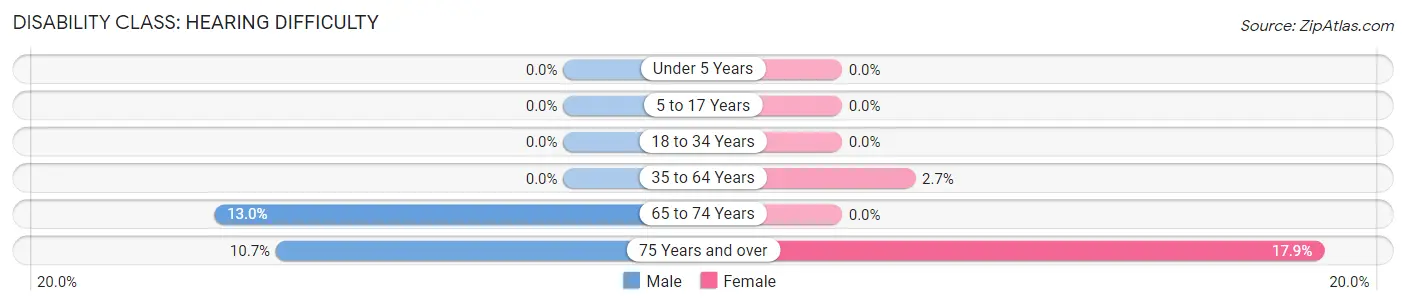
| Age Bracket | Male | Female |
| Under 5 Years | 0 (0.0%) | 0 (0.0%) |
| 5 to 17 Years | 0 (0.0%) | 0 (0.0%) |
| 18 to 34 Years | 0 (0.0%) | 0 (0.0%) |
| 35 to 64 Years | 0 (0.0%) | 17 (2.7%) |
| 65 to 74 Years | 32 (13.0%) | 0 (0.0%) |
| 75 Years and over | 27 (10.7%) | 46 (17.9%) |
Disability Class: Vision Difficulty
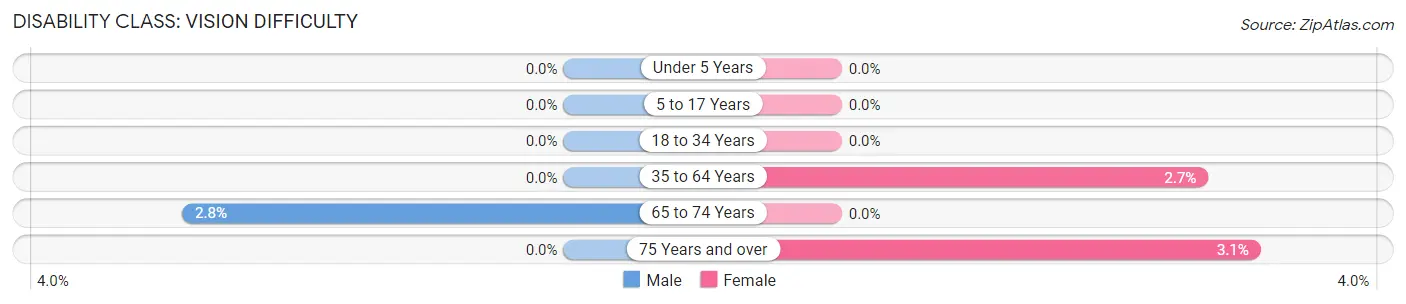
| Age Bracket | Male | Female |
| Under 5 Years | 0 (0.0%) | 0 (0.0%) |
| 5 to 17 Years | 0 (0.0%) | 0 (0.0%) |
| 18 to 34 Years | 0 (0.0%) | 0 (0.0%) |
| 35 to 64 Years | 0 (0.0%) | 17 (2.7%) |
| 65 to 74 Years | 7 (2.8%) | 0 (0.0%) |
| 75 Years and over | 0 (0.0%) | 8 (3.1%) |
Disability Class: Cognitive Difficulty
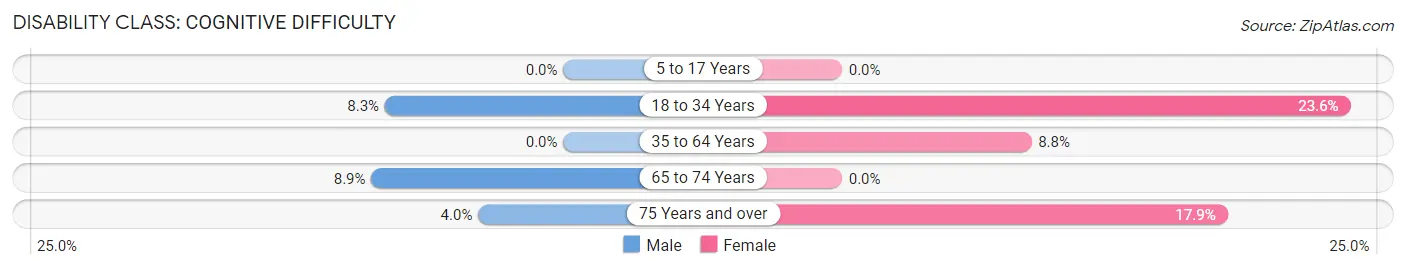
| Age Bracket | Male | Female |
| 5 to 17 Years | 0 (0.0%) | 0 (0.0%) |
| 18 to 34 Years | 12 (8.3%) | 42 (23.6%) |
| 35 to 64 Years | 0 (0.0%) | 55 (8.8%) |
| 65 to 74 Years | 22 (8.9%) | 0 (0.0%) |
| 75 Years and over | 10 (4.0%) | 46 (17.9%) |
Disability Class: Ambulatory Difficulty
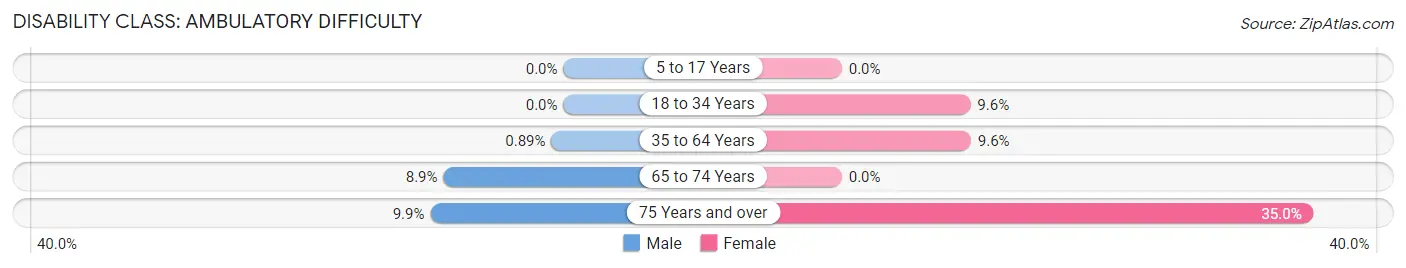
| Age Bracket | Male | Female |
| 5 to 17 Years | 0 (0.0%) | 0 (0.0%) |
| 18 to 34 Years | 0 (0.0%) | 17 (9.6%) |
| 35 to 64 Years | 5 (0.9%) | 60 (9.6%) |
| 65 to 74 Years | 22 (8.9%) | 0 (0.0%) |
| 75 Years and over | 25 (9.9%) | 90 (35.0%) |
Disability Class: Self-Care Difficulty
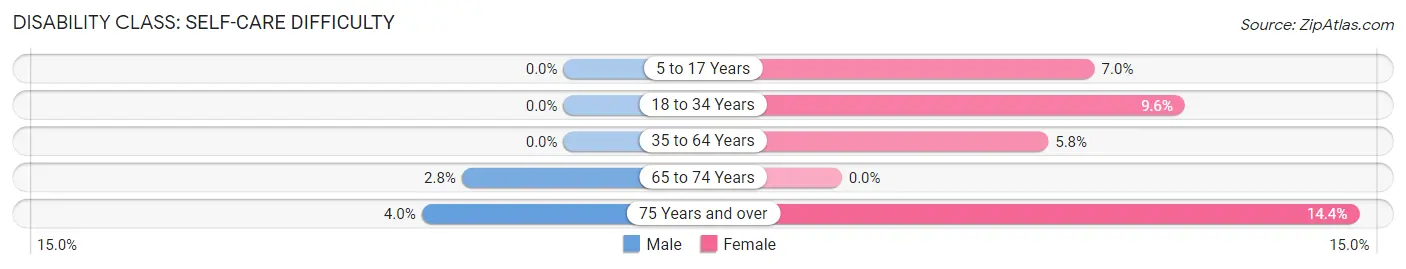
| Age Bracket | Male | Female |
| 5 to 17 Years | 0 (0.0%) | 20 (7.0%) |
| 18 to 34 Years | 0 (0.0%) | 17 (9.6%) |
| 35 to 64 Years | 0 (0.0%) | 36 (5.8%) |
| 65 to 74 Years | 7 (2.8%) | 0 (0.0%) |
| 75 Years and over | 10 (4.0%) | 37 (14.4%) |
Technology Access in Day Valley
Computing Device Access in Day Valley
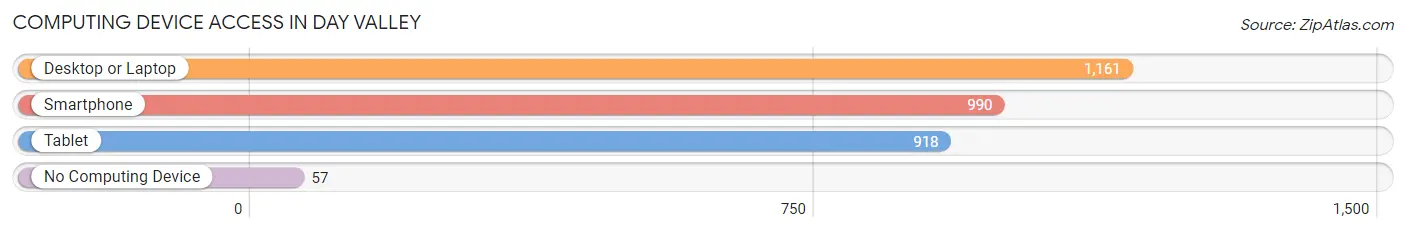
| Device Type | # Households | % Households |
| Desktop or Laptop | 1,161 | 93.9% |
| Smartphone | 990 | 80.0% |
| Tablet | 918 | 74.2% |
| No Computing Device | 57 | 4.6% |
| Total | 1,237 | 100.0% |
Internet Access in Day Valley
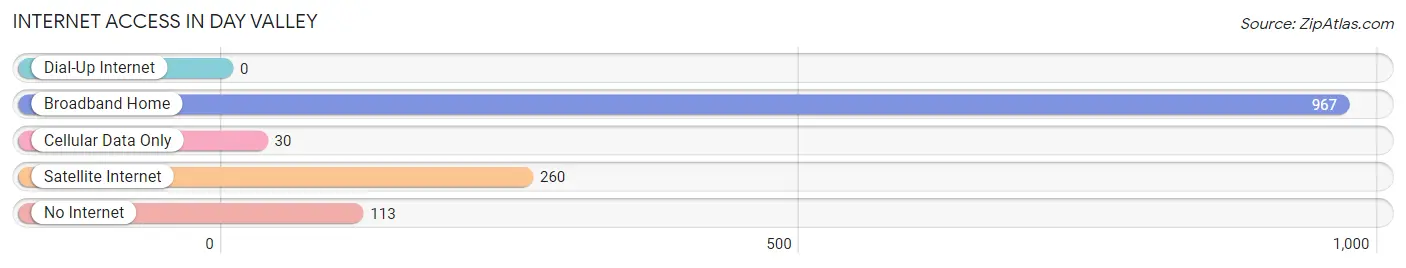
| Internet Type | # Households | % Households |
| Dial-Up Internet | 0 | 0.0% |
| Broadband Home | 967 | 78.2% |
| Cellular Data Only | 30 | 2.4% |
| Satellite Internet | 260 | 21.0% |
| No Internet | 113 | 9.1% |
| Total | 1,237 | 100.0% |
Day Valley Summary
Introduction
Day Valley is a small unincorporated community located in the Santa Cruz Mountains of Santa Clara County, California. It is situated in the foothills of the Santa Cruz Mountains, about 10 miles south of San Jose. The population of Day Valley is estimated to be around 1,000 people. The area is known for its rural atmosphere and its proximity to the Silicon Valley.
Geography
Day Valley is located in the Santa Cruz Mountains, which are part of the Pacific Coast Ranges. The area is characterized by steep hills and valleys, with elevations ranging from 500 to 2,000 feet. The climate is mild, with temperatures ranging from the mid-50s to the mid-70s in the summer and the mid-30s to the mid-50s in the winter. The area receives an average of 25 inches of rain per year.
The area is home to a variety of wildlife, including deer, coyotes, bobcats, mountain lions, and black bears. The area is also home to a variety of plant life, including oak, madrone, and redwood trees.
History
Day Valley was first settled in the late 1800s by farmers and ranchers. The area was originally known as "Day's Valley," after the Day family, who were among the first settlers. The area was later renamed "Day Valley" in the early 1900s.
In the early 1900s, the area was home to a number of small farms and ranches. The area was also home to a number of logging operations, which harvested the area's redwood trees.
In the 1950s, the area began to experience rapid growth as the Silicon Valley began to expand. The area was home to a number of tech companies, including Hewlett-Packard and Intel.
Economy
Day Valley is primarily a residential area, with a small number of businesses. The area is home to a number of small businesses, including restaurants, cafes, and retail stores. The area is also home to a number of tech companies, including Hewlett-Packard and Intel.
The area is also home to a number of wineries, including the Day Valley Winery. The winery produces a variety of wines, including Chardonnay, Pinot Noir, and Zinfandel.
Demographics
The population of Day Valley is estimated to be around 1,000 people. The area is primarily white, with a small Hispanic population. The median household income is estimated to be around $90,000.
Conclusion
Day Valley is a small unincorporated community located in the Santa Cruz Mountains of Santa Clara County, California. The area is known for its rural atmosphere and its proximity to the Silicon Valley. The area is home to a variety of wildlife and plant life, and is home to a number of small businesses and tech companies. The population of Day Valley is estimated to be around 1,000 people, and the median household income is estimated to be around $90,000.
Common Questions
What is Per Capita Income in Day Valley?
Per Capita income in Day Valley is $63,226.
What is the Median Family Income in Day Valley?
Median Family Income in Day Valley is $163,625.
What is the Median Household income in Day Valley?
Median Household Income in Day Valley is $143,295.
What is Income or Wage Gap in Day Valley?
Income or Wage Gap in Day Valley is 68.2%.
Women in Day Valley earn 31.8 cents for every dollar earned by a man.
What is Inequality or Gini Index in Day Valley?
Inequality or Gini Index in Day Valley is 0.46.
What is the Total Population of Day Valley?
Total Population of Day Valley is 3,252.
What is the Total Male Population of Day Valley?
Total Male Population of Day Valley is 1,497.
What is the Total Female Population of Day Valley?
Total Female Population of Day Valley is 1,755.
What is the Ratio of Males per 100 Females in Day Valley?
There are 85.30 Males per 100 Females in Day Valley.
What is the Ratio of Females per 100 Males in Day Valley?
There are 117.23 Females per 100 Males in Day Valley.
What is the Median Population Age in Day Valley?
Median Population Age in Day Valley is 54.7 Years.
What is the Average Family Size in Day Valley
Average Family Size in Day Valley is 3.0 People.
What is the Average Household Size in Day Valley
Average Household Size in Day Valley is 2.6 People.
How Large is the Labor Force in Day Valley?
There are 1,363 People in the Labor Forcein in Day Valley.
What is the Percentage of People in the Labor Force in Day Valley?
51.4% of People are in the Labor Force in Day Valley.
What is the Unemployment Rate in Day Valley?
Unemployment Rate in Day Valley is 4.5%.