Cities with the Lowest Poverty Level Among Married Couples in Connecticut
RELATED REPORTS & OPTIONS
Lowest Poverty | Married Couple
Connecticut
Compare Cities
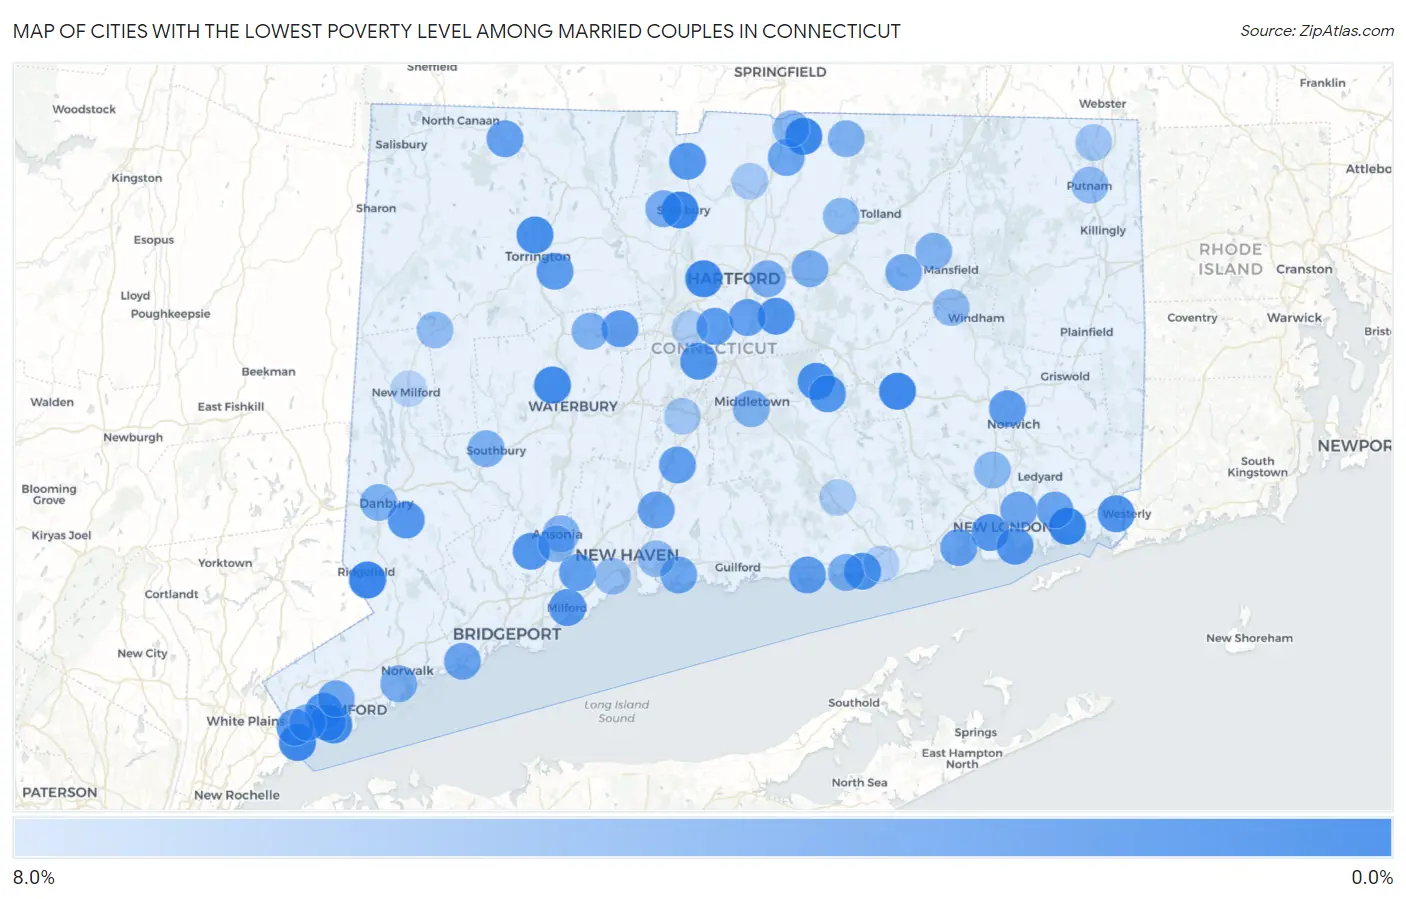
Map of Cities with the Lowest Poverty Level Among Married Couples in Connecticut
8.0%
0.0%
Cities with the Lowest Poverty Level Among Married Couples in Connecticut
| City | Married Couples Poverty | vs State | vs National | |
| 1. | Newtown Borough | 0.21% | 2.9%(-2.71)#1 | 4.5%(-4.25)#35 |
| 2. | Mystic | 0.37% | 2.9%(-2.55)#2 | 4.5%(-4.09)#115 |
| 3. | Sandy Hook | 0.42% | 2.9%(-2.51)#3 | 4.5%(-4.05)#159 |
| 4. | Simsbury Center | 0.44% | 2.9%(-2.48)#4 | 4.5%(-4.02)#183 |
| 5. | Ridgefield | 0.49% | 2.9%(-2.44)#5 | 4.5%(-3.97)#229 |
| 6. | Hazardville | 0.59% | 2.9%(-2.33)#6 | 4.5%(-3.87)#367 |
| 7. | West Hartford | 0.67% | 2.9%(-2.25)#7 | 4.5%(-3.79)#480 |
| 8. | Byram | 0.71% | 2.9%(-2.21)#8 | 4.5%(-3.75)#537 |
| 9. | Colchester | 0.73% | 2.9%(-2.19)#9 | 4.5%(-3.73)#579 |
| 10. | Tashua | 0.76% | 2.9%(-2.17)#10 | 4.5%(-3.71)#632 |
| 11. | Oakville | 0.78% | 2.9%(-2.14)#11 | 4.5%(-3.68)#697 |
| 12. | Woodmont Borough | 0.85% | 2.9%(-2.07)#12 | 4.5%(-3.61)#867 |
| 13. | Compo | 1.1% | 2.9%(-1.86)#13 | 4.5%(-3.40)#1,345 |
| 14. | Old Greenwich | 1.1% | 2.9%(-1.86)#14 | 4.5%(-3.40)#1,363 |
| 15. | Torrington | 1.2% | 2.9%(-1.72)#15 | 4.5%(-3.26)#1,680 |
| 16. | Lake Pocotopaug | 1.3% | 2.9%(-1.62)#16 | 4.5%(-3.16)#1,932 |
| 17. | Greens Farms | 1.3% | 2.9%(-1.58)#17 | 4.5%(-3.12)#2,045 |
| 18. | Naugatuck Borough | 1.3% | 2.9%(-1.58)#18 | 4.5%(-3.12)#2,056 |
| 19. | Cos Cob | 1.4% | 2.9%(-1.50)#19 | 4.5%(-3.03)#2,273 |
| 20. | Glastonbury Center | 1.5% | 2.9%(-1.47)#20 | 4.5%(-3.01)#2,361 |
| 21. | Pawcatuck | 1.5% | 2.9%(-1.38)#21 | 4.5%(-2.92)#2,598 |
| 22. | Saybrook Manor | 1.6% | 2.9%(-1.29)#22 | 4.5%(-2.83)#2,839 |
| 23. | Kensington | 1.6% | 2.9%(-1.27)#23 | 4.5%(-2.81)#2,889 |
| 24. | Shelton | 1.7% | 2.9%(-1.24)#24 | 4.5%(-2.78)#2,965 |
| 25. | Waterford | 1.7% | 2.9%(-1.21)#25 | 4.5%(-2.74)#3,057 |
| 26. | East Hampton | 1.7% | 2.9%(-1.19)#26 | 4.5%(-2.73)#3,102 |
| 27. | Stonington Borough | 1.8% | 2.9%(-1.14)#27 | 4.5%(-2.68)#3,230 |
| 28. | Litchfield Borough | 1.8% | 2.9%(-1.09)#28 | 4.5%(-2.63)#3,358 |
| 29. | Northford | 1.8% | 2.9%(-1.08)#29 | 4.5%(-2.62)#3,384 |
| 30. | Bethel | 1.9% | 2.9%(-1.04)#30 | 4.5%(-2.58)#3,481 |
| 31. | Groton | 1.9% | 2.9%(-0.997)#31 | 4.5%(-2.54)#3,582 |
| 32. | Trumbull Center | 2.0% | 2.9%(-0.971)#32 | 4.5%(-2.51)#3,629 |
| 33. | Riverside | 2.0% | 2.9%(-0.950)#33 | 4.5%(-2.49)#3,693 |
| 34. | Salmon Brook | 2.0% | 2.9%(-0.950)#34 | 4.5%(-2.49)#3,697 |
| 35. | Milford City Balance | 2.0% | 2.9%(-0.945)#35 | 4.5%(-2.48)#3,710 |
| 36. | Old Hill | 2.1% | 2.9%(-0.853)#36 | 4.5%(-2.39)#3,933 |
| 37. | Pemberwick | 2.1% | 2.9%(-0.853)#37 | 4.5%(-2.39)#3,935 |
| 38. | Newington | 2.2% | 2.9%(-0.694)#38 | 4.5%(-2.23)#4,370 |
| 39. | Northwest Harwinton | 2.3% | 2.9%(-0.658)#39 | 4.5%(-2.20)#4,454 |
| 40. | Bristol | 2.3% | 2.9%(-0.640)#40 | 4.5%(-2.18)#4,516 |
| 41. | Clinton | 2.3% | 2.9%(-0.608)#41 | 4.5%(-2.15)#4,584 |
| 42. | Norwich | 2.4% | 2.9%(-0.489)#42 | 4.5%(-2.03)#4,899 |
| 43. | Poplar Plains | 2.5% | 2.9%(-0.442)#43 | 4.5%(-1.98)#5,020 |
| 44. | Orange | 2.6% | 2.9%(-0.368)#44 | 4.5%(-1.91)#5,205 |
| 45. | Wallingford Center | 2.6% | 2.9%(-0.353)#45 | 4.5%(-1.89)#5,265 |
| 46. | North Haven | 2.7% | 2.9%(-0.245)#46 | 4.5%(-1.78)#5,507 |
| 47. | Wethersfield | 2.7% | 2.9%(-0.228)#47 | 4.5%(-1.77)#5,543 |
| 48. | Niantic | 2.7% | 2.9%(-0.180)#48 | 4.5%(-1.72)#5,672 |
| 49. | Norfolk | 2.8% | 2.9%(-0.086)#49 | 4.5%(-1.63)#5,885 |
| 50. | Old Mystic | 2.9% | 2.9%(+0.025)#50 | 4.5%(-1.51)#6,150 |
| 51. | Lordship | 3.0% | 2.9%(+0.100)#51 | 4.5%(-1.44)#6,319 |
| 52. | Southport | 3.1% | 2.9%(+0.132)#52 | 4.5%(-1.41)#6,396 |
| 53. | Branford Center | 3.1% | 2.9%(+0.202)#53 | 4.5%(-1.34)#6,541 |
| 54. | Southwood Acres | 3.2% | 2.9%(+0.277)#54 | 4.5%(-1.26)#6,722 |
| 55. | Noroton | 3.2% | 2.9%(+0.282)#55 | 4.5%(-1.26)#6,734 |
| 56. | Stamford | 3.3% | 2.9%(+0.330)#56 | 4.5%(-1.21)#6,843 |
| 57. | Daniels Farm | 3.3% | 2.9%(+0.372)#57 | 4.5%(-1.17)#6,934 |
| 58. | Conning Towers Nautilus Park | 3.3% | 2.9%(+0.391)#58 | 4.5%(-1.15)#6,969 |
| 59. | Tokeneke | 3.3% | 2.9%(+0.426)#59 | 4.5%(-1.11)#7,056 |
| 60. | New Canaan | 3.6% | 2.9%(+0.630)#60 | 4.5%(-0.908)#7,507 |
| 61. | South Coventry | 3.7% | 2.9%(+0.733)#61 | 4.5%(-0.806)#7,727 |
| 62. | Norwalk | 3.7% | 2.9%(+0.765)#62 | 4.5%(-0.773)#7,794 |
| 63. | West Simsbury | 3.8% | 2.9%(+0.834)#63 | 4.5%(-0.705)#7,934 |
| 64. | Manchester | 3.8% | 2.9%(+0.874)#64 | 4.5%(-0.665)#8,002 |
| 65. | East Hartford | 3.8% | 2.9%(+0.900)#65 | 4.5%(-0.638)#8,058 |
| 66. | Stepney | 3.9% | 2.9%(+0.937)#66 | 4.5%(-0.602)#8,161 |
| 67. | Ball Pond | 3.9% | 2.9%(+0.978)#67 | 4.5%(-0.560)#8,240 |
| 68. | Westbrook Center | 3.9% | 2.9%(+1.00)#68 | 4.5%(-0.536)#8,294 |
| 69. | Middletown | 4.0% | 2.9%(+1.11)#69 | 4.5%(-0.431)#8,503 |
| 70. | Heritage Village | 4.1% | 2.9%(+1.15)#70 | 4.5%(-0.393)#8,564 |
| 71. | Danbury | 4.1% | 2.9%(+1.15)#71 | 4.5%(-0.388)#8,572 |
| 72. | Terryville | 4.2% | 2.9%(+1.25)#72 | 4.5%(-0.291)#8,792 |
| 73. | Somers | 4.2% | 2.9%(+1.31)#73 | 4.5%(-0.233)#8,873 |
| 74. | Plattsville | 4.3% | 2.9%(+1.33)#74 | 4.5%(-0.207)#8,927 |
| 75. | Noroton Heights | 4.3% | 2.9%(+1.38)#75 | 4.5%(-0.158)#9,004 |
| 76. | Storrs | 4.3% | 2.9%(+1.41)#76 | 4.5%(-0.124)#9,047 |
| 77. | Ansonia | 4.4% | 2.9%(+1.47)#77 | 4.5%(-0.070)#9,161 |
| 78. | Greenwich | 4.4% | 2.9%(+1.50)#78 | 4.5%(-0.040)#9,222 |
| 79. | Derby | 4.6% | 2.9%(+1.68)#79 | 4.5%(+0.138)#9,531 |
| 80. | Coleytown | 4.6% | 2.9%(+1.72)#80 | 4.5%(+0.184)#9,604 |
| 81. | Sherwood Manor | 4.7% | 2.9%(+1.74)#81 | 4.5%(+0.204)#9,666 |
| 82. | Danielson Borough | 4.7% | 2.9%(+1.81)#82 | 4.5%(+0.272)#9,757 |
| 83. | Rockville | 4.8% | 2.9%(+1.85)#83 | 4.5%(+0.313)#9,830 |
| 84. | Oronoque | 4.8% | 2.9%(+1.86)#84 | 4.5%(+0.318)#9,840 |
| 85. | Oxoboxo River | 4.8% | 2.9%(+1.89)#85 | 4.5%(+0.352)#9,892 |
| 86. | Willimantic | 5.0% | 2.9%(+2.07)#86 | 4.5%(+0.532)#10,168 |
| 87. | East Haven | 5.0% | 2.9%(+2.09)#87 | 4.5%(+0.551)#10,230 |
| 88. | Putnam | 5.0% | 2.9%(+2.12)#88 | 4.5%(+0.578)#10,265 |
| 89. | Candlewood Orchards | 5.2% | 2.9%(+2.24)#89 | 4.5%(+0.699)#10,432 |
| 90. | West Haven | 5.2% | 2.9%(+2.31)#90 | 4.5%(+0.771)#10,532 |
| 91. | New Preston | 5.3% | 2.9%(+2.38)#91 | 4.5%(+0.841)#10,649 |
| 92. | North Grosvenor Dale | 6.0% | 2.9%(+3.05)#92 | 4.5%(+1.51)#11,631 |
| 93. | Staples | 6.1% | 2.9%(+3.13)#93 | 4.5%(+1.59)#11,722 |
| 94. | Meriden | 6.1% | 2.9%(+3.15)#94 | 4.5%(+1.61)#11,770 |
| 95. | Windsor Locks | 6.3% | 2.9%(+3.35)#95 | 4.5%(+1.81)#12,028 |
| 96. | Chester Center | 6.7% | 2.9%(+3.74)#96 | 4.5%(+2.20)#12,477 |
| 97. | New Britain | 6.7% | 2.9%(+3.77)#97 | 4.5%(+2.23)#12,536 |
| 98. | Stratford Downtown | 7.0% | 2.9%(+4.08)#98 | 4.5%(+2.54)#12,872 |
| 99. | Old Saybrook Center | 7.0% | 2.9%(+4.12)#99 | 4.5%(+2.58)#12,907 |
| 100. | New Milford | 7.2% | 2.9%(+4.32)#100 | 4.5%(+2.79)#13,146 |
1
2Common Questions
What are the Top 10 Cities with the Lowest Poverty Level Among Married Couples in Connecticut?
Top 10 Cities with the Lowest Poverty Level Among Married Couples in Connecticut are:
#1
0.37%
#2
0.44%
#3
0.49%
#4
0.59%
#5
0.67%
#6
0.71%
#7
0.73%
#8
0.78%
#9
1.1%
#10
1.2%
What city has the Lowest Poverty Level Among Married Couples in Connecticut?
Mystic has the Lowest Poverty Level Among Married Couples in Connecticut with 0.37%.
What is the Poverty Level Among Married Couples in the State of Connecticut?
Poverty Level Among Married Couples in Connecticut is 2.9%.
What is the Poverty Level Among Married Couples in the United States?
Poverty Level Among Married Couples in the United States is 4.5%.