Zip Codes with the Highest Percentage of Population Employed in Computer, Engineering & Science in Washington
RELATED REPORTS & OPTIONS
Computer, Engineering & Science
Washington
Compare Zip Codes
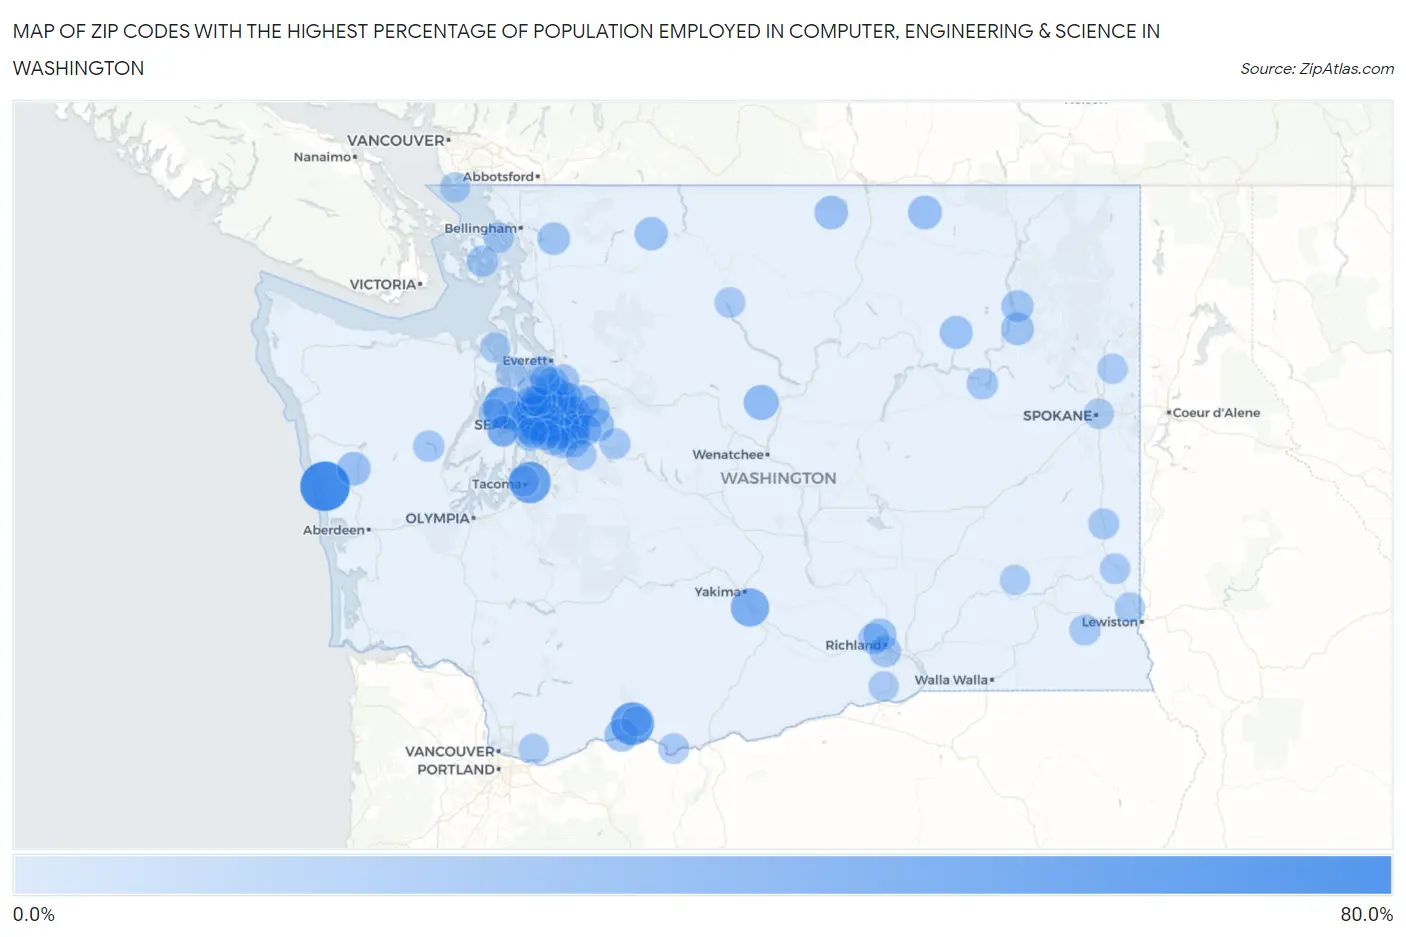
Map of Zip Codes with the Highest Percentage of Population Employed in Computer, Engineering & Science in Washington
0.0%
80.0%
Zip Codes with the Highest Percentage of Population Employed in Computer, Engineering & Science in Washington
| Zip Code | % Employed | vs State | vs National | |
| 1. | 98562 | 70.5% | 10.2%(+60.4)#1 | 6.8%(+63.7)#18 |
| 2. | 98623 | 50.0% | 10.2%(+39.8)#2 | 6.8%(+43.2)#44 |
| 3. | 98345 | 46.0% | 10.2%(+35.8)#3 | 6.8%(+39.2)#53 |
| 4. | 98421 | 45.5% | 10.2%(+35.3)#4 | 6.8%(+38.7)#55 |
| 5. | 98052 | 39.0% | 10.2%(+28.8)#5 | 6.8%(+32.2)#87 |
| 6. | 98007 | 38.7% | 10.2%(+28.6)#6 | 6.8%(+31.9)#89 |
| 7. | 98109 | 36.2% | 10.2%(+26.0)#7 | 6.8%(+29.4)#123 |
| 8. | 98939 | 35.5% | 10.2%(+25.3)#8 | 6.8%(+28.7)#128 |
| 9. | 98121 | 34.4% | 10.2%(+24.3)#9 | 6.8%(+27.7)#136 |
| 10. | 98005 | 33.6% | 10.2%(+23.4)#10 | 6.8%(+26.8)#139 |
| 11. | 98101 | 33.3% | 10.2%(+23.2)#11 | 6.8%(+26.6)#141 |
| 12. | 98004 | 32.4% | 10.2%(+22.2)#12 | 6.8%(+25.6)#152 |
| 13. | 98053 | 28.3% | 10.2%(+18.1)#13 | 6.8%(+21.5)#202 |
| 14. | 98074 | 27.3% | 10.2%(+17.1)#14 | 6.8%(+20.5)#224 |
| 15. | 98029 | 27.2% | 10.2%(+17.0)#15 | 6.8%(+20.4)#225 |
| 16. | 98195 | 26.9% | 10.2%(+16.7)#16 | 6.8%(+20.1)#233 |
| 17. | 98811 | 25.6% | 10.2%(+15.5)#17 | 6.8%(+18.9)#262 |
| 18. | 98107 | 24.9% | 10.2%(+14.7)#18 | 6.8%(+18.1)#280 |
| 19. | 98199 | 24.5% | 10.2%(+14.3)#19 | 6.8%(+17.7)#289 |
| 20. | 98033 | 24.4% | 10.2%(+14.2)#20 | 6.8%(+17.6)#291 |
| 21. | 98021 | 23.5% | 10.2%(+13.3)#21 | 6.8%(+16.7)#325 |
| 22. | 98075 | 23.4% | 10.2%(+13.2)#22 | 6.8%(+16.6)#330 |
| 23. | 98102 | 23.0% | 10.2%(+12.9)#23 | 6.8%(+16.3)#343 |
| 24. | 98122 | 22.5% | 10.2%(+12.3)#24 | 6.8%(+15.7)#371 |
| 25. | 98019 | 22.5% | 10.2%(+12.3)#25 | 6.8%(+15.7)#373 |
| 26. | 98164 | 22.3% | 10.2%(+12.2)#26 | 6.8%(+15.6)#374 |
| 27. | 98008 | 22.3% | 10.2%(+12.1)#27 | 6.8%(+15.5)#376 |
| 28. | 98115 | 21.7% | 10.2%(+11.5)#28 | 6.8%(+14.9)#400 |
| 29. | 98103 | 21.5% | 10.2%(+11.3)#29 | 6.8%(+14.7)#407 |
| 30. | 98859 | 21.4% | 10.2%(+11.3)#30 | 6.8%(+14.7)#411 |
| 31. | 98552 | 21.4% | 10.2%(+11.3)#31 | 6.8%(+14.7)#413 |
| 32. | 98072 | 21.0% | 10.2%(+10.9)#32 | 6.8%(+14.3)#437 |
| 33. | 98651 | 20.9% | 10.2%(+10.8)#33 | 6.8%(+14.2)#442 |
| 34. | 98827 | 20.8% | 10.2%(+10.6)#34 | 6.8%(+14.0)#452 |
| 35. | 98011 | 20.7% | 10.2%(+10.6)#35 | 6.8%(+14.0)#457 |
| 36. | 98006 | 20.6% | 10.2%(+10.4)#36 | 6.8%(+13.8)#466 |
| 37. | 98034 | 20.5% | 10.2%(+10.4)#37 | 6.8%(+13.8)#476 |
| 38. | 98012 | 19.9% | 10.2%(+9.70)#38 | 6.8%(+13.1)#523 |
| 39. | 98104 | 19.7% | 10.2%(+9.56)#39 | 6.8%(+13.0)#532 |
| 40. | 98283 | 19.7% | 10.2%(+9.52)#40 | 6.8%(+12.9)#534 |
| 41. | 98065 | 19.5% | 10.2%(+9.34)#41 | 6.8%(+12.7)#554 |
| 42. | 99140 | 19.4% | 10.2%(+9.22)#42 | 6.8%(+12.6)#564 |
| 43. | 99354 | 19.2% | 10.2%(+9.09)#43 | 6.8%(+12.5)#572 |
| 44. | 98112 | 19.0% | 10.2%(+8.86)#44 | 6.8%(+12.3)#591 |
| 45. | 98028 | 18.9% | 10.2%(+8.73)#45 | 6.8%(+12.1)#600 |
| 46. | 99137 | 18.8% | 10.2%(+8.66)#46 | 6.8%(+12.1)#609 |
| 47. | 98119 | 18.0% | 10.2%(+7.86)#47 | 6.8%(+11.3)#679 |
| 48. | 98220 | 17.9% | 10.2%(+7.72)#48 | 6.8%(+11.1)#694 |
| 49. | 98077 | 17.6% | 10.2%(+7.45)#49 | 6.8%(+10.8)#736 |
| 50. | 98105 | 17.6% | 10.2%(+7.42)#50 | 6.8%(+10.8)#741 |
| 51. | 98144 | 17.2% | 10.2%(+7.06)#51 | 6.8%(+10.5)#789 |
| 52. | 98027 | 17.1% | 10.2%(+6.94)#52 | 6.8%(+10.3)#800 |
| 53. | 98040 | 16.9% | 10.2%(+6.77)#53 | 6.8%(+10.2)#822 |
| 54. | 99131 | 16.7% | 10.2%(+6.51)#54 | 6.8%(+9.90)#863 |
| 55. | 99352 | 15.9% | 10.2%(+5.78)#55 | 6.8%(+9.17)#968 |
| 56. | 98014 | 15.9% | 10.2%(+5.77)#56 | 6.8%(+9.16)#972 |
| 57. | 98136 | 15.7% | 10.2%(+5.53)#57 | 6.8%(+8.93)#1,005 |
| 58. | 98117 | 15.4% | 10.2%(+5.23)#58 | 6.8%(+8.63)#1,047 |
| 59. | 98116 | 15.2% | 10.2%(+5.07)#59 | 6.8%(+8.47)#1,082 |
| 60. | 98125 | 15.0% | 10.2%(+4.85)#60 | 6.8%(+8.24)#1,120 |
| 61. | 98155 | 14.8% | 10.2%(+4.66)#61 | 6.8%(+8.06)#1,147 |
| 62. | 98059 | 14.7% | 10.2%(+4.58)#62 | 6.8%(+7.98)#1,165 |
| 63. | 98548 | 14.6% | 10.2%(+4.46)#63 | 6.8%(+7.86)#1,191 |
| 64. | 99353 | 14.5% | 10.2%(+4.32)#64 | 6.8%(+7.71)#1,229 |
| 65. | 99147 | 14.3% | 10.2%(+4.13)#65 | 6.8%(+7.52)#1,268 |
| 66. | 98222 | 14.3% | 10.2%(+4.13)#66 | 6.8%(+7.52)#1,270 |
| 67. | 98296 | 14.1% | 10.2%(+3.99)#67 | 6.8%(+7.39)#1,301 |
| 68. | 98045 | 13.8% | 10.2%(+3.69)#68 | 6.8%(+7.08)#1,389 |
| 69. | 98024 | 13.6% | 10.2%(+3.49)#69 | 6.8%(+6.88)#1,444 |
| 70. | 98340 | 13.5% | 10.2%(+3.36)#70 | 6.8%(+6.75)#1,473 |
| 71. | 98039 | 13.4% | 10.2%(+3.23)#71 | 6.8%(+6.62)#1,508 |
| 72. | 99174 | 13.3% | 10.2%(+3.17)#72 | 6.8%(+6.57)#1,529 |
| 73. | 98403 | 13.3% | 10.2%(+3.13)#73 | 6.8%(+6.52)#1,544 |
| 74. | 98110 | 13.3% | 10.2%(+3.09)#74 | 6.8%(+6.49)#1,557 |
| 75. | 98056 | 13.2% | 10.2%(+2.99)#75 | 6.8%(+6.39)#1,587 |
| 76. | 98177 | 13.1% | 10.2%(+2.95)#76 | 6.8%(+6.34)#1,602 |
| 77. | 98118 | 13.1% | 10.2%(+2.93)#77 | 6.8%(+6.32)#1,614 |
| 78. | 99347 | 13.1% | 10.2%(+2.91)#78 | 6.8%(+6.30)#1,626 |
| 79. | 98337 | 13.0% | 10.2%(+2.84)#79 | 6.8%(+6.24)#1,648 |
| 80. | 98133 | 12.8% | 10.2%(+2.62)#80 | 6.8%(+6.01)#1,721 |
| 81. | 98617 | 12.7% | 10.2%(+2.56)#81 | 6.8%(+5.95)#1,741 |
| 82. | 98020 | 12.6% | 10.2%(+2.45)#82 | 6.8%(+5.84)#1,789 |
| 83. | 98314 | 12.5% | 10.2%(+2.34)#83 | 6.8%(+5.74)#1,817 |
| 84. | 98852 | 12.5% | 10.2%(+2.34)#84 | 6.8%(+5.74)#1,824 |
| 85. | 98126 | 12.5% | 10.2%(+2.32)#85 | 6.8%(+5.72)#1,832 |
| 86. | 98275 | 12.4% | 10.2%(+2.26)#86 | 6.8%(+5.66)#1,857 |
| 87. | 98672 | 12.2% | 10.2%(+2.08)#87 | 6.8%(+5.47)#1,927 |
| 88. | 98038 | 12.0% | 10.2%(+1.87)#88 | 6.8%(+5.27)#2,023 |
| 89. | 99163 | 11.9% | 10.2%(+1.77)#89 | 6.8%(+5.17)#2,065 |
| 90. | 98262 | 11.9% | 10.2%(+1.76)#90 | 6.8%(+5.15)#2,074 |
| 91. | 98358 | 11.7% | 10.2%(+1.54)#91 | 6.8%(+4.93)#2,180 |
| 92. | 98281 | 11.7% | 10.2%(+1.53)#92 | 6.8%(+4.93)#2,182 |
| 93. | 98087 | 11.7% | 10.2%(+1.51)#93 | 6.8%(+4.90)#2,199 |
| 94. | 99258 | 11.7% | 10.2%(+1.51)#94 | 6.8%(+4.90)#2,200 |
| 95. | 98383 | 11.5% | 10.2%(+1.36)#95 | 6.8%(+4.76)#2,286 |
| 96. | 99003 | 11.4% | 10.2%(+1.20)#96 | 6.8%(+4.60)#2,372 |
| 97. | 99333 | 11.3% | 10.2%(+1.16)#97 | 6.8%(+4.56)#2,397 |
| 98. | 99179 | 11.3% | 10.2%(+1.10)#98 | 6.8%(+4.49)#2,436 |
| 99. | 99346 | 11.1% | 10.2%(+0.951)#99 | 6.8%(+4.35)#2,507 |
| 100. | 98607 | 11.1% | 10.2%(+0.941)#100 | 6.8%(+4.34)#2,514 |
Common Questions
What are the Top 10 Zip Codes with the Highest Percentage of Population Employed in Computer, Engineering & Science in Washington?
Top 10 Zip Codes with the Highest Percentage of Population Employed in Computer, Engineering & Science in Washington are:
What zip code has the Highest Percentage of Population Employed in Computer, Engineering & Science in Washington?
98562 has the Highest Percentage of Population Employed in Computer, Engineering & Science in Washington with 70.5%.
What is the Percentage of Population Employed in Computer, Engineering & Science in the State of Washington?
Percentage of Population Employed in Computer, Engineering & Science in Washington is 10.2%.
What is the Percentage of Population Employed in Computer, Engineering & Science in the United States?
Percentage of Population Employed in Computer, Engineering & Science in the United States is 6.8%.