Keller, WA Map & Demographics
Keller Map
Keller Overview
$25,999
PER CAPITA INCOME
$70,000
AVG FAMILY INCOME
$57,500
AVG HOUSEHOLD INCOME
61.4%
WAGE / INCOME GAP [ % ]
38.6¢/ $1
WAGE / INCOME GAP [ $ ]
0.33
INEQUALITY / GINI INDEX
256
TOTAL POPULATION
152
MALE POPULATION
104
FEMALE POPULATION
146.15
MALES / 100 FEMALES
68.42
FEMALES / 100 MALES
47.0
MEDIAN AGE
2.4
AVG FAMILY SIZE
2.2
AVG HOUSEHOLD SIZE
106
LABOR FORCE [ PEOPLE ]
47.5%
PERCENT IN LABOR FORCE
5.7%
UNEMPLOYMENT RATE
Keller Zip Codes
Keller Area Codes
Income in Keller
Income Overview in Keller
Per Capita Income in Keller is $25,999, while median incomes of families and households are $70,000 and $57,500 respectively.
| Characteristic | Number | Measure |
| Per Capita Income | 256 | $25,999 |
| Median Family Income | 92 | $70,000 |
| Mean Family Income | 92 | $60,990 |
| Median Household Income | 118 | $57,500 |
| Mean Household Income | 118 | $53,762 |
| Income Deficit | 92 | $0 |
| Wage / Income Gap (%) | 256 | 61.43% |
| Wage / Income Gap ($) | 256 | 38.57¢ per $1 |
| Gini / Inequality Index | 256 | 0.33 |
Earnings by Sex in Keller
Average Earnings in Keller are $46,563, $60,184 for men and $23,214 for women, a difference of 61.4%.
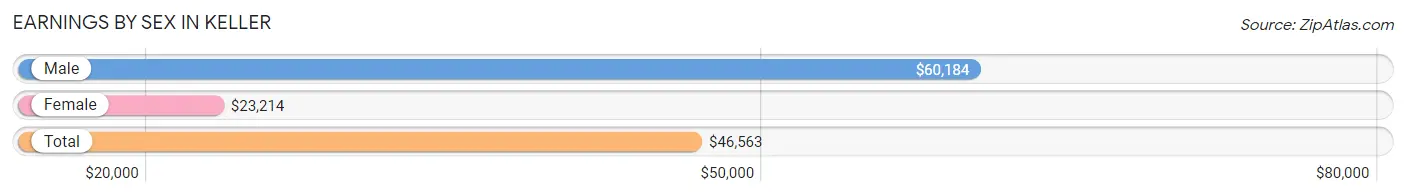
| Sex | Number | Average Earnings |
| Male | 85 (73.9%) | $60,184 |
| Female | 30 (26.1%) | $23,214 |
| Total | 115 (100.0%) | $46,563 |
Earnings by Sex by Income Bracket in Keller
The most common earnings brackets in Keller are $55,000 to $64,999 for men (34 | 40.0%) and $22,500 to $24,999 for women (7 | 23.3%).
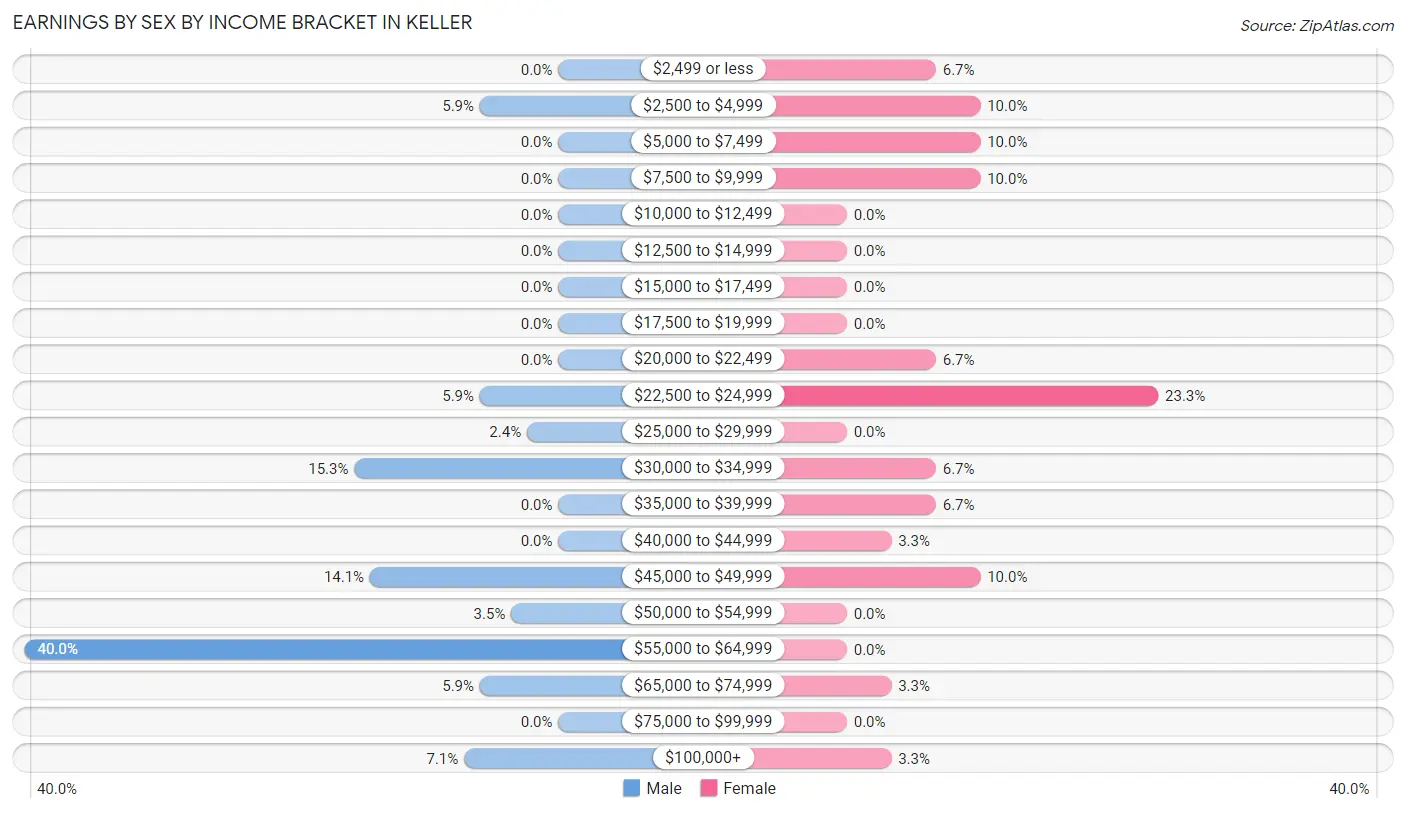
| Income | Male | Female |
| $2,499 or less | 0 (0.0%) | 2 (6.7%) |
| $2,500 to $4,999 | 5 (5.9%) | 3 (10.0%) |
| $5,000 to $7,499 | 0 (0.0%) | 3 (10.0%) |
| $7,500 to $9,999 | 0 (0.0%) | 3 (10.0%) |
| $10,000 to $12,499 | 0 (0.0%) | 0 (0.0%) |
| $12,500 to $14,999 | 0 (0.0%) | 0 (0.0%) |
| $15,000 to $17,499 | 0 (0.0%) | 0 (0.0%) |
| $17,500 to $19,999 | 0 (0.0%) | 0 (0.0%) |
| $20,000 to $22,499 | 0 (0.0%) | 2 (6.7%) |
| $22,500 to $24,999 | 5 (5.9%) | 7 (23.3%) |
| $25,000 to $29,999 | 2 (2.4%) | 0 (0.0%) |
| $30,000 to $34,999 | 13 (15.3%) | 2 (6.7%) |
| $35,000 to $39,999 | 0 (0.0%) | 2 (6.7%) |
| $40,000 to $44,999 | 0 (0.0%) | 1 (3.3%) |
| $45,000 to $49,999 | 12 (14.1%) | 3 (10.0%) |
| $50,000 to $54,999 | 3 (3.5%) | 0 (0.0%) |
| $55,000 to $64,999 | 34 (40.0%) | 0 (0.0%) |
| $65,000 to $74,999 | 5 (5.9%) | 1 (3.3%) |
| $75,000 to $99,999 | 0 (0.0%) | 0 (0.0%) |
| $100,000+ | 6 (7.1%) | 1 (3.3%) |
| Total | 85 (100.0%) | 30 (100.0%) |
Earnings by Sex by Educational Attainment in Keller
Average earnings in Keller are $60,515 for men and $24,464 for women, a difference of 59.6%. Men with an educational attainment of high school diploma enjoy the highest average annual earnings of $61,103, while those with college or associate's degree education earn the least with $45,625. Women with an educational attainment of college or associate's degree earn the most with the average annual earnings of $42,500, while those with high school diploma education have the smallest earnings of $24,375.
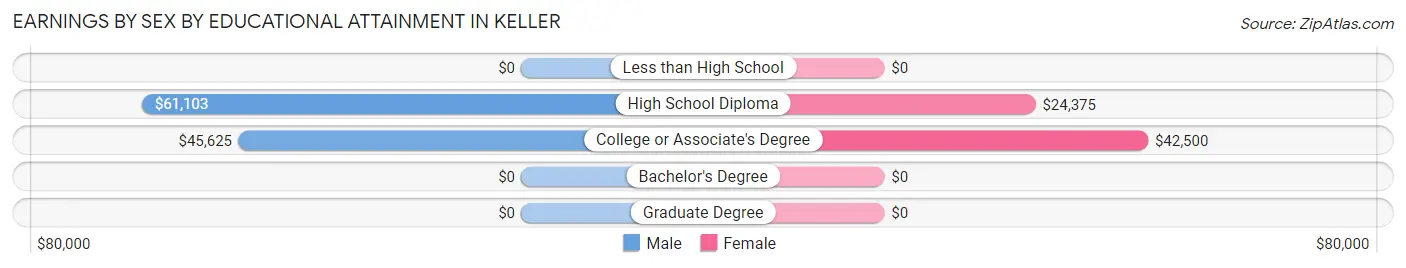
| Educational Attainment | Male Income | Female Income |
| Less than High School | - | - |
| High School Diploma | $61,103 | $24,375 |
| College or Associate's Degree | $45,625 | $42,500 |
| Bachelor's Degree | - | - |
| Graduate Degree | - | - |
| Total | $60,515 | $24,464 |
Family Income in Keller
Family Income Brackets in Keller
According to the Keller family income data, there are 48 families falling into the $50,000 to $74,999 income range, which is the most common income bracket and makes up 52.2% of all families.
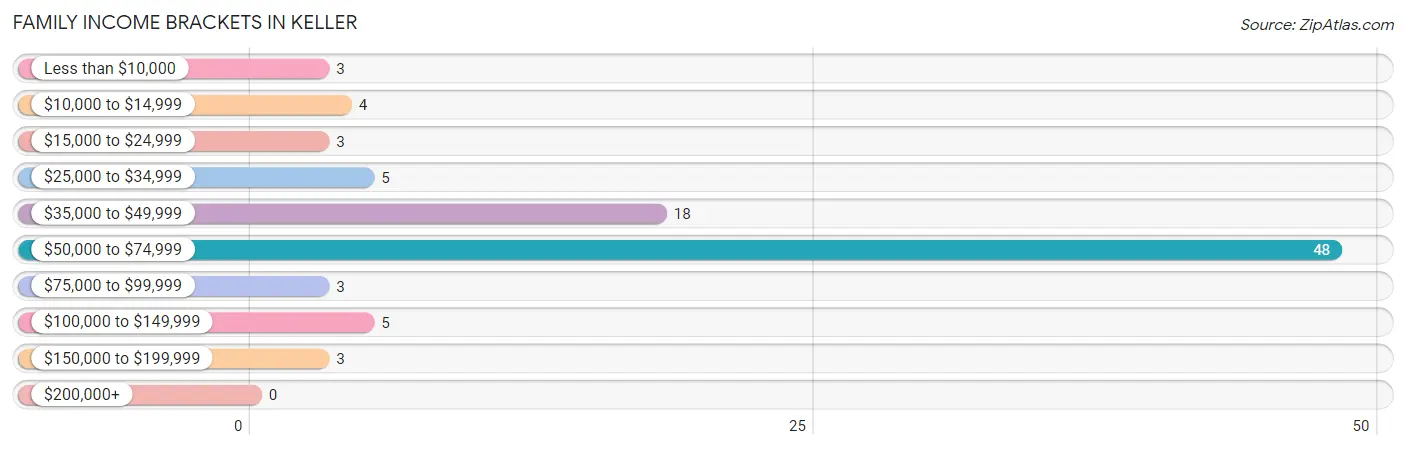
| Income Bracket | # Families | % Families |
| Less than $10,000 | 3 | 3.3% |
| $10,000 to $14,999 | 4 | 4.3% |
| $15,000 to $24,999 | 3 | 3.3% |
| $25,000 to $34,999 | 5 | 5.4% |
| $35,000 to $49,999 | 18 | 19.6% |
| $50,000 to $74,999 | 48 | 52.2% |
| $75,000 to $99,999 | 3 | 3.3% |
| $100,000 to $149,999 | 5 | 5.4% |
| $150,000 to $199,999 | 3 | 3.3% |
| $200,000+ | 0 | 0.0% |
Family Income by Famaliy Size in Keller
5-person families (46 | 50.0%) account for the highest median family income in Keller with $71,029 per family, while 2-person families (32 | 34.8%) have the highest median income of $20,866 per family member.
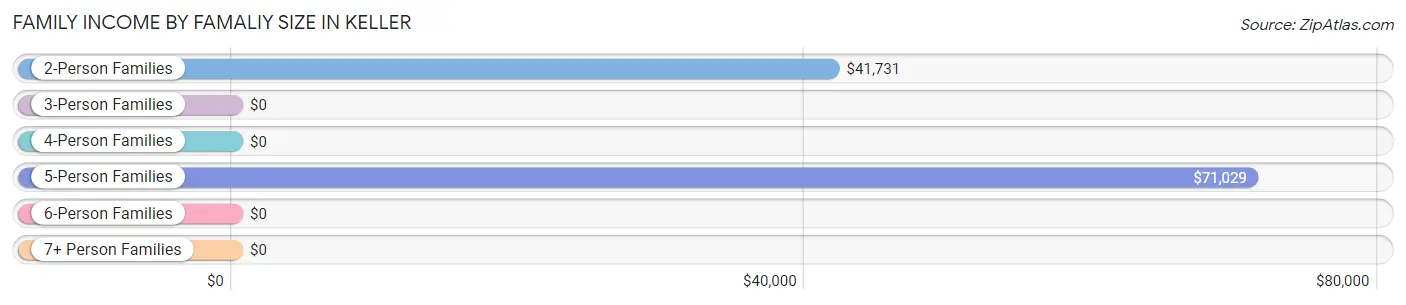
| Income Bracket | # Families | Median Income |
| 2-Person Families | 32 (34.8%) | $41,731 |
| 3-Person Families | 4 (4.3%) | $0 |
| 4-Person Families | 10 (10.9%) | $0 |
| 5-Person Families | 46 (50.0%) | $71,029 |
| 6-Person Families | 0 (0.0%) | $0 |
| 7+ Person Families | 0 (0.0%) | $0 |
| Total | 92 (100.0%) | $70,000 |
Family Income by Number of Earners in Keller
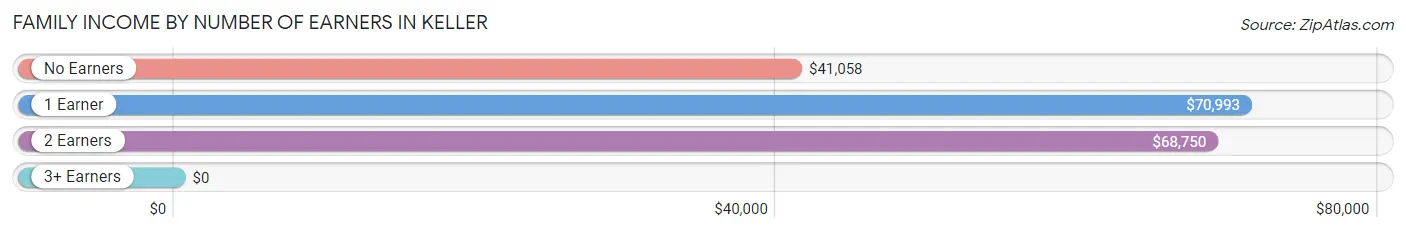
| Number of Earners | # Families | Median Income |
| No Earners | 23 (25.0%) | $41,058 |
| 1 Earner | 51 (55.4%) | $70,993 |
| 2 Earners | 14 (15.2%) | $68,750 |
| 3+ Earners | 4 (4.3%) | $0 |
| Total | 92 (100.0%) | $70,000 |
Household Income in Keller
Household Income Brackets in Keller
With 51 households falling in the category, the $50,000 to $74,999 income range is the most frequent in Keller, accounting for 43.2% of all households.
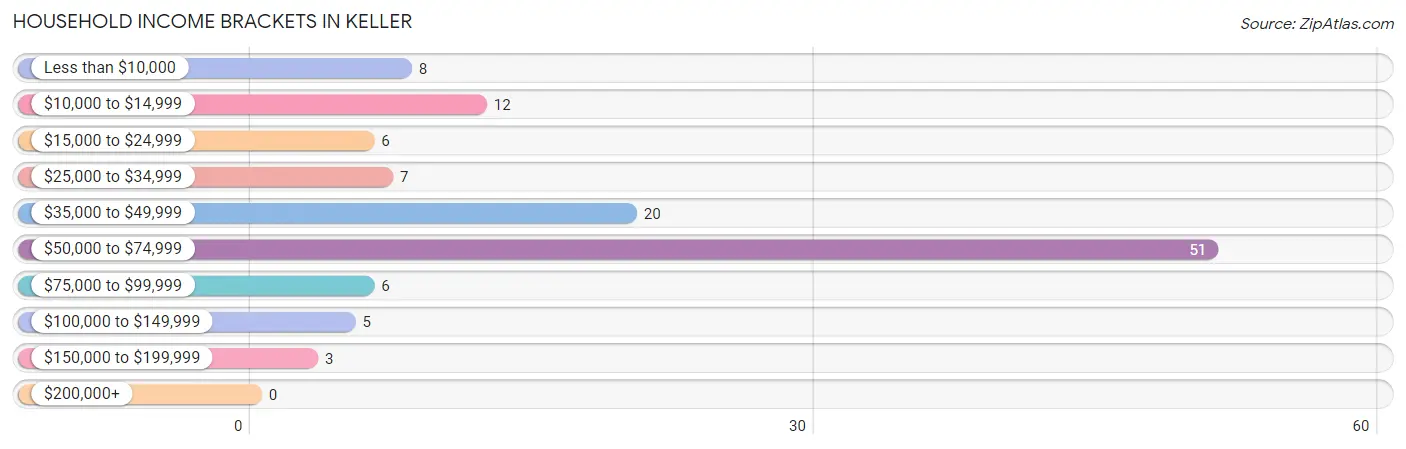
| Income Bracket | # Households | % Households |
| Less than $10,000 | 8 | 6.8% |
| $10,000 to $14,999 | 12 | 10.2% |
| $15,000 to $24,999 | 6 | 5.1% |
| $25,000 to $34,999 | 7 | 5.9% |
| $35,000 to $49,999 | 20 | 16.9% |
| $50,000 to $74,999 | 51 | 43.2% |
| $75,000 to $99,999 | 6 | 5.1% |
| $100,000 to $149,999 | 5 | 4.2% |
| $150,000 to $199,999 | 3 | 2.5% |
| $200,000+ | 0 | 0.0% |
Household Income by Householder Age in Keller
The median household income in Keller is $57,500, with the highest median household income of $70,294 found in the 65+ years age bracket for the primary householder. A total of 66 households (55.9%) fall into this category.
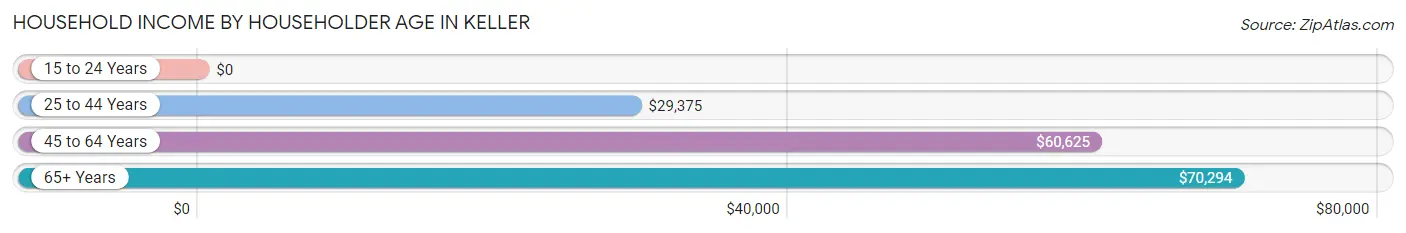
| Income Bracket | # Households | Median Income |
| 15 to 24 Years | 0 (0.0%) | $0 |
| 25 to 44 Years | 29 (24.6%) | $29,375 |
| 45 to 64 Years | 23 (19.5%) | $60,625 |
| 65+ Years | 66 (55.9%) | $70,294 |
| Total | 118 (100.0%) | $57,500 |
Poverty in Keller
Income Below Poverty by Sex and Age in Keller
With 15.8% poverty level for males and 24.0% for females among the residents of Keller, 12 to 14 year old males and 18 to 24 year old females are the most vulnerable to poverty, with 3 males (100.0%) and 3 females (100.0%) in their respective age groups living below the poverty level.
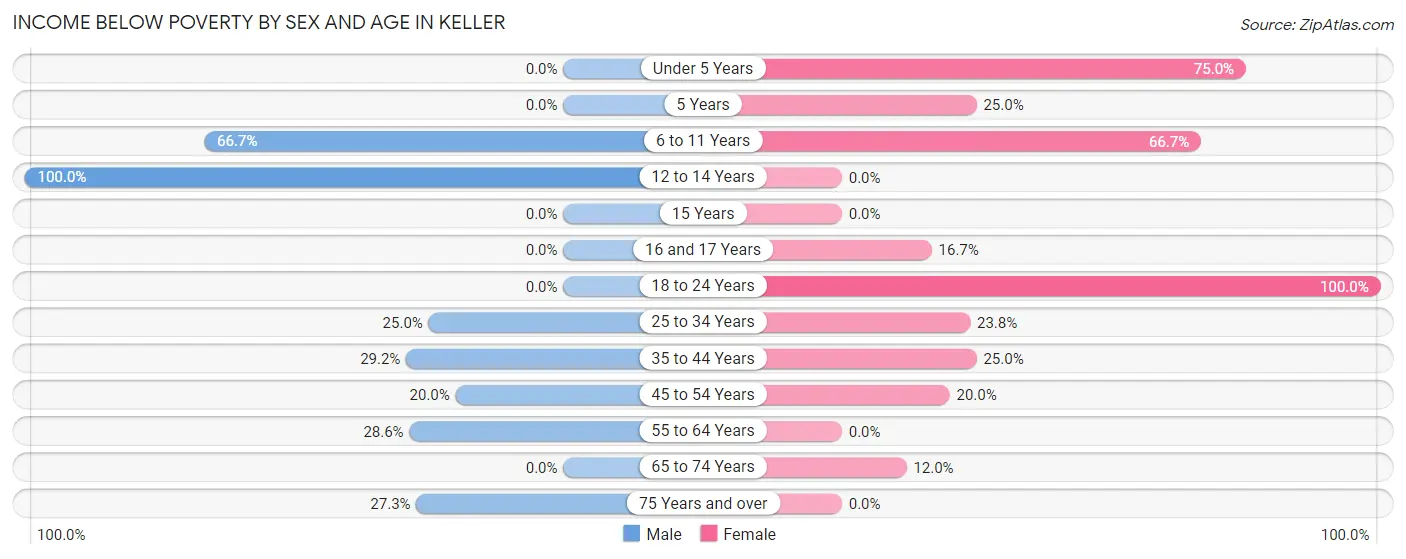
| Age Bracket | Male | Female |
| Under 5 Years | 0 (0.0%) | 3 (75.0%) |
| 5 Years | 0 (0.0%) | 1 (25.0%) |
| 6 to 11 Years | 2 (66.7%) | 6 (66.7%) |
| 12 to 14 Years | 3 (100.0%) | 0 (0.0%) |
| 15 Years | 0 (0.0%) | 0 (0.0%) |
| 16 and 17 Years | 0 (0.0%) | 1 (16.7%) |
| 18 to 24 Years | 0 (0.0%) | 3 (100.0%) |
| 25 to 34 Years | 4 (25.0%) | 5 (23.8%) |
| 35 to 44 Years | 7 (29.2%) | 1 (25.0%) |
| 45 to 54 Years | 3 (20.0%) | 2 (20.0%) |
| 55 to 64 Years | 2 (28.6%) | 0 (0.0%) |
| 65 to 74 Years | 0 (0.0%) | 3 (12.0%) |
| 75 Years and over | 3 (27.3%) | 0 (0.0%) |
| Total | 24 (15.8%) | 25 (24.0%) |
Income Above Poverty by Sex and Age in Keller
According to the poverty statistics in Keller, males aged under 5 years and females aged 12 to 14 years are the age groups that are most secure financially, with 100.0% of males and 100.0% of females in these age groups living above the poverty line.
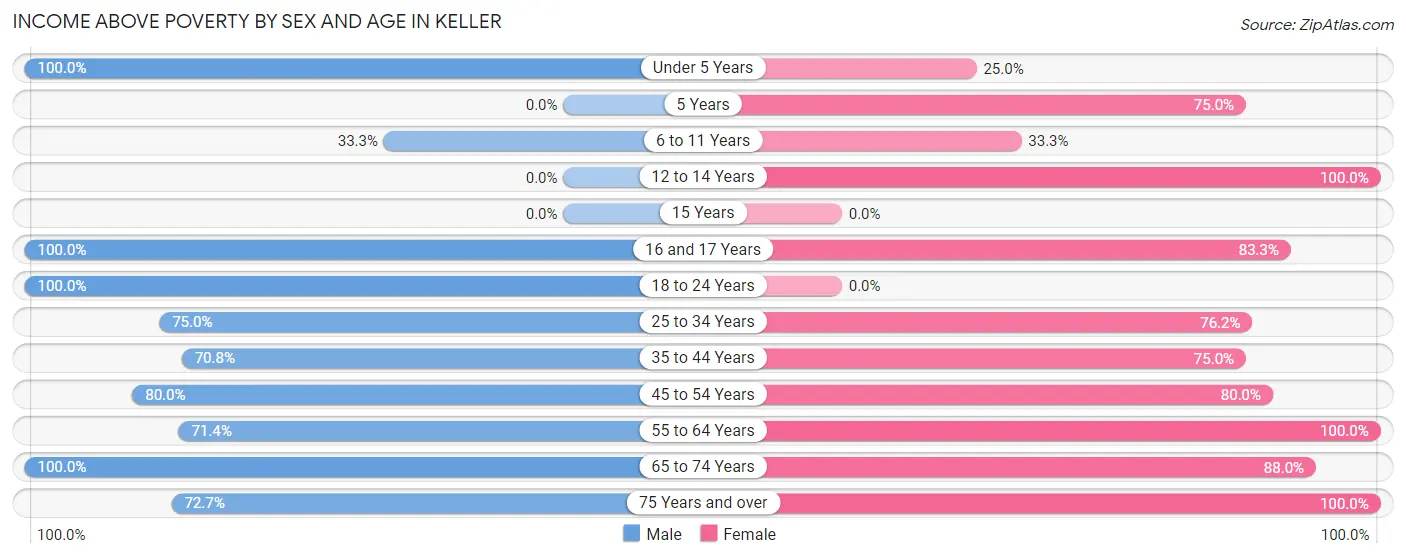
| Age Bracket | Male | Female |
| Under 5 Years | 7 (100.0%) | 1 (25.0%) |
| 5 Years | 0 (0.0%) | 3 (75.0%) |
| 6 to 11 Years | 1 (33.3%) | 3 (33.3%) |
| 12 to 14 Years | 0 (0.0%) | 3 (100.0%) |
| 15 Years | 0 (0.0%) | 0 (0.0%) |
| 16 and 17 Years | 2 (100.0%) | 5 (83.3%) |
| 18 to 24 Years | 15 (100.0%) | 0 (0.0%) |
| 25 to 34 Years | 12 (75.0%) | 16 (76.2%) |
| 35 to 44 Years | 17 (70.8%) | 3 (75.0%) |
| 45 to 54 Years | 12 (80.0%) | 8 (80.0%) |
| 55 to 64 Years | 5 (71.4%) | 12 (100.0%) |
| 65 to 74 Years | 49 (100.0%) | 22 (88.0%) |
| 75 Years and over | 8 (72.7%) | 3 (100.0%) |
| Total | 128 (84.2%) | 79 (76.0%) |
Income Below Poverty Among Married-Couple Families in Keller
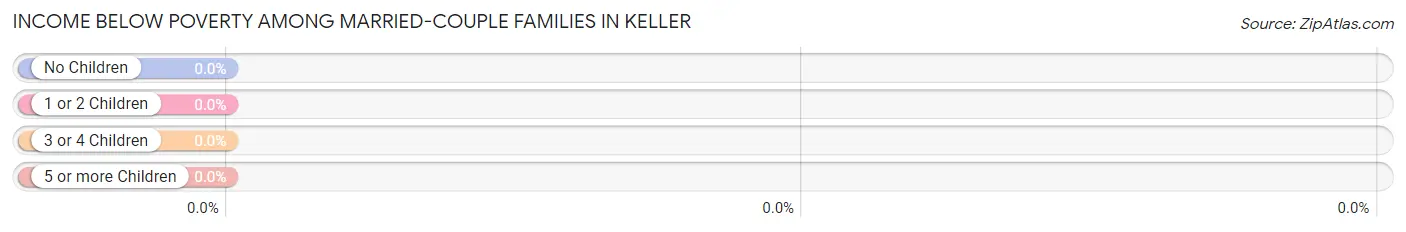
| Children | Above Poverty | Below Poverty |
| No Children | 43 (100.0%) | 0 (0.0%) |
| 1 or 2 Children | 8 (100.0%) | 0 (0.0%) |
| 3 or 4 Children | 0 (0.0%) | 0 (0.0%) |
| 5 or more Children | 0 (0.0%) | 0 (0.0%) |
| Total | 51 (100.0%) | 0 (0.0%) |
Income Below Poverty Among Single-Parent Households in Keller
According to the poverty data in Keller, 27.8% or 5 single-father households and 21.7% or 5 single-mother households are living below the poverty line. Among single-father households, those with 3 or 4 children have the highest poverty rate, with 5 households (71.4%) experiencing poverty. Likewise, among single-mother households, those with 3 or 4 children have the highest poverty rate, with 3 households (100.0%) falling below the poverty line.
| Children | Single Father | Single Mother |
| No Children | 0 (0.0%) | 1 (6.2%) |
| 1 or 2 Children | 0 (0.0%) | 1 (25.0%) |
| 3 or 4 Children | 5 (71.4%) | 3 (100.0%) |
| 5 or more Children | 0 (0.0%) | 0 (0.0%) |
| Total | 5 (27.8%) | 5 (21.7%) |
Income Below Poverty Among Married-Couple vs Single-Parent Households in Keller
| Children | Married-Couple Families | Single-Parent Households |
| No Children | 0 (0.0%) | 1 (5.0%) |
| 1 or 2 Children | 0 (0.0%) | 1 (9.1%) |
| 3 or 4 Children | 0 (0.0%) | 8 (80.0%) |
| 5 or more Children | 0 (0.0%) | 0 (0.0%) |
| Total | 0 (0.0%) | 10 (24.4%) |
Race in Keller
The most populous races in Keller are Native / Alaskan (226 | 88.3%), White / Caucasian (27 | 10.5%), and Hispanic or Latino (7 | 2.7%).
| Race | # Population | % Population |
| Asian | 0 | 0.0% |
| Black / African American | 2 | 0.8% |
| Hawaiian / Pacific | 0 | 0.0% |
| Hispanic or Latino | 7 | 2.7% |
| Native / Alaskan | 226 | 88.3% |
| White / Caucasian | 27 | 10.5% |
| Two or more Races | 1 | 0.4% |
| Some other Race | 0 | 0.0% |
| Total | 256 | 100.0% |
Ancestry in Keller
The most populous ancestries reported in Keller are Colville (174 | 68.0%), Navajo (34 | 13.3%), American (18 | 7.0%), Mexican (7 | 2.7%), and Blackfeet (4 | 1.6%), together accounting for 92.6% of all Keller residents.
| Ancestry | # Population | % Population |
| American | 18 | 7.0% |
| Blackfeet | 4 | 1.6% |
| Colville | 174 | 68.0% |
| Crow | 2 | 0.8% |
| French Canadian | 2 | 0.8% |
| Mexican | 7 | 2.7% |
| Navajo | 34 | 13.3% |
| Norwegian | 2 | 0.8% |
| Scottish | 3 | 1.2% |
| West Indian | 2 | 0.8% |
| Yakama | 1 | 0.4% | View All 11 Rows |
Immigrants in Keller
The most numerous immigrant groups reported in Keller came from Caribbean (2 | 0.8%), and Latin America (2 | 0.8%), together accounting for 1.6% of all Keller residents.
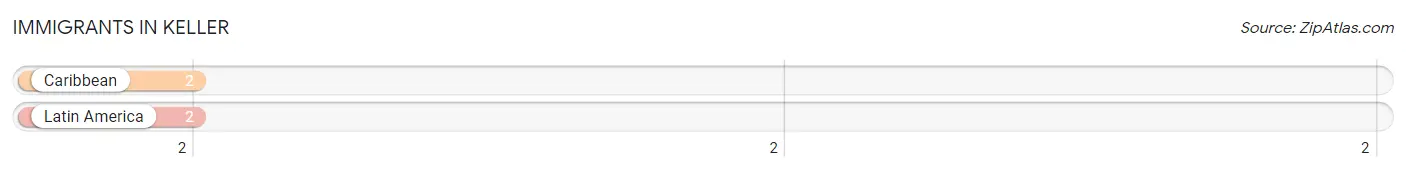
| Immigration Origin | # Population | % Population |
| Caribbean | 2 | 0.8% |
| Latin America | 2 | 0.8% | View All 2 Rows |
Sex and Age in Keller
Sex and Age in Keller
The most populous age groups in Keller are 70 to 74 Years (35 | 23.0%) for men and 70 to 74 Years (18 | 17.3%) for women.
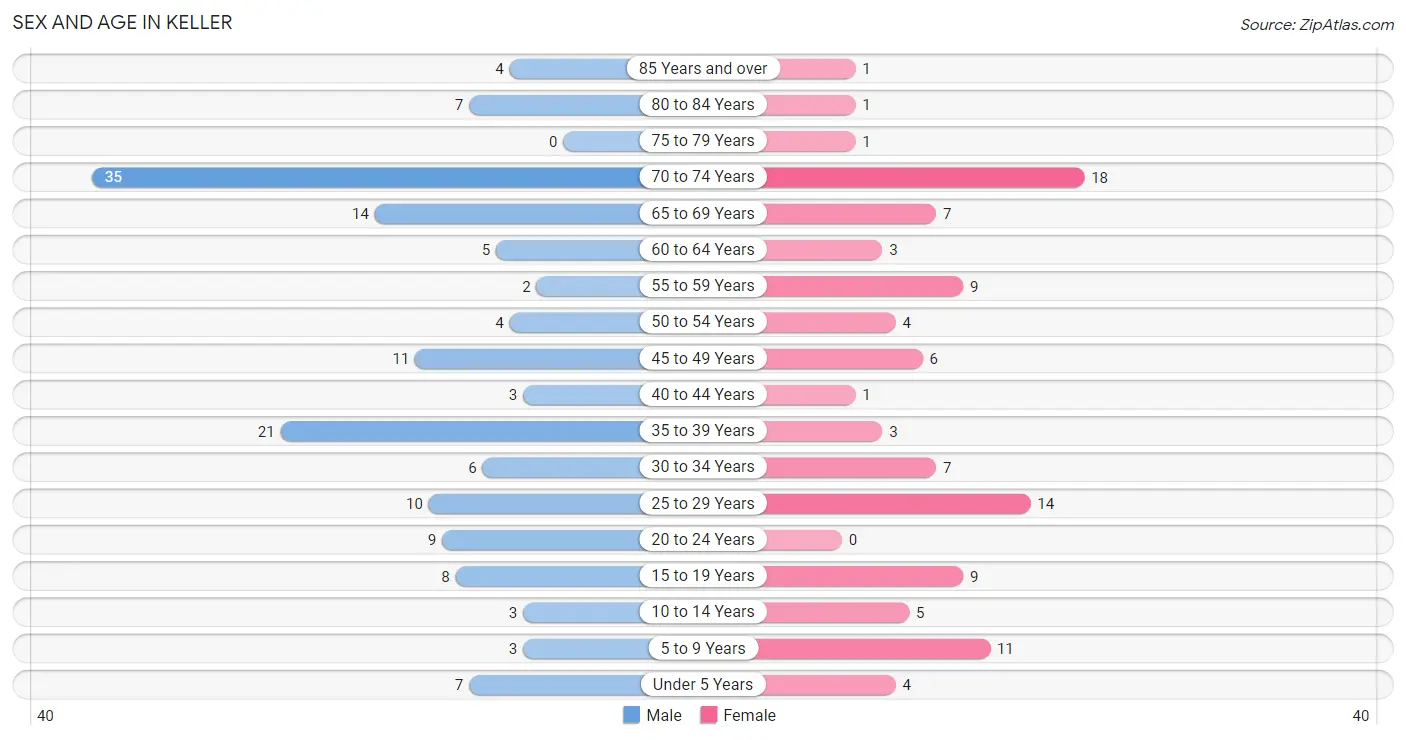
| Age Bracket | Male | Female |
| Under 5 Years | 7 (4.6%) | 4 (3.8%) |
| 5 to 9 Years | 3 (2.0%) | 11 (10.6%) |
| 10 to 14 Years | 3 (2.0%) | 5 (4.8%) |
| 15 to 19 Years | 8 (5.3%) | 9 (8.6%) |
| 20 to 24 Years | 9 (5.9%) | 0 (0.0%) |
| 25 to 29 Years | 10 (6.6%) | 14 (13.5%) |
| 30 to 34 Years | 6 (4.0%) | 7 (6.7%) |
| 35 to 39 Years | 21 (13.8%) | 3 (2.9%) |
| 40 to 44 Years | 3 (2.0%) | 1 (1.0%) |
| 45 to 49 Years | 11 (7.2%) | 6 (5.8%) |
| 50 to 54 Years | 4 (2.6%) | 4 (3.8%) |
| 55 to 59 Years | 2 (1.3%) | 9 (8.6%) |
| 60 to 64 Years | 5 (3.3%) | 3 (2.9%) |
| 65 to 69 Years | 14 (9.2%) | 7 (6.7%) |
| 70 to 74 Years | 35 (23.0%) | 18 (17.3%) |
| 75 to 79 Years | 0 (0.0%) | 1 (1.0%) |
| 80 to 84 Years | 7 (4.6%) | 1 (1.0%) |
| 85 Years and over | 4 (2.6%) | 1 (1.0%) |
| Total | 152 (100.0%) | 104 (100.0%) |
Families and Households in Keller
Median Family Size in Keller
The median family size in Keller is 2.36 persons per family, with single female/mother families (23 | 25.0%) accounting for the largest median family size of 3.13 persons per family. On the other hand, married-couple families (51 | 55.4%) represent the smallest median family size with 1.86 persons per family.
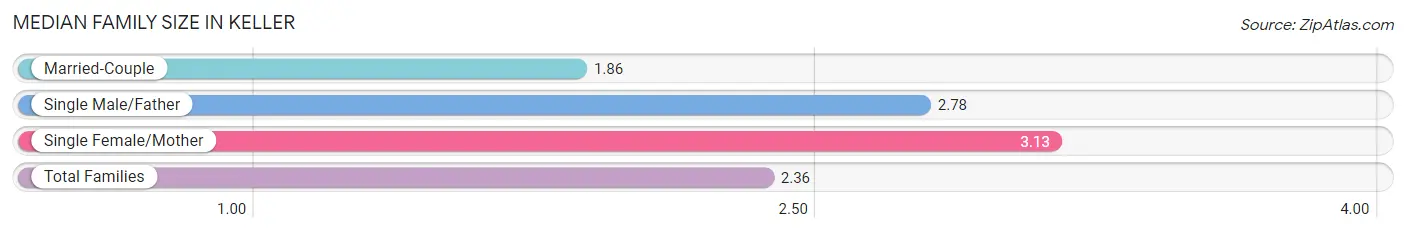
| Family Type | # Families | Family Size |
| Married-Couple | 51 (55.4%) | 1.86 |
| Single Male/Father | 18 (19.6%) | 2.78 |
| Single Female/Mother | 23 (25.0%) | 3.13 |
| Total Families | 92 (100.0%) | 2.36 |
Median Household Size in Keller
The median household size in Keller is 2.17 persons per household, with single male/father households (18 | 15.2%) accounting for the largest median household size of 3.17 persons per household. non-family households (26 | 22.0%) represent the smallest median household size with 1.23 persons per household.
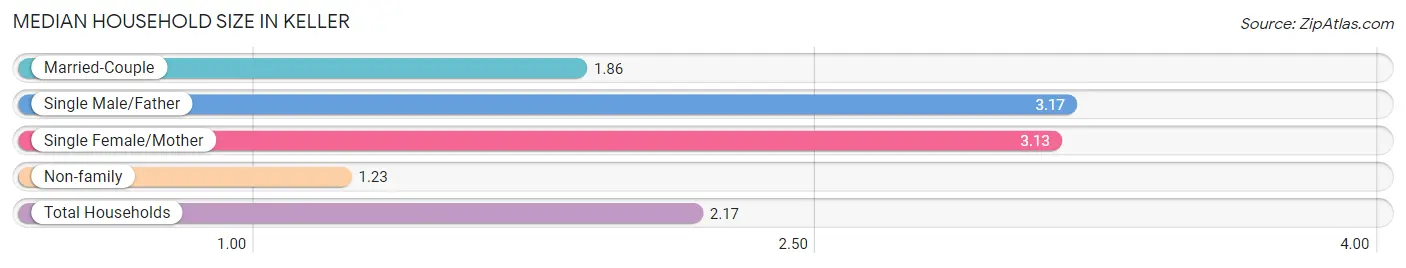
| Household Type | # Households | Household Size |
| Married-Couple | 51 (43.2%) | 1.86 |
| Single Male/Father | 18 (15.2%) | 3.17 |
| Single Female/Mother | 23 (19.5%) | 3.13 |
| Non-family | 26 (22.0%) | 1.23 |
| Total Households | 118 (100.0%) | 2.17 |
Household Size by Marriage Status in Keller
Out of a total of 118 households in Keller, 92 (78.0%) are family households, while 26 (22.0%) are nonfamily households. The most numerous type of family households are 5-person households, comprising 41, and the most common type of nonfamily households are 1-person households, comprising 22.
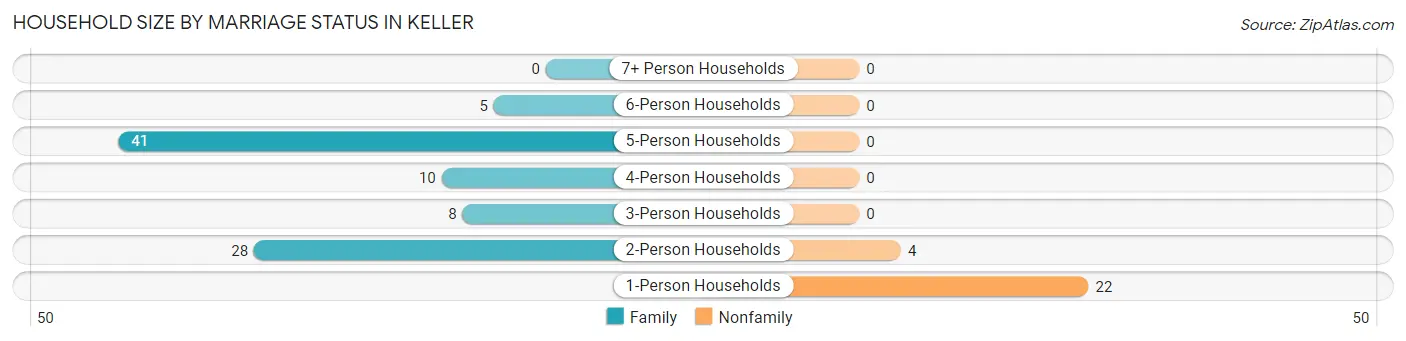
| Household Size | Family Households | Nonfamily Households |
| 1-Person Households | - | 22 (18.6%) |
| 2-Person Households | 28 (23.7%) | 4 (3.4%) |
| 3-Person Households | 8 (6.8%) | 0 (0.0%) |
| 4-Person Households | 10 (8.5%) | 0 (0.0%) |
| 5-Person Households | 41 (34.7%) | 0 (0.0%) |
| 6-Person Households | 5 (4.2%) | 0 (0.0%) |
| 7+ Person Households | 0 (0.0%) | 0 (0.0%) |
| Total | 92 (78.0%) | 26 (22.0%) |
Female Fertility in Keller
Fertility by Age in Keller
Average fertility rate in Keller is 119.0 births per 1,000 women. Women in the age bracket of 35 to 50 years have the highest fertility rate with 167.0 births per 1,000 women. Women in the age bracket of 20 to 34 years acount for 60.0% of all women with births.
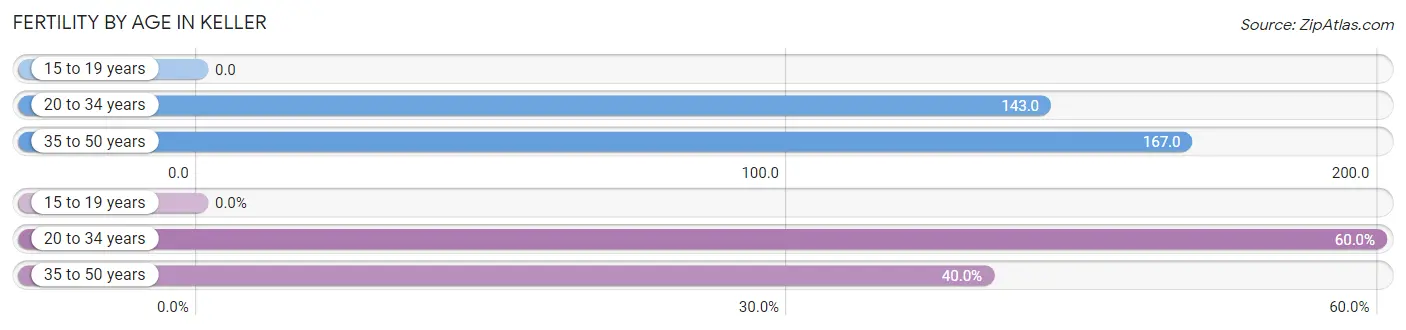
| Age Bracket | Women with Births | Births / 1,000 Women |
| 15 to 19 years | 0 (0.0%) | 0.0 |
| 20 to 34 years | 3 (60.0%) | 143.0 |
| 35 to 50 years | 2 (40.0%) | 167.0 |
| Total | 5 (100.0%) | 119.0 |
Fertility by Age by Marriage Status in Keller
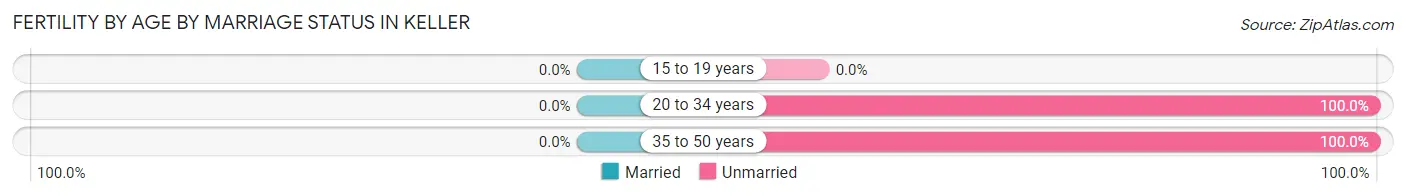
| Age Bracket | Married | Unmarried |
| 15 to 19 years | 0 (0.0%) | 0 (0.0%) |
| 20 to 34 years | 0 (0.0%) | 3 (100.0%) |
| 35 to 50 years | 0 (0.0%) | 2 (100.0%) |
| Total | 0 (0.0%) | 5 (100.0%) |
Fertility by Education in Keller
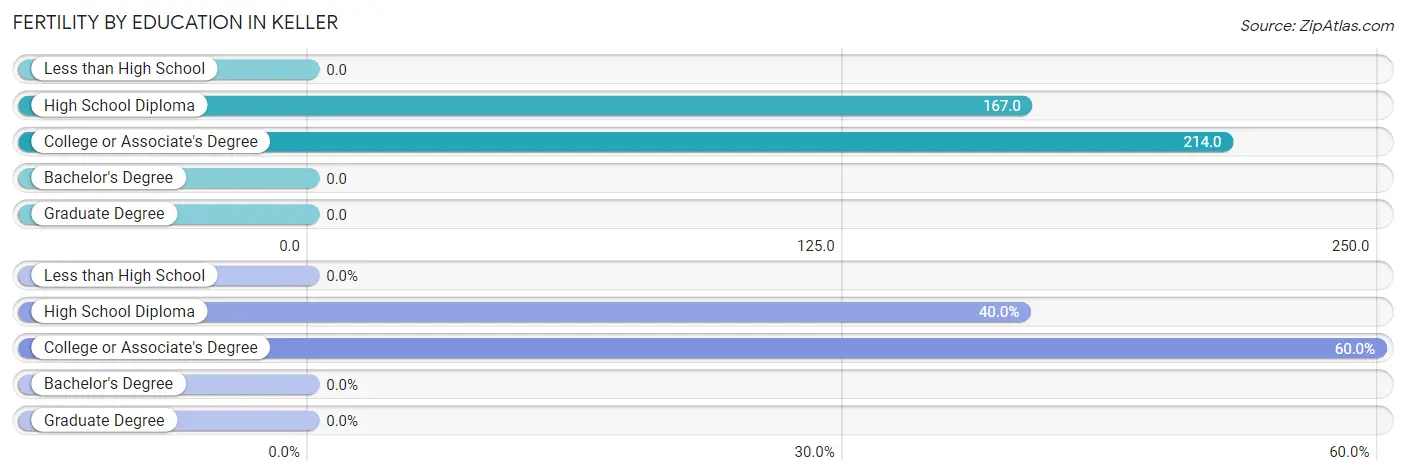
| Educational Attainment | Women with Births | Births / 1,000 Women |
| Less than High School | 0 (0.0%) | 0.0 |
| High School Diploma | 2 (40.0%) | 167.0 |
| College or Associate's Degree | 3 (60.0%) | 214.0 |
| Bachelor's Degree | 0 (0.0%) | 0.0 |
| Graduate Degree | 0 (0.0%) | 0.0 |
| Total | 5 (100.0%) | 119.0 |
Fertility by Education by Marriage Status in Keller
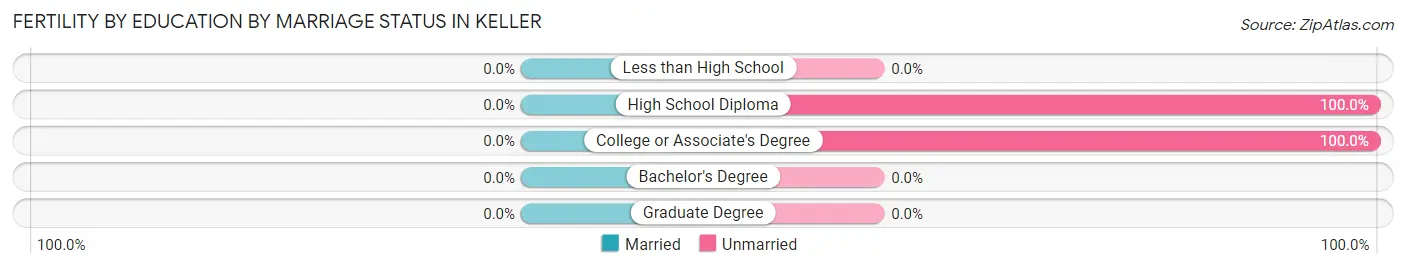
| Educational Attainment | Married | Unmarried |
| Less than High School | 0 (0.0%) | 0 (0.0%) |
| High School Diploma | 0 (0.0%) | 2 (100.0%) |
| College or Associate's Degree | 0 (0.0%) | 3 (100.0%) |
| Bachelor's Degree | 0 (0.0%) | 0 (0.0%) |
| Graduate Degree | 0 (0.0%) | 0 (0.0%) |
| Total | 0 (0.0%) | 5 (100.0%) |
Employment Characteristics in Keller
Employment by Class of Employer in Keller
Among the 100 employed individuals in Keller, federal government employees (55 | 55.0%), local government employees (27 | 27.0%), and private company employees (11 | 11.0%) make up the most common classes of employment.
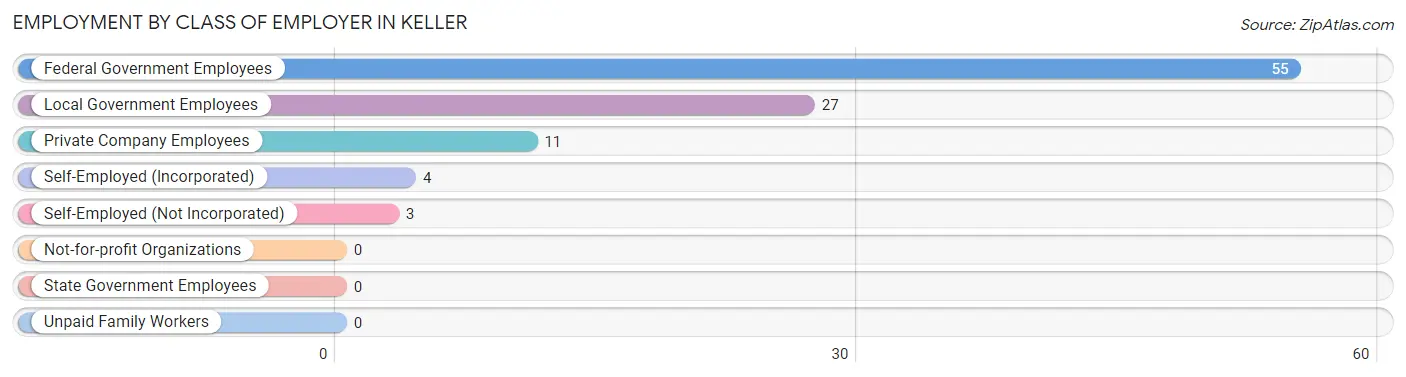
| Employer Class | # Employees | % Employees |
| Private Company Employees | 11 | 11.0% |
| Self-Employed (Incorporated) | 4 | 4.0% |
| Self-Employed (Not Incorporated) | 3 | 3.0% |
| Not-for-profit Organizations | 0 | 0.0% |
| Local Government Employees | 27 | 27.0% |
| State Government Employees | 0 | 0.0% |
| Federal Government Employees | 55 | 55.0% |
| Unpaid Family Workers | 0 | 0.0% |
| Total | 100 | 100.0% |
Employment Status by Age in Keller
According to the labor force statistics for Keller, out of the total population over 16 years of age (223), 47.5% or 106 individuals are in the labor force, with 5.7% or 6 of them unemployed. The age group with the highest labor force participation rate is 20 to 24 years, with 100.0% or 9 individuals in the labor force. Within the labor force, the 30 to 34 years age range has the highest percentage of unemployed individuals, with 33.3% or 2 of them being unemployed.
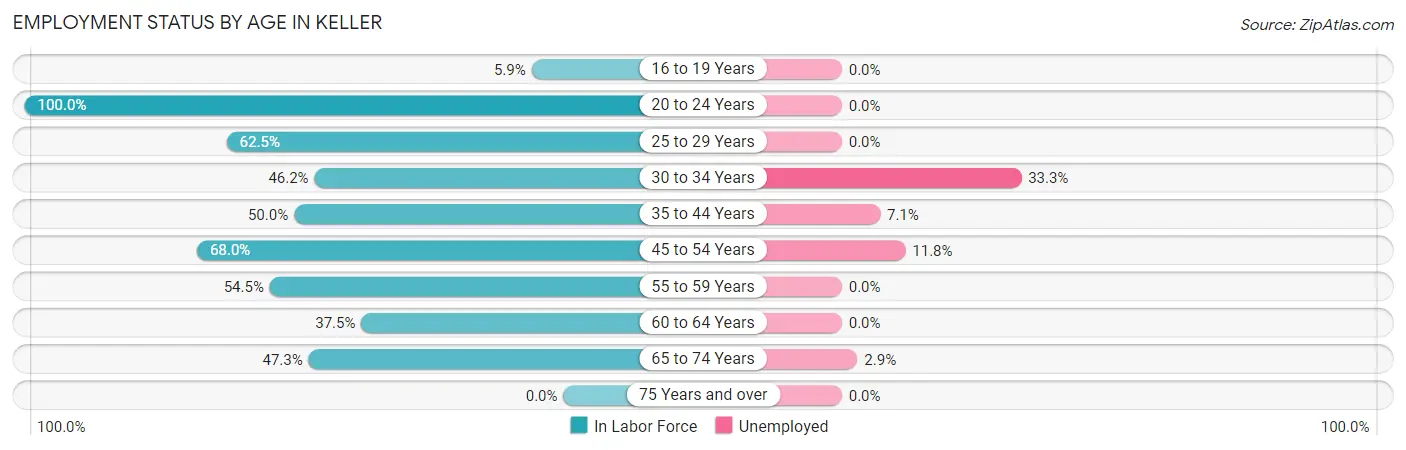
| Age Bracket | In Labor Force | Unemployed |
| 16 to 19 Years | 1 (5.9%) | 0 (0.0%) |
| 20 to 24 Years | 9 (100.0%) | 0 (0.0%) |
| 25 to 29 Years | 15 (62.5%) | 0 (0.0%) |
| 30 to 34 Years | 6 (46.2%) | 2 (33.3%) |
| 35 to 44 Years | 14 (50.0%) | 1 (7.1%) |
| 45 to 54 Years | 17 (68.0%) | 2 (11.8%) |
| 55 to 59 Years | 6 (54.5%) | 0 (0.0%) |
| 60 to 64 Years | 3 (37.5%) | 0 (0.0%) |
| 65 to 74 Years | 35 (47.3%) | 1 (2.9%) |
| 75 Years and over | 0 (0.0%) | 0 (0.0%) |
| Total | 106 (47.5%) | 6 (5.7%) |
Employment Status by Educational Attainment in Keller
According to labor force statistics for Keller, 56.0% of individuals (61) out of the total population between 25 and 64 years of age (109) are in the labor force, with 8.2% or 5 of them being unemployed. The group with the highest labor force participation rate are those with the educational attainment of less than high school, with 64.3% or 9 individuals in the labor force. Within the labor force, individuals with less than high school education have the highest percentage of unemployment, with 55.6% or 5 of them being unemployed.
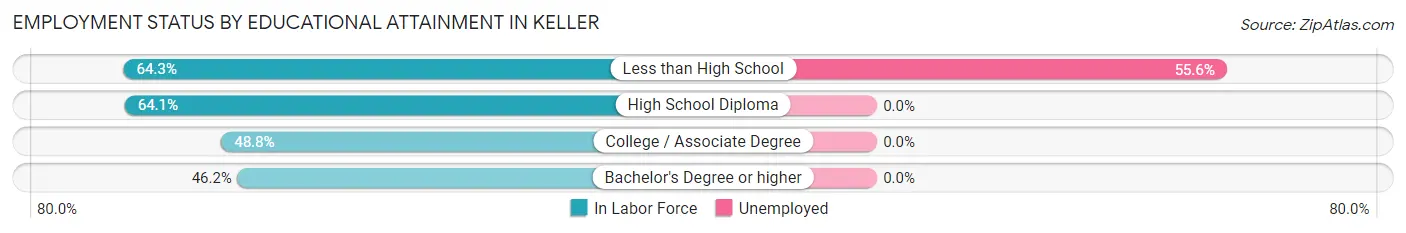
| Educational Attainment | In Labor Force | Unemployed |
| Less than High School | 9 (64.3%) | 8 (55.6%) |
| High School Diploma | 25 (64.1%) | 0 (0.0%) |
| College / Associate Degree | 21 (48.8%) | 0 (0.0%) |
| Bachelor's Degree or higher | 6 (46.2%) | 0 (0.0%) |
| Total | 61 (56.0%) | 9 (8.2%) |
Employment Occupations by Sex in Keller
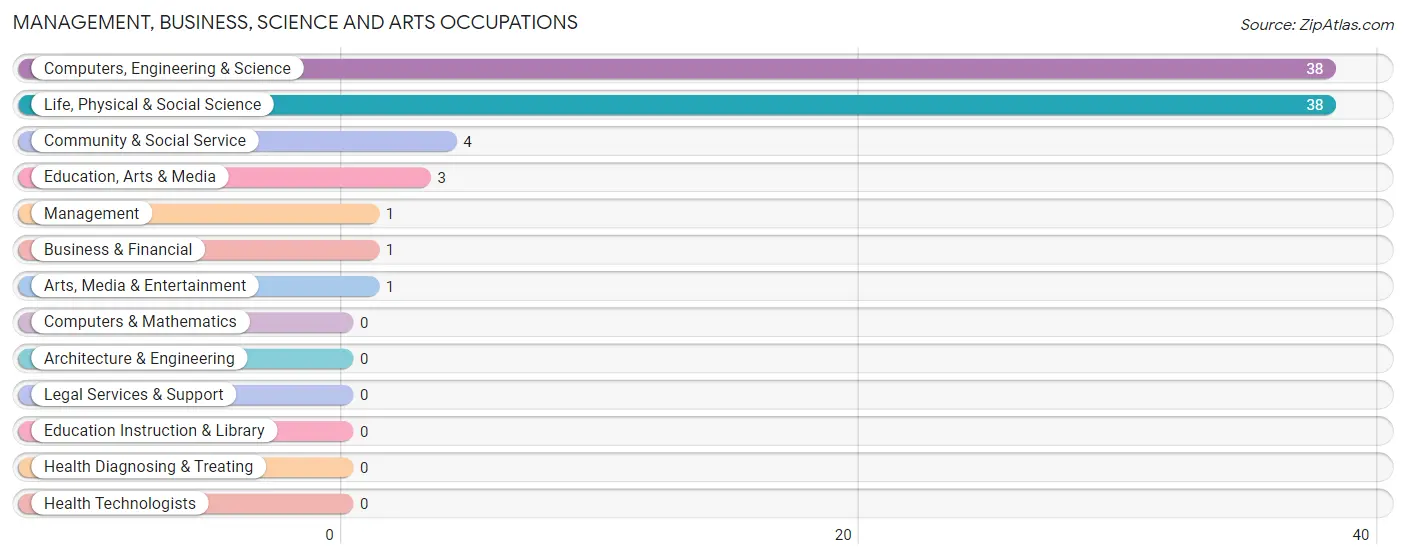
Management, Business, Science and Arts Occupations
The most common Management, Business, Science and Arts occupations in Keller are Computers, Engineering & Science (38 | 38.0%), Life, Physical & Social Science (38 | 38.0%), Community & Social Service (4 | 4.0%), Education, Arts & Media (3 | 3.0%), and Management (1 | 1.0%).
Management, Business, Science and Arts Occupations by Sex
Within the Management, Business, Science and Arts occupations in Keller, the most male-oriented occupations are Management (100.0%), Computers, Engineering & Science (100.0%), and Life, Physical & Social Science (100.0%), while the most female-oriented occupations are Business & Financial (100.0%), Arts, Media & Entertainment (100.0%), and Community & Social Service (25.0%).
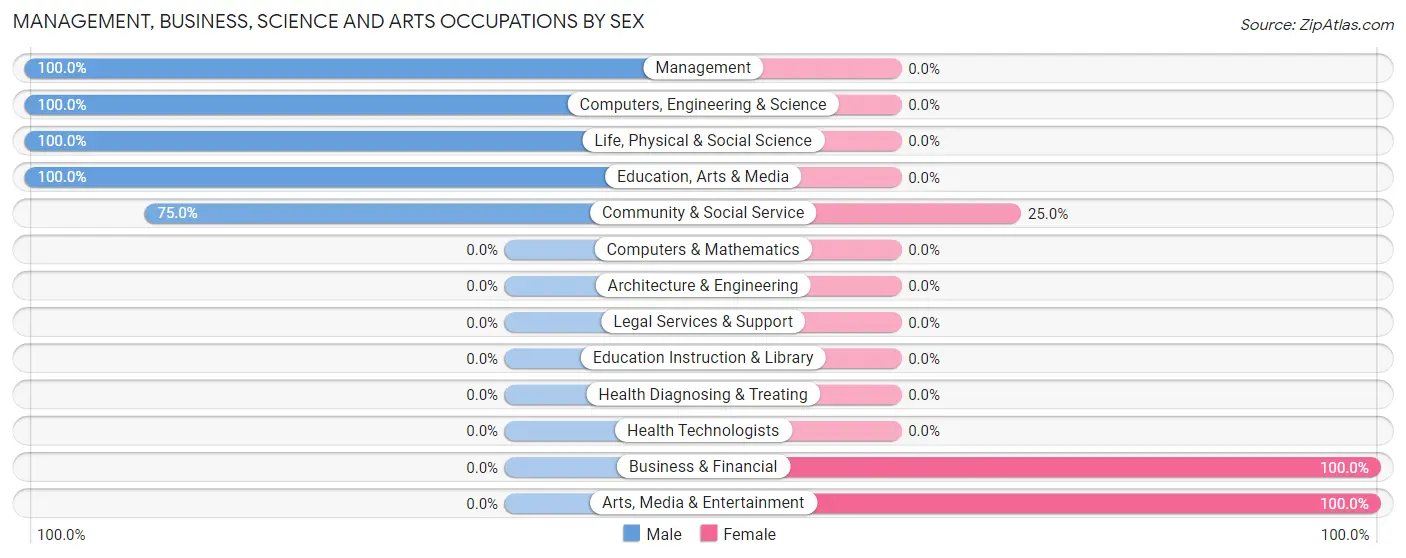
| Occupation | Male | Female |
| Management | 1 (100.0%) | 0 (0.0%) |
| Business & Financial | 0 (0.0%) | 1 (100.0%) |
| Computers, Engineering & Science | 38 (100.0%) | 0 (0.0%) |
| Computers & Mathematics | 0 (0.0%) | 0 (0.0%) |
| Architecture & Engineering | 0 (0.0%) | 0 (0.0%) |
| Life, Physical & Social Science | 38 (100.0%) | 0 (0.0%) |
| Community & Social Service | 3 (75.0%) | 1 (25.0%) |
| Education, Arts & Media | 3 (100.0%) | 0 (0.0%) |
| Legal Services & Support | 0 (0.0%) | 0 (0.0%) |
| Education Instruction & Library | 0 (0.0%) | 0 (0.0%) |
| Arts, Media & Entertainment | 0 (0.0%) | 1 (100.0%) |
| Health Diagnosing & Treating | 0 (0.0%) | 0 (0.0%) |
| Health Technologists | 0 (0.0%) | 0 (0.0%) |
| Total (Category) | 42 (95.5%) | 2 (4.5%) |
| Total (Overall) | 80 (80.0%) | 20 (20.0%) |
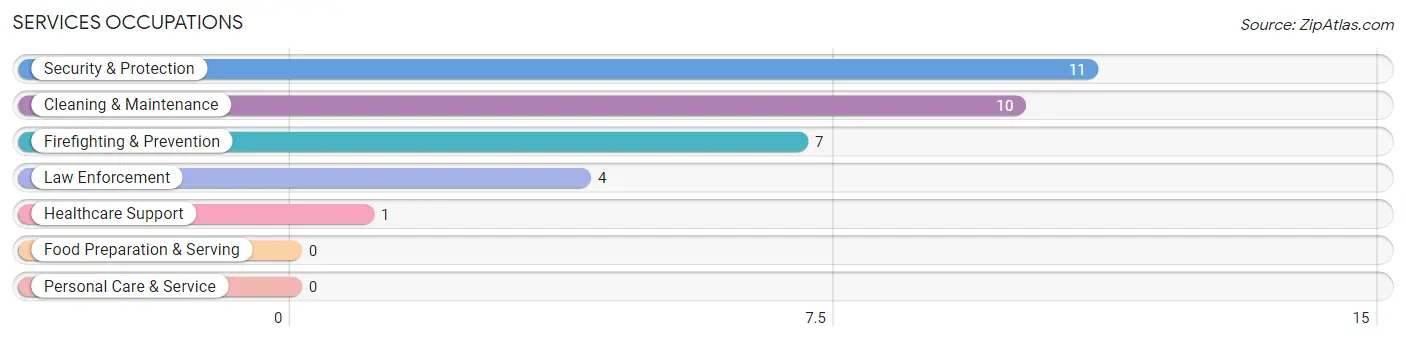
Services Occupations
The most common Services occupations in Keller are Security & Protection (11 | 11.0%), Cleaning & Maintenance (10 | 10.0%), Firefighting & Prevention (7 | 7.0%), Law Enforcement (4 | 4.0%), and Healthcare Support (1 | 1.0%).
Services Occupations by Sex
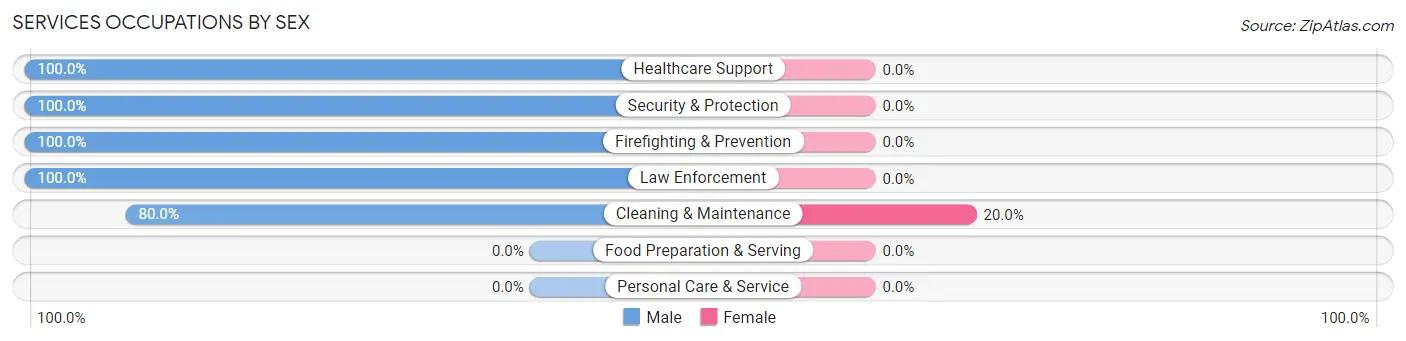
| Occupation | Male | Female |
| Healthcare Support | 1 (100.0%) | 0 (0.0%) |
| Security & Protection | 11 (100.0%) | 0 (0.0%) |
| Firefighting & Prevention | 7 (100.0%) | 0 (0.0%) |
| Law Enforcement | 4 (100.0%) | 0 (0.0%) |
| Food Preparation & Serving | 0 (0.0%) | 0 (0.0%) |
| Cleaning & Maintenance | 8 (80.0%) | 2 (20.0%) |
| Personal Care & Service | 0 (0.0%) | 0 (0.0%) |
| Total (Category) | 20 (90.9%) | 2 (9.1%) |
| Total (Overall) | 80 (80.0%) | 20 (20.0%) |
Sales and Office Occupations
The most common Sales and Office occupations in Keller are Office & Administration (10 | 10.0%), and Sales & Related (4 | 4.0%).
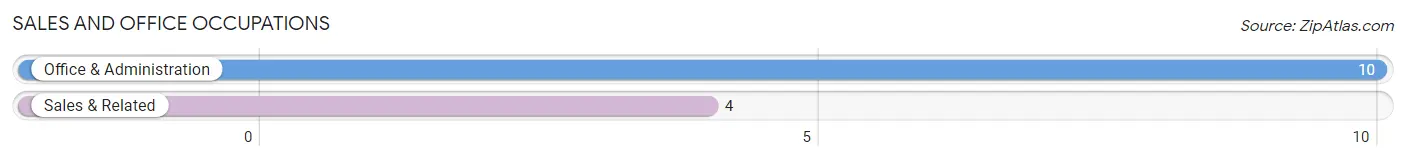
Sales and Office Occupations by Sex

| Occupation | Male | Female |
| Sales & Related | 0 (0.0%) | 4 (100.0%) |
| Office & Administration | 4 (40.0%) | 6 (60.0%) |
| Total (Category) | 4 (28.6%) | 10 (71.4%) |
| Total (Overall) | 80 (80.0%) | 20 (20.0%) |
Natural Resources, Construction and Maintenance Occupations
The most common Natural Resources, Construction and Maintenance occupations in Keller are Farming, Fishing & Forestry (11 | 11.0%), and Construction & Extraction (2 | 2.0%).
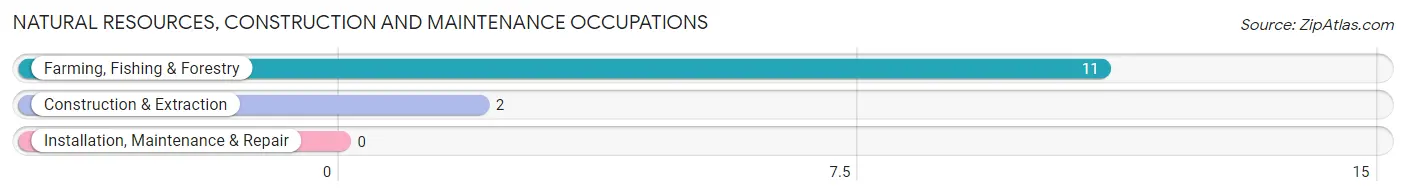
Natural Resources, Construction and Maintenance Occupations by Sex
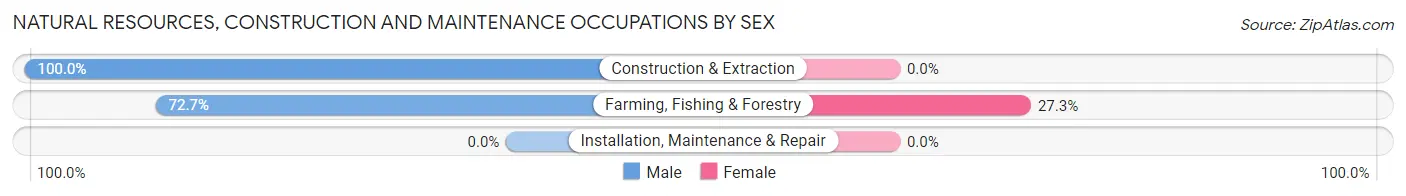
| Occupation | Male | Female |
| Farming, Fishing & Forestry | 8 (72.7%) | 3 (27.3%) |
| Construction & Extraction | 2 (100.0%) | 0 (0.0%) |
| Installation, Maintenance & Repair | 0 (0.0%) | 0 (0.0%) |
| Total (Category) | 10 (76.9%) | 3 (23.1%) |
| Total (Overall) | 80 (80.0%) | 20 (20.0%) |
Production, Transportation and Moving Occupations
The most common Production, Transportation and Moving occupations in Keller are , and Production (7 | 7.0%).
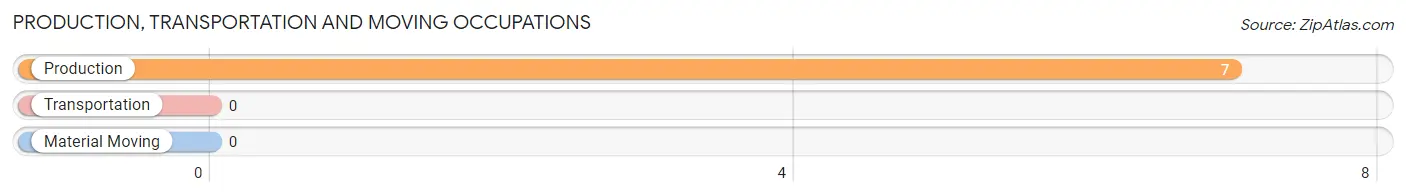
Production, Transportation and Moving Occupations by Sex
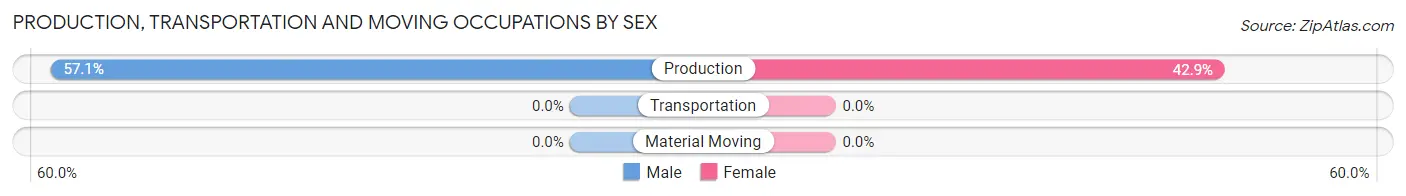
| Occupation | Male | Female |
| Production | 4 (57.1%) | 3 (42.9%) |
| Transportation | 0 (0.0%) | 0 (0.0%) |
| Material Moving | 0 (0.0%) | 0 (0.0%) |
| Total (Category) | 4 (57.1%) | 3 (42.9%) |
| Total (Overall) | 80 (80.0%) | 20 (20.0%) |
Employment Industries by Sex in Keller
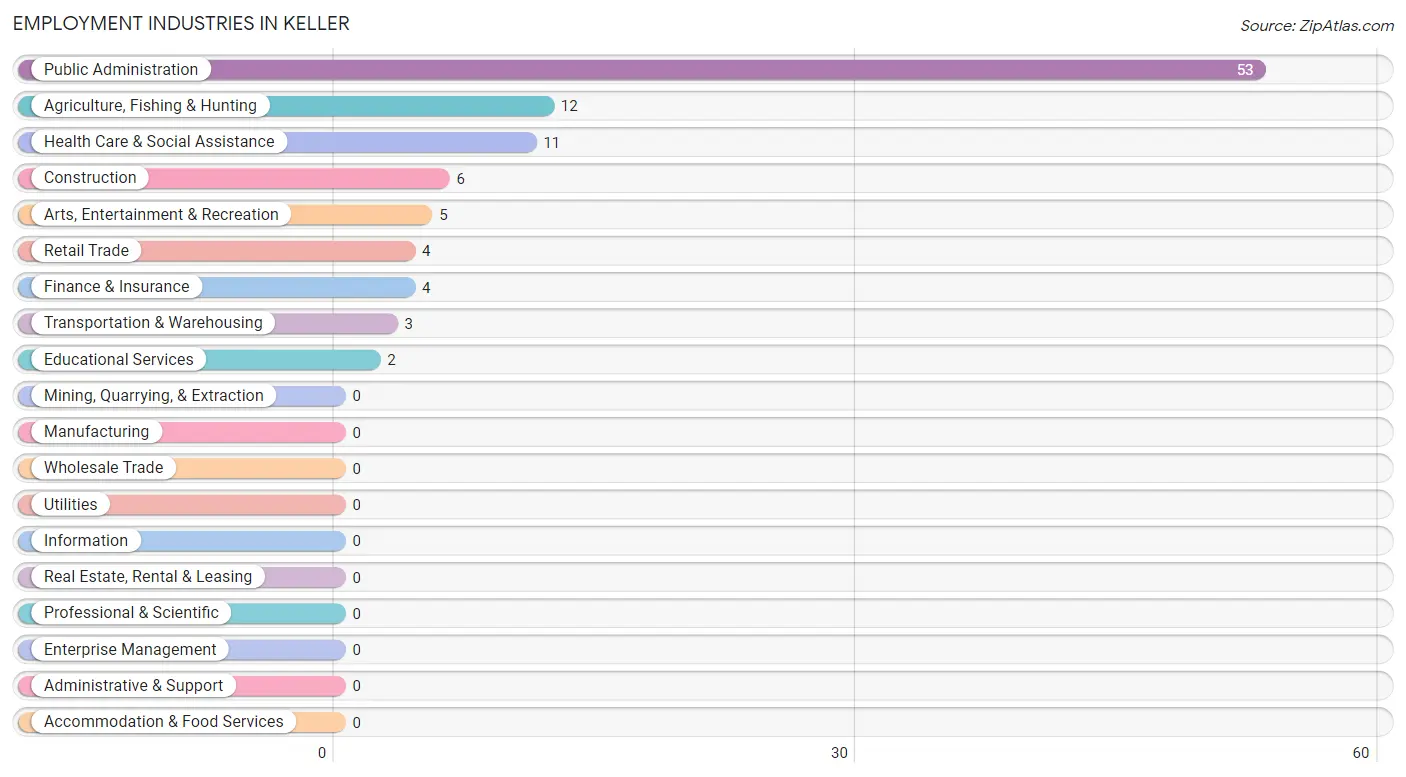
Employment Industries in Keller
The major employment industries in Keller include Public Administration (53 | 53.0%), Agriculture, Fishing & Hunting (12 | 12.0%), Health Care & Social Assistance (11 | 11.0%), Construction (6 | 6.0%), and Arts, Entertainment & Recreation (5 | 5.0%).
Employment Industries by Sex in Keller
The Keller industries that see more men than women are Finance & Insurance (100.0%), Educational Services (100.0%), and Public Administration (96.2%), whereas the industries that tend to have a higher number of women are Retail Trade (100.0%), Transportation & Warehousing (100.0%), and Arts, Entertainment & Recreation (60.0%).
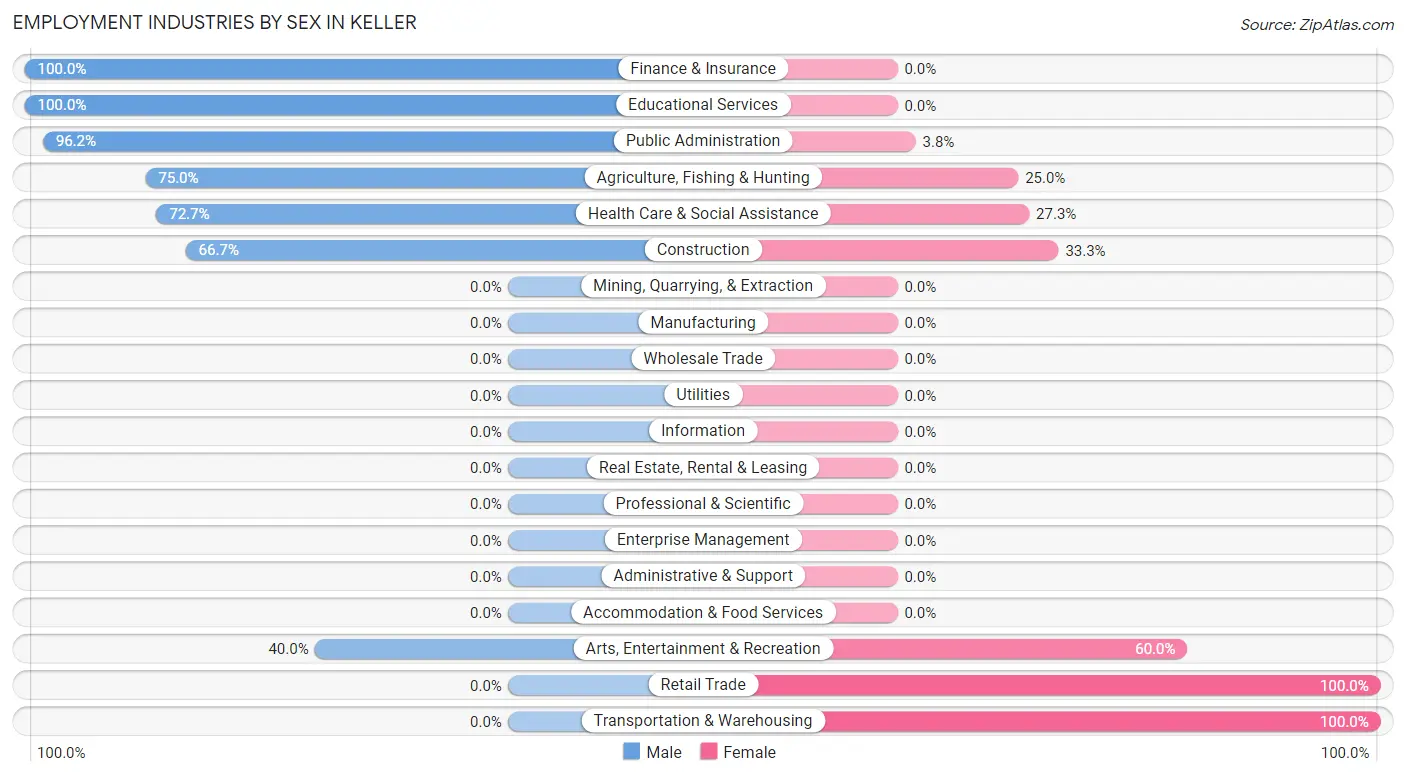
| Industry | Male | Female |
| Agriculture, Fishing & Hunting | 9 (75.0%) | 3 (25.0%) |
| Mining, Quarrying, & Extraction | 0 (0.0%) | 0 (0.0%) |
| Construction | 4 (66.7%) | 2 (33.3%) |
| Manufacturing | 0 (0.0%) | 0 (0.0%) |
| Wholesale Trade | 0 (0.0%) | 0 (0.0%) |
| Retail Trade | 0 (0.0%) | 4 (100.0%) |
| Transportation & Warehousing | 0 (0.0%) | 3 (100.0%) |
| Utilities | 0 (0.0%) | 0 (0.0%) |
| Information | 0 (0.0%) | 0 (0.0%) |
| Finance & Insurance | 4 (100.0%) | 0 (0.0%) |
| Real Estate, Rental & Leasing | 0 (0.0%) | 0 (0.0%) |
| Professional & Scientific | 0 (0.0%) | 0 (0.0%) |
| Enterprise Management | 0 (0.0%) | 0 (0.0%) |
| Administrative & Support | 0 (0.0%) | 0 (0.0%) |
| Educational Services | 2 (100.0%) | 0 (0.0%) |
| Health Care & Social Assistance | 8 (72.7%) | 3 (27.3%) |
| Arts, Entertainment & Recreation | 2 (40.0%) | 3 (60.0%) |
| Accommodation & Food Services | 0 (0.0%) | 0 (0.0%) |
| Public Administration | 51 (96.2%) | 2 (3.8%) |
| Total | 80 (80.0%) | 20 (20.0%) |
Education in Keller
School Enrollment in Keller
The most common levels of schooling among the 46 students in Keller are high school (18 | 39.1%), elementary school (12 | 26.1%), and nursery / preschool (7 | 15.2%).
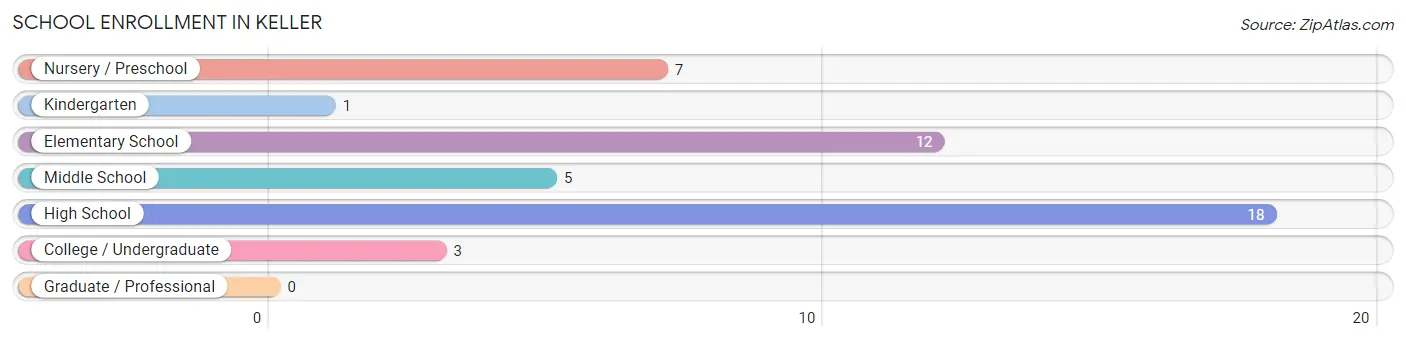
| School Level | # Students | % Students |
| Nursery / Preschool | 7 | 15.2% |
| Kindergarten | 1 | 2.2% |
| Elementary School | 12 | 26.1% |
| Middle School | 5 | 10.9% |
| High School | 18 | 39.1% |
| College / Undergraduate | 3 | 6.5% |
| Graduate / Professional | 0 | 0.0% |
| Total | 46 | 100.0% |
School Enrollment by Age by Funding Source in Keller
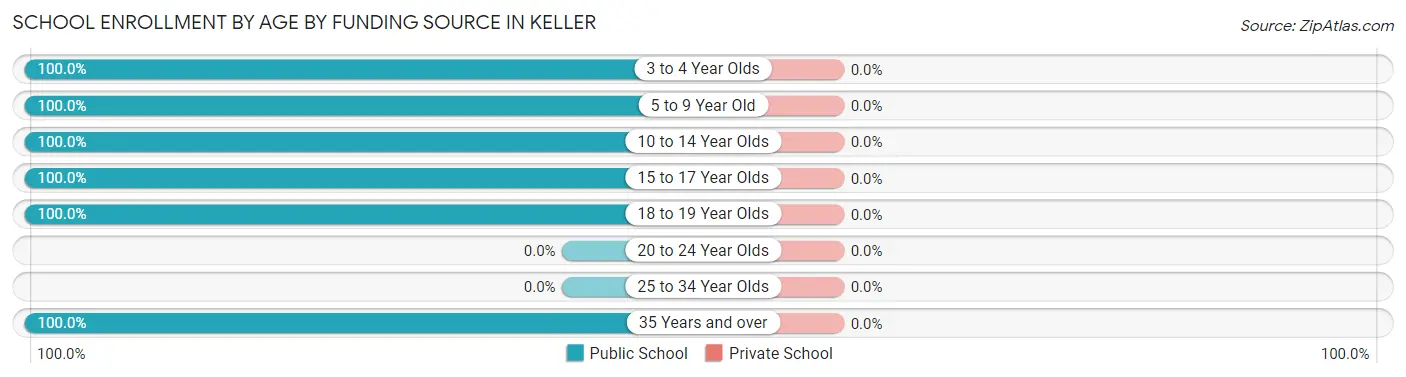
| Age Bracket | Public School | Private School |
| 3 to 4 Year Olds | 4 (100.0%) | 0 (0.0%) |
| 5 to 9 Year Old | 14 (100.0%) | 0 (0.0%) |
| 10 to 14 Year Olds | 8 (100.0%) | 0 (0.0%) |
| 15 to 17 Year Olds | 8 (100.0%) | 0 (0.0%) |
| 18 to 19 Year Olds | 9 (100.0%) | 0 (0.0%) |
| 20 to 24 Year Olds | 0 (0.0%) | 0 (0.0%) |
| 25 to 34 Year Olds | 0 (0.0%) | 0 (0.0%) |
| 35 Years and over | 3 (100.0%) | 0 (0.0%) |
| Total | 46 (100.0%) | 0 (0.0%) |
Educational Attainment by Field of Study in Keller
Business (8 | 47.1%), education (3 | 17.6%), social sciences (2 | 11.8%), science & technology (2 | 11.8%), and arts & humanities (2 | 11.8%) are the most common fields of study among 17 individuals in Keller who have obtained a bachelor's degree or higher.
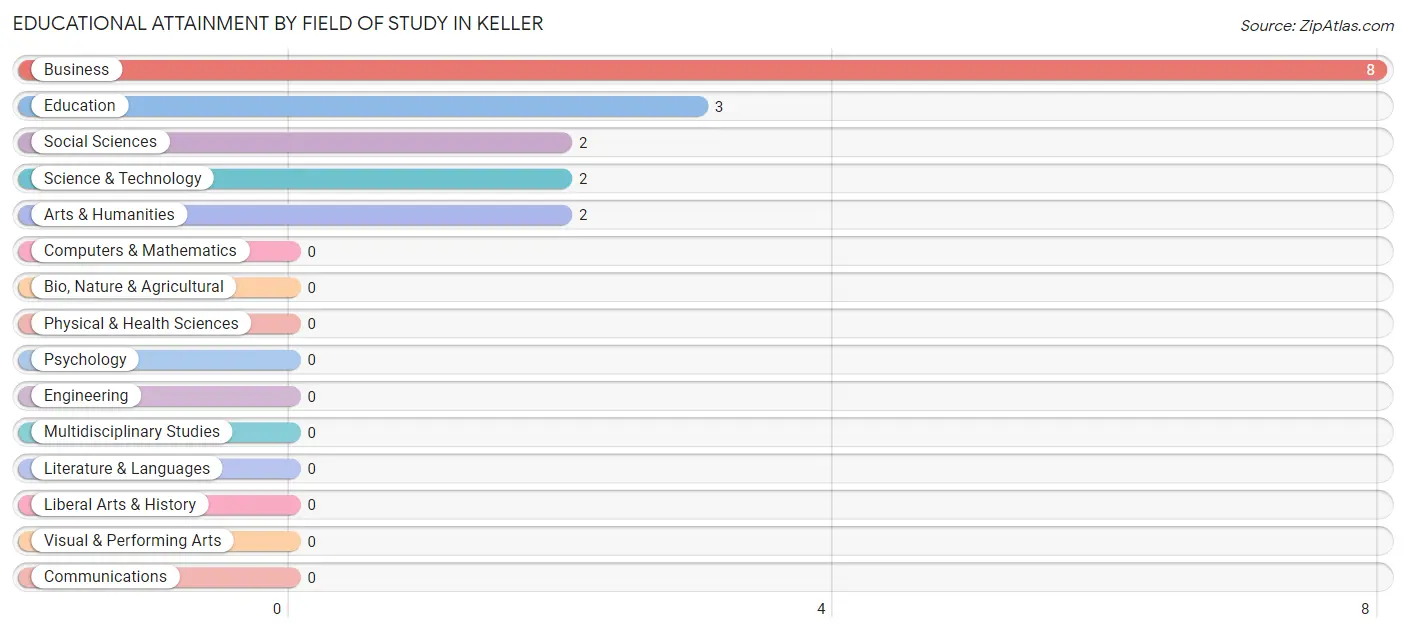
| Field of Study | # Graduates | % Graduates |
| Computers & Mathematics | 0 | 0.0% |
| Bio, Nature & Agricultural | 0 | 0.0% |
| Physical & Health Sciences | 0 | 0.0% |
| Psychology | 0 | 0.0% |
| Social Sciences | 2 | 11.8% |
| Engineering | 0 | 0.0% |
| Multidisciplinary Studies | 0 | 0.0% |
| Science & Technology | 2 | 11.8% |
| Business | 8 | 47.1% |
| Education | 3 | 17.6% |
| Literature & Languages | 0 | 0.0% |
| Liberal Arts & History | 0 | 0.0% |
| Visual & Performing Arts | 0 | 0.0% |
| Communications | 0 | 0.0% |
| Arts & Humanities | 2 | 11.8% |
| Total | 17 | 100.0% |
Transportation & Commute in Keller
Vehicle Availability by Sex in Keller
The most prevalent vehicle ownership categories in Keller are males with 4 vehicles (41, accounting for 51.2%) and females with 4 vehicles (1, making up 205.0%).
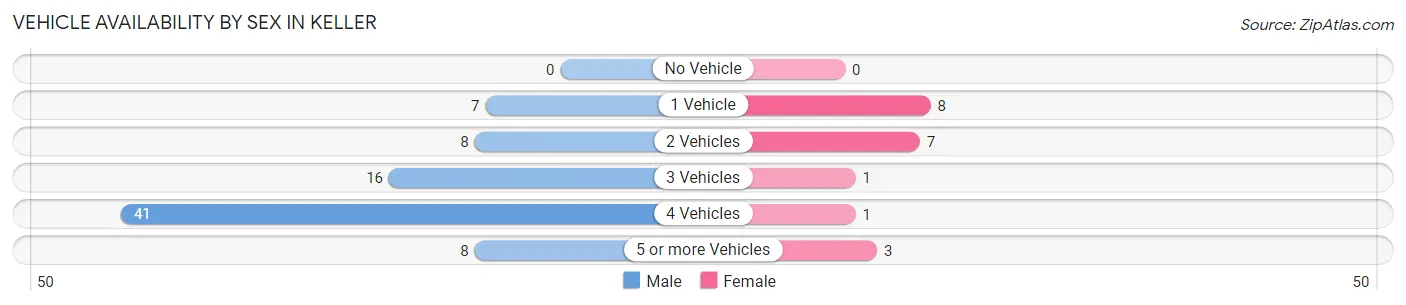
| Vehicles Available | Male | Female |
| No Vehicle | 0 (0.0%) | 0 (0.0%) |
| 1 Vehicle | 7 (8.7%) | 8 (40.0%) |
| 2 Vehicles | 8 (10.0%) | 7 (35.0%) |
| 3 Vehicles | 16 (20.0%) | 1 (5.0%) |
| 4 Vehicles | 41 (51.2%) | 1 (5.0%) |
| 5 or more Vehicles | 8 (10.0%) | 3 (15.0%) |
| Total | 80 (100.0%) | 20 (100.0%) |
Commute Time in Keller
The most frequently occuring commute durations in Keller are 15 to 19 minutes (34 commuters, 35.4%), 10 to 14 minutes (13 commuters, 13.5%), and less than 5 minutes (9 commuters, 9.4%).
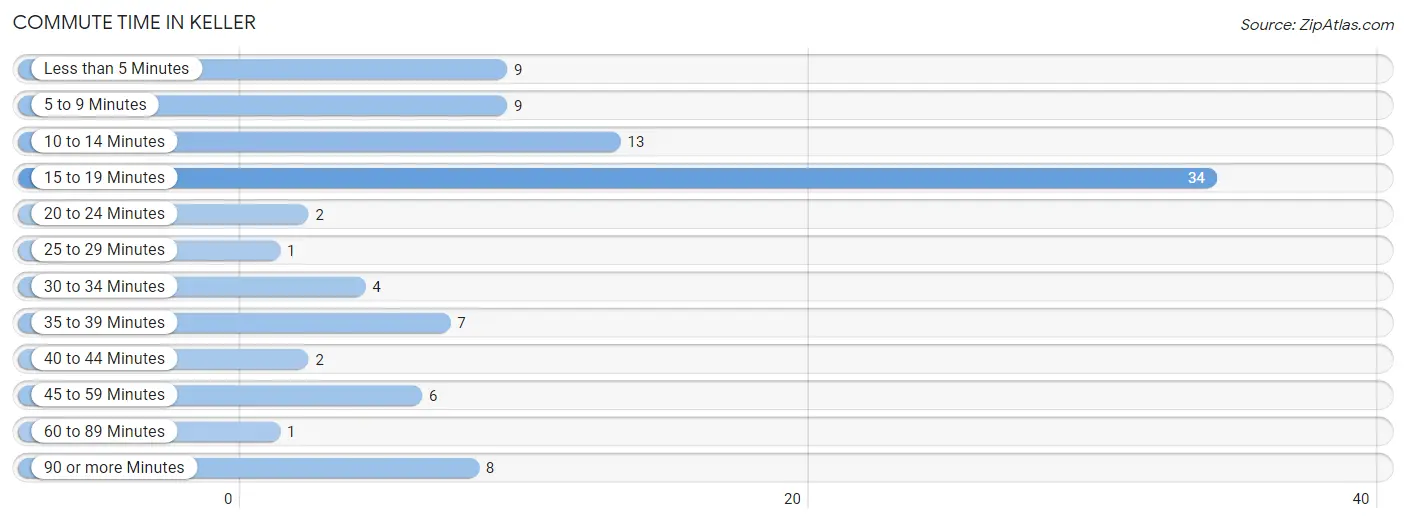
| Commute Time | # Commuters | % Commuters |
| Less than 5 Minutes | 9 | 9.4% |
| 5 to 9 Minutes | 9 | 9.4% |
| 10 to 14 Minutes | 13 | 13.5% |
| 15 to 19 Minutes | 34 | 35.4% |
| 20 to 24 Minutes | 2 | 2.1% |
| 25 to 29 Minutes | 1 | 1.0% |
| 30 to 34 Minutes | 4 | 4.2% |
| 35 to 39 Minutes | 7 | 7.3% |
| 40 to 44 Minutes | 2 | 2.1% |
| 45 to 59 Minutes | 6 | 6.2% |
| 60 to 89 Minutes | 1 | 1.0% |
| 90 or more Minutes | 8 | 8.3% |
Commute Time by Sex in Keller
The most common commute times in Keller are 15 to 19 minutes (34 commuters, 43.0%) for males and 10 to 14 minutes (7 commuters, 41.2%) for females.
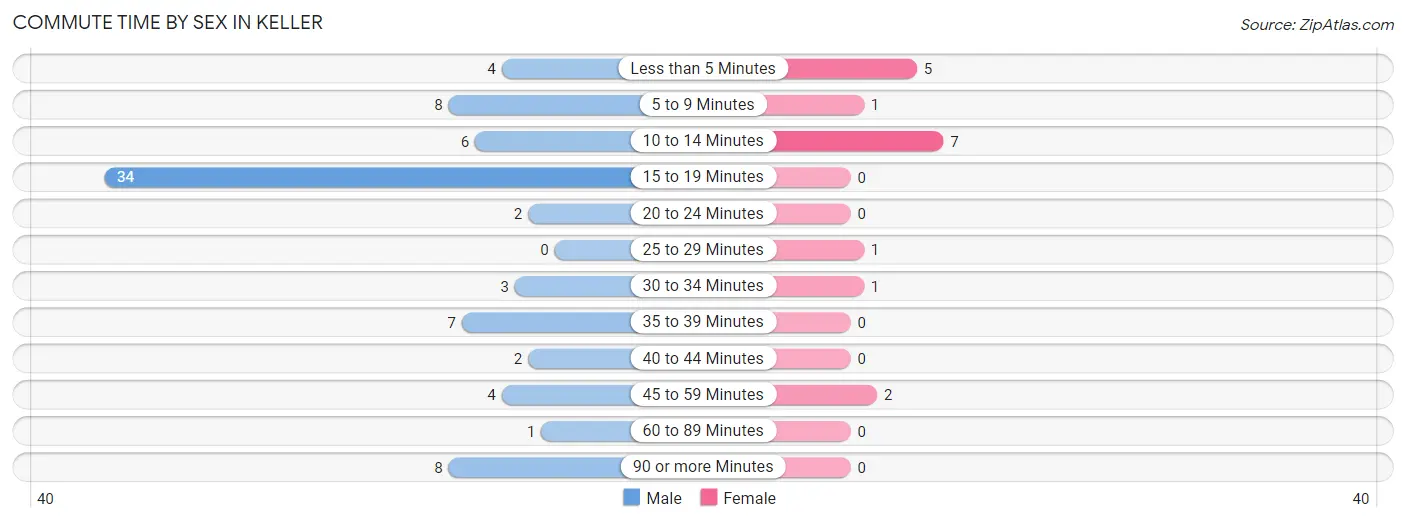
| Commute Time | Male | Female |
| Less than 5 Minutes | 4 (5.1%) | 5 (29.4%) |
| 5 to 9 Minutes | 8 (10.1%) | 1 (5.9%) |
| 10 to 14 Minutes | 6 (7.6%) | 7 (41.2%) |
| 15 to 19 Minutes | 34 (43.0%) | 0 (0.0%) |
| 20 to 24 Minutes | 2 (2.5%) | 0 (0.0%) |
| 25 to 29 Minutes | 0 (0.0%) | 1 (5.9%) |
| 30 to 34 Minutes | 3 (3.8%) | 1 (5.9%) |
| 35 to 39 Minutes | 7 (8.9%) | 0 (0.0%) |
| 40 to 44 Minutes | 2 (2.5%) | 0 (0.0%) |
| 45 to 59 Minutes | 4 (5.1%) | 2 (11.8%) |
| 60 to 89 Minutes | 1 (1.3%) | 0 (0.0%) |
| 90 or more Minutes | 8 (10.1%) | 0 (0.0%) |
Time of Departure to Work by Sex in Keller
The most frequent times of departure to work in Keller are 6:30 AM to 6:59 AM (42, 53.2%) for males and 7:30 AM to 7:59 AM (6, 35.3%) for females.
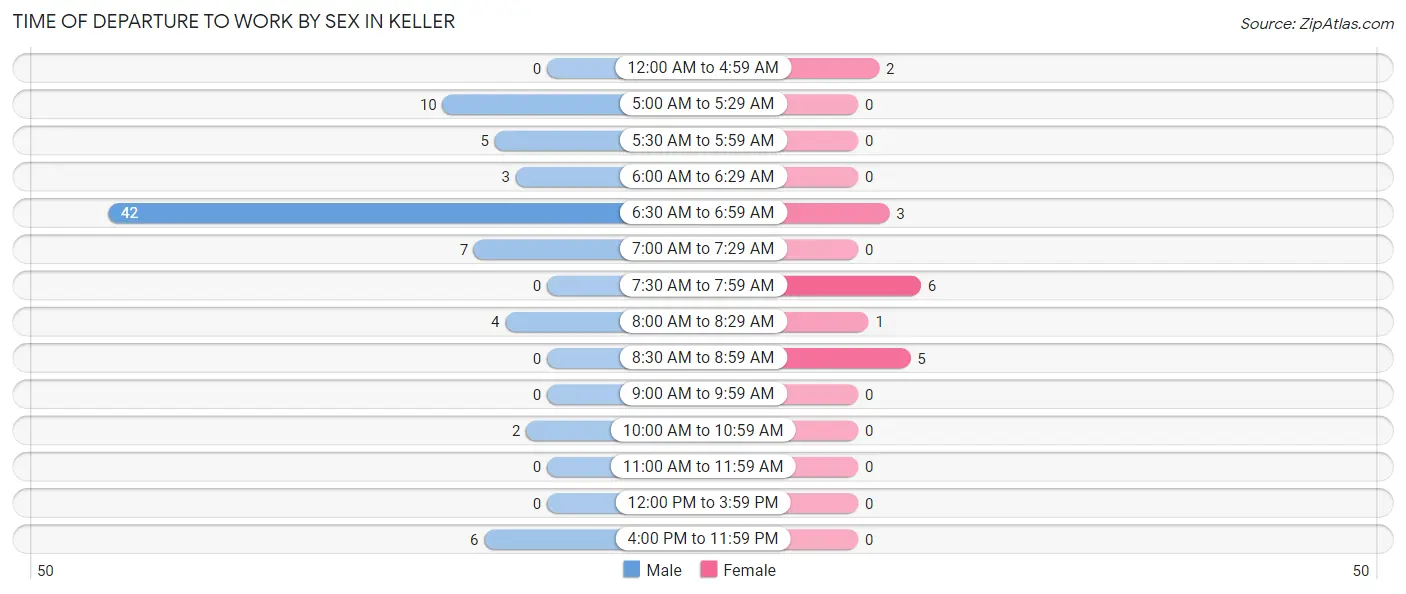
| Time of Departure | Male | Female |
| 12:00 AM to 4:59 AM | 0 (0.0%) | 2 (11.8%) |
| 5:00 AM to 5:29 AM | 10 (12.7%) | 0 (0.0%) |
| 5:30 AM to 5:59 AM | 5 (6.3%) | 0 (0.0%) |
| 6:00 AM to 6:29 AM | 3 (3.8%) | 0 (0.0%) |
| 6:30 AM to 6:59 AM | 42 (53.2%) | 3 (17.6%) |
| 7:00 AM to 7:29 AM | 7 (8.9%) | 0 (0.0%) |
| 7:30 AM to 7:59 AM | 0 (0.0%) | 6 (35.3%) |
| 8:00 AM to 8:29 AM | 4 (5.1%) | 1 (5.9%) |
| 8:30 AM to 8:59 AM | 0 (0.0%) | 5 (29.4%) |
| 9:00 AM to 9:59 AM | 0 (0.0%) | 0 (0.0%) |
| 10:00 AM to 10:59 AM | 2 (2.5%) | 0 (0.0%) |
| 11:00 AM to 11:59 AM | 0 (0.0%) | 0 (0.0%) |
| 12:00 PM to 3:59 PM | 0 (0.0%) | 0 (0.0%) |
| 4:00 PM to 11:59 PM | 6 (7.6%) | 0 (0.0%) |
| Total | 79 (100.0%) | 17 (100.0%) |
Housing Occupancy in Keller
Occupancy by Ownership in Keller
Of the total 118 dwellings in Keller, owner-occupied units account for 71 (60.2%), while renter-occupied units make up 47 (39.8%).
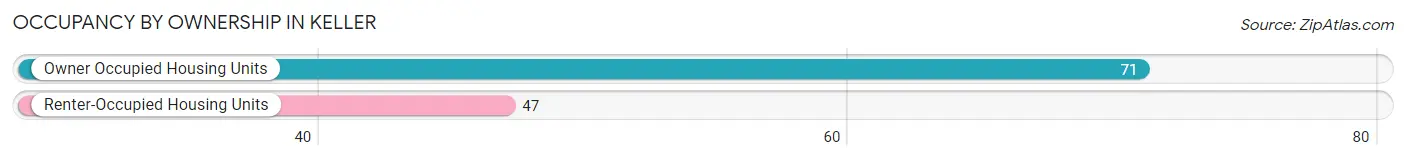
| Occupancy | # Housing Units | % Housing Units |
| Owner Occupied Housing Units | 71 | 60.2% |
| Renter-Occupied Housing Units | 47 | 39.8% |
| Total Occupied Housing Units | 118 | 100.0% |
Occupancy by Household Size in Keller
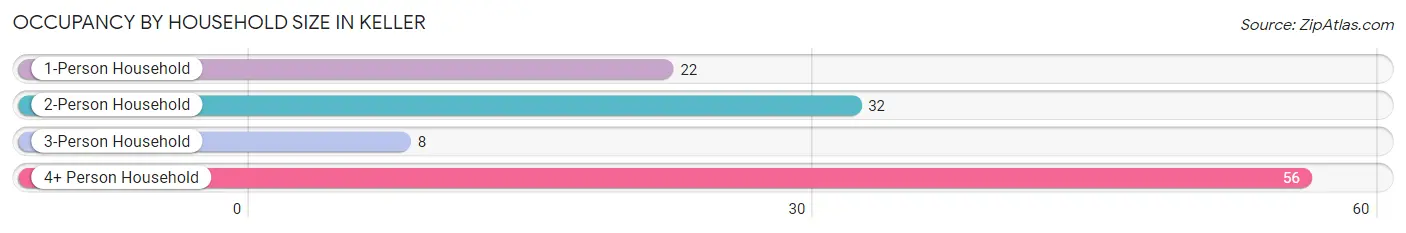
| Household Size | # Housing Units | % Housing Units |
| 1-Person Household | 22 | 18.6% |
| 2-Person Household | 32 | 27.1% |
| 3-Person Household | 8 | 6.8% |
| 4+ Person Household | 56 | 47.5% |
| Total Housing Units | 118 | 100.0% |
Occupancy by Ownership by Household Size in Keller
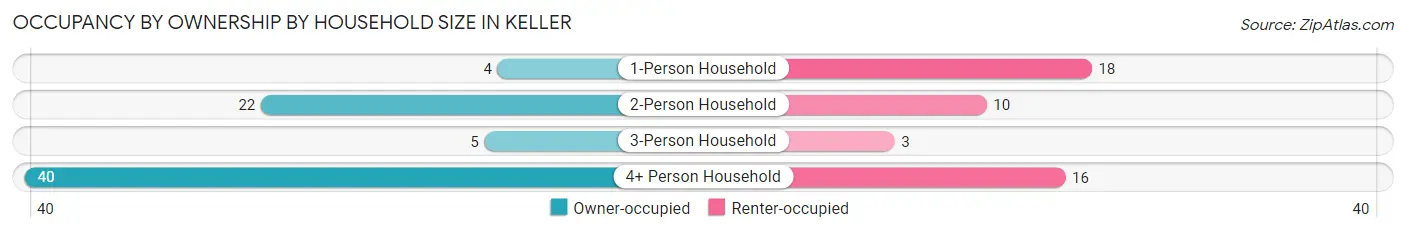
| Household Size | Owner-occupied | Renter-occupied |
| 1-Person Household | 4 (18.2%) | 18 (81.8%) |
| 2-Person Household | 22 (68.8%) | 10 (31.2%) |
| 3-Person Household | 5 (62.5%) | 3 (37.5%) |
| 4+ Person Household | 40 (71.4%) | 16 (28.6%) |
| Total Housing Units | 71 (60.2%) | 47 (39.8%) |
Occupancy by Educational Attainment in Keller
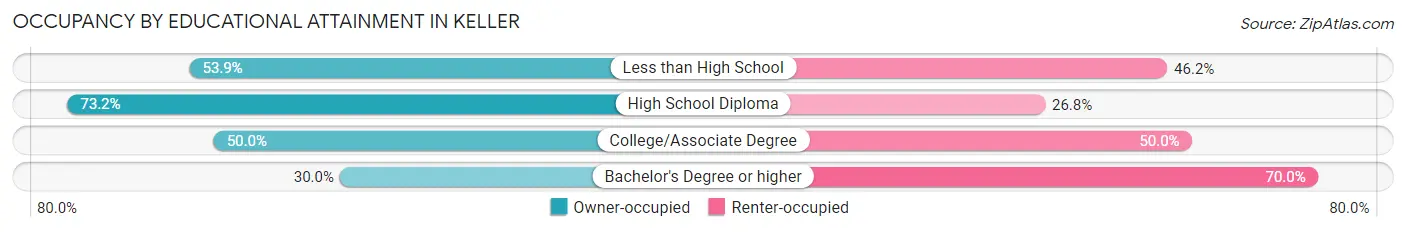
| Household Size | Owner-occupied | Renter-occupied |
| Less than High School | 14 (53.8%) | 12 (46.2%) |
| High School Diploma | 41 (73.2%) | 15 (26.8%) |
| College/Associate Degree | 13 (50.0%) | 13 (50.0%) |
| Bachelor's Degree or higher | 3 (30.0%) | 7 (70.0%) |
Occupancy by Age of Householder in Keller
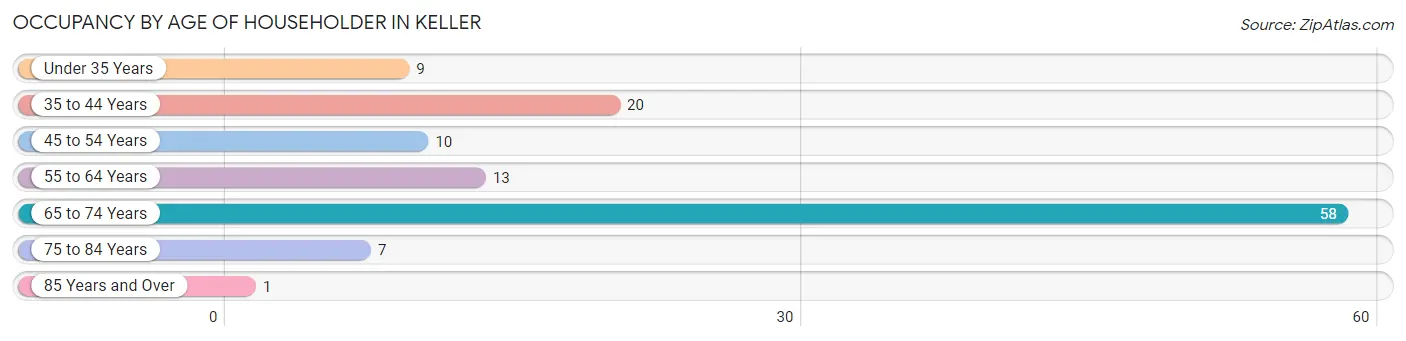
| Age Bracket | # Households | % Households |
| Under 35 Years | 9 | 7.6% |
| 35 to 44 Years | 20 | 17.0% |
| 45 to 54 Years | 10 | 8.5% |
| 55 to 64 Years | 13 | 11.0% |
| 65 to 74 Years | 58 | 49.1% |
| 75 to 84 Years | 7 | 5.9% |
| 85 Years and Over | 1 | 0.9% |
| Total | 118 | 100.0% |
Housing Finances in Keller
Median Income by Occupancy in Keller
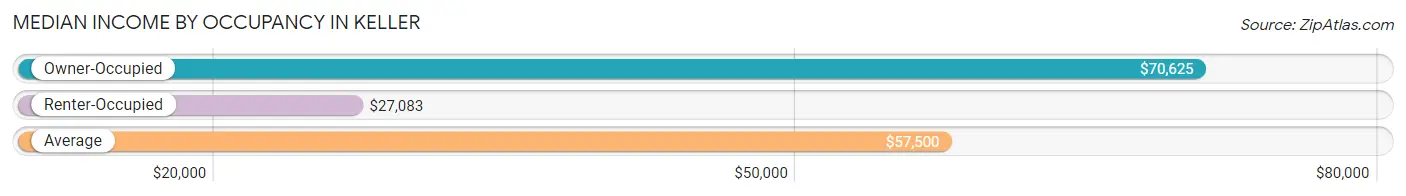
| Occupancy Type | # Households | Median Income |
| Owner-Occupied | 71 (60.2%) | $70,625 |
| Renter-Occupied | 47 (39.8%) | $27,083 |
| Average | 118 (100.0%) | $57,500 |
Occupancy by Householder Income Bracket in Keller
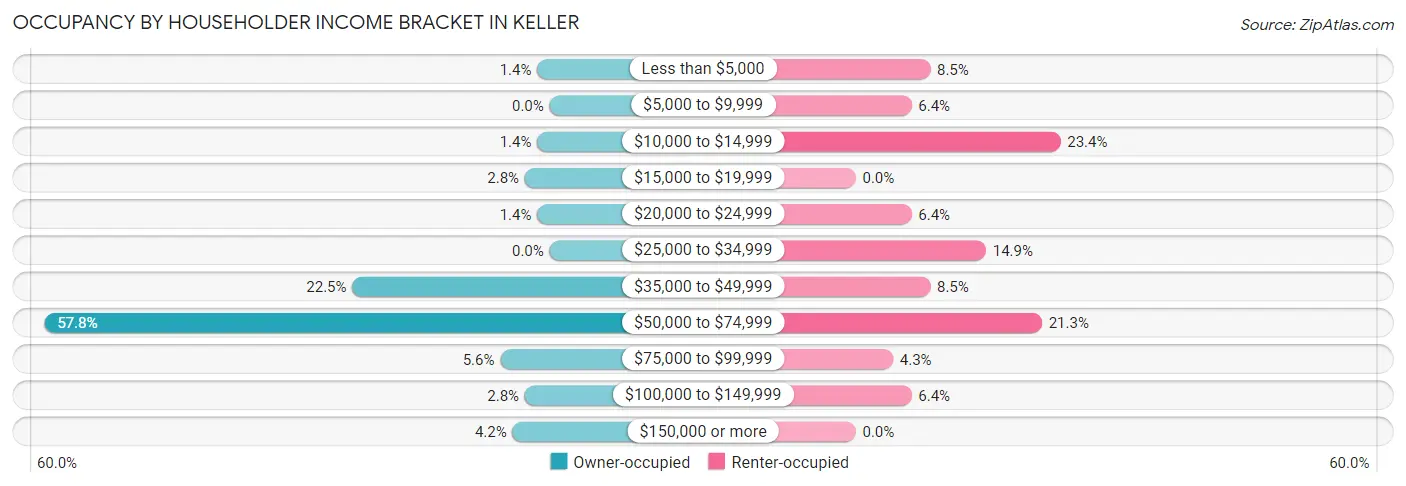
| Income Bracket | Owner-occupied | Renter-occupied |
| Less than $5,000 | 1 (1.4%) | 4 (8.5%) |
| $5,000 to $9,999 | 0 (0.0%) | 3 (6.4%) |
| $10,000 to $14,999 | 1 (1.4%) | 11 (23.4%) |
| $15,000 to $19,999 | 2 (2.8%) | 0 (0.0%) |
| $20,000 to $24,999 | 1 (1.4%) | 3 (6.4%) |
| $25,000 to $34,999 | 0 (0.0%) | 7 (14.9%) |
| $35,000 to $49,999 | 16 (22.5%) | 4 (8.5%) |
| $50,000 to $74,999 | 41 (57.8%) | 10 (21.3%) |
| $75,000 to $99,999 | 4 (5.6%) | 2 (4.3%) |
| $100,000 to $149,999 | 2 (2.8%) | 3 (6.4%) |
| $150,000 or more | 3 (4.2%) | 0 (0.0%) |
| Total | 71 (100.0%) | 47 (100.0%) |
Monthly Housing Cost Tiers in Keller
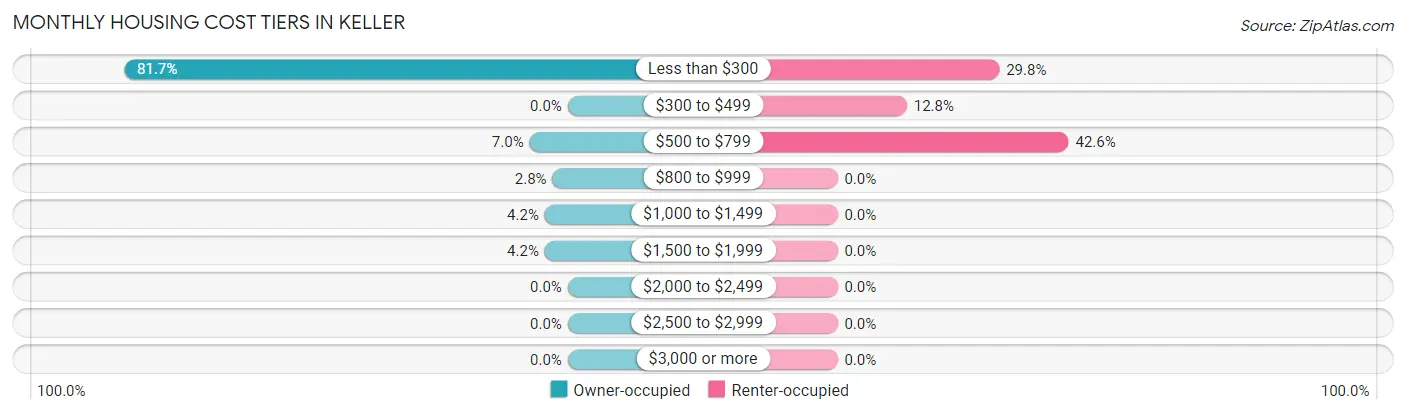
| Monthly Cost | Owner-occupied | Renter-occupied |
| Less than $300 | 58 (81.7%) | 14 (29.8%) |
| $300 to $499 | 0 (0.0%) | 6 (12.8%) |
| $500 to $799 | 5 (7.0%) | 20 (42.5%) |
| $800 to $999 | 2 (2.8%) | 0 (0.0%) |
| $1,000 to $1,499 | 3 (4.2%) | 0 (0.0%) |
| $1,500 to $1,999 | 3 (4.2%) | 0 (0.0%) |
| $2,000 to $2,499 | 0 (0.0%) | 0 (0.0%) |
| $2,500 to $2,999 | 0 (0.0%) | 0 (0.0%) |
| $3,000 or more | 0 (0.0%) | 0 (0.0%) |
| Total | 71 (100.0%) | 47 (100.0%) |
Physical Housing Characteristics in Keller
Housing Structures in Keller
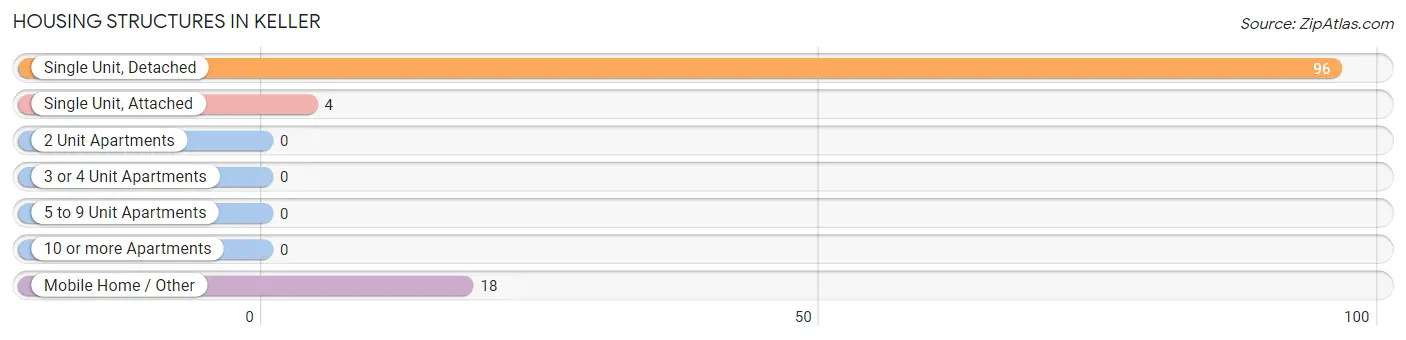
| Structure Type | # Housing Units | % Housing Units |
| Single Unit, Detached | 96 | 81.4% |
| Single Unit, Attached | 4 | 3.4% |
| 2 Unit Apartments | 0 | 0.0% |
| 3 or 4 Unit Apartments | 0 | 0.0% |
| 5 to 9 Unit Apartments | 0 | 0.0% |
| 10 or more Apartments | 0 | 0.0% |
| Mobile Home / Other | 18 | 15.2% |
| Total | 118 | 100.0% |
Housing Structures by Occupancy in Keller
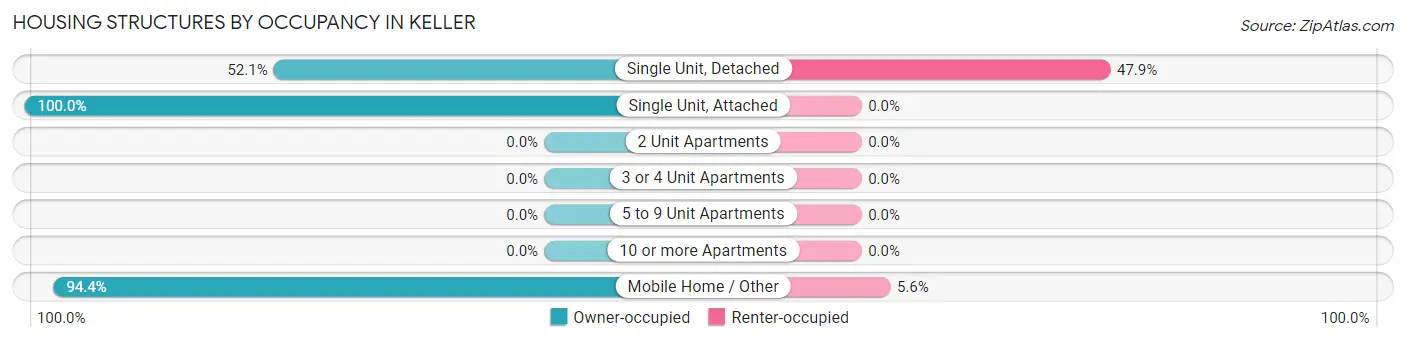
| Structure Type | Owner-occupied | Renter-occupied |
| Single Unit, Detached | 50 (52.1%) | 46 (47.9%) |
| Single Unit, Attached | 4 (100.0%) | 0 (0.0%) |
| 2 Unit Apartments | 0 (0.0%) | 0 (0.0%) |
| 3 or 4 Unit Apartments | 0 (0.0%) | 0 (0.0%) |
| 5 to 9 Unit Apartments | 0 (0.0%) | 0 (0.0%) |
| 10 or more Apartments | 0 (0.0%) | 0 (0.0%) |
| Mobile Home / Other | 17 (94.4%) | 1 (5.6%) |
| Total | 71 (60.2%) | 47 (39.8%) |
Housing Structures by Number of Rooms in Keller
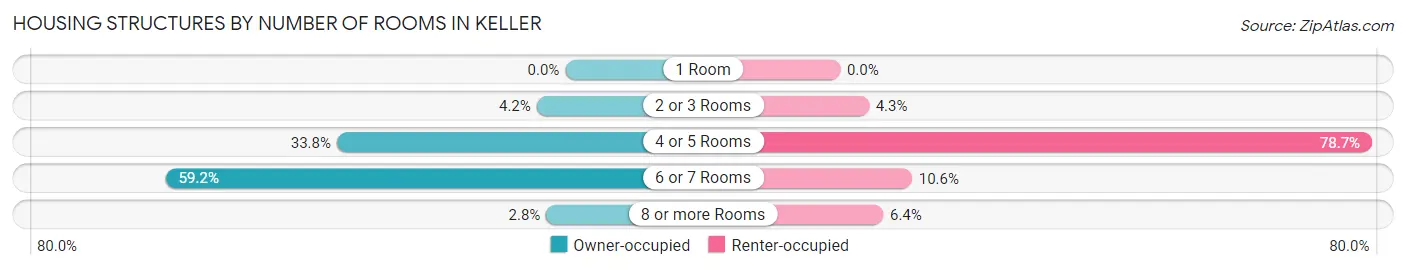
| Number of Rooms | Owner-occupied | Renter-occupied |
| 1 Room | 0 (0.0%) | 0 (0.0%) |
| 2 or 3 Rooms | 3 (4.2%) | 2 (4.3%) |
| 4 or 5 Rooms | 24 (33.8%) | 37 (78.7%) |
| 6 or 7 Rooms | 42 (59.2%) | 5 (10.6%) |
| 8 or more Rooms | 2 (2.8%) | 3 (6.4%) |
| Total | 71 (100.0%) | 47 (100.0%) |
Housing Structure by Heating Type in Keller
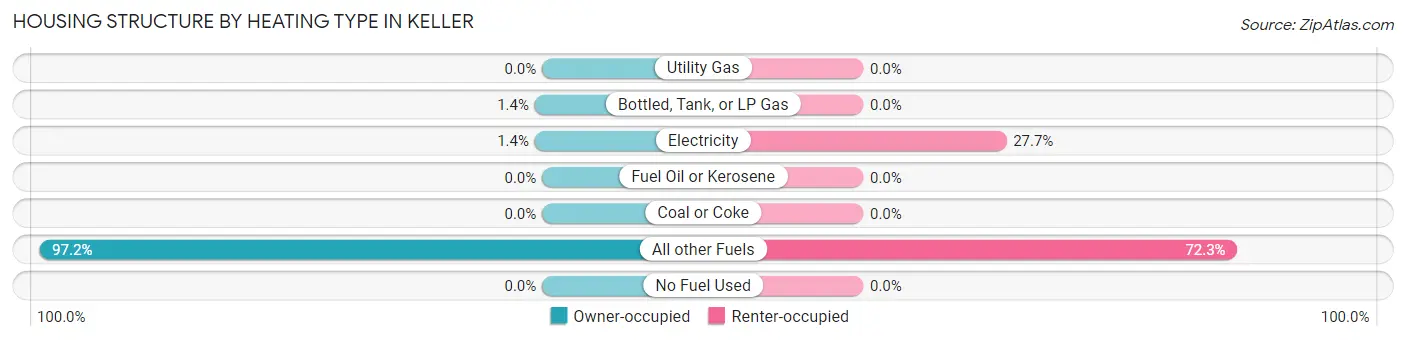
| Heating Type | Owner-occupied | Renter-occupied |
| Utility Gas | 0 (0.0%) | 0 (0.0%) |
| Bottled, Tank, or LP Gas | 1 (1.4%) | 0 (0.0%) |
| Electricity | 1 (1.4%) | 13 (27.7%) |
| Fuel Oil or Kerosene | 0 (0.0%) | 0 (0.0%) |
| Coal or Coke | 0 (0.0%) | 0 (0.0%) |
| All other Fuels | 69 (97.2%) | 34 (72.3%) |
| No Fuel Used | 0 (0.0%) | 0 (0.0%) |
| Total | 71 (100.0%) | 47 (100.0%) |
Household Vehicle Usage in Keller
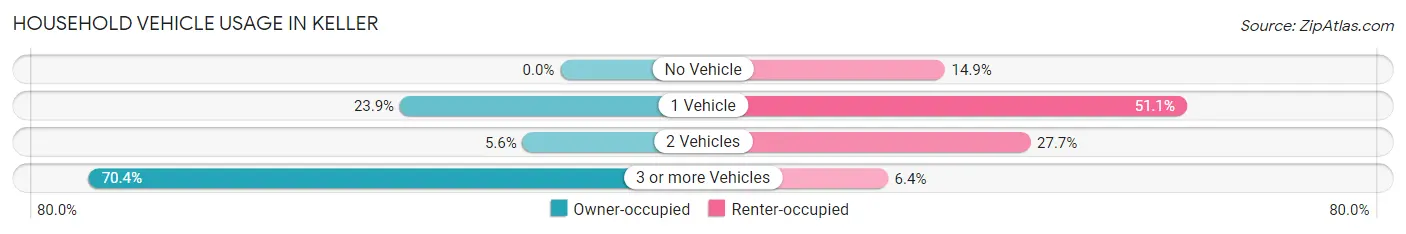
| Vehicles per Household | Owner-occupied | Renter-occupied |
| No Vehicle | 0 (0.0%) | 7 (14.9%) |
| 1 Vehicle | 17 (23.9%) | 24 (51.1%) |
| 2 Vehicles | 4 (5.6%) | 13 (27.7%) |
| 3 or more Vehicles | 50 (70.4%) | 3 (6.4%) |
| Total | 71 (100.0%) | 47 (100.0%) |
Real Estate & Mortgages in Keller
Real Estate and Mortgage Overview in Keller
| Characteristic | Without Mortgage | With Mortgage |
| Housing Units | 58 | 13 |
| Median Property Value | $106,400 | $206,300 |
| Median Household Income | $70,735 | $3 |
| Monthly Housing Costs | $118 | $0 |
| Real Estate Taxes | - | - |
Property Value by Mortgage Status in Keller
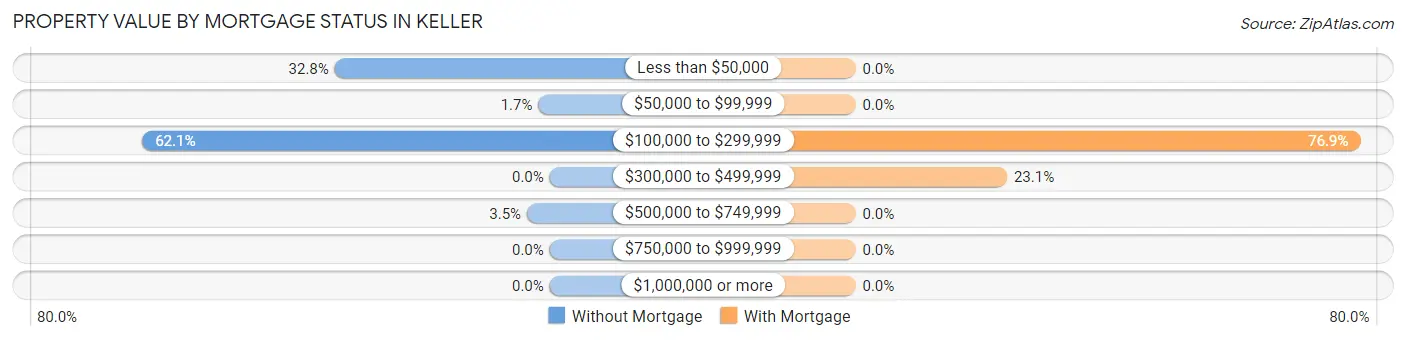
| Property Value | Without Mortgage | With Mortgage |
| Less than $50,000 | 19 (32.8%) | 0 (0.0%) |
| $50,000 to $99,999 | 1 (1.7%) | 0 (0.0%) |
| $100,000 to $299,999 | 36 (62.1%) | 10 (76.9%) |
| $300,000 to $499,999 | 0 (0.0%) | 3 (23.1%) |
| $500,000 to $749,999 | 2 (3.5%) | 0 (0.0%) |
| $750,000 to $999,999 | 0 (0.0%) | 0 (0.0%) |
| $1,000,000 or more | 0 (0.0%) | 0 (0.0%) |
| Total | 58 (100.0%) | 13 (100.0%) |
Household Income by Mortgage Status in Keller
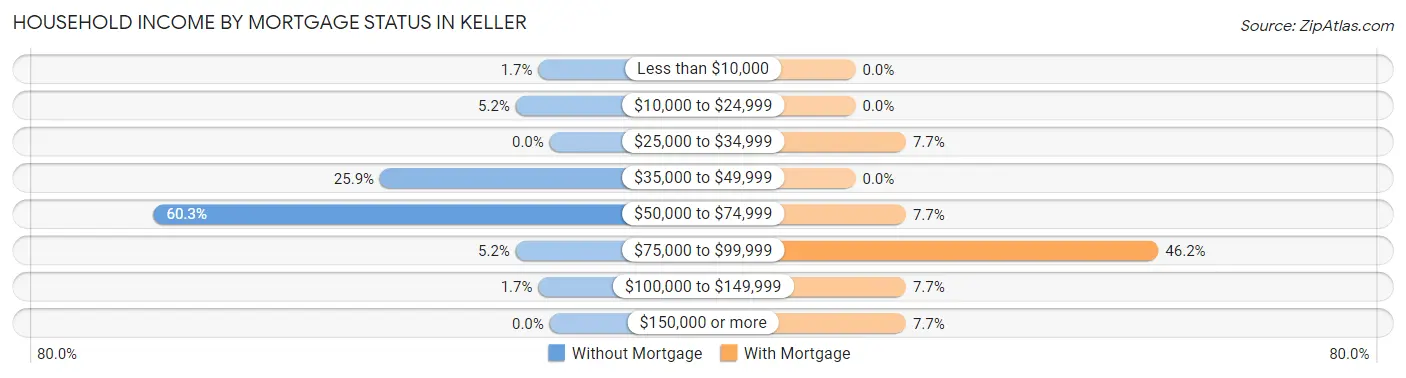
| Household Income | Without Mortgage | With Mortgage |
| Less than $10,000 | 1 (1.7%) | 0 (0.0%) |
| $10,000 to $24,999 | 3 (5.2%) | 0 (0.0%) |
| $25,000 to $34,999 | 0 (0.0%) | 1 (7.7%) |
| $35,000 to $49,999 | 15 (25.9%) | 0 (0.0%) |
| $50,000 to $74,999 | 35 (60.3%) | 1 (7.7%) |
| $75,000 to $99,999 | 3 (5.2%) | 6 (46.2%) |
| $100,000 to $149,999 | 1 (1.7%) | 1 (7.7%) |
| $150,000 or more | 0 (0.0%) | 1 (7.7%) |
| Total | 58 (100.0%) | 13 (100.0%) |
Property Value to Household Income Ratio in Keller
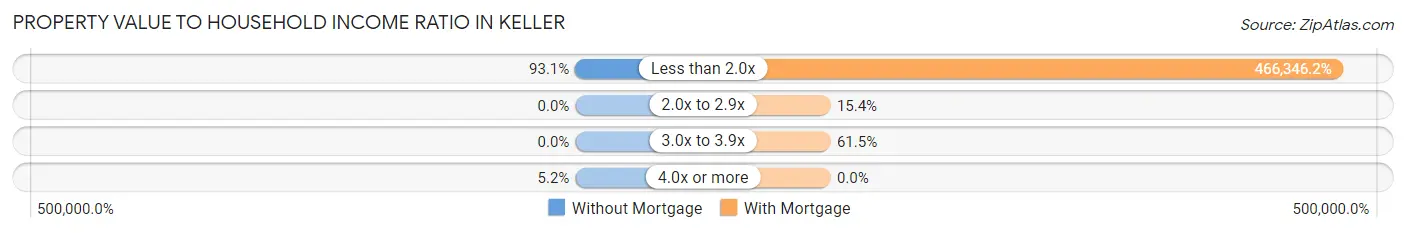
| Value-to-Income Ratio | Without Mortgage | With Mortgage |
| Less than 2.0x | 54 (93.1%) | 60,625 (466,346.2%) |
| 2.0x to 2.9x | 0 (0.0%) | 2 (15.4%) |
| 3.0x to 3.9x | 0 (0.0%) | 8 (61.5%) |
| 4.0x or more | 3 (5.2%) | 0 (0.0%) |
| Total | 58 (100.0%) | 13 (100.0%) |
Real Estate Taxes by Mortgage Status in Keller
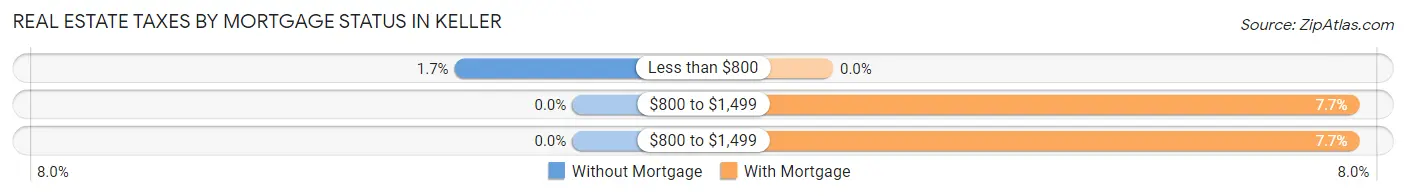
| Property Taxes | Without Mortgage | With Mortgage |
| Less than $800 | 1 (1.7%) | 0 (0.0%) |
| $800 to $1,499 | 0 (0.0%) | 1 (7.7%) |
| $800 to $1,499 | 0 (0.0%) | 1 (7.7%) |
| Total | 58 (100.0%) | 13 (100.0%) |
Health & Disability in Keller
Health Insurance Coverage by Age in Keller
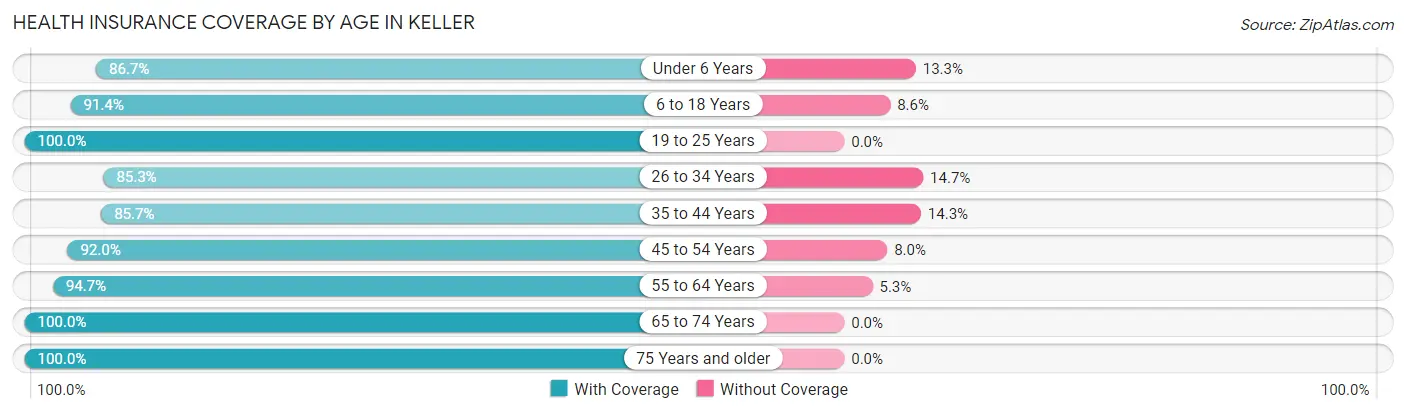
| Age Bracket | With Coverage | Without Coverage |
| Under 6 Years | 13 (86.7%) | 2 (13.3%) |
| 6 to 18 Years | 32 (91.4%) | 3 (8.6%) |
| 19 to 25 Years | 12 (100.0%) | 0 (0.0%) |
| 26 to 34 Years | 29 (85.3%) | 5 (14.7%) |
| 35 to 44 Years | 24 (85.7%) | 4 (14.3%) |
| 45 to 54 Years | 23 (92.0%) | 2 (8.0%) |
| 55 to 64 Years | 18 (94.7%) | 1 (5.3%) |
| 65 to 74 Years | 74 (100.0%) | 0 (0.0%) |
| 75 Years and older | 14 (100.0%) | 0 (0.0%) |
| Total | 239 (93.4%) | 17 (6.6%) |
Health Insurance Coverage by Citizenship Status in Keller
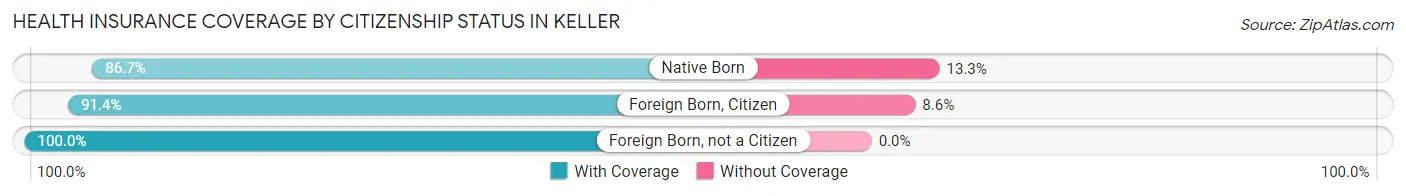
| Citizenship Status | With Coverage | Without Coverage |
| Native Born | 13 (86.7%) | 2 (13.3%) |
| Foreign Born, Citizen | 32 (91.4%) | 3 (8.6%) |
| Foreign Born, not a Citizen | 12 (100.0%) | 0 (0.0%) |
Health Insurance Coverage by Household Income in Keller
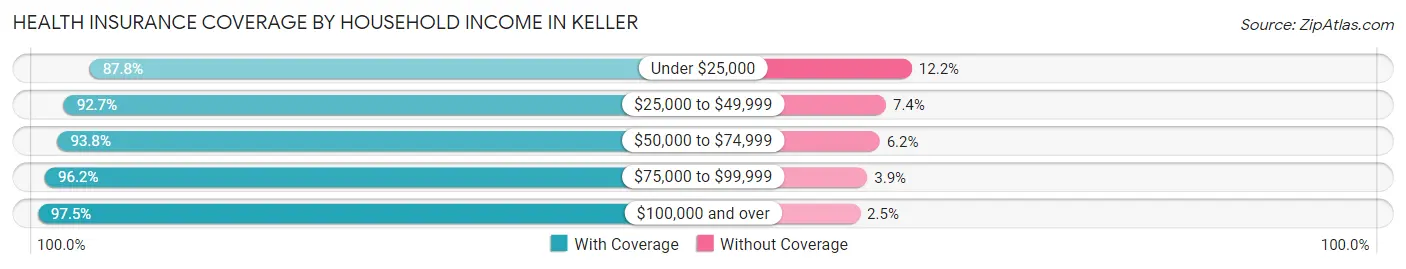
| Household Income | With Coverage | Without Coverage |
| Under $25,000 | 36 (87.8%) | 5 (12.2%) |
| $25,000 to $49,999 | 63 (92.6%) | 5 (7.3%) |
| $50,000 to $74,999 | 76 (93.8%) | 5 (6.2%) |
| $75,000 to $99,999 | 25 (96.2%) | 1 (3.8%) |
| $100,000 and over | 39 (97.5%) | 1 (2.5%) |
Public vs Private Health Insurance Coverage by Age in Keller
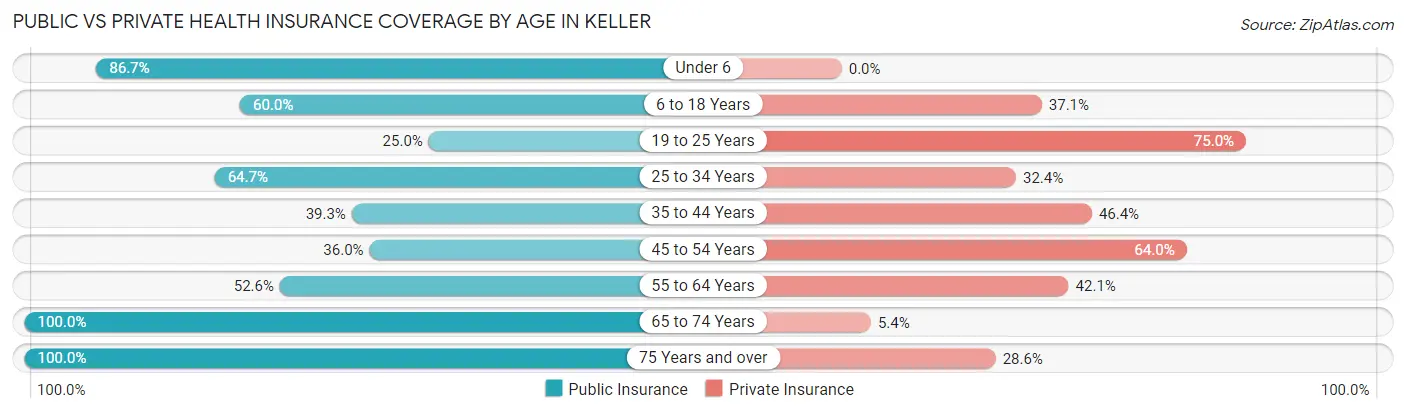
| Age Bracket | Public Insurance | Private Insurance |
| Under 6 | 13 (86.7%) | 0 (0.0%) |
| 6 to 18 Years | 21 (60.0%) | 13 (37.1%) |
| 19 to 25 Years | 3 (25.0%) | 9 (75.0%) |
| 25 to 34 Years | 22 (64.7%) | 11 (32.4%) |
| 35 to 44 Years | 11 (39.3%) | 13 (46.4%) |
| 45 to 54 Years | 9 (36.0%) | 16 (64.0%) |
| 55 to 64 Years | 10 (52.6%) | 8 (42.1%) |
| 65 to 74 Years | 74 (100.0%) | 4 (5.4%) |
| 75 Years and over | 14 (100.0%) | 4 (28.6%) |
| Total | 177 (69.1%) | 78 (30.5%) |
Disability Status by Sex by Age in Keller
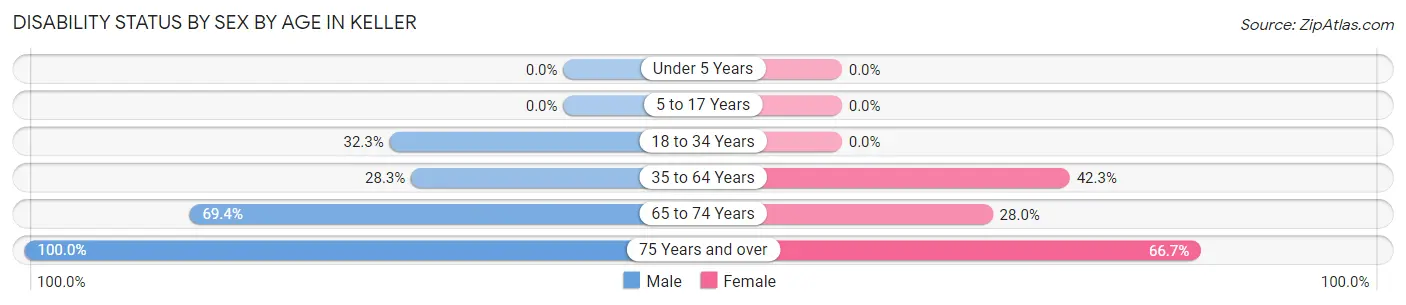
| Age Bracket | Male | Female |
| Under 5 Years | 0 (0.0%) | 0 (0.0%) |
| 5 to 17 Years | 0 (0.0%) | 0 (0.0%) |
| 18 to 34 Years | 10 (32.3%) | 0 (0.0%) |
| 35 to 64 Years | 13 (28.3%) | 11 (42.3%) |
| 65 to 74 Years | 34 (69.4%) | 7 (28.0%) |
| 75 Years and over | 11 (100.0%) | 2 (66.7%) |
Disability Class by Sex by Age in Keller
Disability Class: Hearing Difficulty
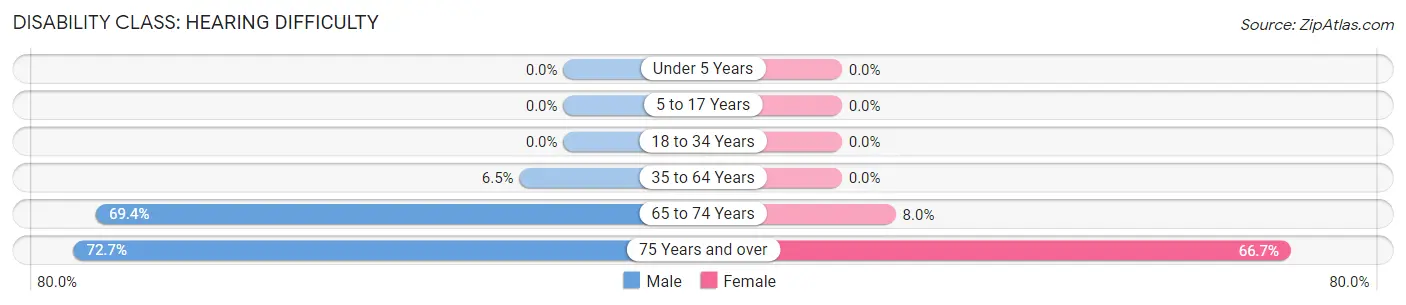
| Age Bracket | Male | Female |
| Under 5 Years | 0 (0.0%) | 0 (0.0%) |
| 5 to 17 Years | 0 (0.0%) | 0 (0.0%) |
| 18 to 34 Years | 0 (0.0%) | 0 (0.0%) |
| 35 to 64 Years | 3 (6.5%) | 0 (0.0%) |
| 65 to 74 Years | 34 (69.4%) | 2 (8.0%) |
| 75 Years and over | 8 (72.7%) | 2 (66.7%) |
Disability Class: Vision Difficulty
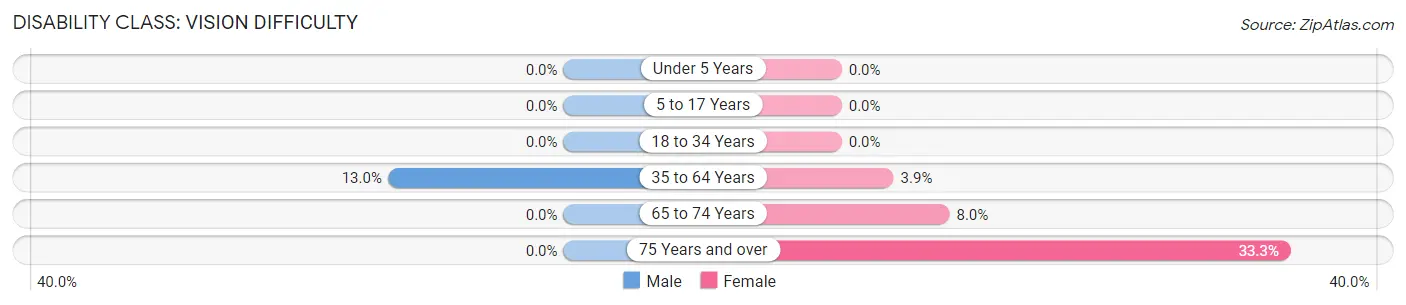
| Age Bracket | Male | Female |
| Under 5 Years | 0 (0.0%) | 0 (0.0%) |
| 5 to 17 Years | 0 (0.0%) | 0 (0.0%) |
| 18 to 34 Years | 0 (0.0%) | 0 (0.0%) |
| 35 to 64 Years | 6 (13.0%) | 1 (3.8%) |
| 65 to 74 Years | 0 (0.0%) | 2 (8.0%) |
| 75 Years and over | 0 (0.0%) | 1 (33.3%) |
Disability Class: Cognitive Difficulty
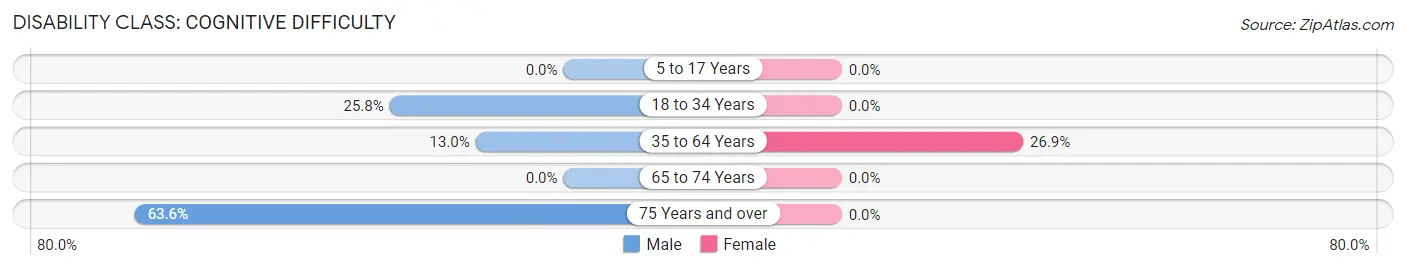
| Age Bracket | Male | Female |
| 5 to 17 Years | 0 (0.0%) | 0 (0.0%) |
| 18 to 34 Years | 8 (25.8%) | 0 (0.0%) |
| 35 to 64 Years | 6 (13.0%) | 7 (26.9%) |
| 65 to 74 Years | 0 (0.0%) | 0 (0.0%) |
| 75 Years and over | 7 (63.6%) | 0 (0.0%) |
Disability Class: Ambulatory Difficulty
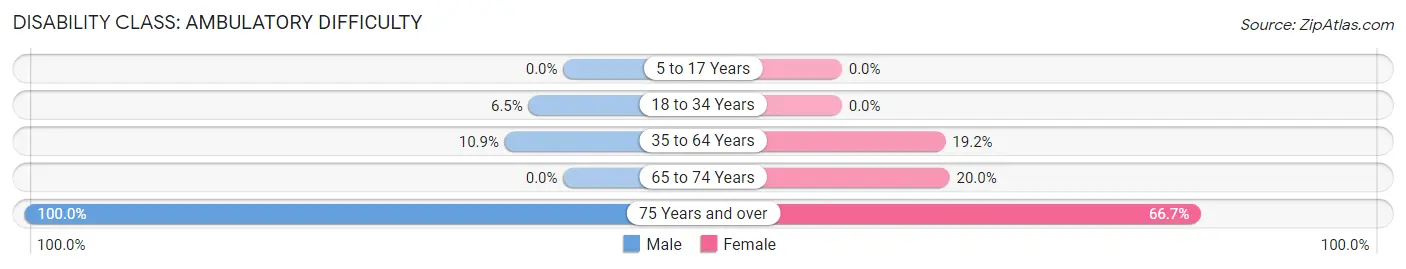
| Age Bracket | Male | Female |
| 5 to 17 Years | 0 (0.0%) | 0 (0.0%) |
| 18 to 34 Years | 2 (6.5%) | 0 (0.0%) |
| 35 to 64 Years | 5 (10.9%) | 5 (19.2%) |
| 65 to 74 Years | 0 (0.0%) | 5 (20.0%) |
| 75 Years and over | 11 (100.0%) | 2 (66.7%) |
Disability Class: Self-Care Difficulty
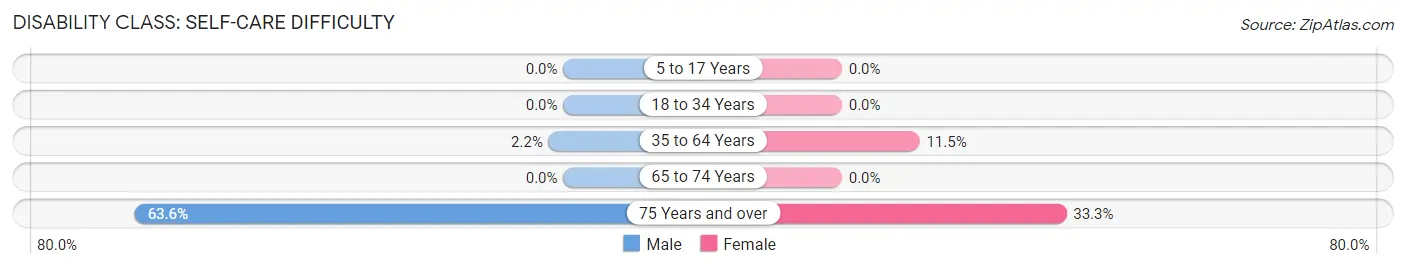
| Age Bracket | Male | Female |
| 5 to 17 Years | 0 (0.0%) | 0 (0.0%) |
| 18 to 34 Years | 0 (0.0%) | 0 (0.0%) |
| 35 to 64 Years | 1 (2.2%) | 3 (11.5%) |
| 65 to 74 Years | 0 (0.0%) | 0 (0.0%) |
| 75 Years and over | 7 (63.6%) | 1 (33.3%) |
Technology Access in Keller
Computing Device Access in Keller
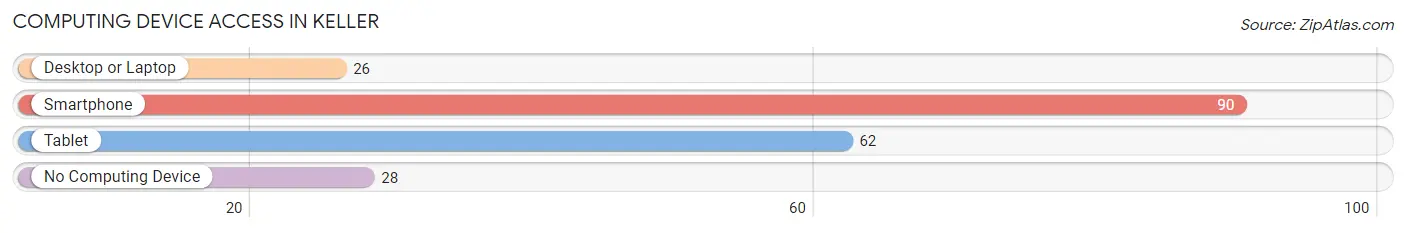
| Device Type | # Households | % Households |
| Desktop or Laptop | 26 | 22.0% |
| Smartphone | 90 | 76.3% |
| Tablet | 62 | 52.5% |
| No Computing Device | 28 | 23.7% |
| Total | 118 | 100.0% |
Internet Access in Keller
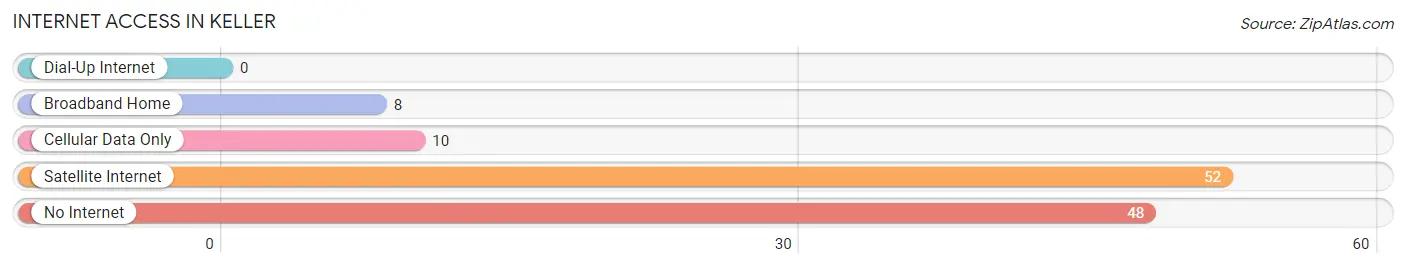
| Internet Type | # Households | % Households |
| Dial-Up Internet | 0 | 0.0% |
| Broadband Home | 8 | 6.8% |
| Cellular Data Only | 10 | 8.5% |
| Satellite Internet | 52 | 44.1% |
| No Internet | 48 | 40.7% |
| Total | 118 | 100.0% |
Keller Summary
Keller is a small town located in the state of Washington, United States. It is situated in the northern part of the state, in the county of Stevens. The town has a population of approximately 1,000 people, and is located in a rural area.
Geography
Keller is located in the northern part of Washington, in the county of Stevens. It is situated in a rural area, and is surrounded by rolling hills and farmland. The town is located at an elevation of 1,400 feet, and is situated on the banks of the Columbia River. The climate in Keller is generally mild, with temperatures ranging from the mid-30s in the winter to the mid-80s in the summer.
Economy
Keller’s economy is largely based on agriculture and tourism. The town is home to several farms, which produce a variety of crops, including wheat, corn, and hay. The town also has a number of small businesses, including restaurants, stores, and a few small manufacturing companies. Tourism is also an important part of the local economy, as the town is located near several popular recreational areas, such as the Columbia River Gorge and the Cascade Mountains.
Demographics
Keller has a population of approximately 1,000 people, with a median age of 38. The town is predominantly white, with a small Hispanic population. The median household income in Keller is $45,000, and the median home value is $150,000. The town has a low unemployment rate, and a high rate of homeownership.
History
Keller was founded in 1883 by a group of settlers from the Midwest. The town was originally named “Keller’s Landing”, after the first settler, John Keller. The town was incorporated in 1889, and the name was changed to Keller. The town grew slowly over the years, and by the early 1900s, it had become a thriving agricultural community. In the 1950s, the town began to experience a decline in population, as many of the younger residents moved away to pursue better opportunities in larger cities. However, in recent years, the town has seen a resurgence in population, as more people have moved to the area to take advantage of the rural lifestyle and the natural beauty of the area.
Keller is a small town with a rich history and a vibrant economy. It is located in a rural area, and is surrounded by rolling hills and farmland. The town has a population of approximately 1,000 people, and is home to several farms and small businesses. The town also has a number of popular recreational areas, and is a popular destination for tourists. Keller is a great place to live, work, and play, and is a great example of the rural lifestyle in Washington.
Common Questions
What is Per Capita Income in Keller?
Per Capita income in Keller is $25,999.
What is the Median Family Income in Keller?
Median Family Income in Keller is $70,000.
What is the Median Household income in Keller?
Median Household Income in Keller is $57,500.
What is Income or Wage Gap in Keller?
Income or Wage Gap in Keller is 61.4%.
Women in Keller earn 38.6 cents for every dollar earned by a man.
What is Inequality or Gini Index in Keller?
Inequality or Gini Index in Keller is 0.33.
What is the Total Population of Keller?
Total Population of Keller is 256.
What is the Total Male Population of Keller?
Total Male Population of Keller is 152.
What is the Total Female Population of Keller?
Total Female Population of Keller is 104.
What is the Ratio of Males per 100 Females in Keller?
There are 146.15 Males per 100 Females in Keller.
What is the Ratio of Females per 100 Males in Keller?
There are 68.42 Females per 100 Males in Keller.
What is the Median Population Age in Keller?
Median Population Age in Keller is 47.0 Years.
What is the Average Family Size in Keller
Average Family Size in Keller is 2.4 People.
What is the Average Household Size in Keller
Average Household Size in Keller is 2.2 People.
How Large is the Labor Force in Keller?
There are 106 People in the Labor Forcein in Keller.
What is the Percentage of People in the Labor Force in Keller?
47.5% of People are in the Labor Force in Keller.
What is the Unemployment Rate in Keller?
Unemployment Rate in Keller is 5.7%.