Zip Codes with the Highest Percentage of Population Employed in Computer, Engineering & Science in Woodinville, WA
RELATED REPORTS & OPTIONS
Computer, Engineering & Science
Woodinville
Compare Zip Codes
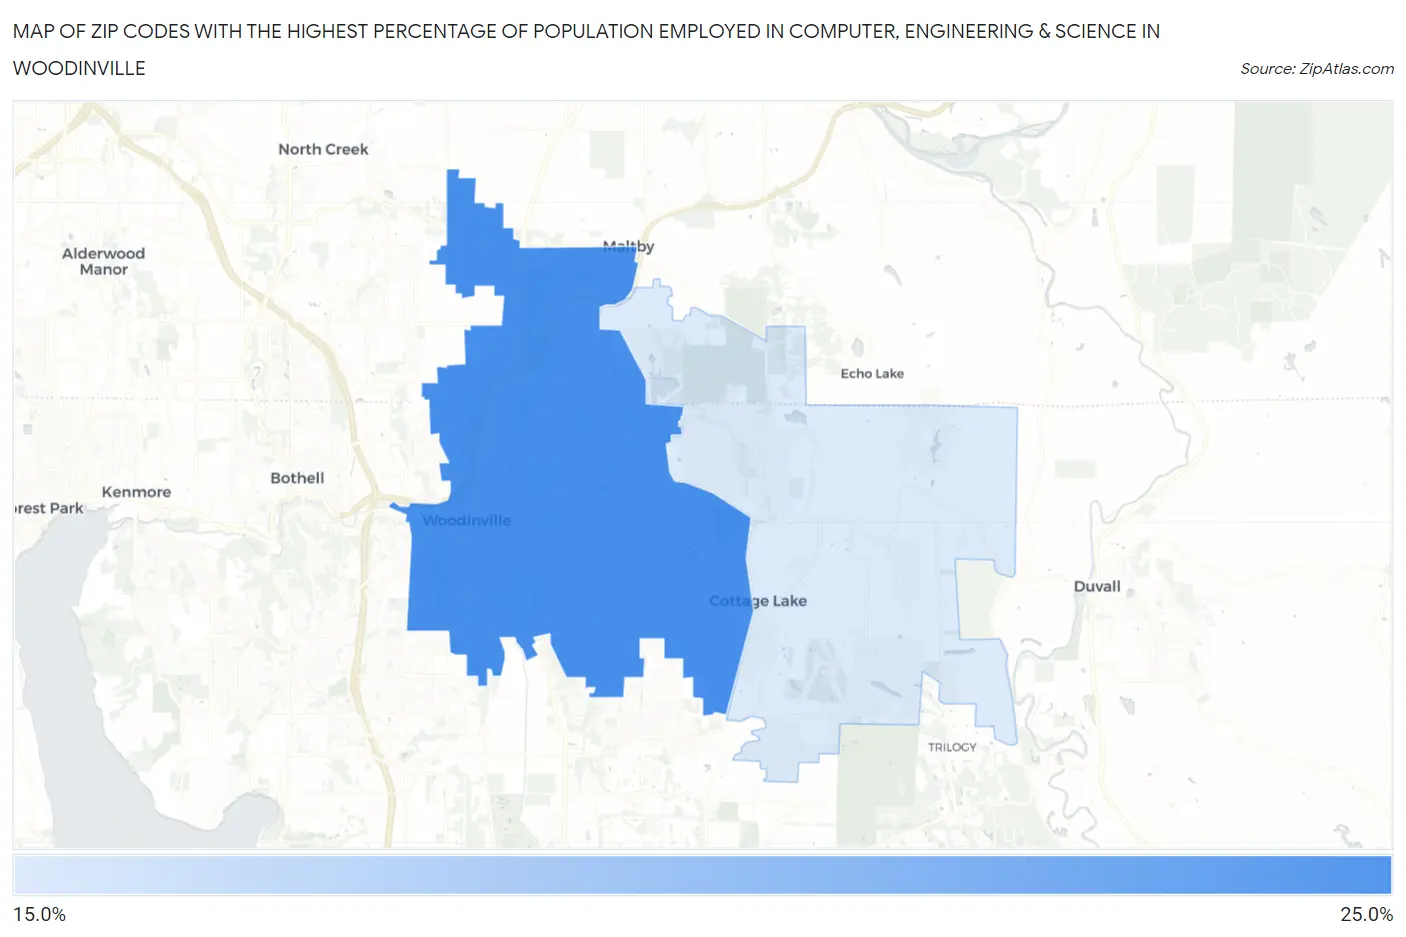
Map of Zip Codes with the Highest Percentage of Population Employed in Computer, Engineering & Science in Woodinville
17.6%
21.0%
Zip Codes with the Highest Percentage of Population Employed in Computer, Engineering & Science in Woodinville, WA
| Zip Code | % Employed | vs State | vs National | |
| 1. | 98072 | 21.0% | 10.2%(+10.9)#32 | 6.8%(+14.3)#437 |
| 2. | 98077 | 17.6% | 10.2%(+7.45)#49 | 6.8%(+10.8)#736 |
1
Common Questions
What are the Top Zip Codes with the Highest Percentage of Population Employed in Computer, Engineering & Science in Woodinville, WA?
Top Zip Codes with the Highest Percentage of Population Employed in Computer, Engineering & Science in Woodinville, WA are:
What zip code has the Highest Percentage of Population Employed in Computer, Engineering & Science in Woodinville, WA?
98072 has the Highest Percentage of Population Employed in Computer, Engineering & Science in Woodinville, WA with 21.0%.
What is the Percentage of Population Employed in Computer, Engineering & Science in Woodinville, WA?
Percentage of Population Employed in Computer, Engineering & Science in Woodinville is 20.7%.
What is the Percentage of Population Employed in Computer, Engineering & Science in Washington?
Percentage of Population Employed in Computer, Engineering & Science in Washington is 10.2%.
What is the Percentage of Population Employed in Computer, Engineering & Science in the United States?
Percentage of Population Employed in Computer, Engineering & Science in the United States is 6.8%.