Shoreline, WA Map & Demographics
Shoreline Map
Shoreline Overview
$55,932
PER CAPITA INCOME
$137,112
AVG FAMILY INCOME
$106,184
AVG HOUSEHOLD INCOME
27.0%
WAGE / INCOME GAP [ % ]
73.0¢/ $1
WAGE / INCOME GAP [ $ ]
$8,934
FAMILY INCOME DEFICIT
0.45
INEQUALITY / GINI INDEX
58,673
TOTAL POPULATION
29,070
MALE POPULATION
29,603
FEMALE POPULATION
98.20
MALES / 100 FEMALES
101.83
FEMALES / 100 MALES
41.8
MEDIAN AGE
3.0
AVG FAMILY SIZE
2.5
AVG HOUSEHOLD SIZE
31,979
LABOR FORCE [ PEOPLE ]
65.4%
PERCENT IN LABOR FORCE
4.4%
UNEMPLOYMENT RATE
Income in Shoreline
Income Overview in Shoreline
Per Capita Income in Shoreline is $55,932, while median incomes of families and households are $137,112 and $106,184 respectively.
| Characteristic | Number | Measure |
| Per Capita Income | 58,673 | $55,932 |
| Median Family Income | 14,770 | $137,112 |
| Mean Family Income | 14,770 | $165,195 |
| Median Household Income | 22,706 | $106,184 |
| Mean Household Income | 22,706 | $138,839 |
| Income Deficit | 14,770 | $8,934 |
| Wage / Income Gap (%) | 58,673 | 26.95% |
| Wage / Income Gap ($) | 58,673 | 73.05¢ per $1 |
| Gini / Inequality Index | 58,673 | 0.45 |
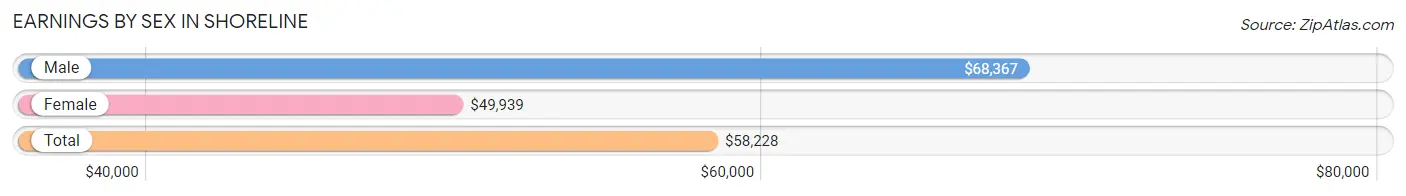
Earnings by Sex in Shoreline
Average Earnings in Shoreline are $58,228, $68,367 for men and $49,939 for women, a difference of 27.0%.
| Sex | Number | Average Earnings |
| Male | 17,768 (53.1%) | $68,367 |
| Female | 15,681 (46.9%) | $49,939 |
| Total | 33,449 (100.0%) | $58,228 |
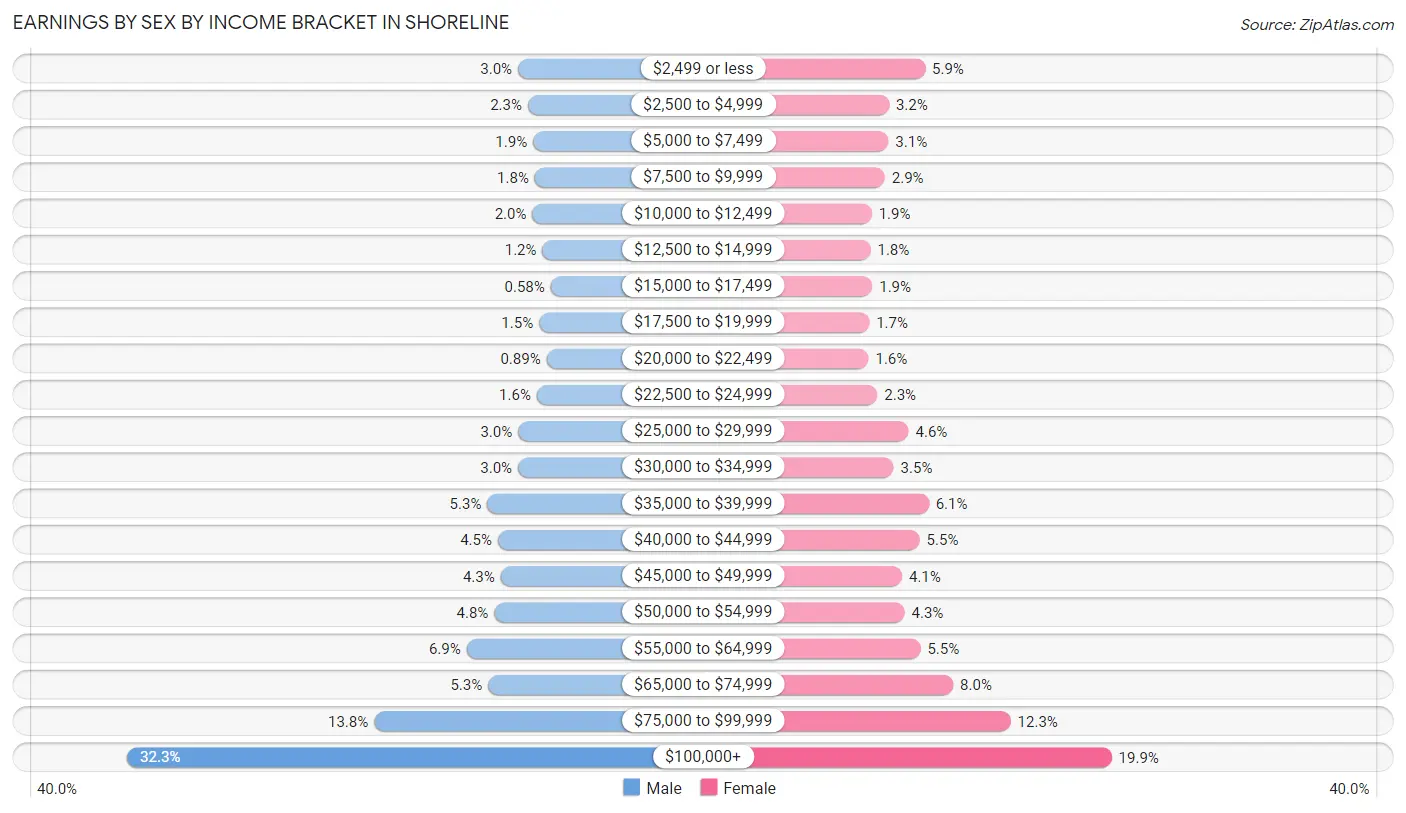
Earnings by Sex by Income Bracket in Shoreline
The most common earnings brackets in Shoreline are $100,000+ for men (5,741 | 32.3%) and $100,000+ for women (3,112 | 19.9%).
| Income | Male | Female |
| $2,499 or less | 539 (3.0%) | 920 (5.9%) |
| $2,500 to $4,999 | 407 (2.3%) | 496 (3.2%) |
| $5,000 to $7,499 | 337 (1.9%) | 489 (3.1%) |
| $7,500 to $9,999 | 314 (1.8%) | 447 (2.9%) |
| $10,000 to $12,499 | 347 (1.9%) | 294 (1.9%) |
| $12,500 to $14,999 | 213 (1.2%) | 279 (1.8%) |
| $15,000 to $17,499 | 103 (0.6%) | 300 (1.9%) |
| $17,500 to $19,999 | 258 (1.5%) | 264 (1.7%) |
| $20,000 to $22,499 | 159 (0.9%) | 256 (1.6%) |
| $22,500 to $24,999 | 287 (1.6%) | 359 (2.3%) |
| $25,000 to $29,999 | 536 (3.0%) | 726 (4.6%) |
| $30,000 to $34,999 | 539 (3.0%) | 551 (3.5%) |
| $35,000 to $39,999 | 947 (5.3%) | 963 (6.1%) |
| $40,000 to $44,999 | 806 (4.5%) | 856 (5.5%) |
| $45,000 to $49,999 | 769 (4.3%) | 649 (4.1%) |
| $50,000 to $54,999 | 854 (4.8%) | 679 (4.3%) |
| $55,000 to $64,999 | 1,223 (6.9%) | 866 (5.5%) |
| $65,000 to $74,999 | 936 (5.3%) | 1,249 (8.0%) |
| $75,000 to $99,999 | 2,453 (13.8%) | 1,926 (12.3%) |
| $100,000+ | 5,741 (32.3%) | 3,112 (19.9%) |
| Total | 17,768 (100.0%) | 15,681 (100.0%) |
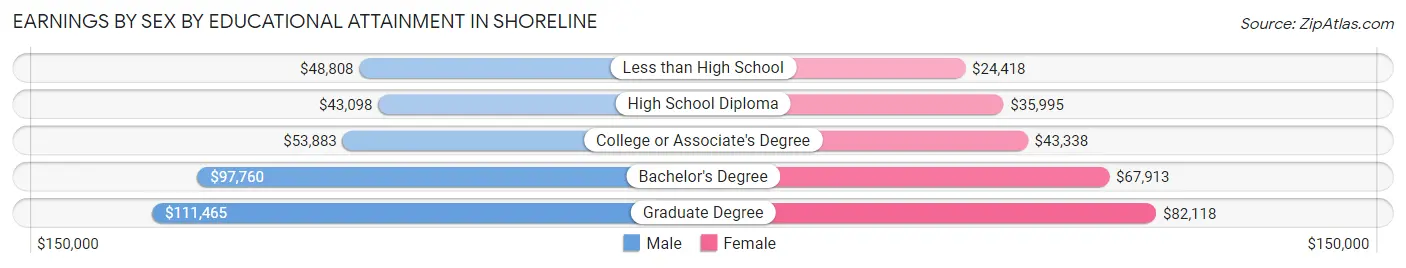
Earnings by Sex by Educational Attainment in Shoreline
Average earnings in Shoreline are $74,621 for men and $54,860 for women, a difference of 26.5%. Men with an educational attainment of graduate degree enjoy the highest average annual earnings of $111,465, while those with high school diploma education earn the least with $43,098. Women with an educational attainment of graduate degree earn the most with the average annual earnings of $82,118, while those with less than high school education have the smallest earnings of $24,418.
| Educational Attainment | Male Income | Female Income |
| Less than High School | $48,808 | $24,418 |
| High School Diploma | $43,098 | $35,995 |
| College or Associate's Degree | $53,883 | $43,338 |
| Bachelor's Degree | $97,760 | $67,913 |
| Graduate Degree | $111,465 | $82,118 |
| Total | $74,621 | $54,860 |
Family Income in Shoreline
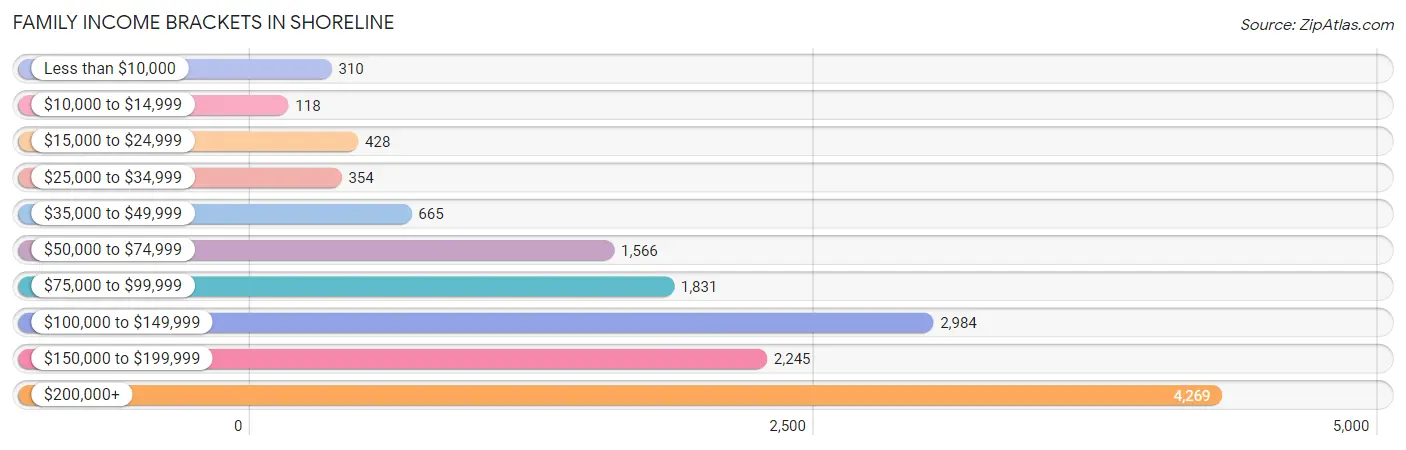
Family Income Brackets in Shoreline
According to the Shoreline family income data, there are 4,269 families falling into the $200,000+ income range, which is the most common income bracket and makes up 28.9% of all families. Conversely, the $10,000 to $14,999 income bracket is the least frequent group with only 118 families (0.8%) belonging to this category.
| Income Bracket | # Families | % Families |
| Less than $10,000 | 310 | 2.1% |
| $10,000 to $14,999 | 118 | 0.8% |
| $15,000 to $24,999 | 428 | 2.9% |
| $25,000 to $34,999 | 354 | 2.4% |
| $35,000 to $49,999 | 665 | 4.5% |
| $50,000 to $74,999 | 1,566 | 10.6% |
| $75,000 to $99,999 | 1,831 | 12.4% |
| $100,000 to $149,999 | 2,984 | 20.2% |
| $150,000 to $199,999 | 2,245 | 15.2% |
| $200,000+ | 4,269 | 28.9% |
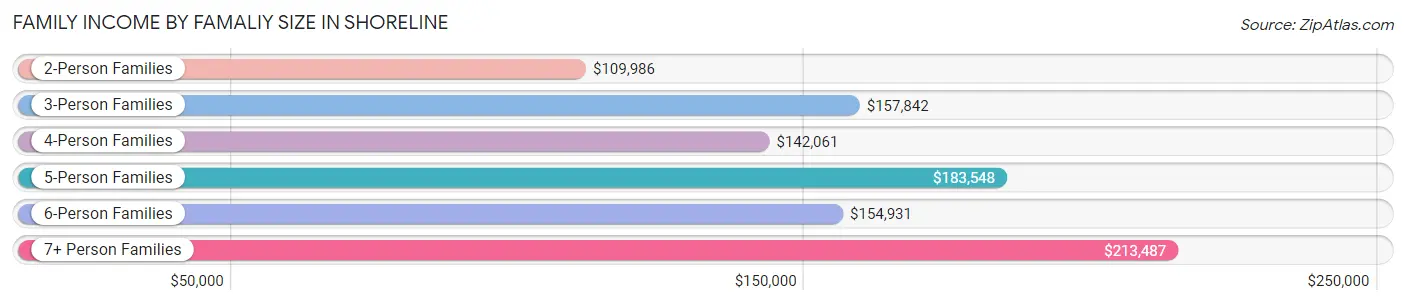
Family Income by Famaliy Size in Shoreline
7+ person families (95 | 0.6%) account for the highest median family income in Shoreline with $213,487 per family, while 2-person families (6,926 | 46.9%) have the highest median income of $54,993 per family member.
| Income Bracket | # Families | Median Income |
| 2-Person Families | 6,926 (46.9%) | $109,986 |
| 3-Person Families | 3,518 (23.8%) | $157,842 |
| 4-Person Families | 3,116 (21.1%) | $142,061 |
| 5-Person Families | 756 (5.1%) | $183,548 |
| 6-Person Families | 359 (2.4%) | $154,931 |
| 7+ Person Families | 95 (0.6%) | $213,487 |
| Total | 14,770 (100.0%) | $137,112 |
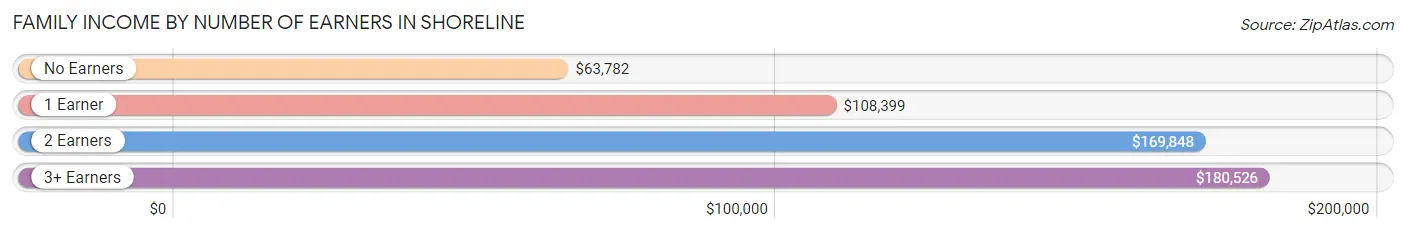
Family Income by Number of Earners in Shoreline
The median family income in Shoreline is $137,112, with families comprising 3+ earners (1,792) having the highest median family income of $180,526, while families with no earners (1,935) have the lowest median family income of $63,782, accounting for 12.1% and 13.1% of families, respectively.
| Number of Earners | # Families | Median Income |
| No Earners | 1,935 (13.1%) | $63,782 |
| 1 Earner | 3,915 (26.5%) | $108,399 |
| 2 Earners | 7,128 (48.3%) | $169,848 |
| 3+ Earners | 1,792 (12.1%) | $180,526 |
| Total | 14,770 (100.0%) | $137,112 |
Household Income in Shoreline
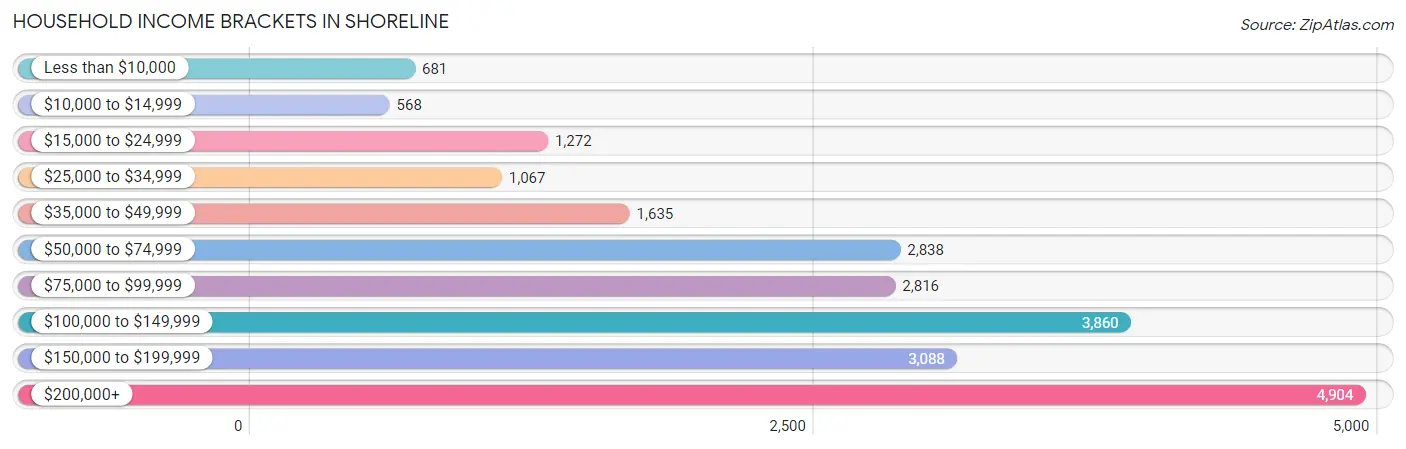
Household Income Brackets in Shoreline
With 4,904 households falling in the category, the $200,000+ income range is the most frequent in Shoreline, accounting for 21.6% of all households. In contrast, only 568 households (2.5%) fall into the $10,000 to $14,999 income bracket, making it the least populous group.
| Income Bracket | # Households | % Households |
| Less than $10,000 | 681 | 3.0% |
| $10,000 to $14,999 | 568 | 2.5% |
| $15,000 to $24,999 | 1,272 | 5.6% |
| $25,000 to $34,999 | 1,067 | 4.7% |
| $35,000 to $49,999 | 1,635 | 7.2% |
| $50,000 to $74,999 | 2,838 | 12.5% |
| $75,000 to $99,999 | 2,816 | 12.4% |
| $100,000 to $149,999 | 3,860 | 17.0% |
| $150,000 to $199,999 | 3,088 | 13.6% |
| $200,000+ | 4,904 | 21.6% |
Household Income by Householder Age in Shoreline
The median household income in Shoreline is $106,184, with the highest median household income of $136,795 found in the 25 to 44 years age bracket for the primary householder. A total of 7,541 households (33.2%) fall into this category. Meanwhile, the 15 to 24 years age bracket for the primary householder has the lowest median household income of $69,219, with 479 households (2.1%) in this group.
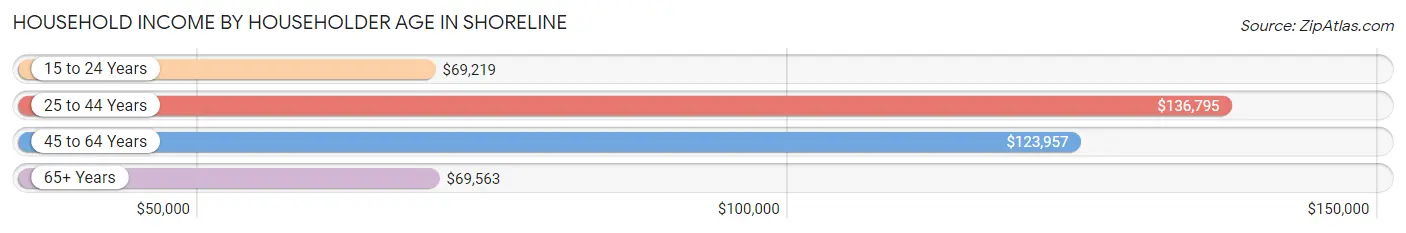
| Income Bracket | # Households | Median Income |
| 15 to 24 Years | 479 (2.1%) | $69,219 |
| 25 to 44 Years | 7,541 (33.2%) | $136,795 |
| 45 to 64 Years | 8,137 (35.8%) | $123,957 |
| 65+ Years | 6,549 (28.8%) | $69,563 |
| Total | 22,706 (100.0%) | $106,184 |
Poverty in Shoreline
Income Below Poverty by Sex and Age in Shoreline
With 7.9% poverty level for males and 8.5% for females among the residents of Shoreline, 18 to 24 year old males and 16 and 17 year old females are the most vulnerable to poverty, with 286 males (17.3%) and 128 females (14.1%) in their respective age groups living below the poverty level.
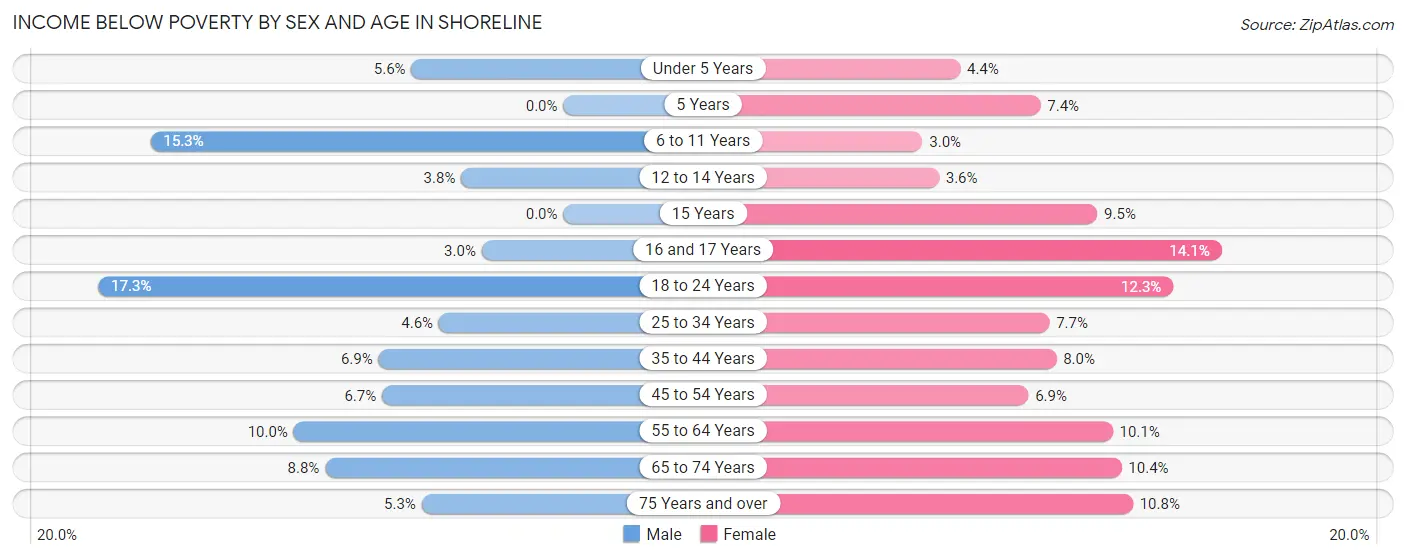
| Age Bracket | Male | Female |
| Under 5 Years | 93 (5.6%) | 63 (4.4%) |
| 5 Years | 0 (0.0%) | 23 (7.4%) |
| 6 to 11 Years | 320 (15.3%) | 49 (3.0%) |
| 12 to 14 Years | 28 (3.8%) | 34 (3.6%) |
| 15 Years | 0 (0.0%) | 20 (9.5%) |
| 16 and 17 Years | 13 (3.0%) | 128 (14.1%) |
| 18 to 24 Years | 286 (17.3%) | 210 (12.3%) |
| 25 to 34 Years | 199 (4.6%) | 318 (7.7%) |
| 35 to 44 Years | 305 (6.9%) | 340 (8.0%) |
| 45 to 54 Years | 282 (6.7%) | 252 (6.9%) |
| 55 to 64 Years | 372 (10.0%) | 387 (10.1%) |
| 65 to 74 Years | 284 (8.8%) | 335 (10.4%) |
| 75 Years and over | 88 (5.3%) | 301 (10.8%) |
| Total | 2,270 (7.9%) | 2,460 (8.5%) |
Income Above Poverty by Sex and Age in Shoreline
According to the poverty statistics in Shoreline, males aged 5 years and females aged 6 to 11 years are the age groups that are most secure financially, with 100.0% of males and 97.0% of females in these age groups living above the poverty line.
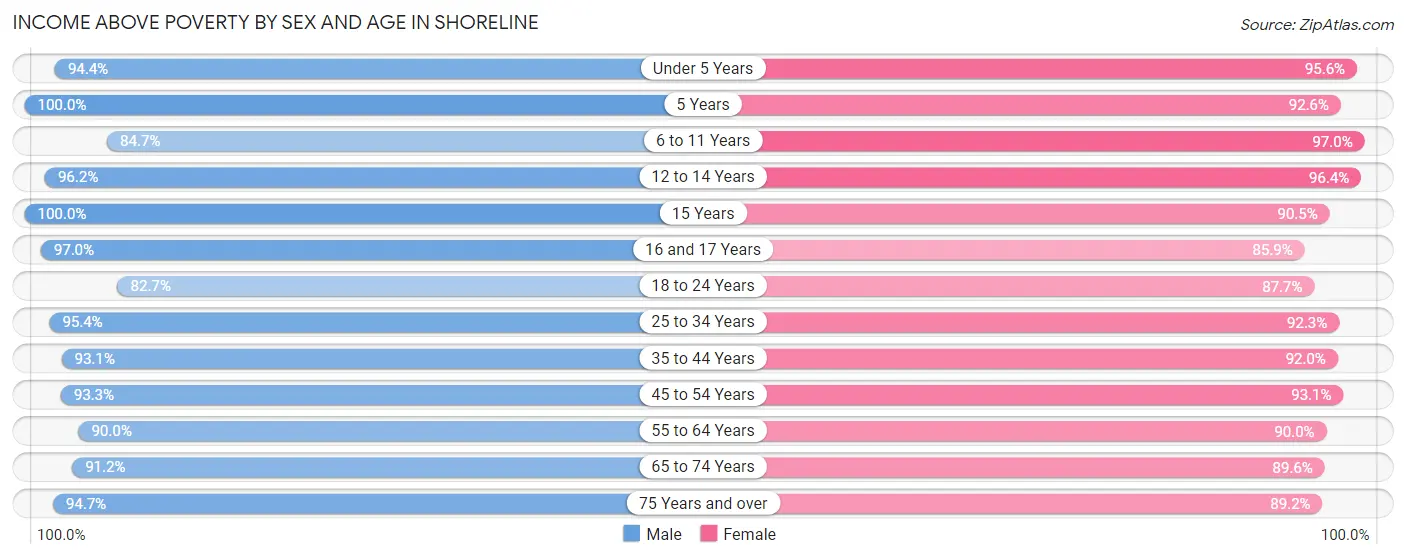
| Age Bracket | Male | Female |
| Under 5 Years | 1,557 (94.4%) | 1,372 (95.6%) |
| 5 Years | 315 (100.0%) | 289 (92.6%) |
| 6 to 11 Years | 1,768 (84.7%) | 1,592 (97.0%) |
| 12 to 14 Years | 710 (96.2%) | 911 (96.4%) |
| 15 Years | 327 (100.0%) | 191 (90.5%) |
| 16 and 17 Years | 416 (97.0%) | 780 (85.9%) |
| 18 to 24 Years | 1,370 (82.7%) | 1,498 (87.7%) |
| 25 to 34 Years | 4,108 (95.4%) | 3,814 (92.3%) |
| 35 to 44 Years | 4,140 (93.1%) | 3,931 (92.0%) |
| 45 to 54 Years | 3,911 (93.3%) | 3,388 (93.1%) |
| 55 to 64 Years | 3,346 (90.0%) | 3,462 (89.9%) |
| 65 to 74 Years | 2,930 (91.2%) | 2,892 (89.6%) |
| 75 Years and over | 1,585 (94.7%) | 2,486 (89.2%) |
| Total | 26,483 (92.1%) | 26,606 (91.5%) |
Income Below Poverty Among Married-Couple Families in Shoreline
The poverty statistics for married-couple families in Shoreline show that 4.8% or 574 of the total 11,871 families live below the poverty line. Families with 3 or 4 children have the highest poverty rate of 8.2%, comprising of 52 families. On the other hand, families with 5 or more children have the lowest poverty rate of 0.0%, which includes 0 families.
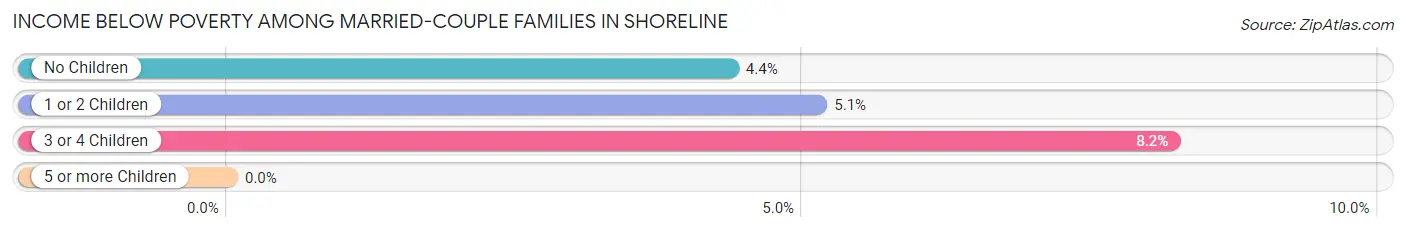
| Children | Above Poverty | Below Poverty |
| No Children | 6,604 (95.6%) | 301 (4.4%) |
| 1 or 2 Children | 4,085 (94.9%) | 221 (5.1%) |
| 3 or 4 Children | 582 (91.8%) | 52 (8.2%) |
| 5 or more Children | 26 (100.0%) | 0 (0.0%) |
| Total | 11,297 (95.2%) | 574 (4.8%) |
Income Below Poverty Among Single-Parent Households in Shoreline
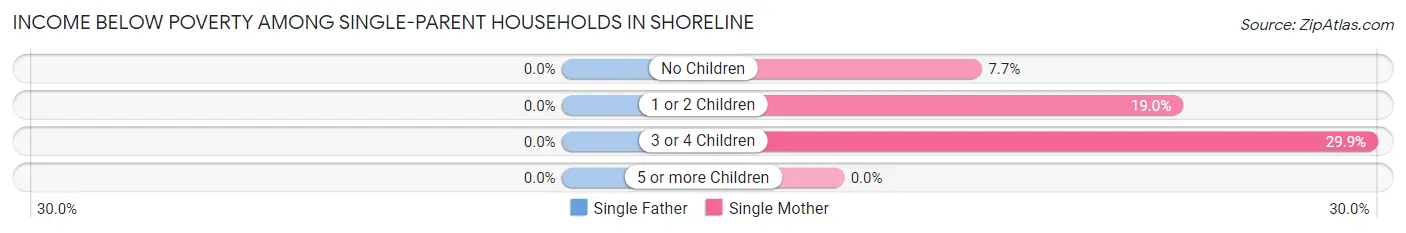
| Children | Single Father | Single Mother |
| No Children | 0 (0.0%) | 87 (7.7%) |
| 1 or 2 Children | 0 (0.0%) | 157 (19.0%) |
| 3 or 4 Children | 0 (0.0%) | 20 (29.8%) |
| 5 or more Children | 0 (0.0%) | 0 (0.0%) |
| Total | 0 (0.0%) | 264 (13.0%) |
Income Below Poverty Among Married-Couple vs Single-Parent Households in Shoreline
The poverty data for Shoreline shows that 574 of the married-couple family households (4.8%) and 264 of the single-parent households (9.1%) are living below the poverty level. Within the married-couple family households, those with 3 or 4 children have the highest poverty rate, with 52 households (8.2%) falling below the poverty line. Among the single-parent households, those with 3 or 4 children have the highest poverty rate, with 20 household (14.5%) living below poverty.
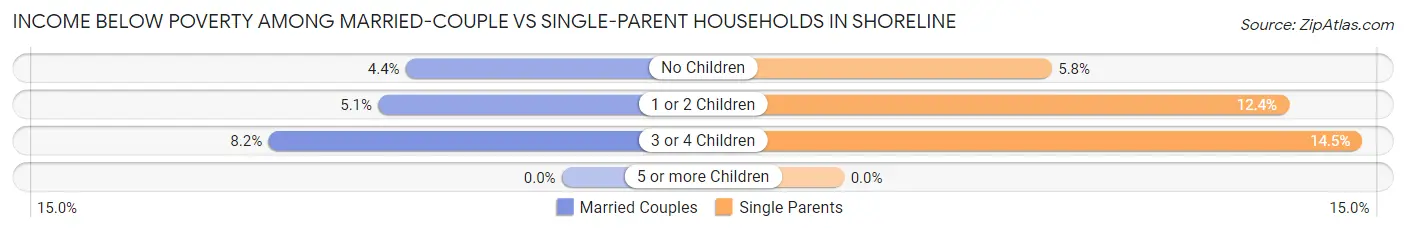
| Children | Married-Couple Families | Single-Parent Households |
| No Children | 301 (4.4%) | 87 (5.8%) |
| 1 or 2 Children | 221 (5.1%) | 157 (12.4%) |
| 3 or 4 Children | 52 (8.2%) | 20 (14.5%) |
| 5 or more Children | 0 (0.0%) | 0 (0.0%) |
| Total | 574 (4.8%) | 264 (9.1%) |
Race in Shoreline
The most populous races in Shoreline are White / Caucasian (38,340 | 65.3%), Asian (9,283 | 15.8%), and Two or more Races (5,142 | 8.8%).
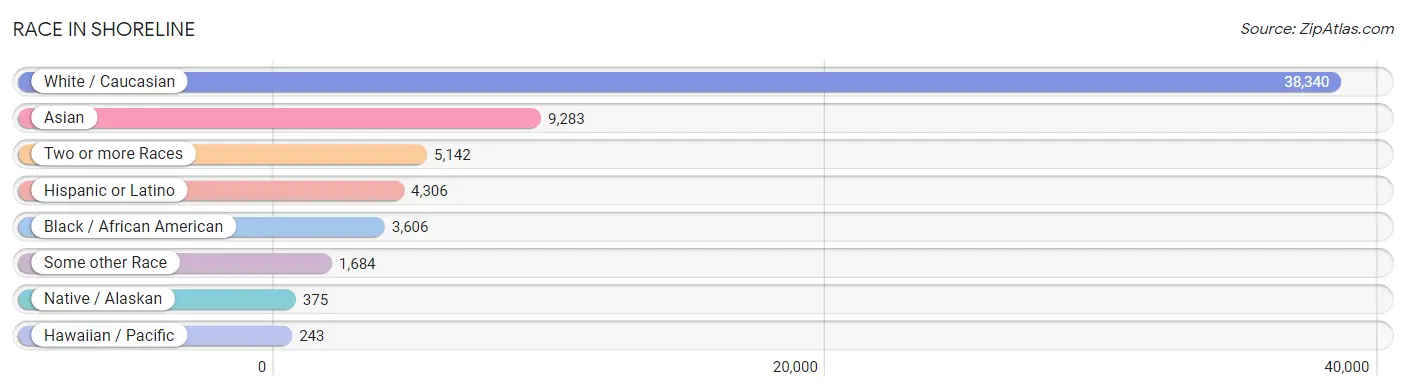
| Race | # Population | % Population |
| Asian | 9,283 | 15.8% |
| Black / African American | 3,606 | 6.1% |
| Hawaiian / Pacific | 243 | 0.4% |
| Hispanic or Latino | 4,306 | 7.3% |
| Native / Alaskan | 375 | 0.6% |
| White / Caucasian | 38,340 | 65.3% |
| Two or more Races | 5,142 | 8.8% |
| Some other Race | 1,684 | 2.9% |
| Total | 58,673 | 100.0% |
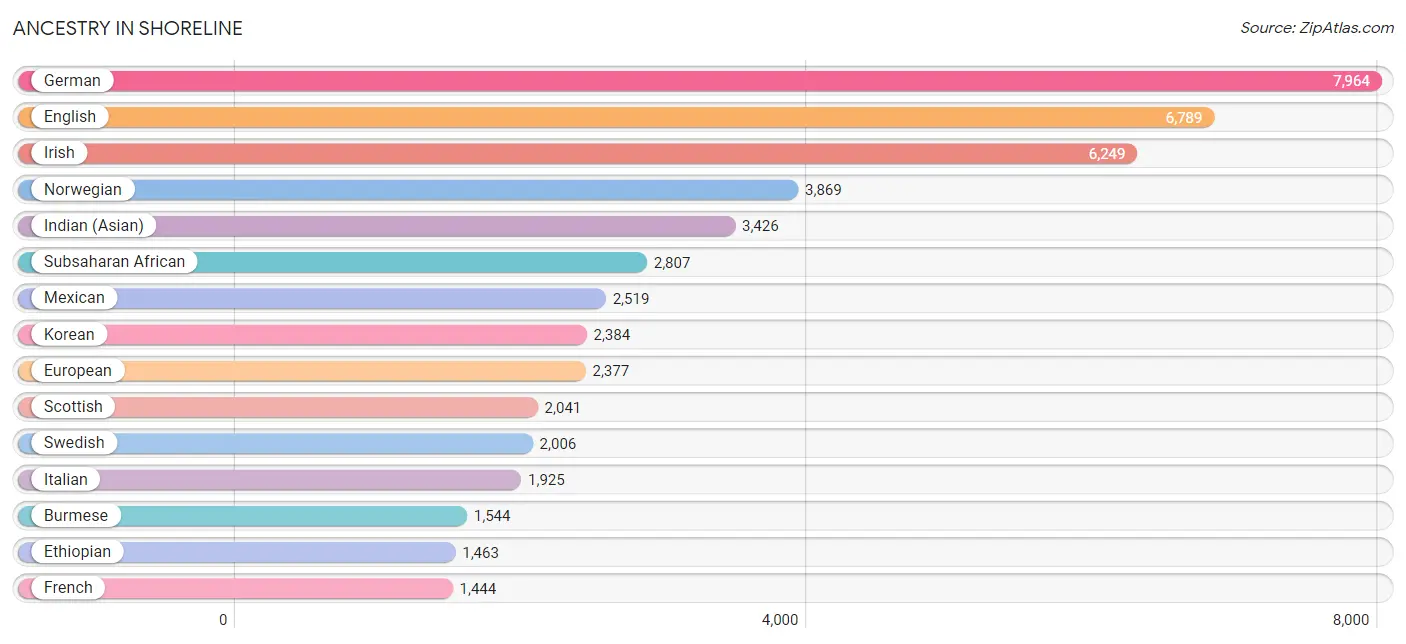
Ancestry in Shoreline
The most populous ancestries reported in Shoreline are German (7,964 | 13.6%), English (6,789 | 11.6%), Irish (6,249 | 10.6%), Norwegian (3,869 | 6.6%), and Indian (Asian) (3,426 | 5.8%), together accounting for 48.2% of all Shoreline residents.
| Ancestry | # Population | % Population |
| African | 720 | 1.2% |
| Alaska Native | 36 | 0.1% |
| Alaskan Athabascan | 22 | 0.0% |
| Albanian | 45 | 0.1% |
| Aleut | 21 | 0.0% |
| American | 1,362 | 2.3% |
| Arab | 560 | 0.9% |
| Argentinean | 39 | 0.1% |
| Armenian | 45 | 0.1% |
| Australian | 21 | 0.0% |
| Austrian | 82 | 0.1% |
| Bangladeshi | 27 | 0.1% |
| Basque | 41 | 0.1% |
| Bhutanese | 1,174 | 2.0% |
| Blackfeet | 16 | 0.0% |
| Brazilian | 46 | 0.1% |
| British | 327 | 0.6% |
| Burmese | 1,544 | 2.6% |
| Cambodian | 175 | 0.3% |
| Canadian | 173 | 0.3% |
| Celtic | 9 | 0.0% |
| Central American | 505 | 0.9% |
| Central American Indian | 51 | 0.1% |
| Cherokee | 59 | 0.1% |
| Chilean | 130 | 0.2% |
| Choctaw | 38 | 0.1% |
| Colombian | 25 | 0.0% |
| Creek | 14 | 0.0% |
| Croatian | 46 | 0.1% |
| Cuban | 118 | 0.2% |
| Czech | 280 | 0.5% |
| Czechoslovakian | 168 | 0.3% |
| Danish | 537 | 0.9% |
| Dominican | 12 | 0.0% |
| Dutch | 842 | 1.4% |
| Eastern European | 236 | 0.4% |
| Ecuadorian | 27 | 0.1% |
| Egyptian | 113 | 0.2% |
| English | 6,789 | 11.6% |
| Estonian | 46 | 0.1% |
| Ethiopian | 1,463 | 2.5% |
| European | 2,377 | 4.1% |
| Fijian | 184 | 0.3% |
| Filipino | 171 | 0.3% |
| Finnish | 390 | 0.7% |
| French | 1,444 | 2.5% |
| French American Indian | 12 | 0.0% |
| French Canadian | 455 | 0.8% |
| German | 7,964 | 13.6% |
| German Russian | 7 | 0.0% |
| Ghanaian | 18 | 0.0% |
| Greek | 241 | 0.4% |
| Guamanian / Chamorro | 78 | 0.1% |
| Guatemalan | 148 | 0.3% |
| Honduran | 11 | 0.0% |
| Hungarian | 221 | 0.4% |
| Icelander | 42 | 0.1% |
| Indian (Asian) | 3,426 | 5.8% |
| Indonesian | 43 | 0.1% |
| Iranian | 163 | 0.3% |
| Irish | 6,249 | 10.6% |
| Iroquois | 56 | 0.1% |
| Israeli | 25 | 0.0% |
| Italian | 1,925 | 3.3% |
| Jamaican | 53 | 0.1% |
| Japanese | 77 | 0.1% |
| Kenyan | 173 | 0.3% |
| Kiowa | 31 | 0.1% |
| Korean | 2,384 | 4.1% |
| Laotian | 100 | 0.2% |
| Latvian | 151 | 0.3% |
| Lebanese | 62 | 0.1% |
| Lithuanian | 307 | 0.5% |
| Luxembourger | 10 | 0.0% |
| Macedonian | 8 | 0.0% |
| Malaysian | 12 | 0.0% |
| Mexican | 2,519 | 4.3% |
| Mexican American Indian | 125 | 0.2% |
| Mongolian | 53 | 0.1% |
| Native Hawaiian | 177 | 0.3% |
| Navajo | 94 | 0.2% |
| New Zealander | 31 | 0.1% |
| Nicaraguan | 5 | 0.0% |
| Nigerian | 49 | 0.1% |
| Northern European | 293 | 0.5% |
| Norwegian | 3,869 | 6.6% |
| Okinawan | 24 | 0.0% |
| Pakistani | 216 | 0.4% |
| Palestinian | 41 | 0.1% |
| Panamanian | 59 | 0.1% |
| Paraguayan | 13 | 0.0% |
| Pennsylvania German | 37 | 0.1% |
| Peruvian | 87 | 0.2% |
| Polish | 1,319 | 2.2% |
| Portuguese | 60 | 0.1% |
| Puerto Rican | 232 | 0.4% |
| Puget Sound Salish | 54 | 0.1% |
| Romanian | 312 | 0.5% |
| Russian | 816 | 1.4% |
| Salvadoran | 223 | 0.4% |
| Samoan | 11 | 0.0% |
| Scandinavian | 483 | 0.8% |
| Scotch-Irish | 930 | 1.6% |
| Scottish | 2,041 | 3.5% |
| Seminole | 8 | 0.0% |
| Serbian | 45 | 0.1% |
| Sioux | 99 | 0.2% |
| Slavic | 9 | 0.0% |
| Slovak | 55 | 0.1% |
| Slovene | 46 | 0.1% |
| Somali | 19 | 0.0% |
| South African | 81 | 0.1% |
| South American | 337 | 0.6% |
| Spaniard | 273 | 0.5% |
| Spanish | 183 | 0.3% |
| Sri Lankan | 1,265 | 2.2% |
| Subsaharan African | 2,807 | 4.8% |
| Sudanese | 186 | 0.3% |
| Swedish | 2,006 | 3.4% |
| Swiss | 380 | 0.6% |
| Syrian | 96 | 0.2% |
| Thai | 768 | 1.3% |
| Tlingit-Haida | 30 | 0.1% |
| Turkish | 110 | 0.2% |
| Ugandan | 52 | 0.1% |
| Ukrainian | 212 | 0.4% |
| Venezuelan | 5 | 0.0% |
| Welsh | 835 | 1.4% |
| Yakama | 64 | 0.1% |
| Yugoslavian | 308 | 0.5% | View All 130 Rows |
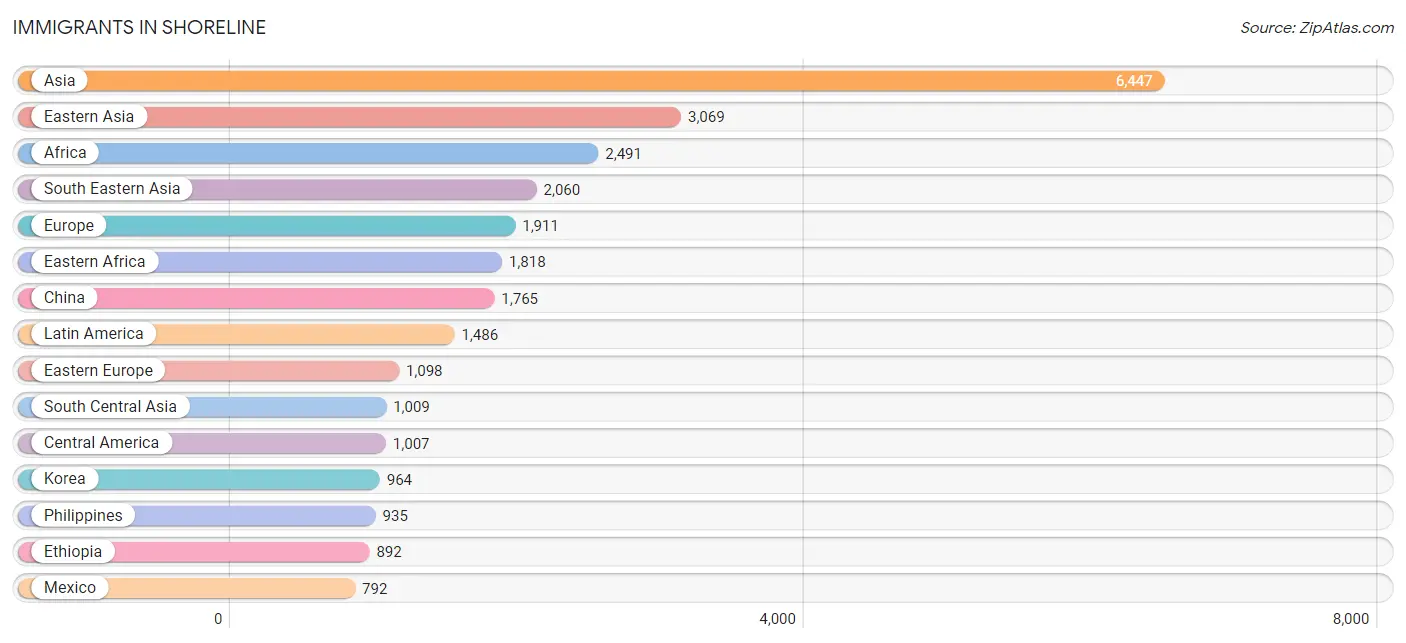
Immigrants in Shoreline
The most numerous immigrant groups reported in Shoreline came from Asia (6,447 | 11.0%), Eastern Asia (3,069 | 5.2%), Africa (2,491 | 4.3%), South Eastern Asia (2,060 | 3.5%), and Europe (1,911 | 3.3%), together accounting for 27.2% of all Shoreline residents.
| Immigration Origin | # Population | % Population |
| Africa | 2,491 | 4.3% |
| Albania | 49 | 0.1% |
| Argentina | 5 | 0.0% |
| Asia | 6,447 | 11.0% |
| Bangladesh | 103 | 0.2% |
| Bosnia and Herzegovina | 248 | 0.4% |
| Brazil | 77 | 0.1% |
| Cambodia | 53 | 0.1% |
| Canada | 603 | 1.0% |
| Caribbean | 109 | 0.2% |
| Central America | 1,007 | 1.7% |
| Chile | 52 | 0.1% |
| China | 1,765 | 3.0% |
| Colombia | 9 | 0.0% |
| Cuba | 36 | 0.1% |
| Czechoslovakia | 8 | 0.0% |
| Dominican Republic | 4 | 0.0% |
| Eastern Africa | 1,818 | 3.1% |
| Eastern Asia | 3,069 | 5.2% |
| Eastern Europe | 1,098 | 1.9% |
| Ecuador | 158 | 0.3% |
| Egypt | 137 | 0.2% |
| El Salvador | 102 | 0.2% |
| England | 291 | 0.5% |
| Eritrea | 564 | 1.0% |
| Ethiopia | 892 | 1.5% |
| Europe | 1,911 | 3.3% |
| France | 32 | 0.1% |
| Germany | 242 | 0.4% |
| Ghana | 1 | 0.0% |
| Greece | 9 | 0.0% |
| Guatemala | 44 | 0.1% |
| Hong Kong | 304 | 0.5% |
| India | 565 | 1.0% |
| Indonesia | 124 | 0.2% |
| Iran | 105 | 0.2% |
| Iraq | 130 | 0.2% |
| Ireland | 7 | 0.0% |
| Israel | 16 | 0.0% |
| Italy | 61 | 0.1% |
| Japan | 166 | 0.3% |
| Jordan | 18 | 0.0% |
| Kenya | 159 | 0.3% |
| Korea | 964 | 1.6% |
| Laos | 10 | 0.0% |
| Latin America | 1,486 | 2.5% |
| Latvia | 6 | 0.0% |
| Lebanon | 45 | 0.1% |
| Malaysia | 78 | 0.1% |
| Mexico | 792 | 1.3% |
| Moldova | 56 | 0.1% |
| Morocco | 53 | 0.1% |
| Nepal | 10 | 0.0% |
| Netherlands | 41 | 0.1% |
| Nigeria | 14 | 0.0% |
| North Macedonia | 6 | 0.0% |
| Northern Africa | 408 | 0.7% |
| Northern Europe | 423 | 0.7% |
| Norway | 40 | 0.1% |
| Oceania | 46 | 0.1% |
| Pakistan | 226 | 0.4% |
| Panama | 10 | 0.0% |
| Peru | 35 | 0.1% |
| Philippines | 935 | 1.6% |
| Poland | 14 | 0.0% |
| Romania | 156 | 0.3% |
| Russia | 425 | 0.7% |
| Saudi Arabia | 11 | 0.0% |
| Scotland | 7 | 0.0% |
| Somalia | 40 | 0.1% |
| South Africa | 81 | 0.1% |
| South America | 370 | 0.6% |
| South Central Asia | 1,009 | 1.7% |
| South Eastern Asia | 2,060 | 3.5% |
| Southern Europe | 70 | 0.1% |
| Sudan | 131 | 0.2% |
| Taiwan | 228 | 0.4% |
| Thailand | 121 | 0.2% |
| Trinidad and Tobago | 17 | 0.0% |
| Turkey | 24 | 0.0% |
| Ukraine | 58 | 0.1% |
| Venezuela | 34 | 0.1% |
| Vietnam | 696 | 1.2% |
| Western Africa | 134 | 0.2% |
| Western Asia | 292 | 0.5% |
| Western Europe | 315 | 0.5% | View All 86 Rows |
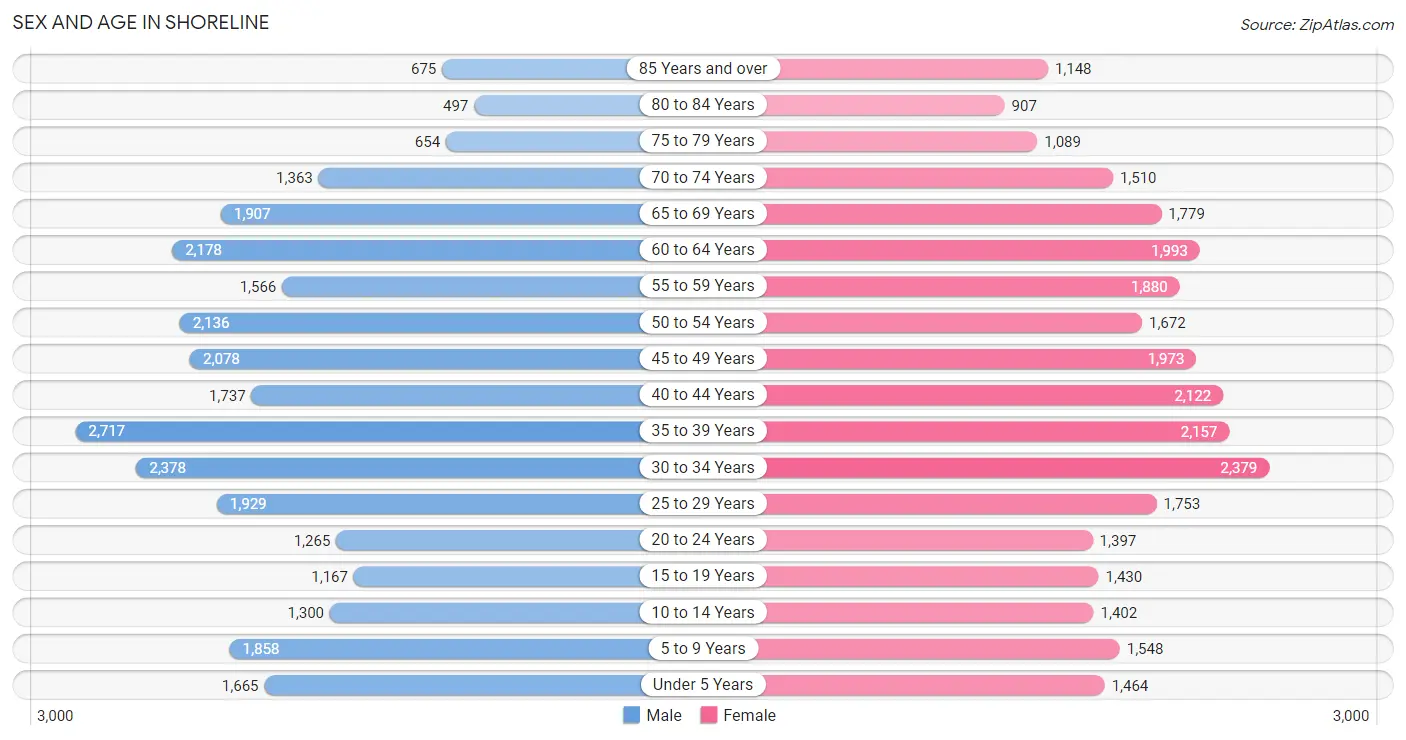
Sex and Age in Shoreline
Sex and Age in Shoreline
The most populous age groups in Shoreline are 35 to 39 Years (2,717 | 9.3%) for men and 30 to 34 Years (2,379 | 8.0%) for women.
| Age Bracket | Male | Female |
| Under 5 Years | 1,665 (5.7%) | 1,464 (5.0%) |
| 5 to 9 Years | 1,858 (6.4%) | 1,548 (5.2%) |
| 10 to 14 Years | 1,300 (4.5%) | 1,402 (4.7%) |
| 15 to 19 Years | 1,167 (4.0%) | 1,430 (4.8%) |
| 20 to 24 Years | 1,265 (4.3%) | 1,397 (4.7%) |
| 25 to 29 Years | 1,929 (6.6%) | 1,753 (5.9%) |
| 30 to 34 Years | 2,378 (8.2%) | 2,379 (8.0%) |
| 35 to 39 Years | 2,717 (9.3%) | 2,157 (7.3%) |
| 40 to 44 Years | 1,737 (6.0%) | 2,122 (7.2%) |
| 45 to 49 Years | 2,078 (7.1%) | 1,973 (6.7%) |
| 50 to 54 Years | 2,136 (7.3%) | 1,672 (5.7%) |
| 55 to 59 Years | 1,566 (5.4%) | 1,880 (6.4%) |
| 60 to 64 Years | 2,178 (7.5%) | 1,993 (6.7%) |
| 65 to 69 Years | 1,907 (6.6%) | 1,779 (6.0%) |
| 70 to 74 Years | 1,363 (4.7%) | 1,510 (5.1%) |
| 75 to 79 Years | 654 (2.2%) | 1,089 (3.7%) |
| 80 to 84 Years | 497 (1.7%) | 907 (3.1%) |
| 85 Years and over | 675 (2.3%) | 1,148 (3.9%) |
| Total | 29,070 (100.0%) | 29,603 (100.0%) |
Families and Households in Shoreline
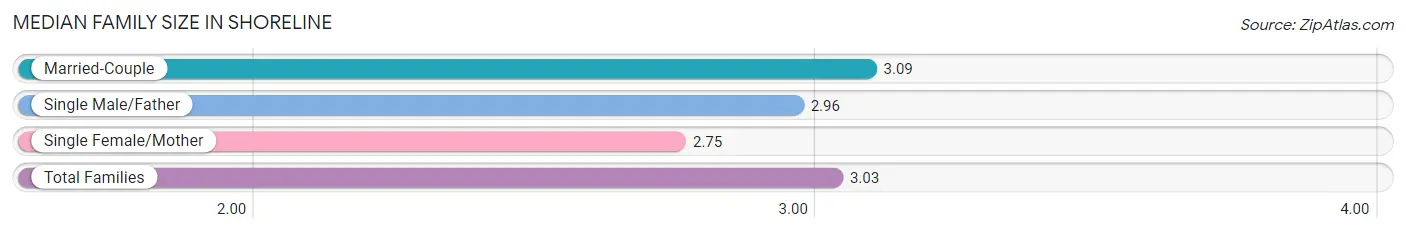
Median Family Size in Shoreline
The median family size in Shoreline is 3.03 persons per family, with married-couple families (11,871 | 80.4%) accounting for the largest median family size of 3.09 persons per family. On the other hand, single female/mother families (2,025 | 13.7%) represent the smallest median family size with 2.75 persons per family.
| Family Type | # Families | Family Size |
| Married-Couple | 11,871 (80.4%) | 3.09 |
| Single Male/Father | 874 (5.9%) | 2.96 |
| Single Female/Mother | 2,025 (13.7%) | 2.75 |
| Total Families | 14,770 (100.0%) | 3.03 |
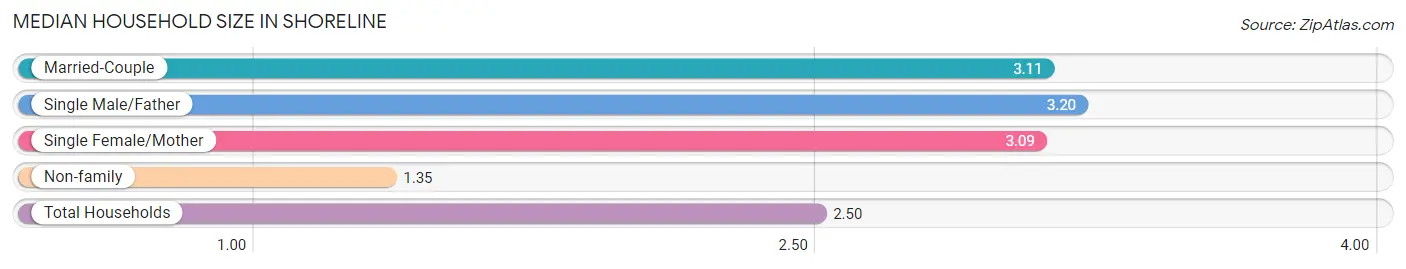
Median Household Size in Shoreline
The median household size in Shoreline is 2.50 persons per household, with single male/father households (874 | 3.8%) accounting for the largest median household size of 3.2 persons per household. non-family households (7,936 | 34.9%) represent the smallest median household size with 1.35 persons per household.
| Household Type | # Households | Household Size |
| Married-Couple | 11,871 (52.3%) | 3.11 |
| Single Male/Father | 874 (3.8%) | 3.20 |
| Single Female/Mother | 2,025 (8.9%) | 3.09 |
| Non-family | 7,936 (34.9%) | 1.35 |
| Total Households | 22,706 (100.0%) | 2.50 |
Household Size by Marriage Status in Shoreline
Out of a total of 22,706 households in Shoreline, 14,770 (65.0%) are family households, while 7,936 (34.9%) are nonfamily households. The most numerous type of family households are 2-person households, comprising 6,409, and the most common type of nonfamily households are 1-person households, comprising 6,125.
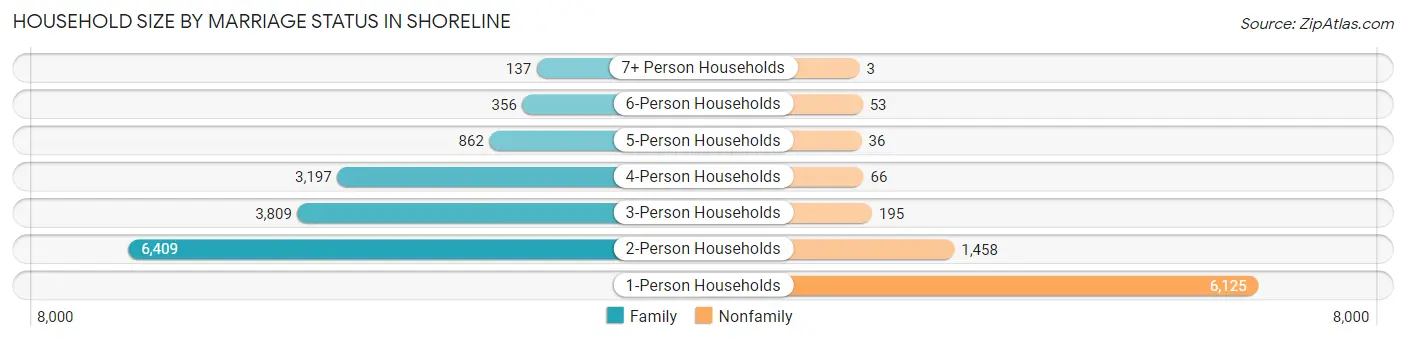
| Household Size | Family Households | Nonfamily Households |
| 1-Person Households | - | 6,125 (27.0%) |
| 2-Person Households | 6,409 (28.2%) | 1,458 (6.4%) |
| 3-Person Households | 3,809 (16.8%) | 195 (0.9%) |
| 4-Person Households | 3,197 (14.1%) | 66 (0.3%) |
| 5-Person Households | 862 (3.8%) | 36 (0.2%) |
| 6-Person Households | 356 (1.6%) | 53 (0.2%) |
| 7+ Person Households | 137 (0.6%) | 3 (0.0%) |
| Total | 14,770 (65.0%) | 7,936 (34.9%) |
Female Fertility in Shoreline
Fertility by Age in Shoreline
Average fertility rate in Shoreline is 47.0 births per 1,000 women. Women in the age bracket of 35 to 50 years have the highest fertility rate with 53.0 births per 1,000 women. Women in the age bracket of 35 to 50 years acount for 55.3% of all women with births.
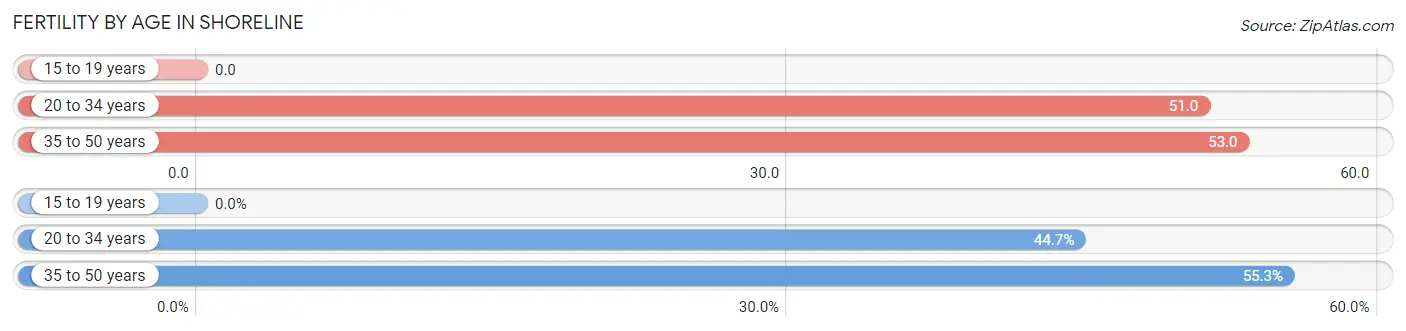
| Age Bracket | Women with Births | Births / 1,000 Women |
| 15 to 19 years | 0 (0.0%) | 0.0 |
| 20 to 34 years | 282 (44.7%) | 51.0 |
| 35 to 50 years | 349 (55.3%) | 53.0 |
| Total | 631 (100.0%) | 47.0 |
Fertility by Age by Marriage Status in Shoreline
93.2% of women with births (631) in Shoreline are married. The highest percentage of unmarried women with births falls into 35 to 50 years age bracket with 12.3% of them unmarried at the time of birth, while the lowest percentage of unmarried women with births belong to 20 to 34 years age bracket with 0.0% of them unmarried.
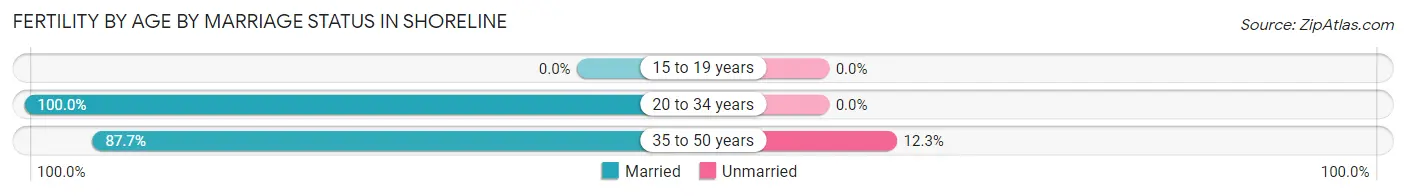
| Age Bracket | Married | Unmarried |
| 15 to 19 years | 0 (0.0%) | 0 (0.0%) |
| 20 to 34 years | 282 (100.0%) | 0 (0.0%) |
| 35 to 50 years | 306 (87.7%) | 43 (12.3%) |
| Total | 588 (93.2%) | 43 (6.8%) |
Fertility by Education in Shoreline
Average fertility rate in Shoreline is 47.0 births per 1,000 women. Women with the education attainment of graduate degree have the highest fertility rate of 71.0 births per 1,000 women, while women with the education attainment of less than high school have the lowest fertility at 22.0 births per 1,000 women. Women with the education attainment of graduate degree represent 27.4% of all women with births.
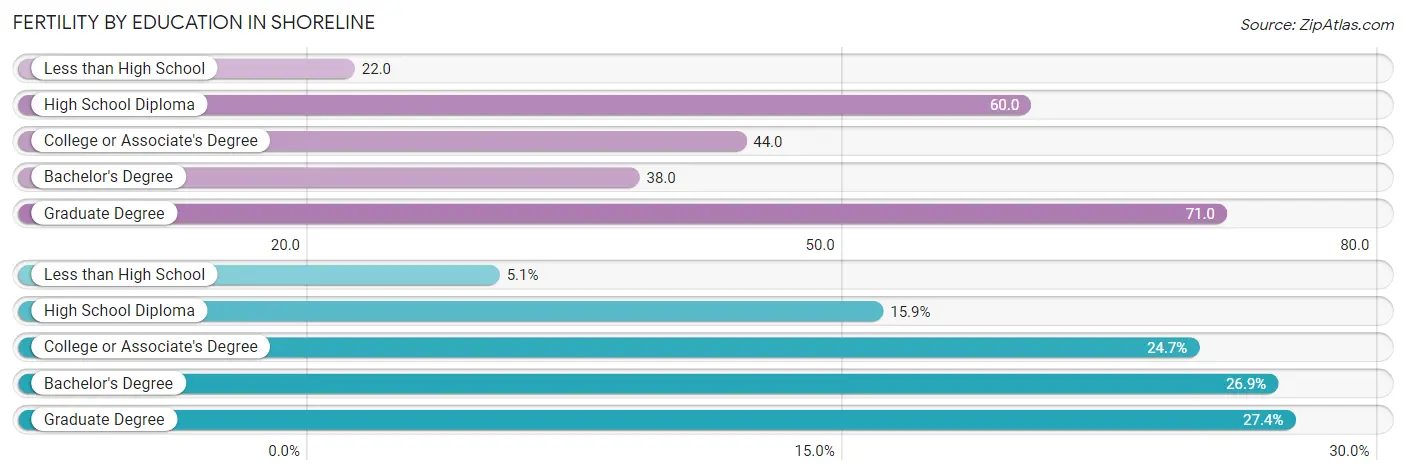
| Educational Attainment | Women with Births | Births / 1,000 Women |
| Less than High School | 32 (5.1%) | 22.0 |
| High School Diploma | 100 (15.9%) | 60.0 |
| College or Associate's Degree | 156 (24.7%) | 44.0 |
| Bachelor's Degree | 170 (26.9%) | 38.0 |
| Graduate Degree | 173 (27.4%) | 71.0 |
| Total | 631 (100.0%) | 47.0 |
Fertility by Education by Marriage Status in Shoreline
6.8% of women with births in Shoreline are unmarried. Women with the educational attainment of less than high school are most likely to be married with 100.0% of them married at childbirth, while women with the educational attainment of high school diploma are least likely to be married with 24.0% of them unmarried at childbirth.
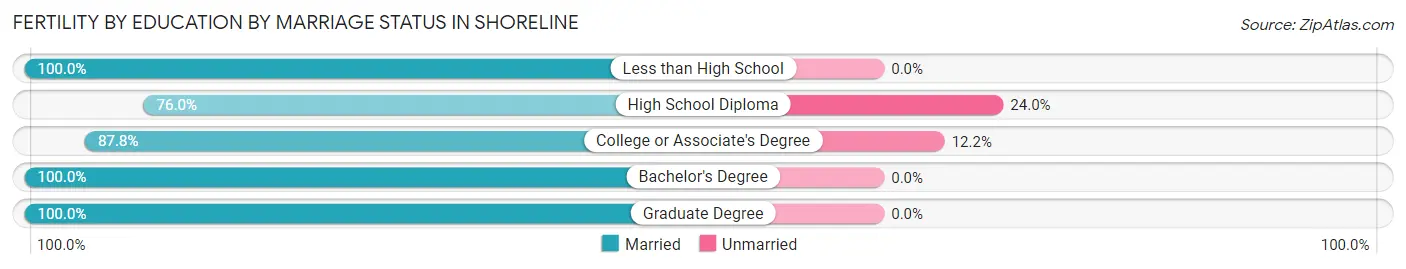
| Educational Attainment | Married | Unmarried |
| Less than High School | 32 (100.0%) | 0 (0.0%) |
| High School Diploma | 76 (76.0%) | 24 (24.0%) |
| College or Associate's Degree | 137 (87.8%) | 19 (12.2%) |
| Bachelor's Degree | 170 (100.0%) | 0 (0.0%) |
| Graduate Degree | 173 (100.0%) | 0 (0.0%) |
| Total | 588 (93.2%) | 43 (6.8%) |
Employment Characteristics in Shoreline
Employment by Class of Employer in Shoreline
Among the 30,061 employed individuals in Shoreline, private company employees (18,880 | 62.8%), not-for-profit organizations (3,414 | 11.4%), and local government employees (2,127 | 7.1%) make up the most common classes of employment.
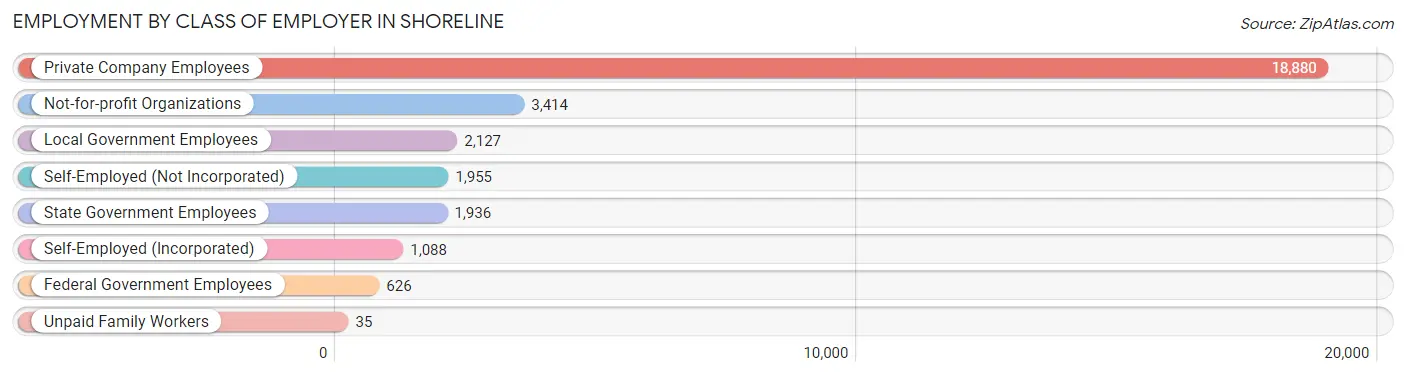
| Employer Class | # Employees | % Employees |
| Private Company Employees | 18,880 | 62.8% |
| Self-Employed (Incorporated) | 1,088 | 3.6% |
| Self-Employed (Not Incorporated) | 1,955 | 6.5% |
| Not-for-profit Organizations | 3,414 | 11.4% |
| Local Government Employees | 2,127 | 7.1% |
| State Government Employees | 1,936 | 6.4% |
| Federal Government Employees | 626 | 2.1% |
| Unpaid Family Workers | 35 | 0.1% |
| Total | 30,061 | 100.0% |
Employment Status by Age in Shoreline
According to the labor force statistics for Shoreline, out of the total population over 16 years of age (48,898), 65.4% or 31,979 individuals are in the labor force, with 4.4% or 1,407 of them unemployed. The age group with the highest labor force participation rate is 25 to 29 years, with 90.6% or 3,336 individuals in the labor force. Within the labor force, the 16 to 19 years age range has the highest percentage of unemployed individuals, with 16.3% or 112 of them being unemployed.
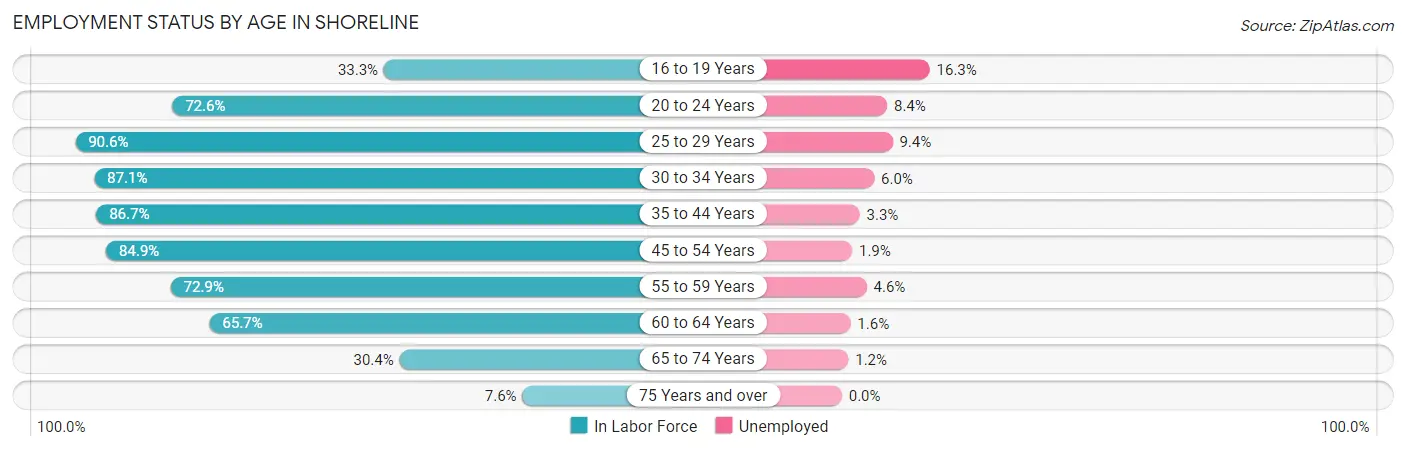
| Age Bracket | In Labor Force | Unemployed |
| 16 to 19 Years | 686 (33.3%) | 112 (16.3%) |
| 20 to 24 Years | 1,933 (72.6%) | 162 (8.4%) |
| 25 to 29 Years | 3,336 (90.6%) | 314 (9.4%) |
| 30 to 34 Years | 4,143 (87.1%) | 249 (6.0%) |
| 35 to 44 Years | 7,572 (86.7%) | 250 (3.3%) |
| 45 to 54 Years | 6,672 (84.9%) | 127 (1.9%) |
| 55 to 59 Years | 2,512 (72.9%) | 116 (4.6%) |
| 60 to 64 Years | 2,740 (65.7%) | 44 (1.6%) |
| 65 to 74 Years | 1,994 (30.4%) | 24 (1.2%) |
| 75 Years and over | 378 (7.6%) | 0 (0.0%) |
| Total | 31,979 (65.4%) | 1,407 (4.4%) |
Employment Status by Educational Attainment in Shoreline
According to labor force statistics for Shoreline, 82.6% of individuals (26,967) out of the total population between 25 and 64 years of age (32,648) are in the labor force, with 4.1% or 1,106 of them being unemployed. The group with the highest labor force participation rate are those with the educational attainment of bachelor's degree or higher, with 88.5% or 15,357 individuals in the labor force. Within the labor force, individuals with high school diploma education have the highest percentage of unemployment, with 10.2% or 343 of them being unemployed.
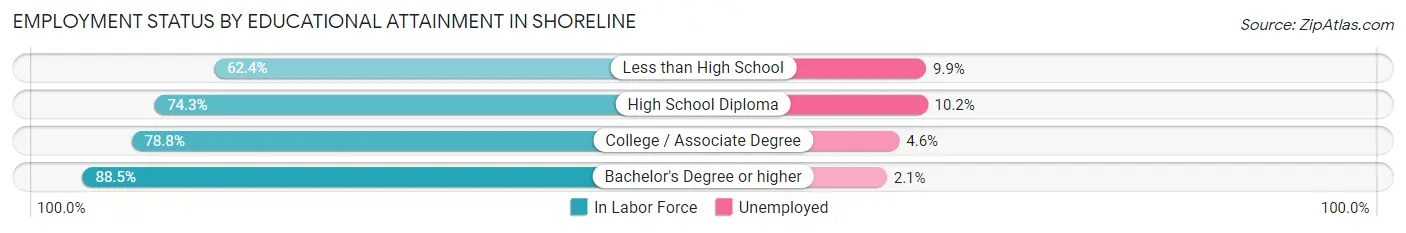
| Educational Attainment | In Labor Force | Unemployed |
| Less than High School | 870 (62.4%) | 138 (9.9%) |
| High School Diploma | 3,367 (74.3%) | 462 (10.2%) |
| College / Associate Degree | 7,383 (78.8%) | 431 (4.6%) |
| Bachelor's Degree or higher | 15,357 (88.5%) | 364 (2.1%) |
| Total | 26,967 (82.6%) | 1,339 (4.1%) |
Employment Occupations by Sex in Shoreline
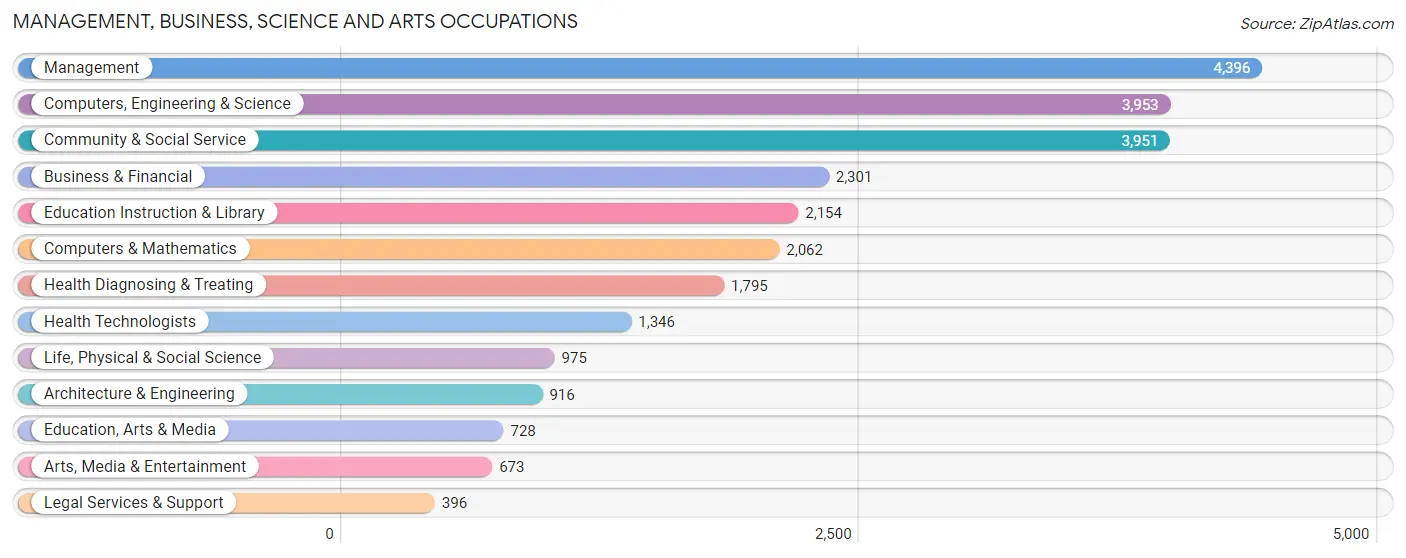
Management, Business, Science and Arts Occupations
The most common Management, Business, Science and Arts occupations in Shoreline are Management (4,396 | 14.4%), Computers, Engineering & Science (3,953 | 12.9%), Community & Social Service (3,951 | 12.9%), Business & Financial (2,301 | 7.5%), and Education Instruction & Library (2,154 | 7.0%).
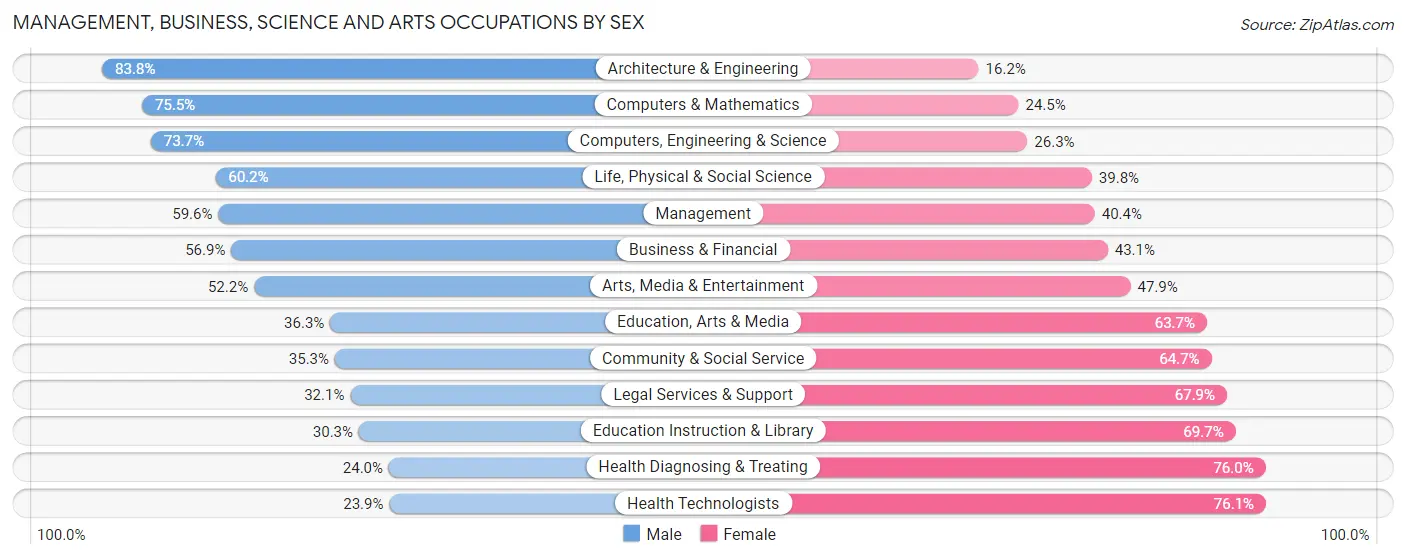
Management, Business, Science and Arts Occupations by Sex
Within the Management, Business, Science and Arts occupations in Shoreline, the most male-oriented occupations are Architecture & Engineering (83.8%), Computers & Mathematics (75.5%), and Computers, Engineering & Science (73.7%), while the most female-oriented occupations are Health Technologists (76.1%), Health Diagnosing & Treating (76.0%), and Education Instruction & Library (69.7%).
| Occupation | Male | Female |
| Management | 2,620 (59.6%) | 1,776 (40.4%) |
| Business & Financial | 1,309 (56.9%) | 992 (43.1%) |
| Computers, Engineering & Science | 2,912 (73.7%) | 1,041 (26.3%) |
| Computers & Mathematics | 1,557 (75.5%) | 505 (24.5%) |
| Architecture & Engineering | 768 (83.8%) | 148 (16.2%) |
| Life, Physical & Social Science | 587 (60.2%) | 388 (39.8%) |
| Community & Social Service | 1,394 (35.3%) | 2,557 (64.7%) |
| Education, Arts & Media | 264 (36.3%) | 464 (63.7%) |
| Legal Services & Support | 127 (32.1%) | 269 (67.9%) |
| Education Instruction & Library | 652 (30.3%) | 1,502 (69.7%) |
| Arts, Media & Entertainment | 351 (52.1%) | 322 (47.8%) |
| Health Diagnosing & Treating | 431 (24.0%) | 1,364 (76.0%) |
| Health Technologists | 322 (23.9%) | 1,024 (76.1%) |
| Total (Category) | 8,666 (52.8%) | 7,730 (47.1%) |
| Total (Overall) | 16,550 (54.1%) | 14,026 (45.9%) |
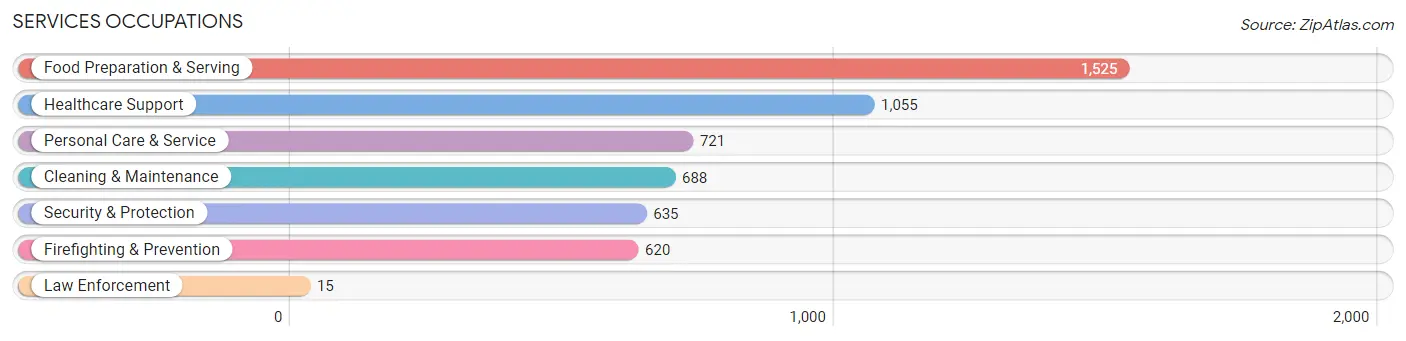
Services Occupations
The most common Services occupations in Shoreline are Food Preparation & Serving (1,525 | 5.0%), Healthcare Support (1,055 | 3.5%), Personal Care & Service (721 | 2.4%), Cleaning & Maintenance (688 | 2.2%), and Security & Protection (635 | 2.1%).
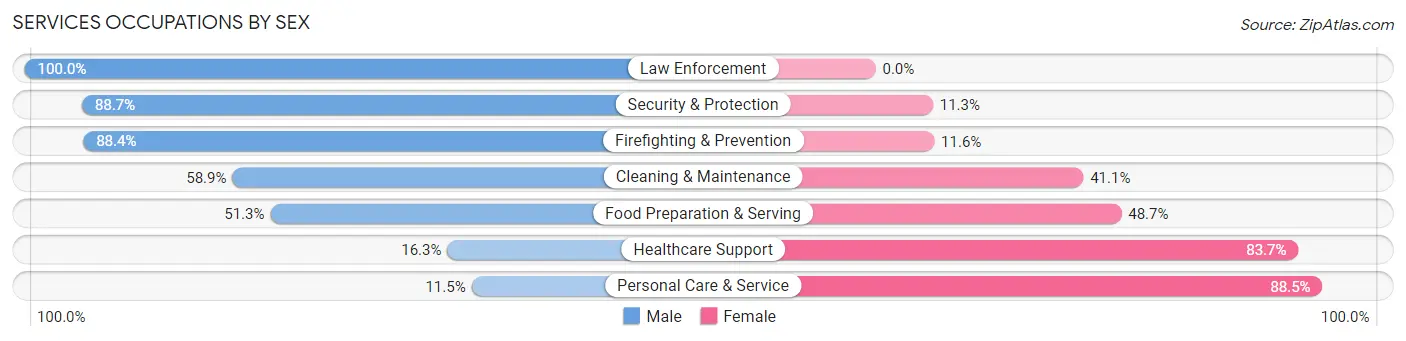
Services Occupations by Sex
Within the Services occupations in Shoreline, the most male-oriented occupations are Law Enforcement (100.0%), Security & Protection (88.7%), and Firefighting & Prevention (88.4%), while the most female-oriented occupations are Personal Care & Service (88.5%), Healthcare Support (83.7%), and Food Preparation & Serving (48.7%).
| Occupation | Male | Female |
| Healthcare Support | 172 (16.3%) | 883 (83.7%) |
| Security & Protection | 563 (88.7%) | 72 (11.3%) |
| Firefighting & Prevention | 548 (88.4%) | 72 (11.6%) |
| Law Enforcement | 15 (100.0%) | 0 (0.0%) |
| Food Preparation & Serving | 783 (51.3%) | 742 (48.7%) |
| Cleaning & Maintenance | 405 (58.9%) | 283 (41.1%) |
| Personal Care & Service | 83 (11.5%) | 638 (88.5%) |
| Total (Category) | 2,006 (43.4%) | 2,618 (56.6%) |
| Total (Overall) | 16,550 (54.1%) | 14,026 (45.9%) |
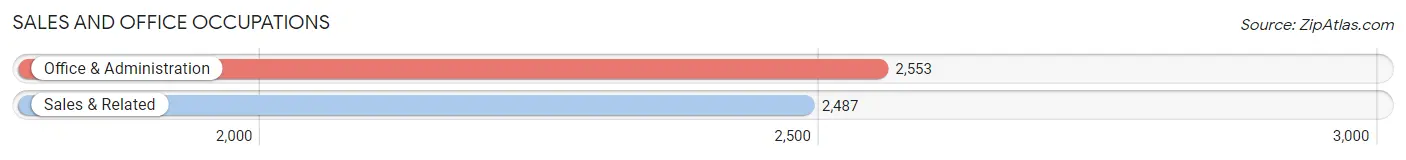
Sales and Office Occupations
The most common Sales and Office occupations in Shoreline are Office & Administration (2,553 | 8.4%), and Sales & Related (2,487 | 8.1%).
Sales and Office Occupations by Sex
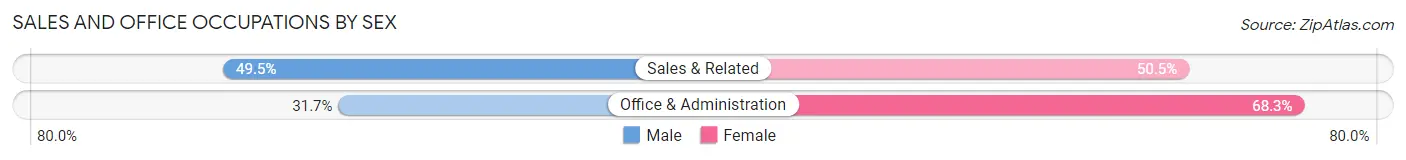
| Occupation | Male | Female |
| Sales & Related | 1,230 (49.5%) | 1,257 (50.5%) |
| Office & Administration | 810 (31.7%) | 1,743 (68.3%) |
| Total (Category) | 2,040 (40.5%) | 3,000 (59.5%) |
| Total (Overall) | 16,550 (54.1%) | 14,026 (45.9%) |
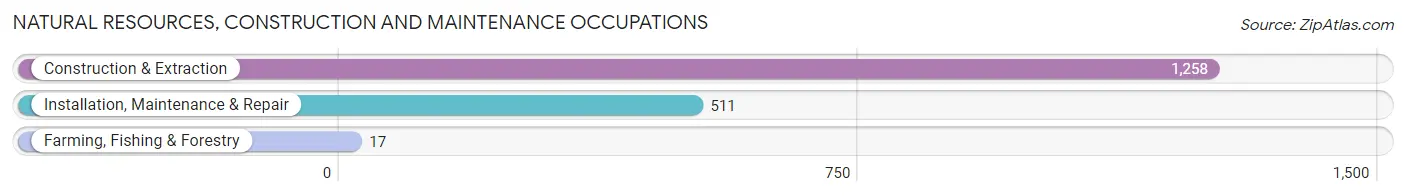
Natural Resources, Construction and Maintenance Occupations
The most common Natural Resources, Construction and Maintenance occupations in Shoreline are Construction & Extraction (1,258 | 4.1%), Installation, Maintenance & Repair (511 | 1.7%), and Farming, Fishing & Forestry (17 | 0.1%).
Natural Resources, Construction and Maintenance Occupations by Sex
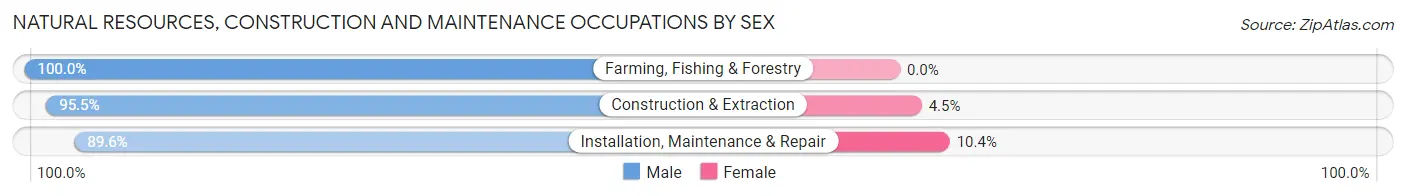
| Occupation | Male | Female |
| Farming, Fishing & Forestry | 17 (100.0%) | 0 (0.0%) |
| Construction & Extraction | 1,201 (95.5%) | 57 (4.5%) |
| Installation, Maintenance & Repair | 458 (89.6%) | 53 (10.4%) |
| Total (Category) | 1,676 (93.8%) | 110 (6.2%) |
| Total (Overall) | 16,550 (54.1%) | 14,026 (45.9%) |
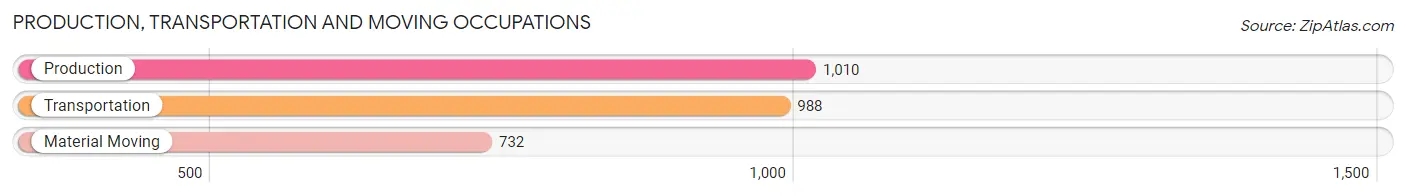
Production, Transportation and Moving Occupations
The most common Production, Transportation and Moving occupations in Shoreline are Production (1,010 | 3.3%), Transportation (988 | 3.2%), and Material Moving (732 | 2.4%).
Production, Transportation and Moving Occupations by Sex
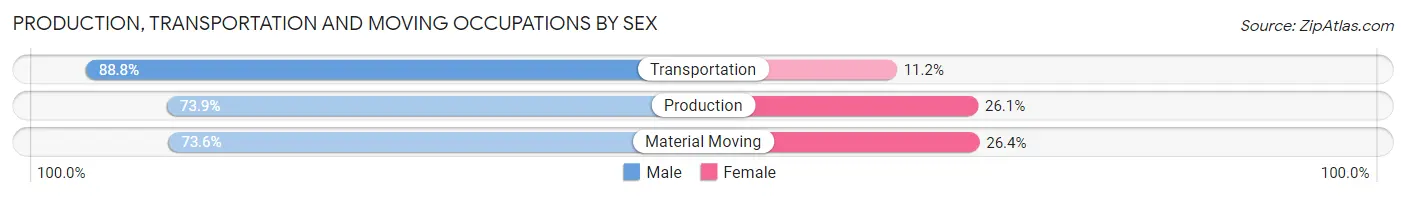
| Occupation | Male | Female |
| Production | 746 (73.9%) | 264 (26.1%) |
| Transportation | 877 (88.8%) | 111 (11.2%) |
| Material Moving | 539 (73.6%) | 193 (26.4%) |
| Total (Category) | 2,162 (79.2%) | 568 (20.8%) |
| Total (Overall) | 16,550 (54.1%) | 14,026 (45.9%) |
Employment Industries by Sex in Shoreline
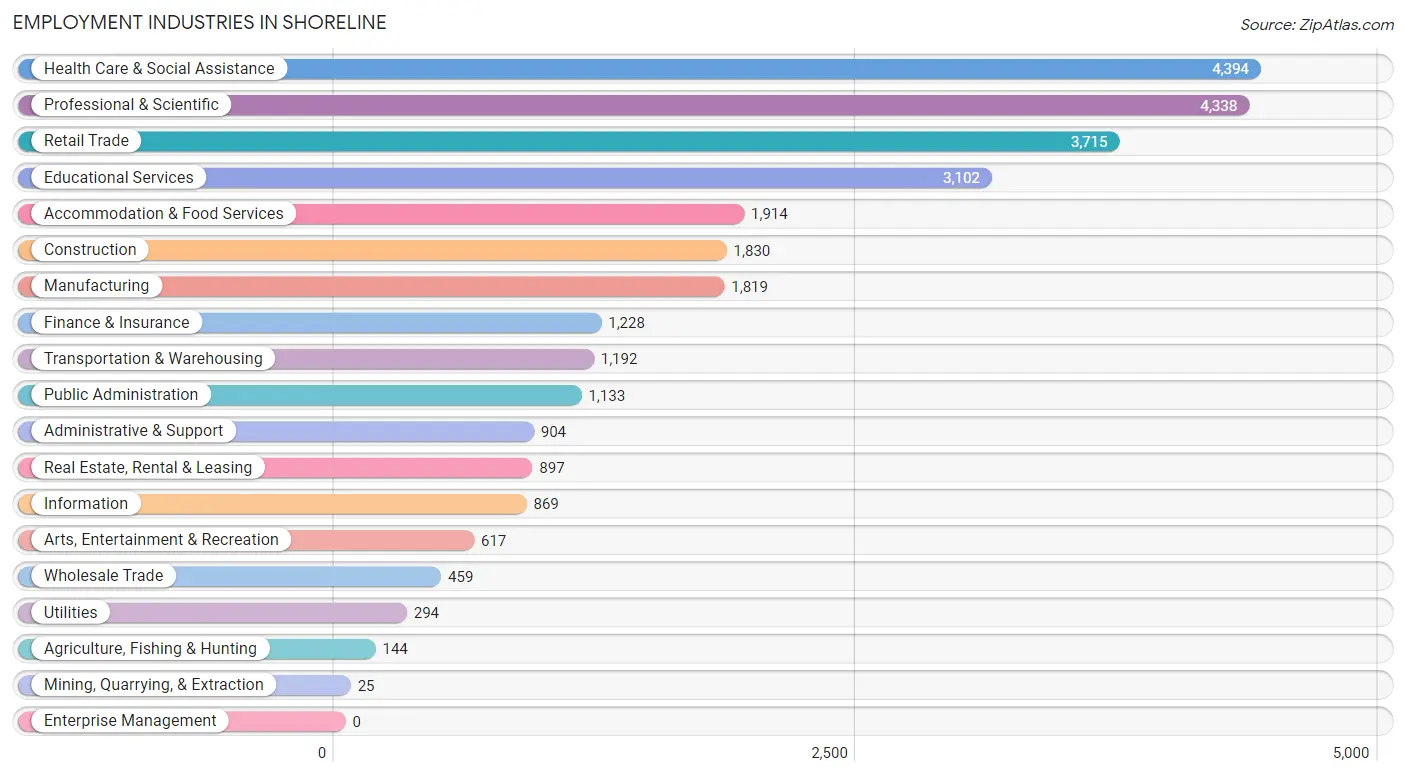
Employment Industries in Shoreline
The major employment industries in Shoreline include Health Care & Social Assistance (4,394 | 14.4%), Professional & Scientific (4,338 | 14.2%), Retail Trade (3,715 | 12.1%), Educational Services (3,102 | 10.2%), and Accommodation & Food Services (1,914 | 6.3%).
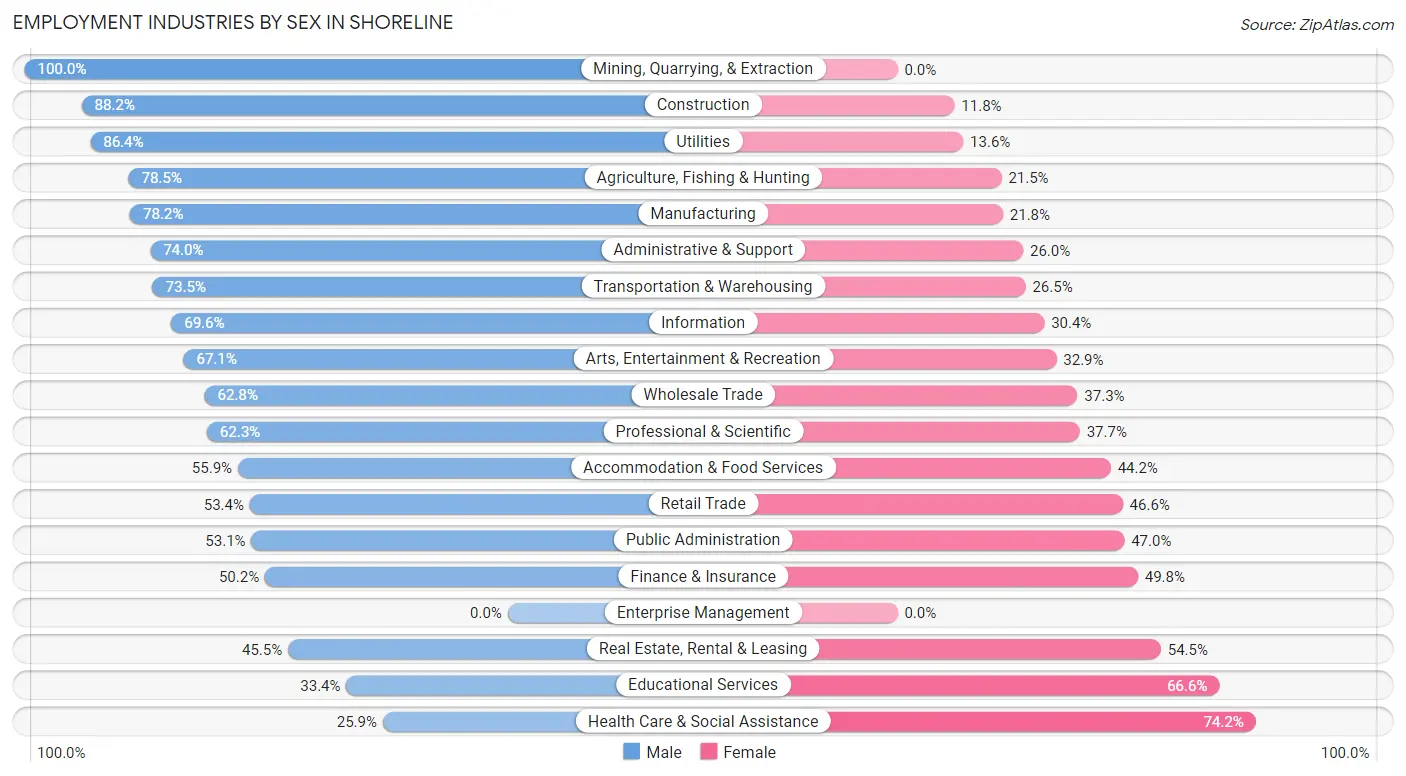
Employment Industries by Sex in Shoreline
The Shoreline industries that see more men than women are Mining, Quarrying, & Extraction (100.0%), Construction (88.2%), and Utilities (86.4%), whereas the industries that tend to have a higher number of women are Health Care & Social Assistance (74.2%), Educational Services (66.6%), and Real Estate, Rental & Leasing (54.5%).
| Industry | Male | Female |
| Agriculture, Fishing & Hunting | 113 (78.5%) | 31 (21.5%) |
| Mining, Quarrying, & Extraction | 25 (100.0%) | 0 (0.0%) |
| Construction | 1,614 (88.2%) | 216 (11.8%) |
| Manufacturing | 1,422 (78.2%) | 397 (21.8%) |
| Wholesale Trade | 288 (62.7%) | 171 (37.2%) |
| Retail Trade | 1,983 (53.4%) | 1,732 (46.6%) |
| Transportation & Warehousing | 876 (73.5%) | 316 (26.5%) |
| Utilities | 254 (86.4%) | 40 (13.6%) |
| Information | 605 (69.6%) | 264 (30.4%) |
| Finance & Insurance | 617 (50.2%) | 611 (49.8%) |
| Real Estate, Rental & Leasing | 408 (45.5%) | 489 (54.5%) |
| Professional & Scientific | 2,701 (62.3%) | 1,637 (37.7%) |
| Enterprise Management | 0 (0.0%) | 0 (0.0%) |
| Administrative & Support | 669 (74.0%) | 235 (26.0%) |
| Educational Services | 1,036 (33.4%) | 2,066 (66.6%) |
| Health Care & Social Assistance | 1,136 (25.9%) | 3,258 (74.2%) |
| Arts, Entertainment & Recreation | 414 (67.1%) | 203 (32.9%) |
| Accommodation & Food Services | 1,069 (55.8%) | 845 (44.2%) |
| Public Administration | 601 (53.0%) | 532 (46.9%) |
| Total | 16,550 (54.1%) | 14,026 (45.9%) |
Education in Shoreline
School Enrollment in Shoreline
The most common levels of schooling among the 12,558 students in Shoreline are college / undergraduate (3,140 | 25.0%), elementary school (2,559 | 20.4%), and high school (2,315 | 18.4%).
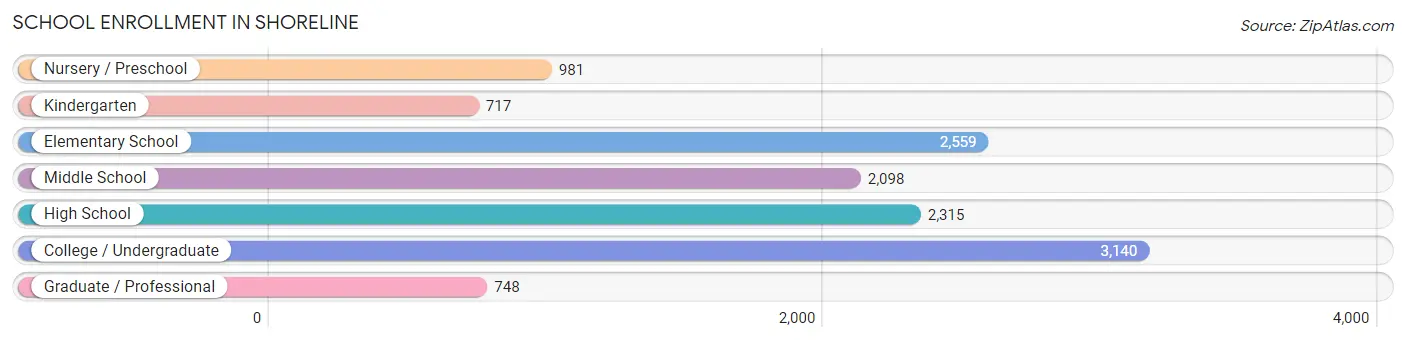
| School Level | # Students | % Students |
| Nursery / Preschool | 981 | 7.8% |
| Kindergarten | 717 | 5.7% |
| Elementary School | 2,559 | 20.4% |
| Middle School | 2,098 | 16.7% |
| High School | 2,315 | 18.4% |
| College / Undergraduate | 3,140 | 25.0% |
| Graduate / Professional | 748 | 6.0% |
| Total | 12,558 | 100.0% |
School Enrollment by Age by Funding Source in Shoreline
Out of a total of 12,558 students who are enrolled in schools in Shoreline, 2,600 (20.7%) attend a private institution, while the remaining 9,958 (79.3%) are enrolled in public schools. The age group of 3 to 4 year olds has the highest likelihood of being enrolled in private schools, with 476 (62.2% in the age bracket) enrolled. Conversely, the age group of 18 to 19 year olds has the lowest likelihood of being enrolled in a private school, with 519 (89.6% in the age bracket) attending a public institution.
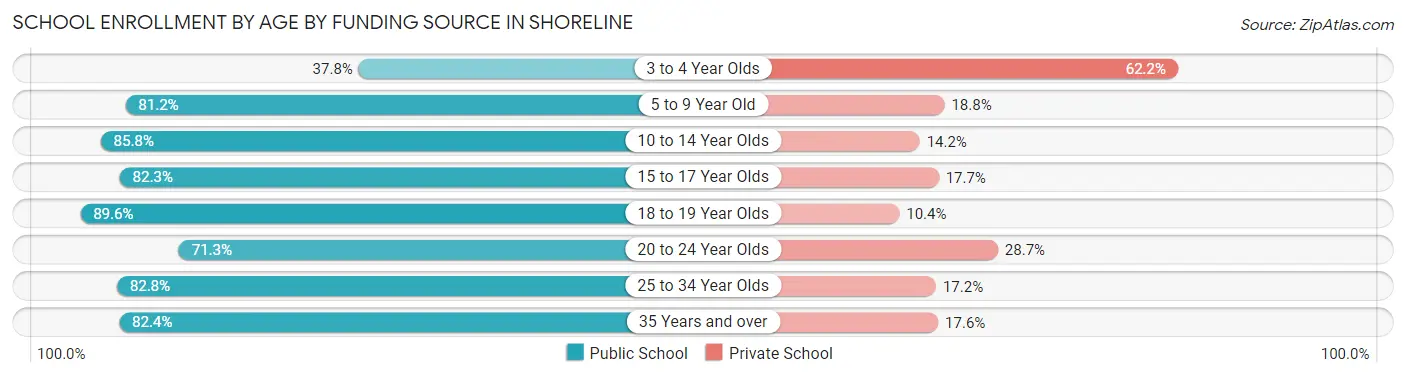
| Age Bracket | Public School | Private School |
| 3 to 4 Year Olds | 289 (37.8%) | 476 (62.2%) |
| 5 to 9 Year Old | 2,616 (81.2%) | 605 (18.8%) |
| 10 to 14 Year Olds | 2,267 (85.8%) | 374 (14.2%) |
| 15 to 17 Year Olds | 1,520 (82.3%) | 327 (17.7%) |
| 18 to 19 Year Olds | 519 (89.6%) | 60 (10.4%) |
| 20 to 24 Year Olds | 913 (71.3%) | 368 (28.7%) |
| 25 to 34 Year Olds | 896 (82.8%) | 186 (17.2%) |
| 35 Years and over | 941 (82.4%) | 201 (17.6%) |
| Total | 9,958 (79.3%) | 2,600 (20.7%) |
Educational Attainment by Field of Study in Shoreline
Business (3,715 | 14.5%), social sciences (2,973 | 11.6%), science & technology (2,383 | 9.3%), bio, nature & agricultural (2,342 | 9.1%), and engineering (1,839 | 7.2%) are the most common fields of study among 25,671 individuals in Shoreline who have obtained a bachelor's degree or higher.
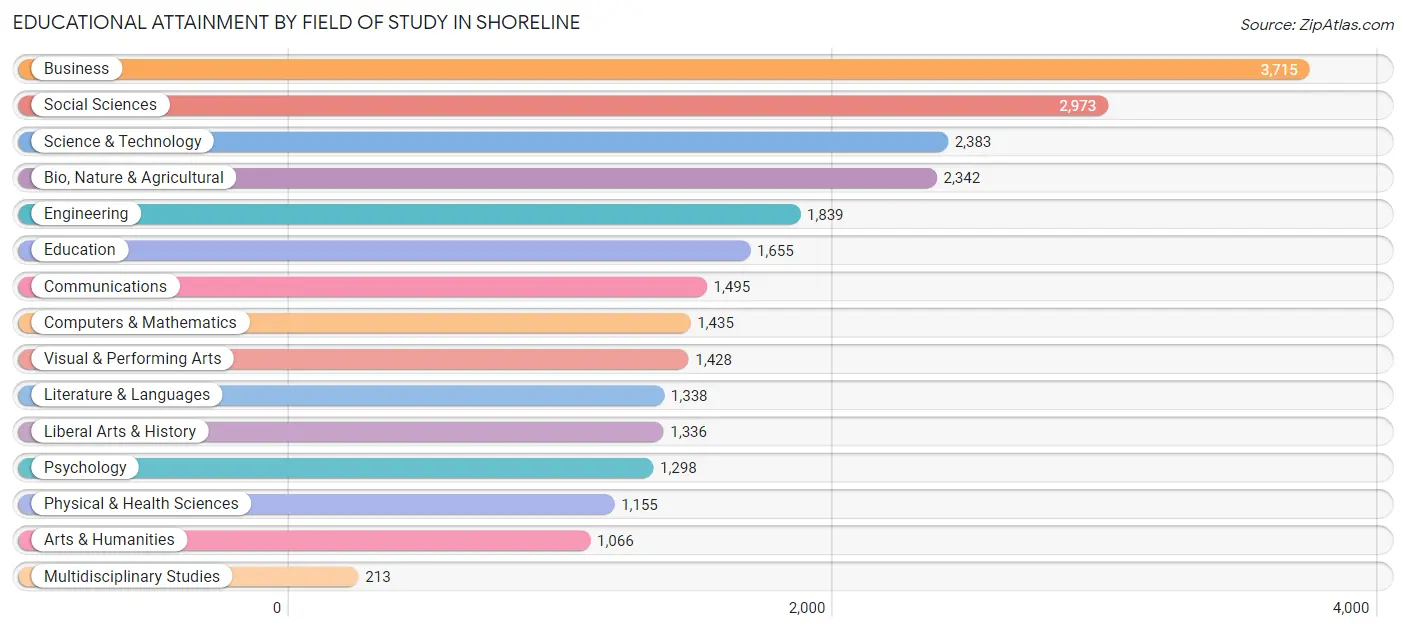
| Field of Study | # Graduates | % Graduates |
| Computers & Mathematics | 1,435 | 5.6% |
| Bio, Nature & Agricultural | 2,342 | 9.1% |
| Physical & Health Sciences | 1,155 | 4.5% |
| Psychology | 1,298 | 5.1% |
| Social Sciences | 2,973 | 11.6% |
| Engineering | 1,839 | 7.2% |
| Multidisciplinary Studies | 213 | 0.8% |
| Science & Technology | 2,383 | 9.3% |
| Business | 3,715 | 14.5% |
| Education | 1,655 | 6.5% |
| Literature & Languages | 1,338 | 5.2% |
| Liberal Arts & History | 1,336 | 5.2% |
| Visual & Performing Arts | 1,428 | 5.6% |
| Communications | 1,495 | 5.8% |
| Arts & Humanities | 1,066 | 4.2% |
| Total | 25,671 | 100.0% |
Transportation & Commute in Shoreline
Vehicle Availability by Sex in Shoreline
The most prevalent vehicle ownership categories in Shoreline are males with 2 vehicles (6,978, accounting for 43.1%) and females with 2 vehicles (5,892, making up 50.7%).
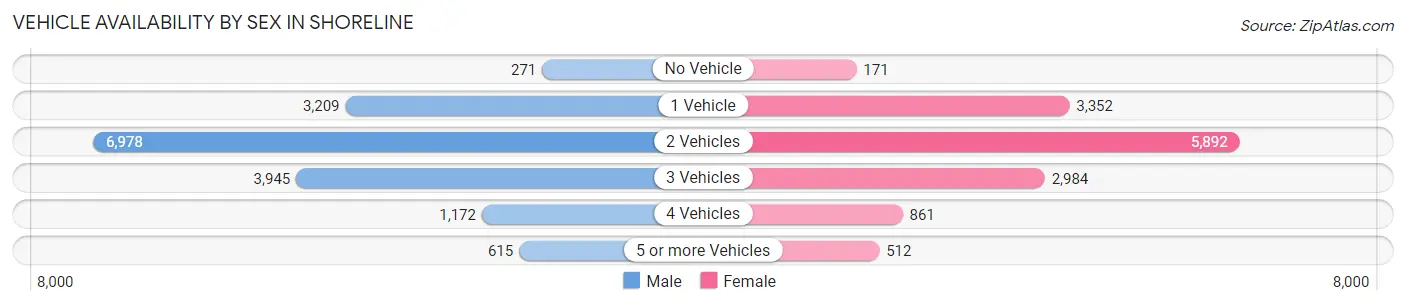
| Vehicles Available | Male | Female |
| No Vehicle | 271 (1.7%) | 171 (1.2%) |
| 1 Vehicle | 3,209 (19.8%) | 3,352 (24.3%) |
| 2 Vehicles | 6,978 (43.1%) | 5,892 (42.8%) |
| 3 Vehicles | 3,945 (24.4%) | 2,984 (21.7%) |
| 4 Vehicles | 1,172 (7.2%) | 861 (6.2%) |
| 5 or more Vehicles | 615 (3.8%) | 512 (3.7%) |
| Total | 16,190 (100.0%) | 13,772 (100.0%) |
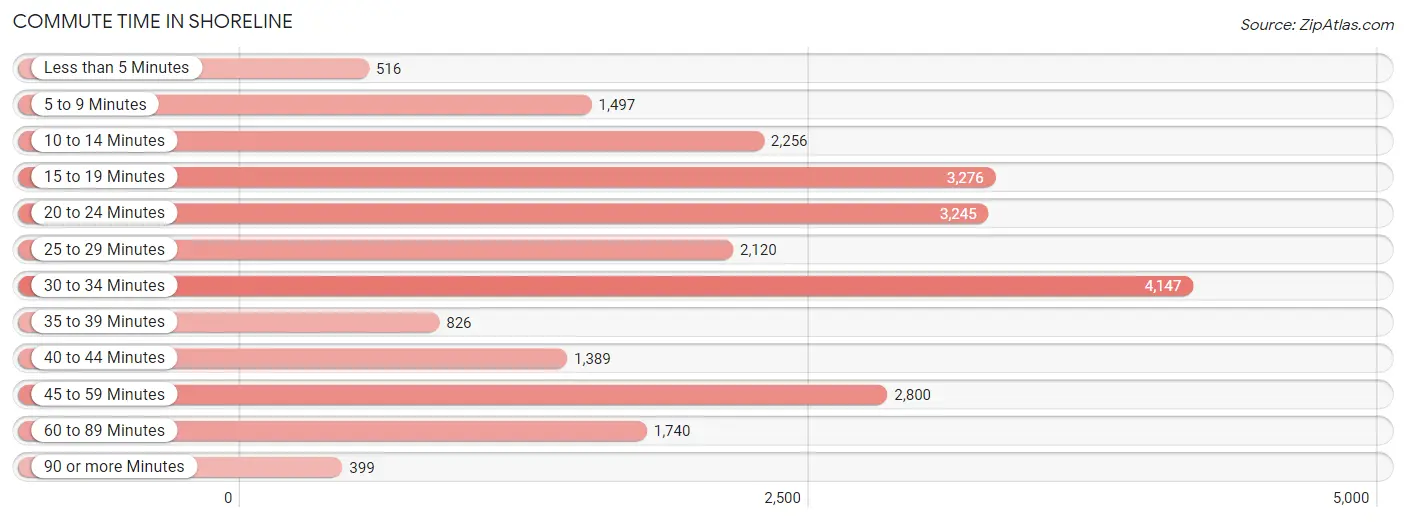
Commute Time in Shoreline
The most frequently occuring commute durations in Shoreline are 30 to 34 minutes (4,147 commuters, 17.1%), 15 to 19 minutes (3,276 commuters, 13.5%), and 20 to 24 minutes (3,245 commuters, 13.4%).
| Commute Time | # Commuters | % Commuters |
| Less than 5 Minutes | 516 | 2.1% |
| 5 to 9 Minutes | 1,497 | 6.2% |
| 10 to 14 Minutes | 2,256 | 9.3% |
| 15 to 19 Minutes | 3,276 | 13.5% |
| 20 to 24 Minutes | 3,245 | 13.4% |
| 25 to 29 Minutes | 2,120 | 8.8% |
| 30 to 34 Minutes | 4,147 | 17.1% |
| 35 to 39 Minutes | 826 | 3.4% |
| 40 to 44 Minutes | 1,389 | 5.7% |
| 45 to 59 Minutes | 2,800 | 11.6% |
| 60 to 89 Minutes | 1,740 | 7.2% |
| 90 or more Minutes | 399 | 1.7% |
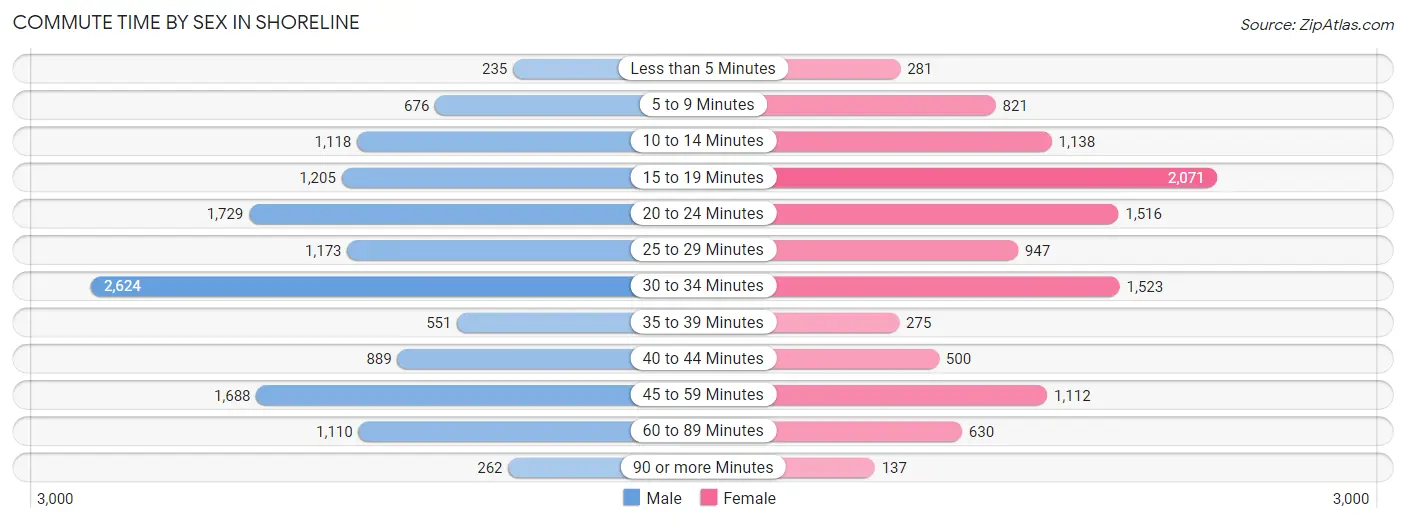
Commute Time by Sex in Shoreline
The most common commute times in Shoreline are 30 to 34 minutes (2,624 commuters, 19.8%) for males and 15 to 19 minutes (2,071 commuters, 18.9%) for females.
| Commute Time | Male | Female |
| Less than 5 Minutes | 235 (1.8%) | 281 (2.6%) |
| 5 to 9 Minutes | 676 (5.1%) | 821 (7.5%) |
| 10 to 14 Minutes | 1,118 (8.4%) | 1,138 (10.4%) |
| 15 to 19 Minutes | 1,205 (9.1%) | 2,071 (18.9%) |
| 20 to 24 Minutes | 1,729 (13.0%) | 1,516 (13.8%) |
| 25 to 29 Minutes | 1,173 (8.8%) | 947 (8.6%) |
| 30 to 34 Minutes | 2,624 (19.8%) | 1,523 (13.9%) |
| 35 to 39 Minutes | 551 (4.2%) | 275 (2.5%) |
| 40 to 44 Minutes | 889 (6.7%) | 500 (4.6%) |
| 45 to 59 Minutes | 1,688 (12.7%) | 1,112 (10.2%) |
| 60 to 89 Minutes | 1,110 (8.4%) | 630 (5.8%) |
| 90 or more Minutes | 262 (2.0%) | 137 (1.3%) |
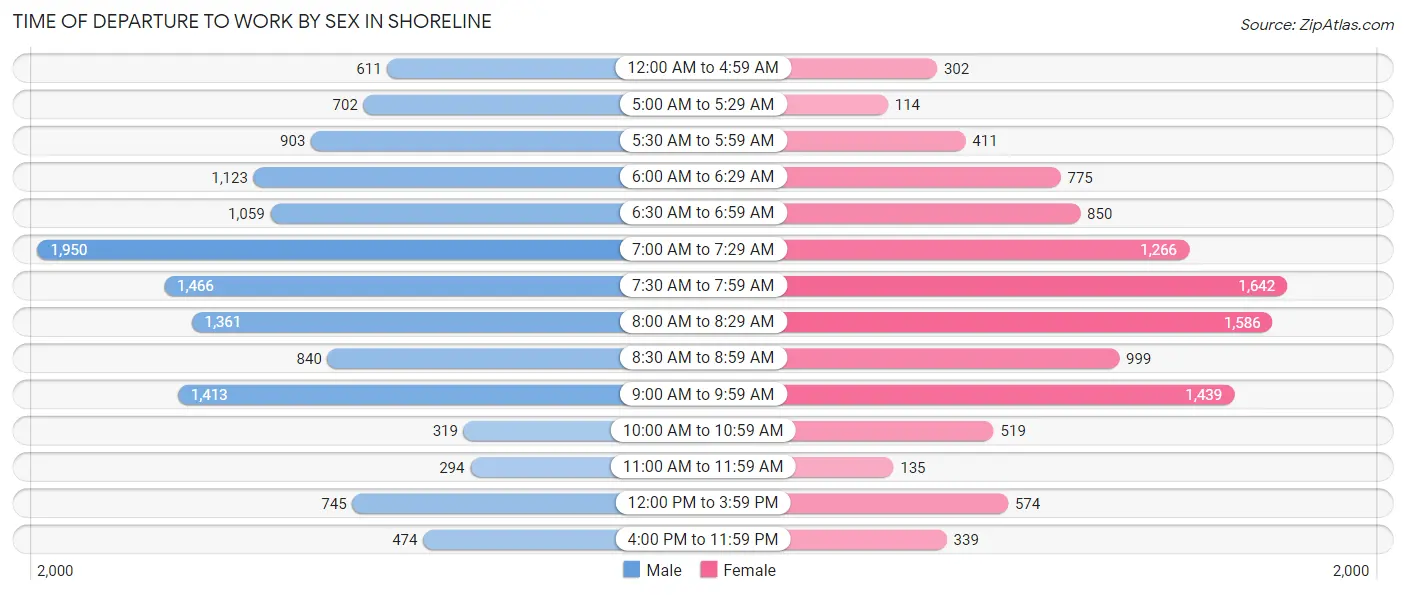
Time of Departure to Work by Sex in Shoreline
The most frequent times of departure to work in Shoreline are 7:00 AM to 7:29 AM (1,950, 14.7%) for males and 7:30 AM to 7:59 AM (1,642, 15.0%) for females.
| Time of Departure | Male | Female |
| 12:00 AM to 4:59 AM | 611 (4.6%) | 302 (2.8%) |
| 5:00 AM to 5:29 AM | 702 (5.3%) | 114 (1.0%) |
| 5:30 AM to 5:59 AM | 903 (6.8%) | 411 (3.7%) |
| 6:00 AM to 6:29 AM | 1,123 (8.5%) | 775 (7.1%) |
| 6:30 AM to 6:59 AM | 1,059 (8.0%) | 850 (7.8%) |
| 7:00 AM to 7:29 AM | 1,950 (14.7%) | 1,266 (11.6%) |
| 7:30 AM to 7:59 AM | 1,466 (11.1%) | 1,642 (15.0%) |
| 8:00 AM to 8:29 AM | 1,361 (10.3%) | 1,586 (14.5%) |
| 8:30 AM to 8:59 AM | 840 (6.3%) | 999 (9.1%) |
| 9:00 AM to 9:59 AM | 1,413 (10.7%) | 1,439 (13.1%) |
| 10:00 AM to 10:59 AM | 319 (2.4%) | 519 (4.7%) |
| 11:00 AM to 11:59 AM | 294 (2.2%) | 135 (1.2%) |
| 12:00 PM to 3:59 PM | 745 (5.6%) | 574 (5.2%) |
| 4:00 PM to 11:59 PM | 474 (3.6%) | 339 (3.1%) |
| Total | 13,260 (100.0%) | 10,951 (100.0%) |
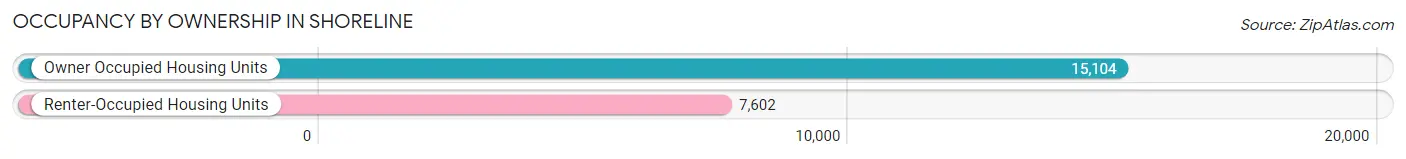
Housing Occupancy in Shoreline
Occupancy by Ownership in Shoreline
Of the total 22,706 dwellings in Shoreline, owner-occupied units account for 15,104 (66.5%), while renter-occupied units make up 7,602 (33.5%).
| Occupancy | # Housing Units | % Housing Units |
| Owner Occupied Housing Units | 15,104 | 66.5% |
| Renter-Occupied Housing Units | 7,602 | 33.5% |
| Total Occupied Housing Units | 22,706 | 100.0% |
Occupancy by Household Size in Shoreline
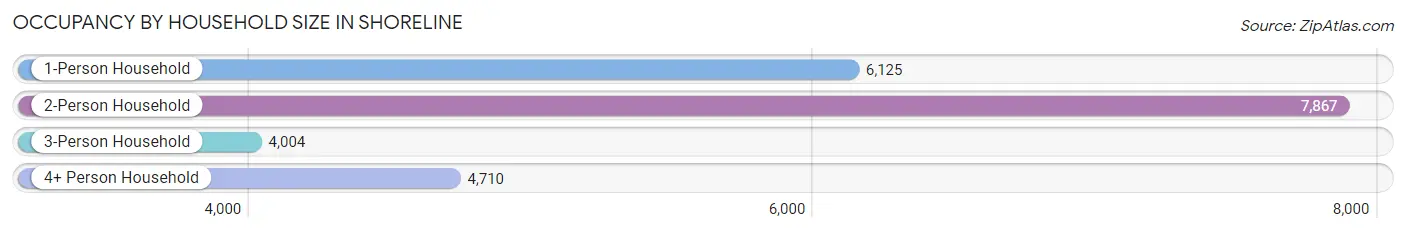
| Household Size | # Housing Units | % Housing Units |
| 1-Person Household | 6,125 | 27.0% |
| 2-Person Household | 7,867 | 34.6% |
| 3-Person Household | 4,004 | 17.6% |
| 4+ Person Household | 4,710 | 20.7% |
| Total Housing Units | 22,706 | 100.0% |
Occupancy by Ownership by Household Size in Shoreline
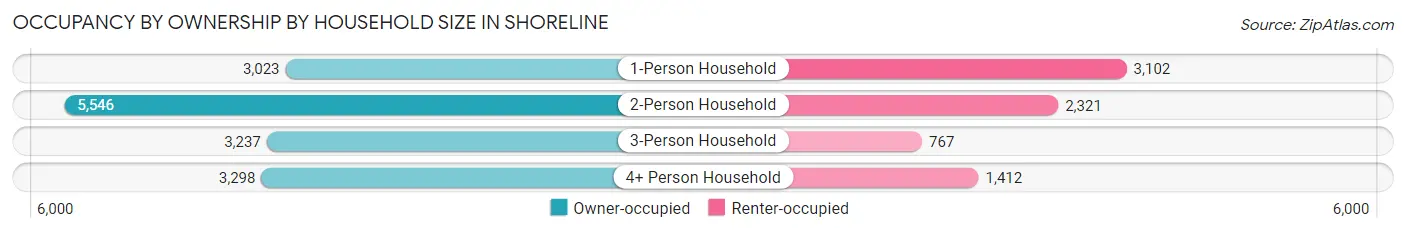
| Household Size | Owner-occupied | Renter-occupied |
| 1-Person Household | 3,023 (49.4%) | 3,102 (50.6%) |
| 2-Person Household | 5,546 (70.5%) | 2,321 (29.5%) |
| 3-Person Household | 3,237 (80.8%) | 767 (19.2%) |
| 4+ Person Household | 3,298 (70.0%) | 1,412 (30.0%) |
| Total Housing Units | 15,104 (66.5%) | 7,602 (33.5%) |
Occupancy by Educational Attainment in Shoreline
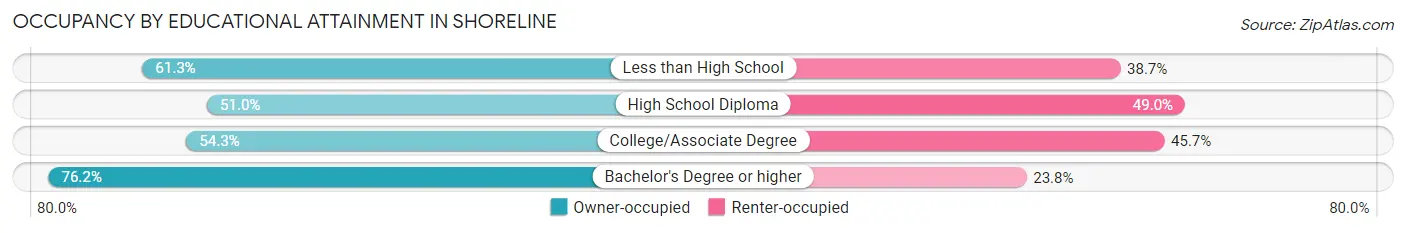
| Household Size | Owner-occupied | Renter-occupied |
| Less than High School | 645 (61.3%) | 407 (38.7%) |
| High School Diploma | 1,275 (51.0%) | 1,223 (49.0%) |
| College/Associate Degree | 3,508 (54.3%) | 2,949 (45.7%) |
| Bachelor's Degree or higher | 9,676 (76.2%) | 3,023 (23.8%) |
Occupancy by Age of Householder in Shoreline
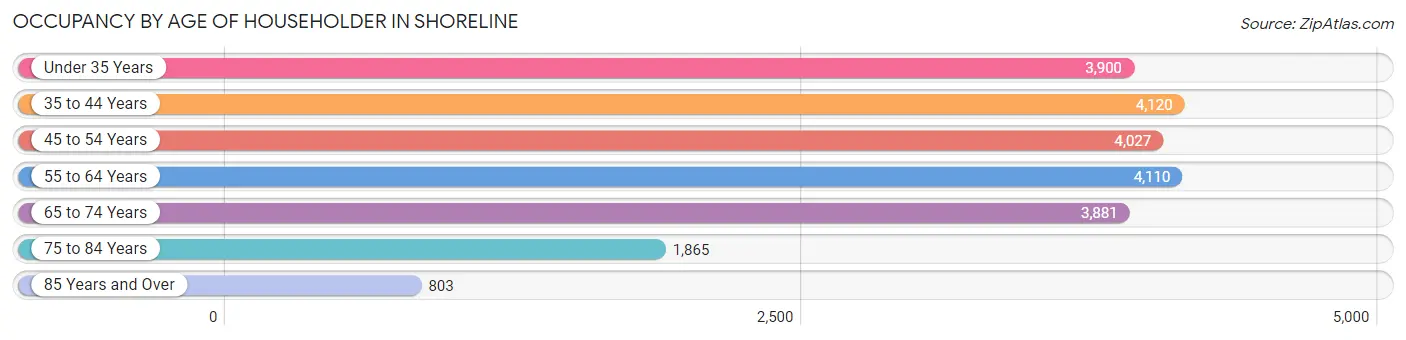
| Age Bracket | # Households | % Households |
| Under 35 Years | 3,900 | 17.2% |
| 35 to 44 Years | 4,120 | 18.1% |
| 45 to 54 Years | 4,027 | 17.7% |
| 55 to 64 Years | 4,110 | 18.1% |
| 65 to 74 Years | 3,881 | 17.1% |
| 75 to 84 Years | 1,865 | 8.2% |
| 85 Years and Over | 803 | 3.5% |
| Total | 22,706 | 100.0% |
Housing Finances in Shoreline
Median Income by Occupancy in Shoreline
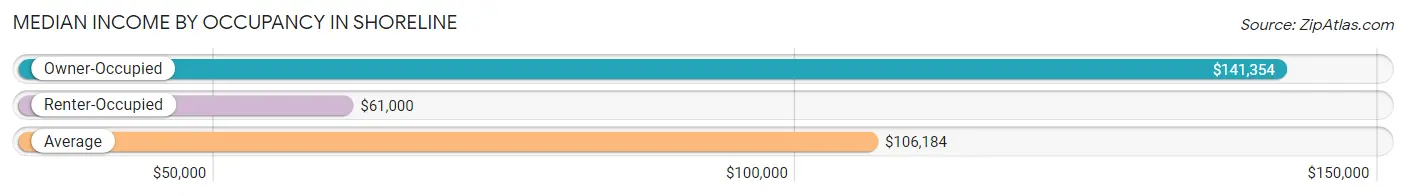
| Occupancy Type | # Households | Median Income |
| Owner-Occupied | 15,104 (66.5%) | $141,354 |
| Renter-Occupied | 7,602 (33.5%) | $61,000 |
| Average | 22,706 (100.0%) | $106,184 |
Occupancy by Householder Income Bracket in Shoreline
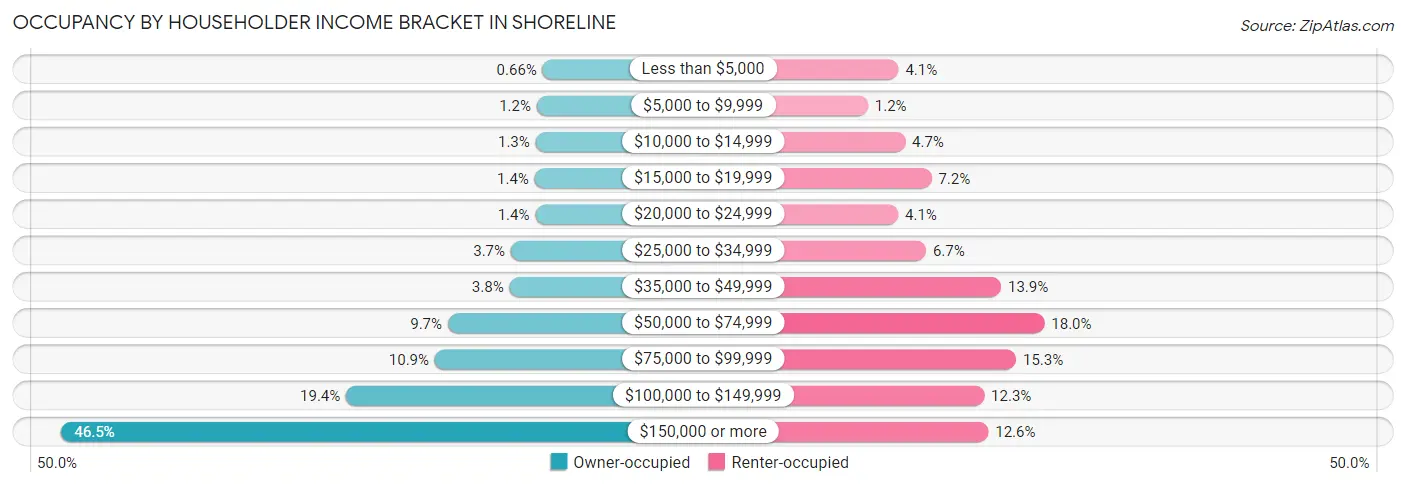
| Income Bracket | Owner-occupied | Renter-occupied |
| Less than $5,000 | 100 (0.7%) | 311 (4.1%) |
| $5,000 to $9,999 | 185 (1.2%) | 89 (1.2%) |
| $10,000 to $14,999 | 201 (1.3%) | 359 (4.7%) |
| $15,000 to $19,999 | 214 (1.4%) | 550 (7.2%) |
| $20,000 to $24,999 | 206 (1.4%) | 308 (4.1%) |
| $25,000 to $34,999 | 558 (3.7%) | 510 (6.7%) |
| $35,000 to $49,999 | 577 (3.8%) | 1,054 (13.9%) |
| $50,000 to $74,999 | 1,463 (9.7%) | 1,367 (18.0%) |
| $75,000 to $99,999 | 1,651 (10.9%) | 1,162 (15.3%) |
| $100,000 to $149,999 | 2,927 (19.4%) | 931 (12.2%) |
| $150,000 or more | 7,022 (46.5%) | 961 (12.6%) |
| Total | 15,104 (100.0%) | 7,602 (100.0%) |
Monthly Housing Cost Tiers in Shoreline
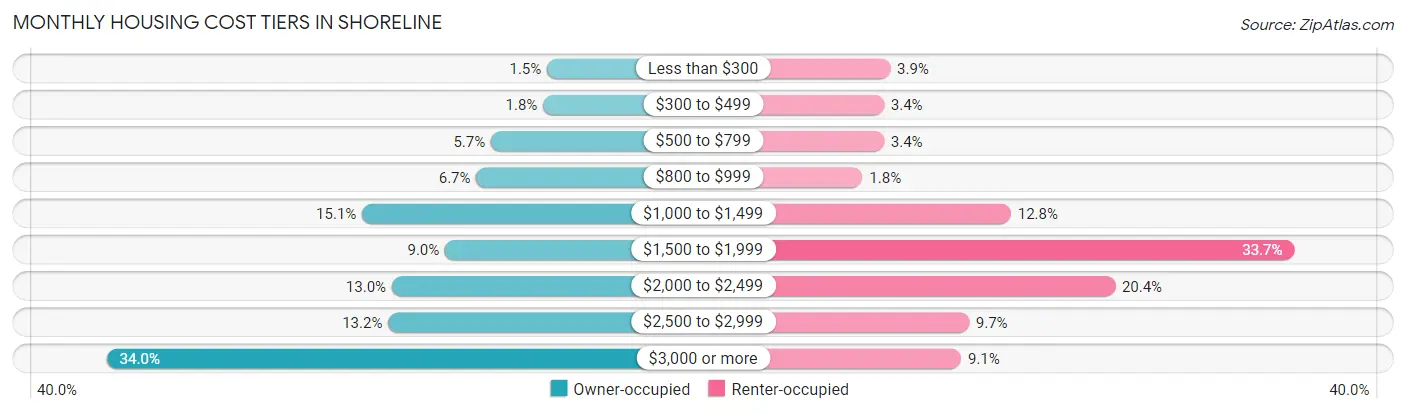
| Monthly Cost | Owner-occupied | Renter-occupied |
| Less than $300 | 229 (1.5%) | 295 (3.9%) |
| $300 to $499 | 273 (1.8%) | 260 (3.4%) |
| $500 to $799 | 853 (5.7%) | 260 (3.4%) |
| $800 to $999 | 1,017 (6.7%) | 140 (1.8%) |
| $1,000 to $1,499 | 2,287 (15.1%) | 971 (12.8%) |
| $1,500 to $1,999 | 1,364 (9.0%) | 2,558 (33.7%) |
| $2,000 to $2,499 | 1,956 (13.0%) | 1,554 (20.4%) |
| $2,500 to $2,999 | 1,996 (13.2%) | 736 (9.7%) |
| $3,000 or more | 5,129 (34.0%) | 692 (9.1%) |
| Total | 15,104 (100.0%) | 7,602 (100.0%) |
Physical Housing Characteristics in Shoreline
Housing Structures in Shoreline
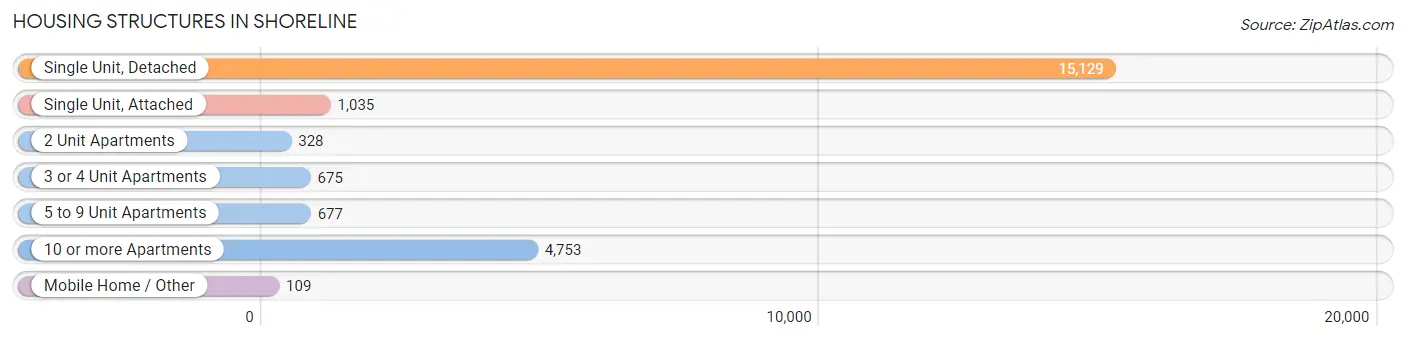
| Structure Type | # Housing Units | % Housing Units |
| Single Unit, Detached | 15,129 | 66.6% |
| Single Unit, Attached | 1,035 | 4.6% |
| 2 Unit Apartments | 328 | 1.4% |
| 3 or 4 Unit Apartments | 675 | 3.0% |
| 5 to 9 Unit Apartments | 677 | 3.0% |
| 10 or more Apartments | 4,753 | 20.9% |
| Mobile Home / Other | 109 | 0.5% |
| Total | 22,706 | 100.0% |
Housing Structures by Occupancy in Shoreline
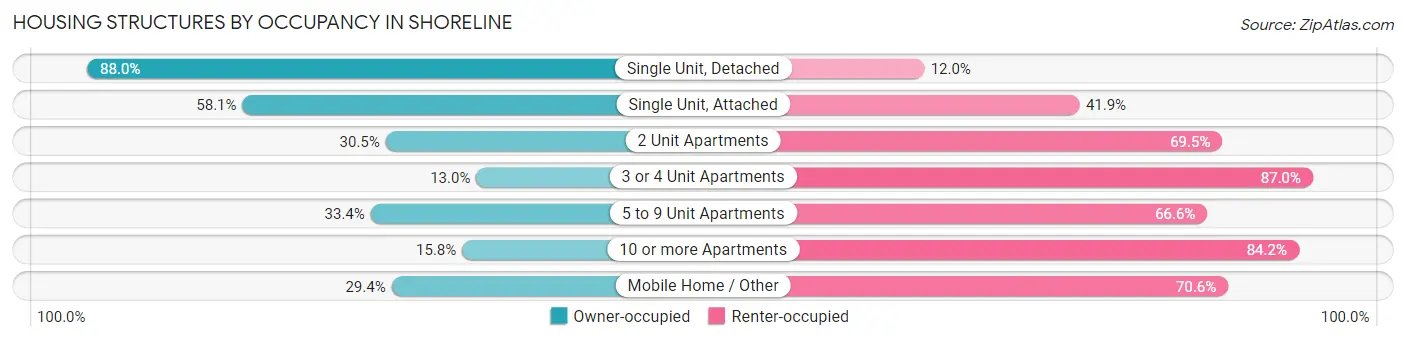
| Structure Type | Owner-occupied | Renter-occupied |
| Single Unit, Detached | 13,308 (88.0%) | 1,821 (12.0%) |
| Single Unit, Attached | 601 (58.1%) | 434 (41.9%) |
| 2 Unit Apartments | 100 (30.5%) | 228 (69.5%) |
| 3 or 4 Unit Apartments | 88 (13.0%) | 587 (87.0%) |
| 5 to 9 Unit Apartments | 226 (33.4%) | 451 (66.6%) |
| 10 or more Apartments | 749 (15.8%) | 4,004 (84.2%) |
| Mobile Home / Other | 32 (29.4%) | 77 (70.6%) |
| Total | 15,104 (66.5%) | 7,602 (33.5%) |
Housing Structures by Number of Rooms in Shoreline
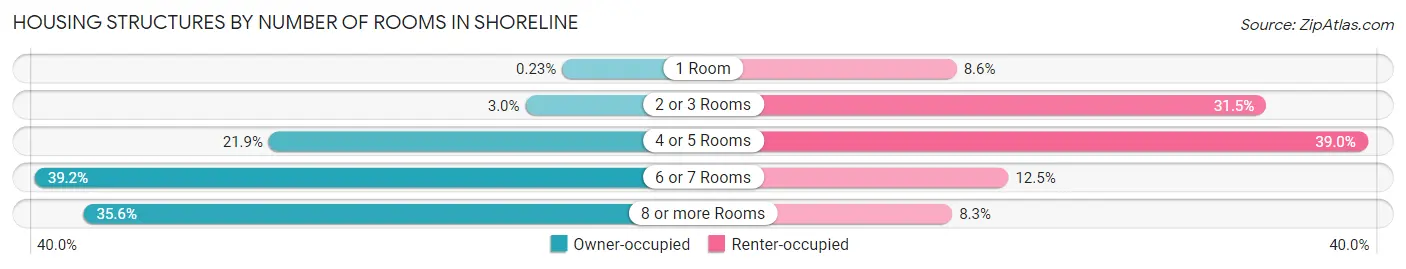
| Number of Rooms | Owner-occupied | Renter-occupied |
| 1 Room | 35 (0.2%) | 657 (8.6%) |
| 2 or 3 Rooms | 446 (2.9%) | 2,397 (31.5%) |
| 4 or 5 Rooms | 3,313 (21.9%) | 2,968 (39.0%) |
| 6 or 7 Rooms | 5,927 (39.2%) | 948 (12.5%) |
| 8 or more Rooms | 5,383 (35.6%) | 632 (8.3%) |
| Total | 15,104 (100.0%) | 7,602 (100.0%) |
Housing Structure by Heating Type in Shoreline
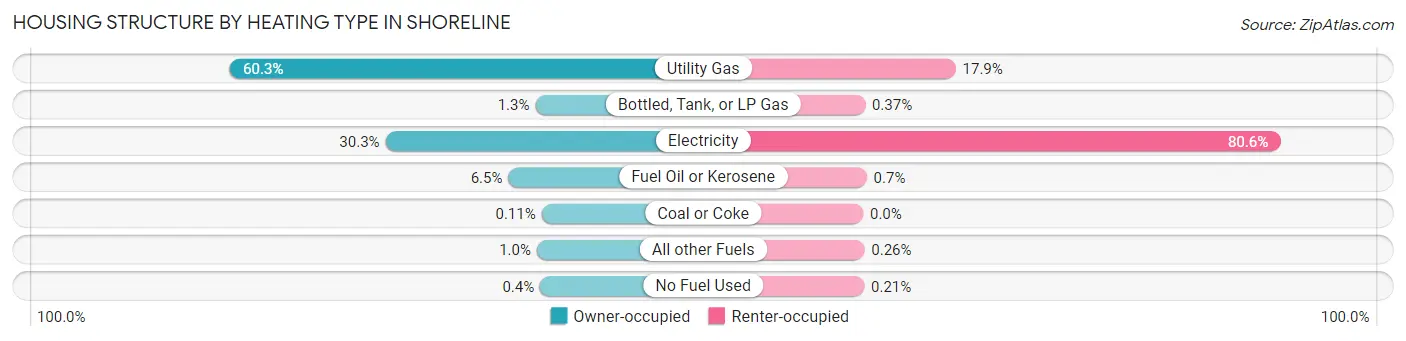
| Heating Type | Owner-occupied | Renter-occupied |
| Utility Gas | 9,109 (60.3%) | 1,360 (17.9%) |
| Bottled, Tank, or LP Gas | 200 (1.3%) | 28 (0.4%) |
| Electricity | 4,574 (30.3%) | 6,125 (80.6%) |
| Fuel Oil or Kerosene | 988 (6.5%) | 53 (0.7%) |
| Coal or Coke | 17 (0.1%) | 0 (0.0%) |
| All other Fuels | 156 (1.0%) | 20 (0.3%) |
| No Fuel Used | 60 (0.4%) | 16 (0.2%) |
| Total | 15,104 (100.0%) | 7,602 (100.0%) |
Household Vehicle Usage in Shoreline
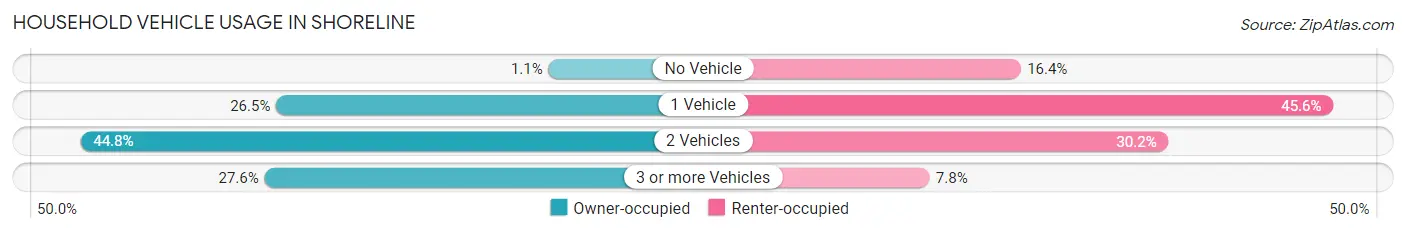
| Vehicles per Household | Owner-occupied | Renter-occupied |
| No Vehicle | 165 (1.1%) | 1,244 (16.4%) |
| 1 Vehicle | 4,004 (26.5%) | 3,466 (45.6%) |
| 2 Vehicles | 6,767 (44.8%) | 2,296 (30.2%) |
| 3 or more Vehicles | 4,168 (27.6%) | 596 (7.8%) |
| Total | 15,104 (100.0%) | 7,602 (100.0%) |
Real Estate & Mortgages in Shoreline
Real Estate and Mortgage Overview in Shoreline
| Characteristic | Without Mortgage | With Mortgage |
| Housing Units | 4,635 | 10,469 |
| Median Property Value | $669,600 | $730,100 |
| Median Household Income | $90,427 | $5,795 |
| Monthly Housing Costs | $997 | $5,079 |
| Real Estate Taxes | $6,716 | $30 |
Property Value by Mortgage Status in Shoreline
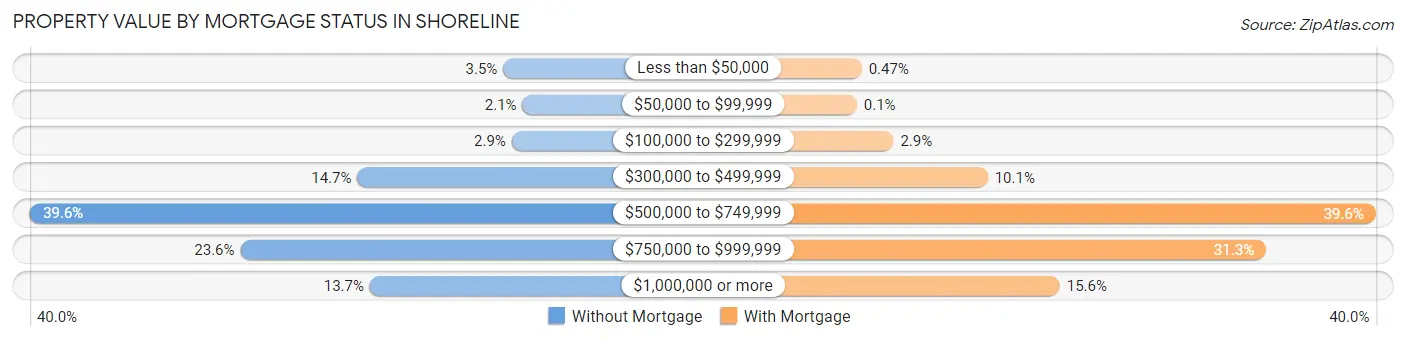
| Property Value | Without Mortgage | With Mortgage |
| Less than $50,000 | 164 (3.5%) | 49 (0.5%) |
| $50,000 to $99,999 | 96 (2.1%) | 10 (0.1%) |
| $100,000 to $299,999 | 134 (2.9%) | 303 (2.9%) |
| $300,000 to $499,999 | 679 (14.6%) | 1,054 (10.1%) |
| $500,000 to $749,999 | 1,835 (39.6%) | 4,149 (39.6%) |
| $750,000 to $999,999 | 1,092 (23.6%) | 3,275 (31.3%) |
| $1,000,000 or more | 635 (13.7%) | 1,629 (15.6%) |
| Total | 4,635 (100.0%) | 10,469 (100.0%) |
Household Income by Mortgage Status in Shoreline
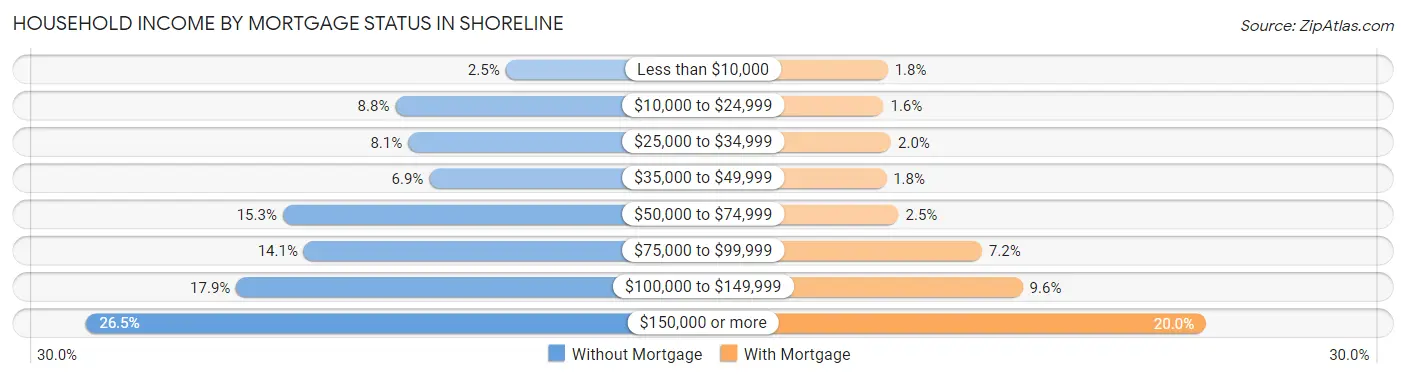
| Household Income | Without Mortgage | With Mortgage |
| Less than $10,000 | 117 (2.5%) | 193 (1.8%) |
| $10,000 to $24,999 | 409 (8.8%) | 168 (1.6%) |
| $25,000 to $34,999 | 375 (8.1%) | 212 (2.0%) |
| $35,000 to $49,999 | 319 (6.9%) | 183 (1.8%) |
| $50,000 to $74,999 | 707 (15.2%) | 258 (2.5%) |
| $75,000 to $99,999 | 651 (14.1%) | 756 (7.2%) |
| $100,000 to $149,999 | 830 (17.9%) | 1,000 (9.6%) |
| $150,000 or more | 1,227 (26.5%) | 2,097 (20.0%) |
| Total | 4,635 (100.0%) | 10,469 (100.0%) |
Property Value to Household Income Ratio in Shoreline
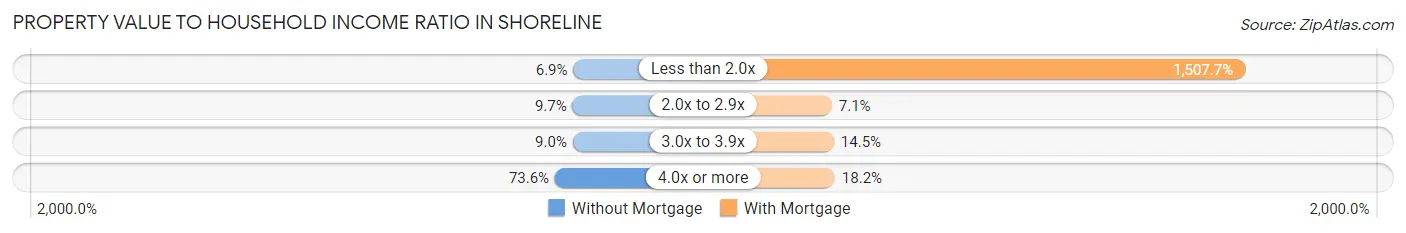
| Value-to-Income Ratio | Without Mortgage | With Mortgage |
| Less than 2.0x | 318 (6.9%) | 157,836 (1,507.6%) |
| 2.0x to 2.9x | 448 (9.7%) | 746 (7.1%) |
| 3.0x to 3.9x | 415 (8.9%) | 1,518 (14.5%) |
| 4.0x or more | 3,413 (73.6%) | 1,900 (18.1%) |
| Total | 4,635 (100.0%) | 10,469 (100.0%) |
Real Estate Taxes by Mortgage Status in Shoreline
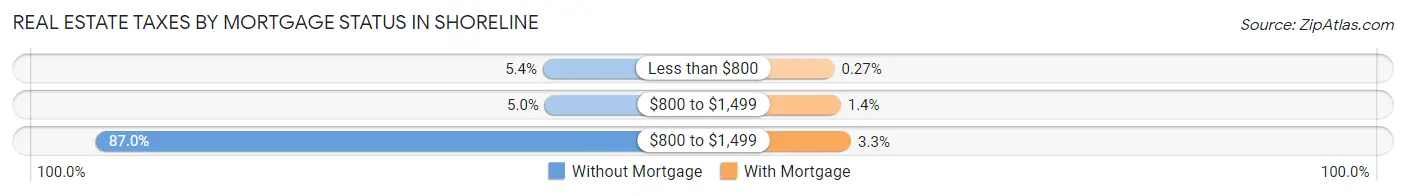
| Property Taxes | Without Mortgage | With Mortgage |
| Less than $800 | 248 (5.3%) | 28 (0.3%) |
| $800 to $1,499 | 232 (5.0%) | 148 (1.4%) |
| $800 to $1,499 | 4,031 (87.0%) | 347 (3.3%) |
| Total | 4,635 (100.0%) | 10,469 (100.0%) |
Health & Disability in Shoreline
Health Insurance Coverage by Age in Shoreline
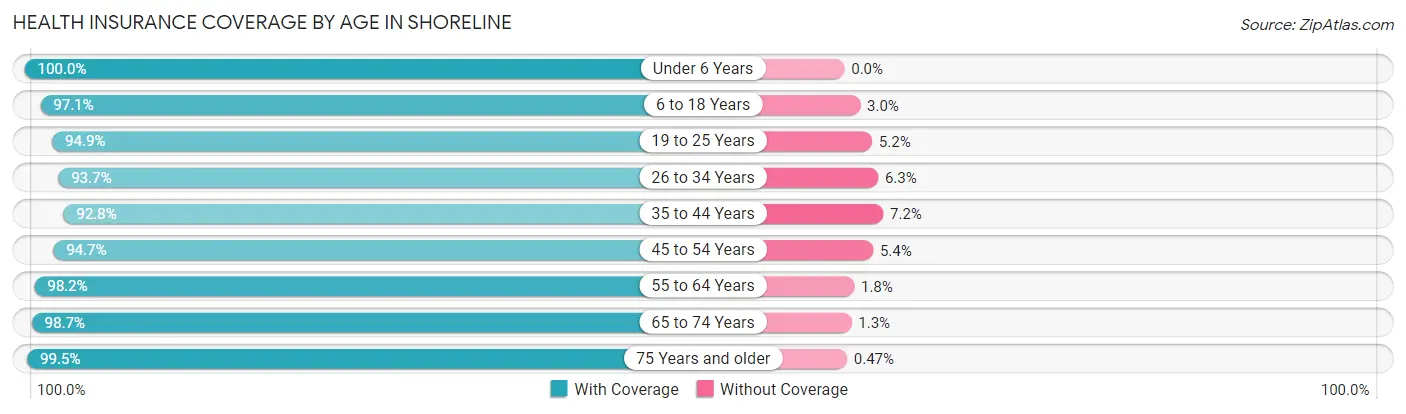
| Age Bracket | With Coverage | Without Coverage |
| Under 6 Years | 3,756 (100.0%) | 0 (0.0%) |
| 6 to 18 Years | 7,437 (97.1%) | 226 (2.9%) |
| 19 to 25 Years | 3,428 (94.9%) | 186 (5.1%) |
| 26 to 34 Years | 7,403 (93.7%) | 496 (6.3%) |
| 35 to 44 Years | 8,085 (92.8%) | 631 (7.2%) |
| 45 to 54 Years | 7,414 (94.7%) | 419 (5.3%) |
| 55 to 64 Years | 7,429 (98.2%) | 138 (1.8%) |
| 65 to 74 Years | 6,356 (98.7%) | 85 (1.3%) |
| 75 Years and older | 4,439 (99.5%) | 21 (0.5%) |
| Total | 55,747 (96.2%) | 2,202 (3.8%) |
Health Insurance Coverage by Citizenship Status in Shoreline
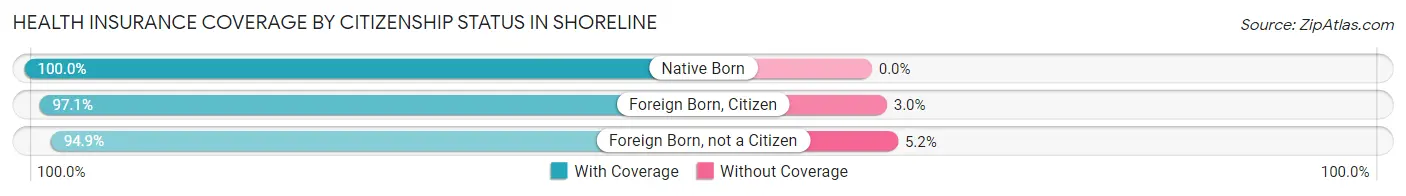
| Citizenship Status | With Coverage | Without Coverage |
| Native Born | 3,756 (100.0%) | 0 (0.0%) |
| Foreign Born, Citizen | 7,437 (97.1%) | 226 (2.9%) |
| Foreign Born, not a Citizen | 3,428 (94.9%) | 186 (5.1%) |
Health Insurance Coverage by Household Income in Shoreline
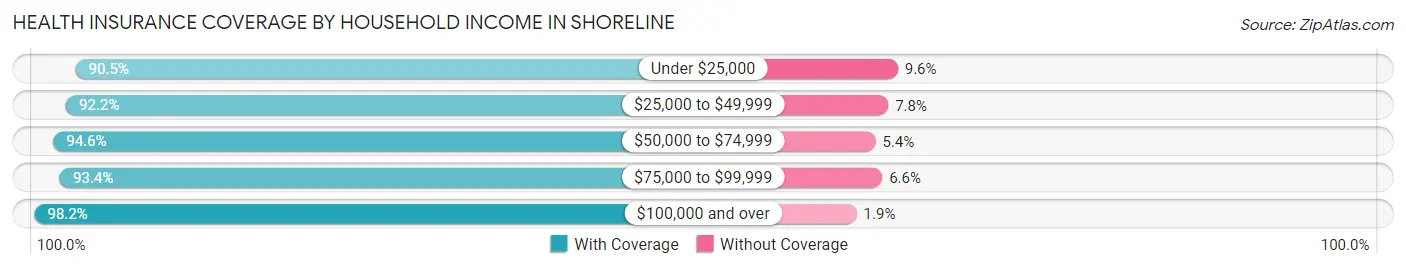
| Household Income | With Coverage | Without Coverage |
| Under $25,000 | 3,361 (90.4%) | 355 (9.6%) |
| $25,000 to $49,999 | 4,244 (92.2%) | 357 (7.8%) |
| $50,000 to $74,999 | 5,491 (94.6%) | 312 (5.4%) |
| $75,000 to $99,999 | 6,609 (93.4%) | 470 (6.6%) |
| $100,000 and over | 34,876 (98.2%) | 657 (1.8%) |
Public vs Private Health Insurance Coverage by Age in Shoreline
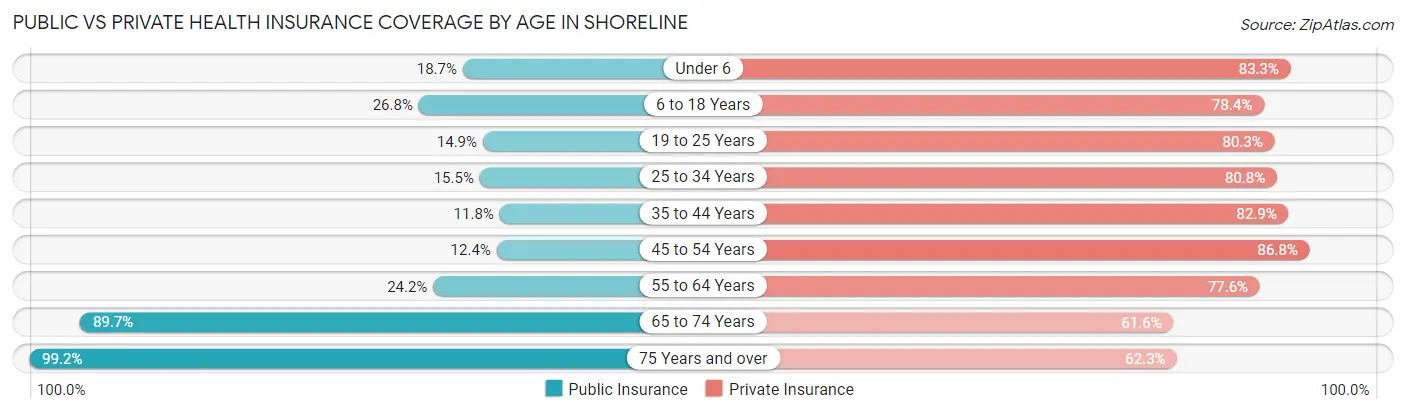
| Age Bracket | Public Insurance | Private Insurance |
| Under 6 | 701 (18.7%) | 3,130 (83.3%) |
| 6 to 18 Years | 2,057 (26.8%) | 6,007 (78.4%) |
| 19 to 25 Years | 540 (14.9%) | 2,903 (80.3%) |
| 25 to 34 Years | 1,226 (15.5%) | 6,381 (80.8%) |
| 35 to 44 Years | 1,030 (11.8%) | 7,228 (82.9%) |
| 45 to 54 Years | 970 (12.4%) | 6,802 (86.8%) |
| 55 to 64 Years | 1,828 (24.2%) | 5,873 (77.6%) |
| 65 to 74 Years | 5,779 (89.7%) | 3,965 (61.6%) |
| 75 Years and over | 4,423 (99.2%) | 2,778 (62.3%) |
| Total | 18,554 (32.0%) | 45,067 (77.8%) |
Disability Status by Sex by Age in Shoreline
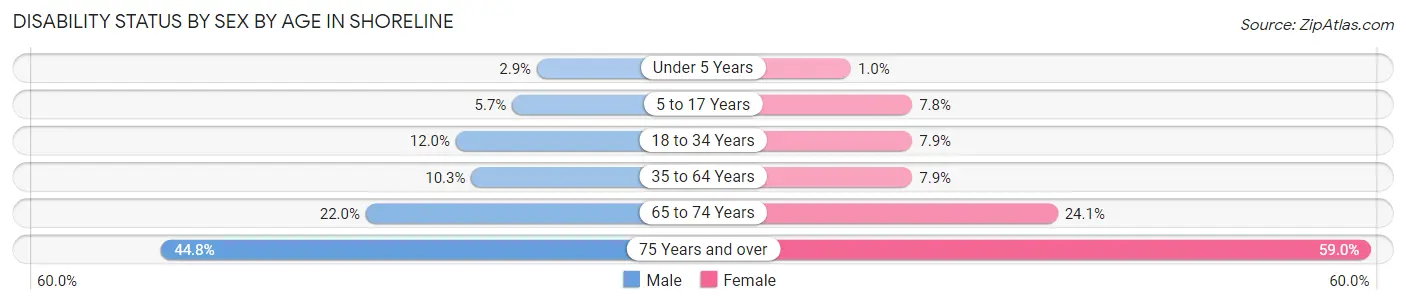
| Age Bracket | Male | Female |
| Under 5 Years | 49 (2.9%) | 15 (1.0%) |
| 5 to 17 Years | 223 (5.7%) | 319 (7.8%) |
| 18 to 34 Years | 716 (12.0%) | 459 (7.9%) |
| 35 to 64 Years | 1,267 (10.2%) | 924 (7.9%) |
| 65 to 74 Years | 707 (22.0%) | 776 (24.0%) |
| 75 Years and over | 749 (44.8%) | 1,643 (59.0%) |
Disability Class by Sex by Age in Shoreline
Disability Class: Hearing Difficulty
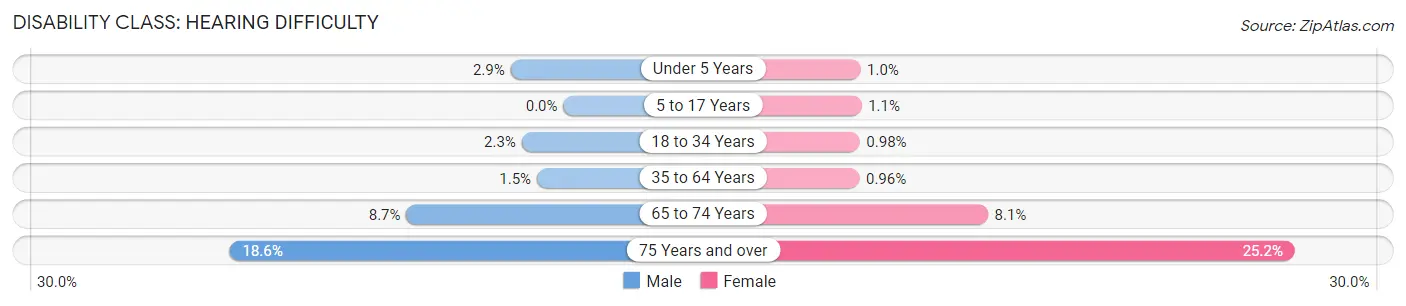
| Age Bracket | Male | Female |
| Under 5 Years | 49 (2.9%) | 15 (1.0%) |
| 5 to 17 Years | 0 (0.0%) | 44 (1.1%) |
| 18 to 34 Years | 139 (2.3%) | 57 (1.0%) |
| 35 to 64 Years | 182 (1.5%) | 113 (1.0%) |
| 65 to 74 Years | 281 (8.7%) | 262 (8.1%) |
| 75 Years and over | 311 (18.6%) | 703 (25.2%) |
Disability Class: Vision Difficulty
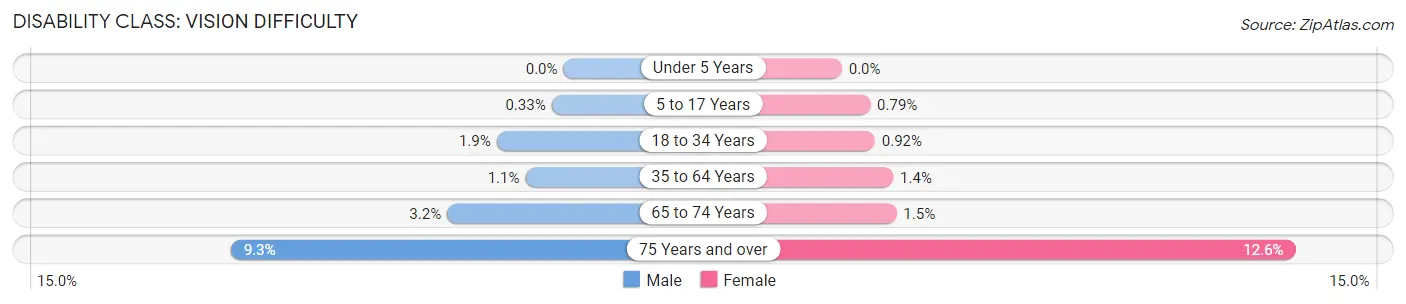
| Age Bracket | Male | Female |
| Under 5 Years | 0 (0.0%) | 0 (0.0%) |
| 5 to 17 Years | 13 (0.3%) | 32 (0.8%) |
| 18 to 34 Years | 111 (1.9%) | 54 (0.9%) |
| 35 to 64 Years | 131 (1.1%) | 168 (1.4%) |
| 65 to 74 Years | 104 (3.2%) | 49 (1.5%) |
| 75 Years and over | 155 (9.3%) | 352 (12.6%) |
Disability Class: Cognitive Difficulty
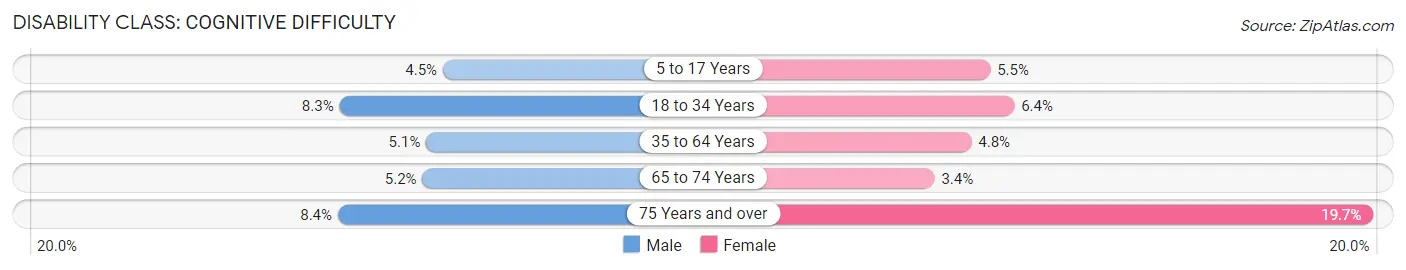
| Age Bracket | Male | Female |
| 5 to 17 Years | 175 (4.5%) | 224 (5.5%) |
| 18 to 34 Years | 497 (8.3%) | 374 (6.4%) |
| 35 to 64 Years | 629 (5.1%) | 566 (4.8%) |
| 65 to 74 Years | 168 (5.2%) | 111 (3.4%) |
| 75 Years and over | 140 (8.4%) | 550 (19.7%) |
Disability Class: Ambulatory Difficulty
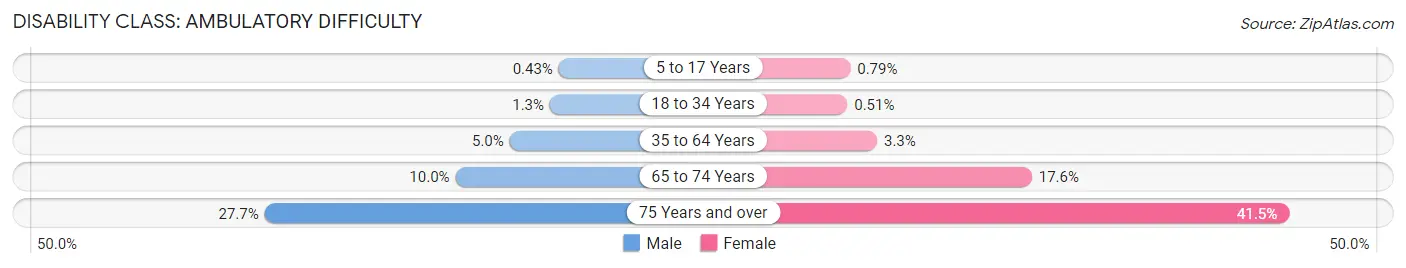
| Age Bracket | Male | Female |
| 5 to 17 Years | 17 (0.4%) | 32 (0.8%) |
| 18 to 34 Years | 75 (1.3%) | 30 (0.5%) |
| 35 to 64 Years | 616 (5.0%) | 384 (3.3%) |
| 65 to 74 Years | 322 (10.0%) | 569 (17.6%) |
| 75 Years and over | 464 (27.7%) | 1,157 (41.5%) |
Disability Class: Self-Care Difficulty
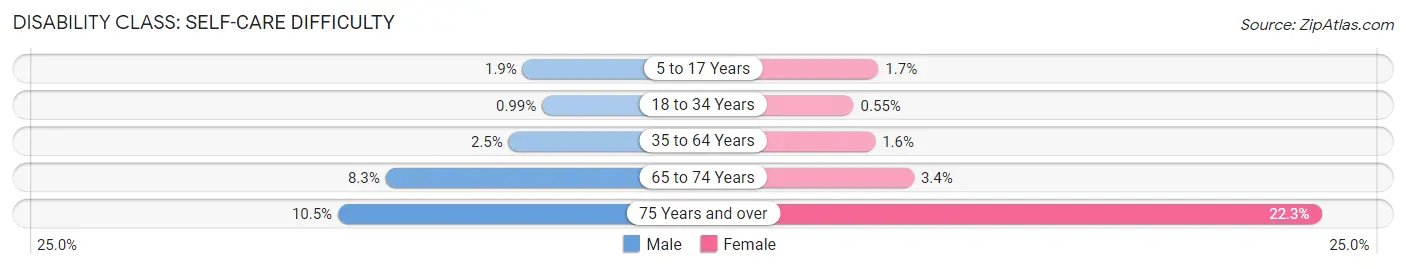
| Age Bracket | Male | Female |
| 5 to 17 Years | 74 (1.9%) | 69 (1.7%) |
| 18 to 34 Years | 59 (1.0%) | 32 (0.5%) |
| 35 to 64 Years | 314 (2.5%) | 182 (1.5%) |
| 65 to 74 Years | 265 (8.3%) | 108 (3.4%) |
| 75 Years and over | 175 (10.5%) | 620 (22.3%) |
Technology Access in Shoreline
Computing Device Access in Shoreline
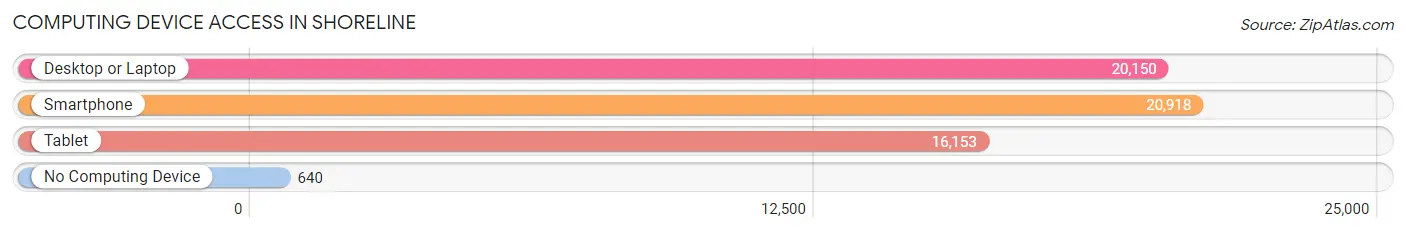
| Device Type | # Households | % Households |
| Desktop or Laptop | 20,150 | 88.7% |
| Smartphone | 20,918 | 92.1% |
| Tablet | 16,153 | 71.1% |
| No Computing Device | 640 | 2.8% |
| Total | 22,706 | 100.0% |
Internet Access in Shoreline
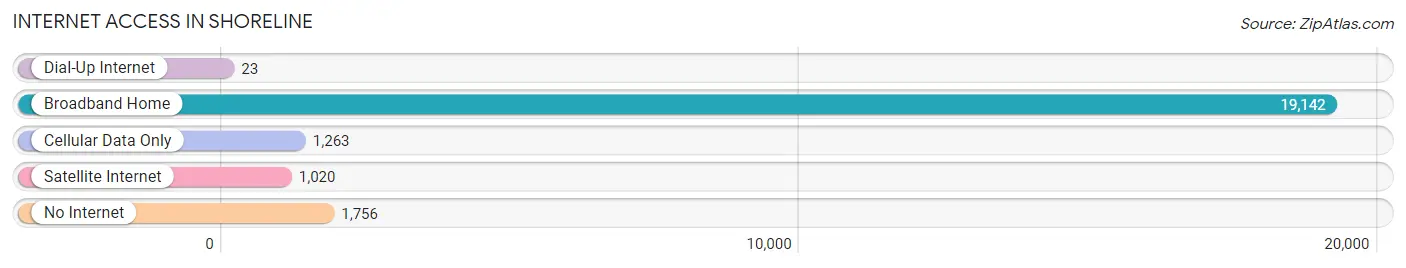
| Internet Type | # Households | % Households |
| Dial-Up Internet | 23 | 0.1% |
| Broadband Home | 19,142 | 84.3% |
| Cellular Data Only | 1,263 | 5.6% |
| Satellite Internet | 1,020 | 4.5% |
| No Internet | 1,756 | 7.7% |
| Total | 22,706 | 100.0% |
Shoreline Summary
Shoreline, Washington is a city located in King County, Washington, United States. It is situated along the Puget Sound, just north of Seattle. The city has a population of 54,008 as of the 2010 census, making it the 20th largest city in the state.
History
The area that is now Shoreline was originally inhabited by the Snohomish and Duwamish Native American tribes. The first European settlers arrived in the area in the mid-1800s, and the area was officially incorporated as a city in 1995. Prior to its incorporation, the area was known as Richmond Beach, and was part of the unincorporated area of Lake Forest Park.
Geography
Shoreline is located at 47°45'N 122°19'W (47.75, -122.32). It is situated along the Puget Sound, just north of Seattle. The city has a total area of 10.2 square miles, of which 9.9 square miles is land and 0.3 square miles is water. The city is bordered by the cities of Lake Forest Park to the north, Seattle to the south, and Lake Washington to the east.
Economy
Shoreline’s economy is largely based on the service industry, with many residents employed in retail, healthcare, and education. The city is also home to several large employers, including Microsoft, Boeing, and Amazon. The city also has a thriving arts and culture scene, with several galleries, theaters, and music venues.
Demographics
As of the 2010 census, Shoreline had a population of 54,008. The racial makeup of the city was 68.2% White, 11.3% Asian, 8.2% African American, 0.7% Native American, 0.2% Pacific Islander, and 11.4% from other races. The median household income was $63,945, and the median family income was $76,945.
Conclusion
Shoreline, Washington is a vibrant city located along the Puget Sound, just north of Seattle. It has a rich history, and is home to a diverse population. The city’s economy is largely based on the service industry, with many residents employed in retail, healthcare, and education. The city also has a thriving arts and culture scene, with several galleries, theaters, and music venues.
Common Questions
What is Per Capita Income in Shoreline?
Per Capita income in Shoreline is $55,932.
What is the Median Family Income in Shoreline?
Median Family Income in Shoreline is $137,112.
What is the Median Household income in Shoreline?
Median Household Income in Shoreline is $106,184.
What is Income or Wage Gap in Shoreline?
Income or Wage Gap in Shoreline is 27.0%.
Women in Shoreline earn 73.0 cents for every dollar earned by a man.
What is Family Income Deficit in Shoreline?
Family Income Deficit in Shoreline is $8,934.
Families that are below poverty line in Shoreline earn $8,934 less on average than the poverty threshold level.
What is Inequality or Gini Index in Shoreline?
Inequality or Gini Index in Shoreline is 0.45.
What is the Total Population of Shoreline?
Total Population of Shoreline is 58,673.
What is the Total Male Population of Shoreline?
Total Male Population of Shoreline is 29,070.
What is the Total Female Population of Shoreline?
Total Female Population of Shoreline is 29,603.
What is the Ratio of Males per 100 Females in Shoreline?
There are 98.20 Males per 100 Females in Shoreline.
What is the Ratio of Females per 100 Males in Shoreline?
There are 101.83 Females per 100 Males in Shoreline.
What is the Median Population Age in Shoreline?
Median Population Age in Shoreline is 41.8 Years.
What is the Average Family Size in Shoreline
Average Family Size in Shoreline is 3.0 People.
What is the Average Household Size in Shoreline
Average Household Size in Shoreline is 2.5 People.
How Large is the Labor Force in Shoreline?
There are 31,979 People in the Labor Forcein in Shoreline.
What is the Percentage of People in the Labor Force in Shoreline?
65.4% of People are in the Labor Force in Shoreline.
What is the Unemployment Rate in Shoreline?
Unemployment Rate in Shoreline is 4.4%.