Seattle, WA Map & Demographics
Seattle Map
Seattle Overview
$77,616
PER CAPITA INCOME
$169,878
AVG FAMILY INCOME
$116,068
AVG HOUSEHOLD INCOME
27.7%
WAGE / INCOME GAP [ % ]
72.3¢/ $1
WAGE / INCOME GAP [ $ ]
$10,926
FAMILY INCOME DEFICIT
0.49
INEQUALITY / GINI INDEX
734,603
TOTAL POPULATION
375,562
MALE POPULATION
359,041
FEMALE POPULATION
104.60
MALES / 100 FEMALES
95.60
FEMALES / 100 MALES
35.4
MEDIAN AGE
2.8
AVG FAMILY SIZE
2.0
AVG HOUSEHOLD SIZE
473,869
LABOR FORCE [ PEOPLE ]
73.9%
PERCENT IN LABOR FORCE
4.2%
UNEMPLOYMENT RATE
Seattle Zip Codes
Income in Seattle
Income Overview in Seattle
Per Capita Income in Seattle is $77,616, while median incomes of families and households are $169,878 and $116,068 respectively.
| Characteristic | Number | Measure |
| Per Capita Income | 734,603 | $77,616 |
| Median Family Income | 149,134 | $169,878 |
| Mean Family Income | 149,134 | $220,688 |
| Median Household Income | 345,246 | $116,068 |
| Mean Household Income | 345,246 | $161,694 |
| Income Deficit | 149,134 | $10,926 |
| Wage / Income Gap (%) | 734,603 | 27.72% |
| Wage / Income Gap ($) | 734,603 | 72.28¢ per $1 |
| Gini / Inequality Index | 734,603 | 0.49 |
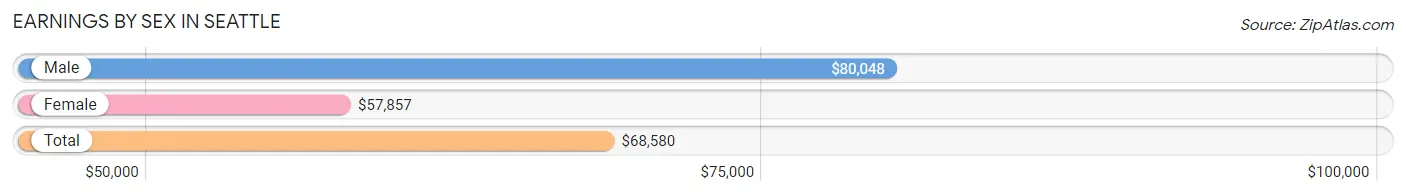
Earnings by Sex in Seattle
Average Earnings in Seattle are $68,580, $80,048 for men and $57,857 for women, a difference of 27.7%.
| Sex | Number | Average Earnings |
| Male | 266,504 (53.6%) | $80,048 |
| Female | 231,096 (46.4%) | $57,857 |
| Total | 497,600 (100.0%) | $68,580 |
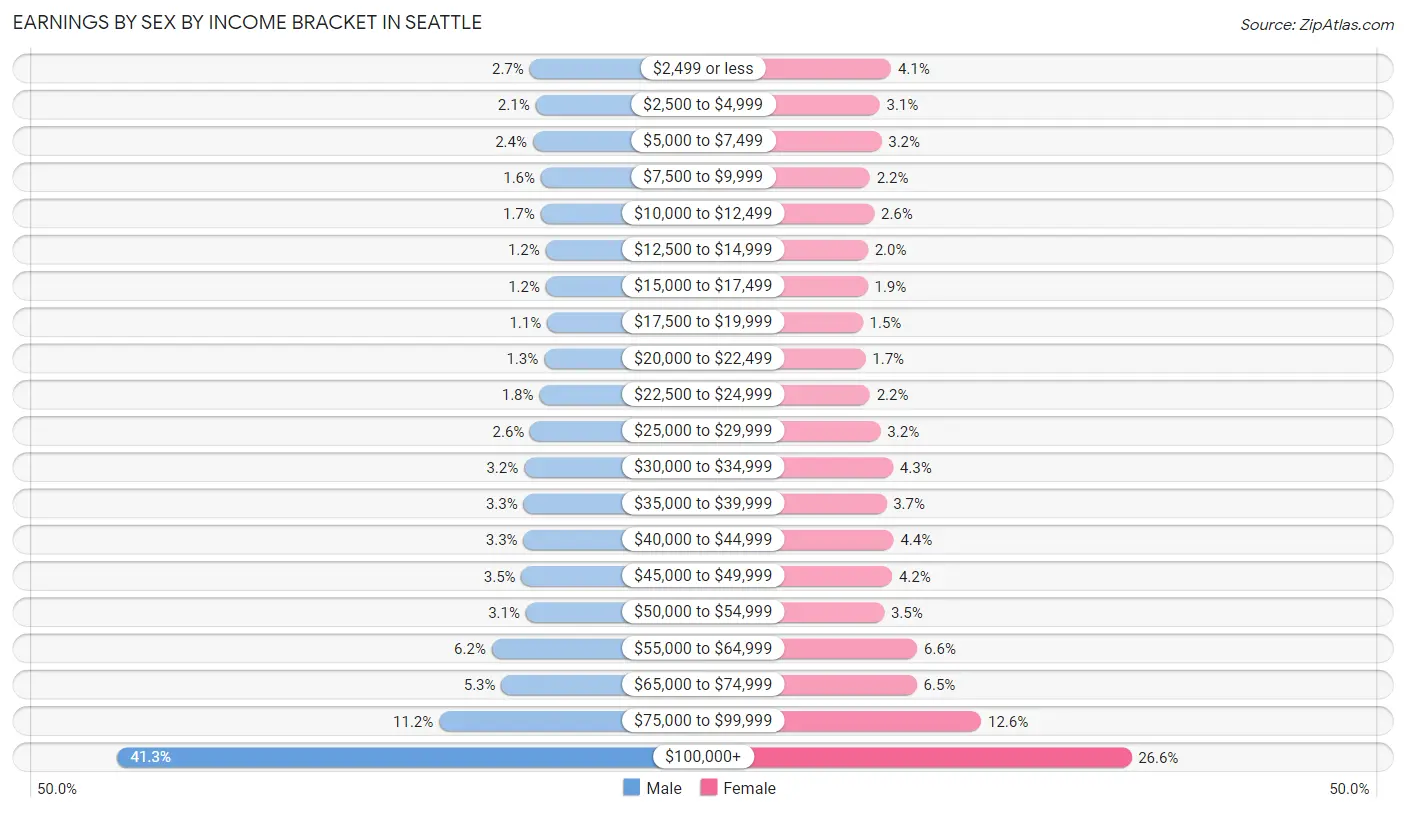
Earnings by Sex by Income Bracket in Seattle
The most common earnings brackets in Seattle are $100,000+ for men (110,029 | 41.3%) and $100,000+ for women (61,573 | 26.6%).
| Income | Male | Female |
| $2,499 or less | 7,163 (2.7%) | 9,566 (4.1%) |
| $2,500 to $4,999 | 5,694 (2.1%) | 7,098 (3.1%) |
| $5,000 to $7,499 | 6,378 (2.4%) | 7,455 (3.2%) |
| $7,500 to $9,999 | 4,363 (1.6%) | 4,973 (2.1%) |
| $10,000 to $12,499 | 4,414 (1.7%) | 5,894 (2.5%) |
| $12,500 to $14,999 | 3,186 (1.2%) | 4,535 (2.0%) |
| $15,000 to $17,499 | 3,153 (1.2%) | 4,472 (1.9%) |
| $17,500 to $19,999 | 2,817 (1.1%) | 3,430 (1.5%) |
| $20,000 to $22,499 | 3,576 (1.3%) | 4,017 (1.7%) |
| $22,500 to $24,999 | 4,751 (1.8%) | 4,965 (2.1%) |
| $25,000 to $29,999 | 7,033 (2.6%) | 7,285 (3.2%) |
| $30,000 to $34,999 | 8,557 (3.2%) | 9,984 (4.3%) |
| $35,000 to $39,999 | 8,685 (3.3%) | 8,524 (3.7%) |
| $40,000 to $44,999 | 8,722 (3.3%) | 10,092 (4.4%) |
| $45,000 to $49,999 | 9,208 (3.5%) | 9,781 (4.2%) |
| $50,000 to $54,999 | 8,138 (3.0%) | 8,041 (3.5%) |
| $55,000 to $64,999 | 16,631 (6.2%) | 15,233 (6.6%) |
| $65,000 to $74,999 | 14,238 (5.3%) | 15,116 (6.5%) |
| $75,000 to $99,999 | 29,768 (11.2%) | 29,062 (12.6%) |
| $100,000+ | 110,029 (41.3%) | 61,573 (26.6%) |
| Total | 266,504 (100.0%) | 231,096 (100.0%) |
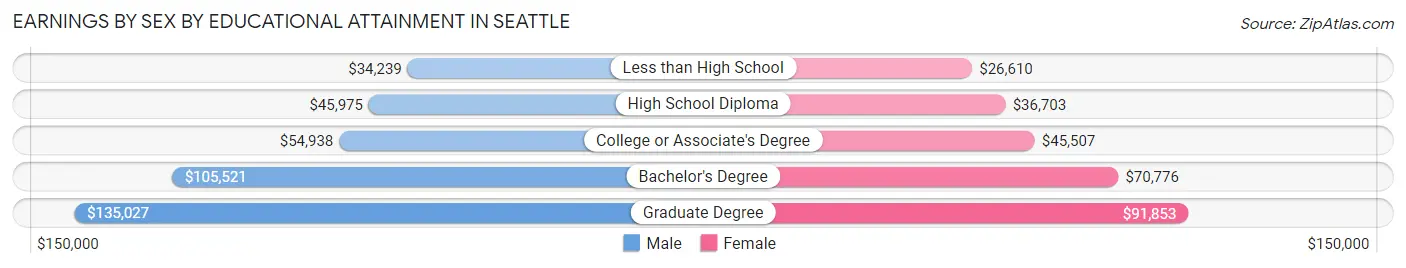
Earnings by Sex by Educational Attainment in Seattle
Average earnings in Seattle are $90,139 for men and $68,383 for women, a difference of 24.1%. Men with an educational attainment of graduate degree enjoy the highest average annual earnings of $135,027, while those with less than high school education earn the least with $34,239. Women with an educational attainment of graduate degree earn the most with the average annual earnings of $91,853, while those with less than high school education have the smallest earnings of $26,610.
| Educational Attainment | Male Income | Female Income |
| Less than High School | $34,239 | $26,610 |
| High School Diploma | $45,975 | $36,703 |
| College or Associate's Degree | $54,938 | $45,507 |
| Bachelor's Degree | $105,521 | $70,776 |
| Graduate Degree | $135,027 | $91,853 |
| Total | $90,139 | $68,383 |
Family Income in Seattle
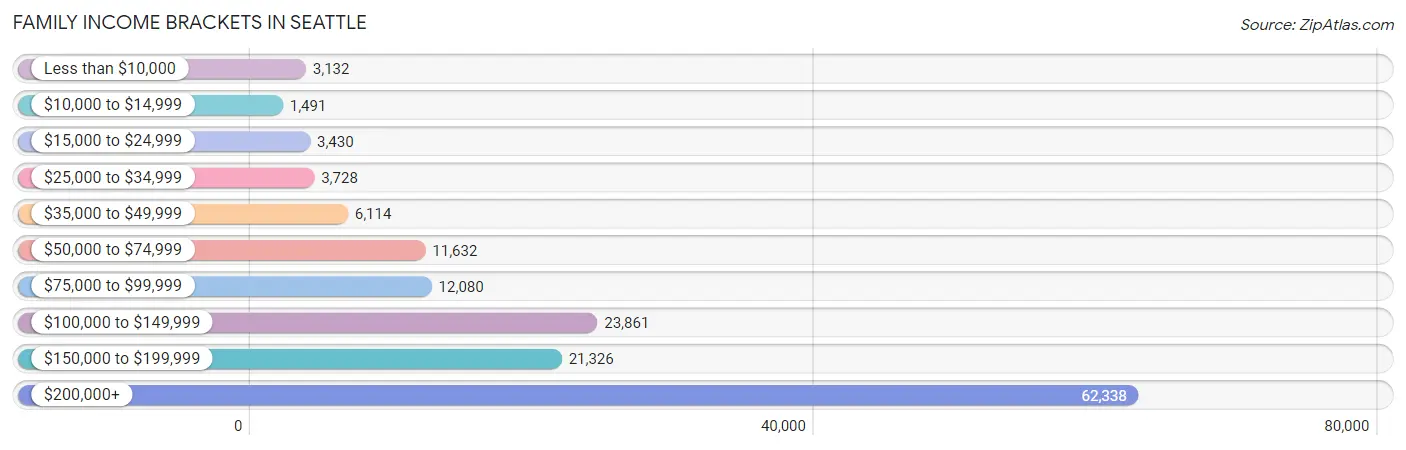
Family Income Brackets in Seattle
According to the Seattle family income data, there are 62,338 families falling into the $200,000+ income range, which is the most common income bracket and makes up 41.8% of all families. Conversely, the $10,000 to $14,999 income bracket is the least frequent group with only 1,491 families (1.0%) belonging to this category.
| Income Bracket | # Families | % Families |
| Less than $10,000 | 3,132 | 2.1% |
| $10,000 to $14,999 | 1,491 | 1.0% |
| $15,000 to $24,999 | 3,430 | 2.3% |
| $25,000 to $34,999 | 3,728 | 2.5% |
| $35,000 to $49,999 | 6,114 | 4.1% |
| $50,000 to $74,999 | 11,632 | 7.8% |
| $75,000 to $99,999 | 12,080 | 8.1% |
| $100,000 to $149,999 | 23,861 | 16.0% |
| $150,000 to $199,999 | 21,326 | 14.3% |
| $200,000+ | 62,338 | 41.8% |
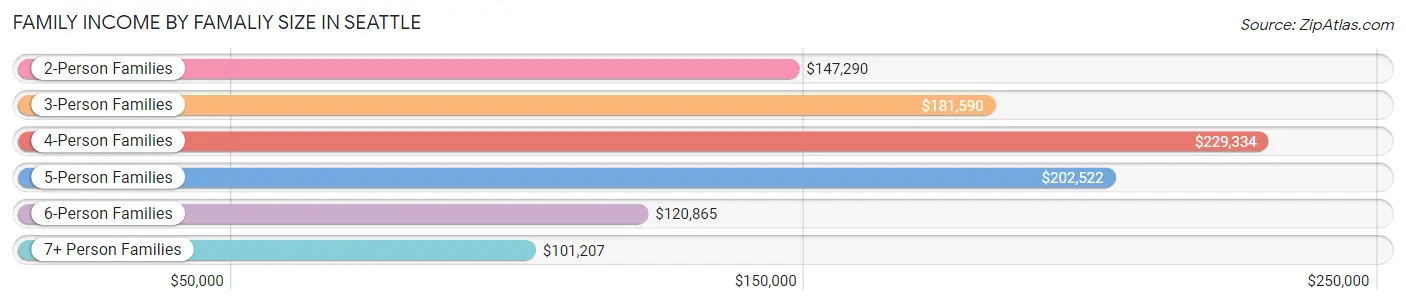
Family Income by Famaliy Size in Seattle
4-person families (25,569 | 17.1%) account for the highest median family income in Seattle with $229,334 per family, while 2-person families (81,563 | 54.7%) have the highest median income of $73,645 per family member.
| Income Bracket | # Families | Median Income |
| 2-Person Families | 81,563 (54.7%) | $147,290 |
| 3-Person Families | 32,492 (21.8%) | $181,590 |
| 4-Person Families | 25,569 (17.1%) | $229,334 |
| 5-Person Families | 6,577 (4.4%) | $202,522 |
| 6-Person Families | 1,885 (1.3%) | $120,865 |
| 7+ Person Families | 1,048 (0.7%) | $101,207 |
| Total | 149,134 (100.0%) | $169,878 |
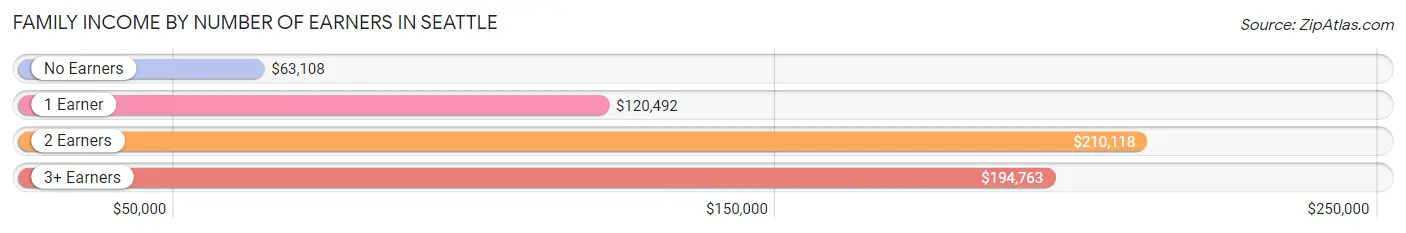
Family Income by Number of Earners in Seattle
The median family income in Seattle is $169,878, with families comprising 2 earners (83,039) having the highest median family income of $210,118, while families with no earners (14,113) have the lowest median family income of $63,108, accounting for 55.7% and 9.5% of families, respectively.
| Number of Earners | # Families | Median Income |
| No Earners | 14,113 (9.5%) | $63,108 |
| 1 Earner | 41,067 (27.5%) | $120,492 |
| 2 Earners | 83,039 (55.7%) | $210,118 |
| 3+ Earners | 10,915 (7.3%) | $194,763 |
| Total | 149,134 (100.0%) | $169,878 |
Household Income in Seattle
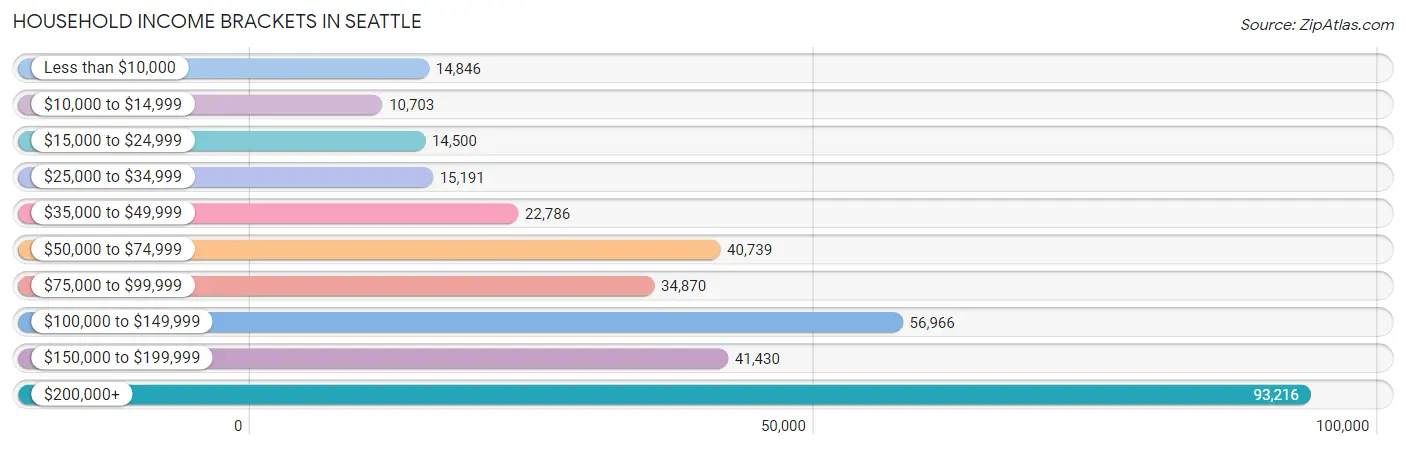
Household Income Brackets in Seattle
With 93,216 households falling in the category, the $200,000+ income range is the most frequent in Seattle, accounting for 27.0% of all households. In contrast, only 10,703 households (3.1%) fall into the $10,000 to $14,999 income bracket, making it the least populous group.
| Income Bracket | # Households | % Households |
| Less than $10,000 | 14,846 | 4.3% |
| $10,000 to $14,999 | 10,703 | 3.1% |
| $15,000 to $24,999 | 14,500 | 4.2% |
| $25,000 to $34,999 | 15,191 | 4.4% |
| $35,000 to $49,999 | 22,786 | 6.6% |
| $50,000 to $74,999 | 40,739 | 11.8% |
| $75,000 to $99,999 | 34,870 | 10.1% |
| $100,000 to $149,999 | 56,966 | 16.5% |
| $150,000 to $199,999 | 41,430 | 12.0% |
| $200,000+ | 93,216 | 27.0% |
Household Income by Householder Age in Seattle
The median household income in Seattle is $116,068, with the highest median household income of $134,974 found in the 25 to 44 years age bracket for the primary householder. A total of 166,949 households (48.4%) fall into this category. Meanwhile, the 15 to 24 years age bracket for the primary householder has the lowest median household income of $50,072, with 21,747 households (6.3%) in this group.
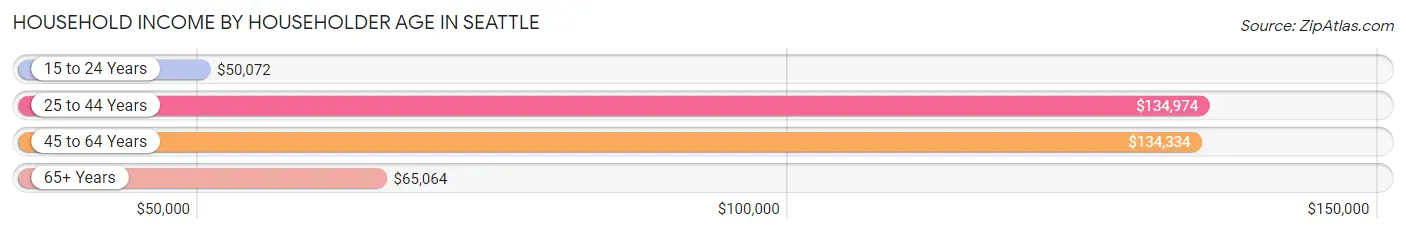
| Income Bracket | # Households | Median Income |
| 15 to 24 Years | 21,747 (6.3%) | $50,072 |
| 25 to 44 Years | 166,949 (48.4%) | $134,974 |
| 45 to 64 Years | 96,968 (28.1%) | $134,334 |
| 65+ Years | 59,582 (17.3%) | $65,064 |
| Total | 345,246 (100.0%) | $116,068 |
Poverty in Seattle
Income Below Poverty by Sex and Age in Seattle
With 9.4% poverty level for males and 10.8% for females among the residents of Seattle, 18 to 24 year old males and 18 to 24 year old females are the most vulnerable to poverty, with 7,859 males (25.6%) and 10,019 females (30.3%) in their respective age groups living below the poverty level.
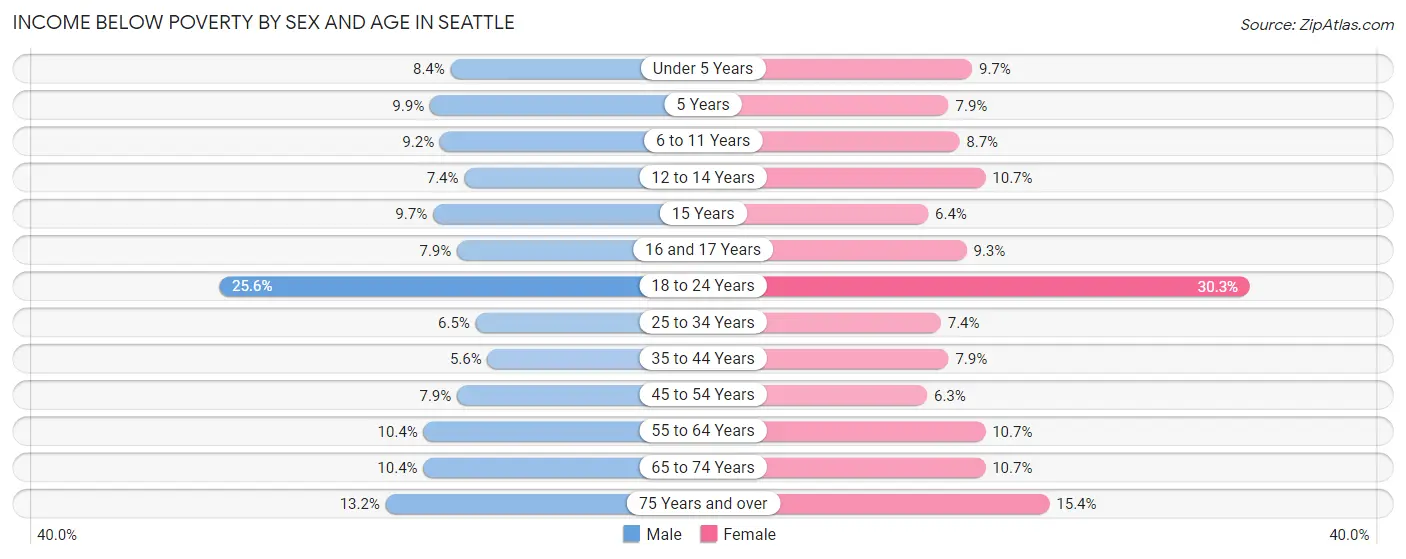
| Age Bracket | Male | Female |
| Under 5 Years | 1,329 (8.4%) | 1,519 (9.7%) |
| 5 Years | 277 (9.9%) | 206 (7.9%) |
| 6 to 11 Years | 1,602 (9.2%) | 1,418 (8.7%) |
| 12 to 14 Years | 578 (7.3%) | 872 (10.7%) |
| 15 Years | 270 (9.7%) | 158 (6.4%) |
| 16 and 17 Years | 362 (7.9%) | 438 (9.3%) |
| 18 to 24 Years | 7,859 (25.6%) | 10,019 (30.3%) |
| 25 to 34 Years | 6,306 (6.5%) | 6,202 (7.3%) |
| 35 to 44 Years | 3,475 (5.6%) | 4,340 (7.9%) |
| 45 to 54 Years | 3,725 (7.9%) | 2,640 (6.3%) |
| 55 to 64 Years | 3,869 (10.4%) | 3,734 (10.6%) |
| 65 to 74 Years | 2,809 (10.4%) | 3,088 (10.6%) |
| 75 Years and over | 1,848 (13.2%) | 3,233 (15.4%) |
| Total | 34,309 (9.4%) | 37,867 (10.8%) |
Income Above Poverty by Sex and Age in Seattle
According to the poverty statistics in Seattle, males aged 35 to 44 years and females aged 45 to 54 years are the age groups that are most secure financially, with 94.4% of males and 93.7% of females in these age groups living above the poverty line.
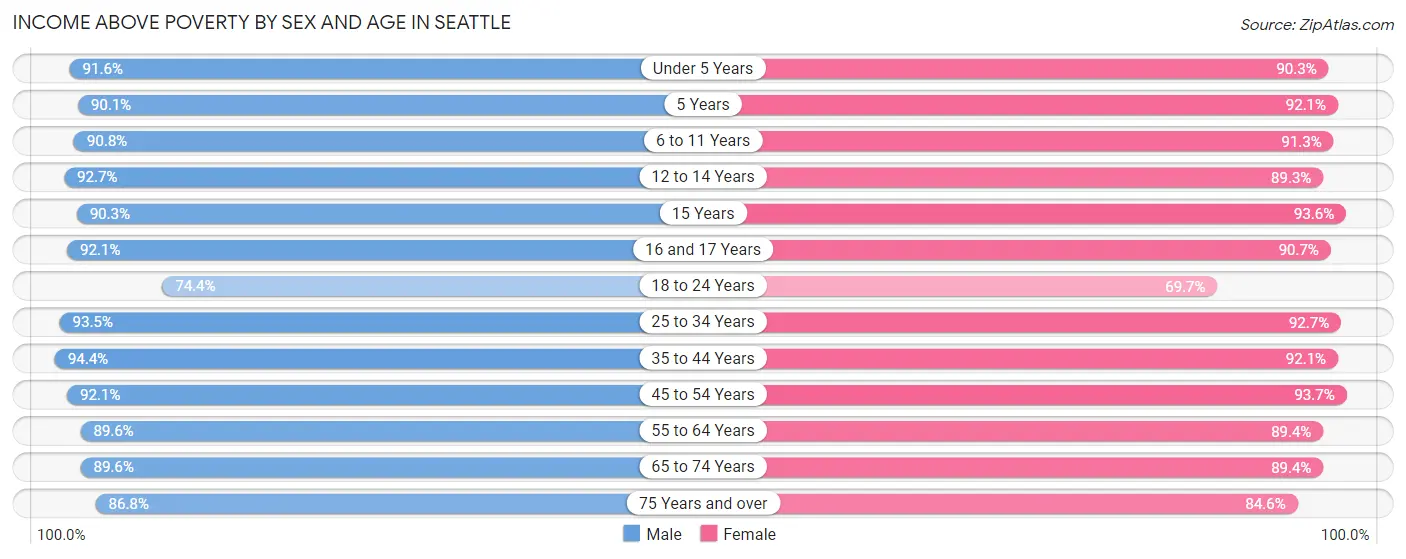
| Age Bracket | Male | Female |
| Under 5 Years | 14,556 (91.6%) | 14,193 (90.3%) |
| 5 Years | 2,521 (90.1%) | 2,392 (92.1%) |
| 6 to 11 Years | 15,885 (90.8%) | 14,831 (91.3%) |
| 12 to 14 Years | 7,285 (92.6%) | 7,311 (89.3%) |
| 15 Years | 2,518 (90.3%) | 2,308 (93.6%) |
| 16 and 17 Years | 4,225 (92.1%) | 4,293 (90.7%) |
| 18 to 24 Years | 22,887 (74.4%) | 23,044 (69.7%) |
| 25 to 34 Years | 90,628 (93.5%) | 78,212 (92.6%) |
| 35 to 44 Years | 58,202 (94.4%) | 50,447 (92.1%) |
| 45 to 54 Years | 43,506 (92.1%) | 39,094 (93.7%) |
| 55 to 64 Years | 33,450 (89.6%) | 31,331 (89.3%) |
| 65 to 74 Years | 24,219 (89.6%) | 25,916 (89.3%) |
| 75 Years and over | 12,158 (86.8%) | 17,752 (84.6%) |
| Total | 332,040 (90.6%) | 311,124 (89.1%) |
Income Below Poverty Among Married-Couple Families in Seattle
The poverty statistics for married-couple families in Seattle show that 2.4% or 2,928 of the total 120,103 families live below the poverty line. Families with 5 or more children have the highest poverty rate of 21.7%, comprising of 87 families. On the other hand, families with 1 or 2 children have the lowest poverty rate of 1.6%, which includes 673 families.
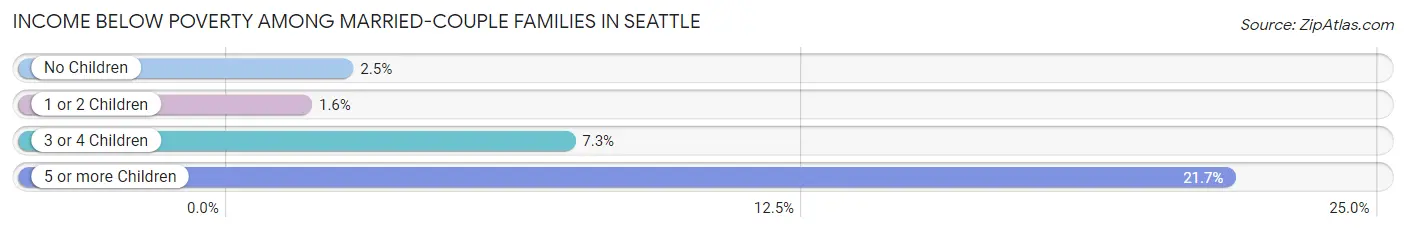
| Children | Above Poverty | Below Poverty |
| No Children | 71,702 (97.5%) | 1,844 (2.5%) |
| 1 or 2 Children | 41,071 (98.4%) | 673 (1.6%) |
| 3 or 4 Children | 4,088 (92.7%) | 324 (7.3%) |
| 5 or more Children | 314 (78.3%) | 87 (21.7%) |
| Total | 117,175 (97.6%) | 2,928 (2.4%) |
Income Below Poverty Among Single-Parent Households in Seattle
According to the poverty data in Seattle, 9.0% or 837 single-father households and 18.4% or 3,647 single-mother households are living below the poverty line. Among single-father households, those with 3 or 4 children have the highest poverty rate, with 42 households (20.8%) experiencing poverty. Likewise, among single-mother households, those with 5 or more children have the highest poverty rate, with 140 households (81.9%) falling below the poverty line.
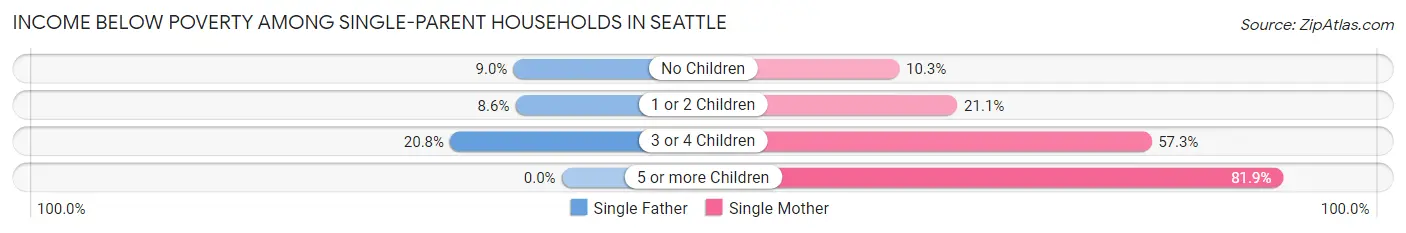
| Children | Single Father | Single Mother |
| No Children | 427 (9.0%) | 893 (10.3%) |
| 1 or 2 Children | 368 (8.6%) | 2,146 (21.1%) |
| 3 or 4 Children | 42 (20.8%) | 468 (57.3%) |
| 5 or more Children | 0 (0.0%) | 140 (81.9%) |
| Total | 837 (9.0%) | 3,647 (18.4%) |
Income Below Poverty Among Married-Couple vs Single-Parent Households in Seattle
The poverty data for Seattle shows that 2,928 of the married-couple family households (2.4%) and 4,484 of the single-parent households (15.4%) are living below the poverty level. Within the married-couple family households, those with 5 or more children have the highest poverty rate, with 87 households (21.7%) falling below the poverty line. Among the single-parent households, those with 5 or more children have the highest poverty rate, with 140 household (72.5%) living below poverty.
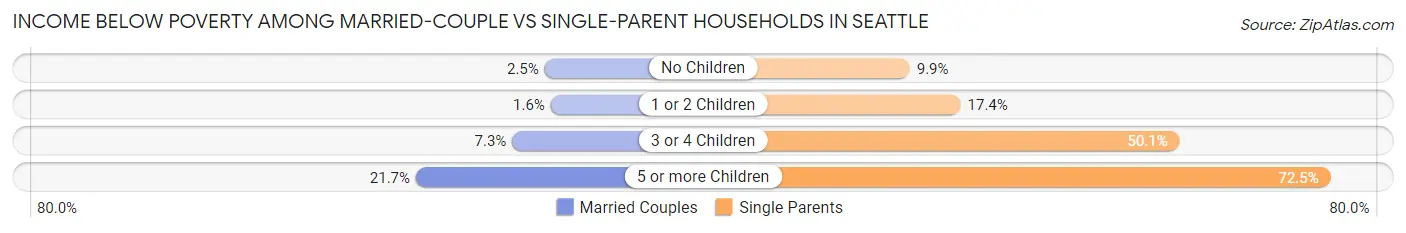
| Children | Married-Couple Families | Single-Parent Households |
| No Children | 1,844 (2.5%) | 1,320 (9.9%) |
| 1 or 2 Children | 673 (1.6%) | 2,514 (17.4%) |
| 3 or 4 Children | 324 (7.3%) | 510 (50.0%) |
| 5 or more Children | 87 (21.7%) | 140 (72.5%) |
| Total | 2,928 (2.4%) | 4,484 (15.4%) |
Race in Seattle
The most populous races in Seattle are White / Caucasian (467,390 | 63.6%), Asian (123,703 | 16.8%), and Two or more Races (69,030 | 9.4%).
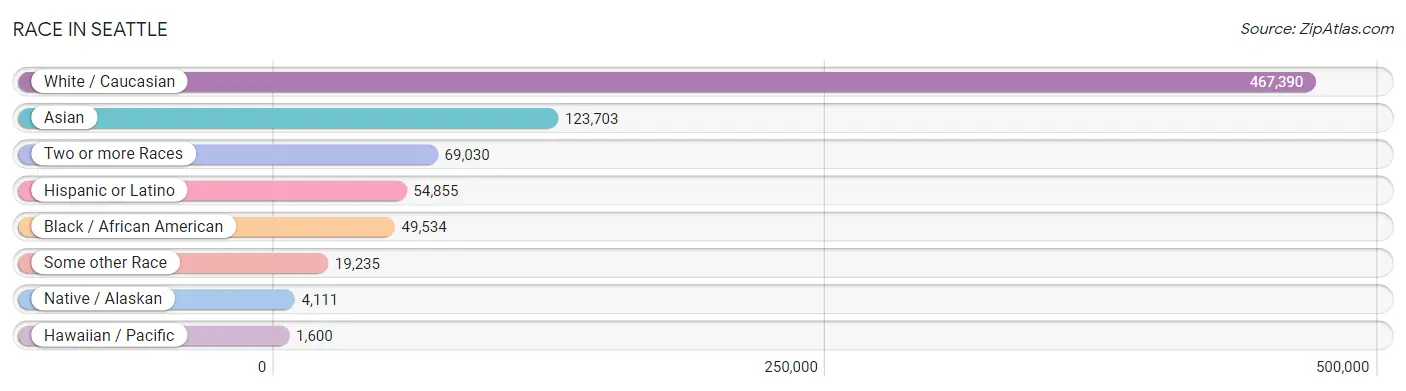
| Race | # Population | % Population |
| Asian | 123,703 | 16.8% |
| Black / African American | 49,534 | 6.7% |
| Hawaiian / Pacific | 1,600 | 0.2% |
| Hispanic or Latino | 54,855 | 7.5% |
| Native / Alaskan | 4,111 | 0.6% |
| White / Caucasian | 467,390 | 63.6% |
| Two or more Races | 69,030 | 9.4% |
| Some other Race | 19,235 | 2.6% |
| Total | 734,603 | 100.0% |
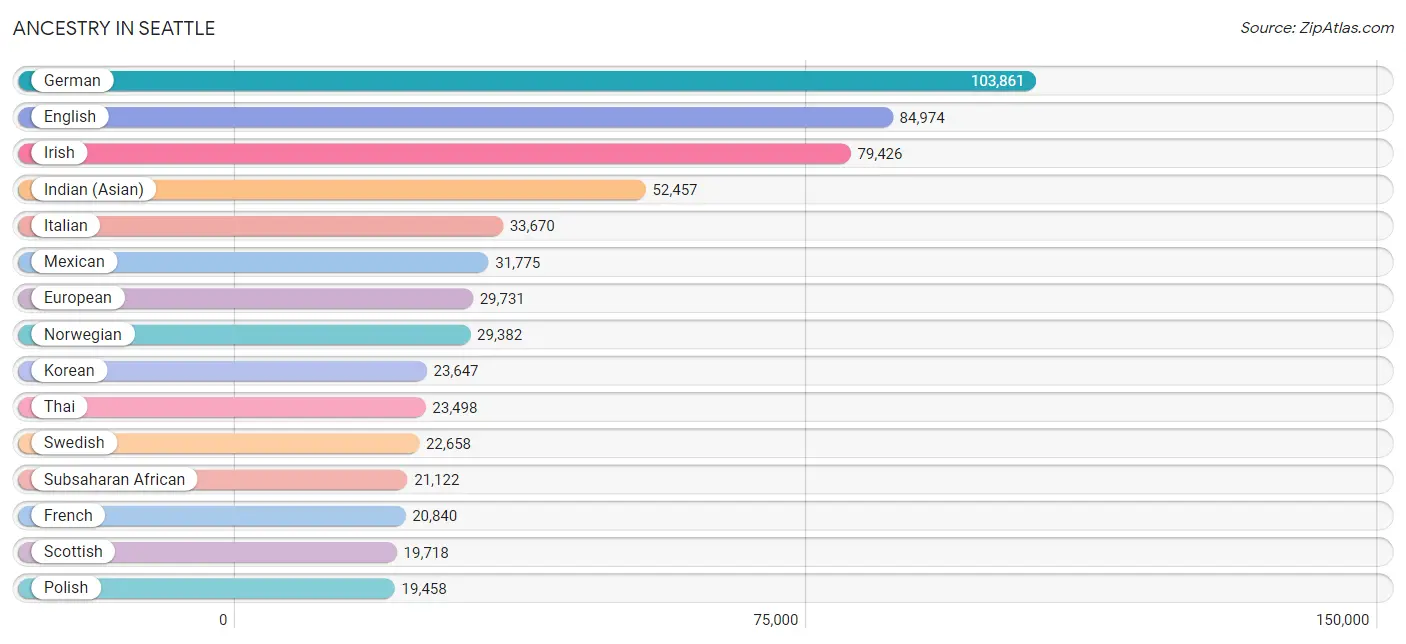
Ancestry in Seattle
The most populous ancestries reported in Seattle are German (103,861 | 14.1%), English (84,974 | 11.6%), Irish (79,426 | 10.8%), Indian (Asian) (52,457 | 7.1%), and Italian (33,670 | 4.6%), together accounting for 48.2% of all Seattle residents.
| Ancestry | # Population | % Population |
| Afghan | 262 | 0.0% |
| African | 4,306 | 0.6% |
| Alaska Native | 246 | 0.0% |
| Alaskan Athabascan | 132 | 0.0% |
| Albanian | 178 | 0.0% |
| Aleut | 78 | 0.0% |
| American | 16,663 | 2.3% |
| Apache | 403 | 0.1% |
| Arab | 5,746 | 0.8% |
| Argentinean | 1,001 | 0.1% |
| Armenian | 1,066 | 0.2% |
| Assyrian / Chaldean / Syriac | 37 | 0.0% |
| Australian | 504 | 0.1% |
| Austrian | 2,236 | 0.3% |
| Bahamian | 79 | 0.0% |
| Bangladeshi | 279 | 0.0% |
| Barbadian | 19 | 0.0% |
| Basque | 302 | 0.0% |
| Belgian | 861 | 0.1% |
| Belizean | 47 | 0.0% |
| Bermudan | 19 | 0.0% |
| Bhutanese | 16,563 | 2.2% |
| Blackfeet | 990 | 0.1% |
| Bolivian | 287 | 0.0% |
| Brazilian | 1,054 | 0.1% |
| British | 9,821 | 1.3% |
| British West Indian | 65 | 0.0% |
| Bulgarian | 962 | 0.1% |
| Burmese | 14,448 | 2.0% |
| Cajun | 283 | 0.0% |
| Cambodian | 558 | 0.1% |
| Canadian | 3,394 | 0.5% |
| Cape Verdean | 23 | 0.0% |
| Carpatho Rusyn | 32 | 0.0% |
| Celtic | 202 | 0.0% |
| Central American | 5,422 | 0.7% |
| Central American Indian | 909 | 0.1% |
| Cherokee | 2,319 | 0.3% |
| Cheyenne | 54 | 0.0% |
| Chickasaw | 162 | 0.0% |
| Chilean | 587 | 0.1% |
| Chinese | 190 | 0.0% |
| Chippewa | 527 | 0.1% |
| Choctaw | 882 | 0.1% |
| Colombian | 1,782 | 0.2% |
| Colville | 129 | 0.0% |
| Comanche | 23 | 0.0% |
| Costa Rican | 298 | 0.0% |
| Cree | 166 | 0.0% |
| Creek | 489 | 0.1% |
| Croatian | 2,384 | 0.3% |
| Crow | 86 | 0.0% |
| Cuban | 1,360 | 0.2% |
| Cypriot | 40 | 0.0% |
| Czech | 4,181 | 0.6% |
| Czechoslovakian | 767 | 0.1% |
| Danish | 6,446 | 0.9% |
| Delaware | 22 | 0.0% |
| Dominican | 413 | 0.1% |
| Dutch | 9,644 | 1.3% |
| Dutch West Indian | 16 | 0.0% |
| Eastern European | 4,662 | 0.6% |
| Ecuadorian | 496 | 0.1% |
| Egyptian | 758 | 0.1% |
| English | 84,974 | 11.6% |
| Estonian | 221 | 0.0% |
| Ethiopian | 8,567 | 1.2% |
| European | 29,731 | 4.1% |
| Fijian | 10 | 0.0% |
| Filipino | 4,074 | 0.5% |
| Finnish | 3,832 | 0.5% |
| French | 20,840 | 2.8% |
| French American Indian | 352 | 0.1% |
| French Canadian | 4,803 | 0.6% |
| German | 103,861 | 14.1% |
| German Russian | 113 | 0.0% |
| Ghanaian | 249 | 0.0% |
| Greek | 4,562 | 0.6% |
| Guamanian / Chamorro | 963 | 0.1% |
| Guatemalan | 1,442 | 0.2% |
| Guyanese | 142 | 0.0% |
| Haitian | 406 | 0.1% |
| Honduran | 791 | 0.1% |
| Hopi | 13 | 0.0% |
| Hungarian | 3,143 | 0.4% |
| Icelander | 778 | 0.1% |
| Indian (Asian) | 52,457 | 7.1% |
| Indonesian | 106 | 0.0% |
| Inupiat | 128 | 0.0% |
| Iranian | 4,011 | 0.5% |
| Iraqi | 516 | 0.1% |
| Irish | 79,426 | 10.8% |
| Iroquois | 87 | 0.0% |
| Israeli | 436 | 0.1% |
| Italian | 33,670 | 4.6% |
| Jamaican | 756 | 0.1% |
| Japanese | 1,985 | 0.3% |
| Jordanian | 255 | 0.0% |
| Kenyan | 805 | 0.1% |
| Korean | 23,647 | 3.2% |
| Laotian | 881 | 0.1% |
| Latvian | 814 | 0.1% |
| Lebanese | 1,358 | 0.2% |
| Liberian | 20 | 0.0% |
| Lithuanian | 2,536 | 0.4% |
| Lumbee | 13 | 0.0% |
| Luxembourger | 69 | 0.0% |
| Macedonian | 260 | 0.0% |
| Malaysian | 1,390 | 0.2% |
| Maltese | 19 | 0.0% |
| Marshallese | 35 | 0.0% |
| Mexican | 31,775 | 4.3% |
| Mexican American Indian | 1,491 | 0.2% |
| Mongolian | 311 | 0.0% |
| Moroccan | 239 | 0.0% |
| Native Hawaiian | 2,055 | 0.3% |
| Navajo | 227 | 0.0% |
| Nepalese | 92 | 0.0% |
| New Zealander | 416 | 0.1% |
| Nicaraguan | 487 | 0.1% |
| Nigerian | 692 | 0.1% |
| Northern European | 5,590 | 0.8% |
| Norwegian | 29,382 | 4.0% |
| Okinawan | 197 | 0.0% |
| Osage | 81 | 0.0% |
| Ottawa | 15 | 0.0% |
| Pakistani | 1,784 | 0.2% |
| Palestinian | 431 | 0.1% |
| Panamanian | 262 | 0.0% |
| Paraguayan | 103 | 0.0% |
| Pennsylvania German | 220 | 0.0% |
| Peruvian | 1,548 | 0.2% |
| Polish | 19,458 | 2.6% |
| Portuguese | 2,640 | 0.4% |
| Potawatomi | 125 | 0.0% |
| Pueblo | 215 | 0.0% |
| Puerto Rican | 2,820 | 0.4% |
| Puget Sound Salish | 504 | 0.1% |
| Romanian | 1,893 | 0.3% |
| Russian | 11,435 | 1.6% |
| Salvadoran | 2,033 | 0.3% |
| Samoan | 1,164 | 0.2% |
| Scandinavian | 5,844 | 0.8% |
| Scotch-Irish | 8,043 | 1.1% |
| Scottish | 19,718 | 2.7% |
| Seminole | 28 | 0.0% |
| Senegalese | 30 | 0.0% |
| Serbian | 726 | 0.1% |
| Shoshone | 135 | 0.0% |
| Sioux | 665 | 0.1% |
| Slavic | 475 | 0.1% |
| Slovak | 1,236 | 0.2% |
| Slovene | 686 | 0.1% |
| Somali | 4,803 | 0.6% |
| South African | 511 | 0.1% |
| South American | 6,432 | 0.9% |
| South American Indian | 240 | 0.0% |
| Spaniard | 2,753 | 0.4% |
| Spanish | 1,885 | 0.3% |
| Spanish American | 45 | 0.0% |
| Spanish American Indian | 14 | 0.0% |
| Sri Lankan | 16,148 | 2.2% |
| Subsaharan African | 21,122 | 2.9% |
| Sudanese | 172 | 0.0% |
| Swedish | 22,658 | 3.1% |
| Swiss | 4,242 | 0.6% |
| Syrian | 396 | 0.1% |
| Taiwanese | 14 | 0.0% |
| Thai | 23,498 | 3.2% |
| Tlingit-Haida | 697 | 0.1% |
| Tongan | 44 | 0.0% |
| Trinidadian and Tobagonian | 430 | 0.1% |
| Tsimshian | 107 | 0.0% |
| Turkish | 1,029 | 0.1% |
| U.S. Virgin Islander | 39 | 0.0% |
| Ugandan | 59 | 0.0% |
| Ukrainian | 4,459 | 0.6% |
| Uruguayan | 20 | 0.0% |
| Ute | 63 | 0.0% |
| Venezuelan | 594 | 0.1% |
| Vietnamese | 534 | 0.1% |
| Welsh | 6,993 | 0.9% |
| West Indian | 600 | 0.1% |
| Yakama | 302 | 0.0% |
| Yaqui | 127 | 0.0% |
| Yugoslavian | 404 | 0.1% |
| Yup'ik | 60 | 0.0% |
| Zimbabwean | 13 | 0.0% | View All 188 Rows |
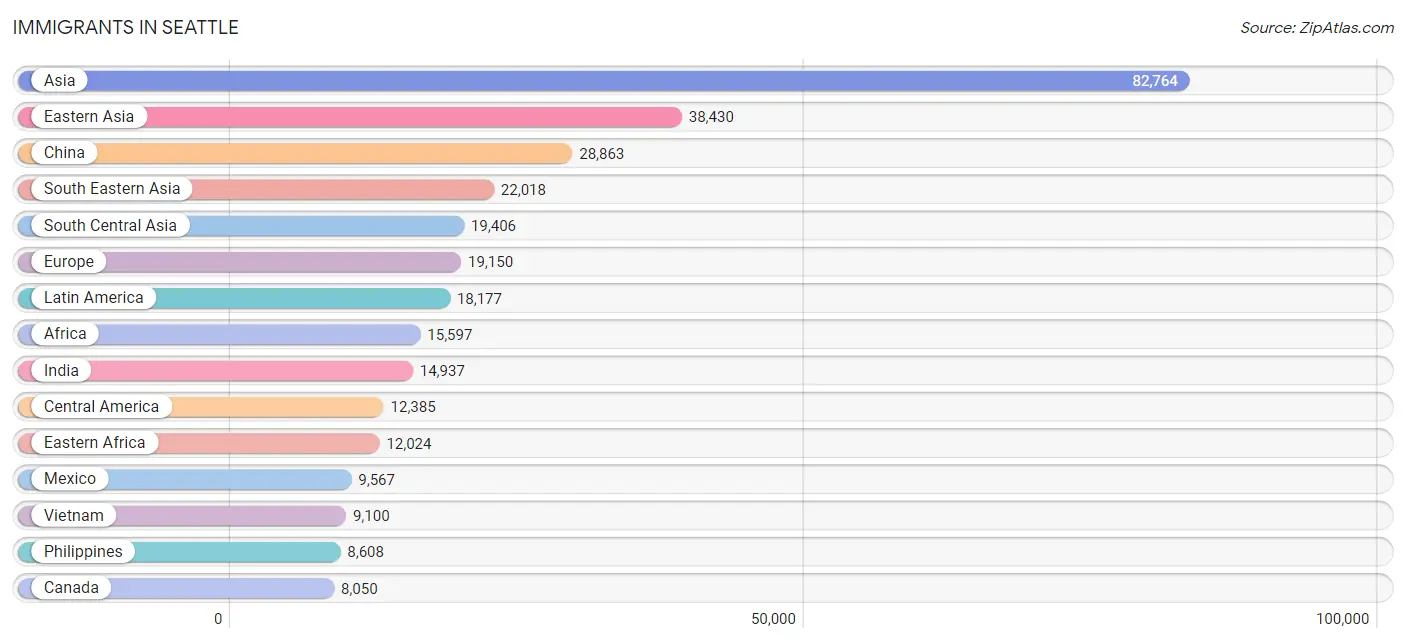
Immigrants in Seattle
The most numerous immigrant groups reported in Seattle came from Asia (82,764 | 11.3%), Eastern Asia (38,430 | 5.2%), China (28,863 | 3.9%), South Eastern Asia (22,018 | 3.0%), and South Central Asia (19,406 | 2.6%), together accounting for 26.1% of all Seattle residents.
| Immigration Origin | # Population | % Population |
| Afghanistan | 252 | 0.0% |
| Africa | 15,597 | 2.1% |
| Albania | 35 | 0.0% |
| Argentina | 551 | 0.1% |
| Armenia | 214 | 0.0% |
| Asia | 82,764 | 11.3% |
| Australia | 1,036 | 0.1% |
| Austria | 120 | 0.0% |
| Azores | 22 | 0.0% |
| Bangladesh | 395 | 0.1% |
| Belarus | 241 | 0.0% |
| Belgium | 105 | 0.0% |
| Belize | 96 | 0.0% |
| Bolivia | 138 | 0.0% |
| Bosnia and Herzegovina | 92 | 0.0% |
| Brazil | 1,625 | 0.2% |
| Bulgaria | 520 | 0.1% |
| Cambodia | 874 | 0.1% |
| Cameroon | 43 | 0.0% |
| Canada | 8,050 | 1.1% |
| Caribbean | 1,190 | 0.2% |
| Central America | 12,385 | 1.7% |
| Chile | 240 | 0.0% |
| China | 28,863 | 3.9% |
| Colombia | 756 | 0.1% |
| Congo | 46 | 0.0% |
| Costa Rica | 194 | 0.0% |
| Croatia | 159 | 0.0% |
| Cuba | 301 | 0.0% |
| Czechoslovakia | 442 | 0.1% |
| Denmark | 359 | 0.1% |
| Dominican Republic | 53 | 0.0% |
| Eastern Africa | 12,024 | 1.6% |
| Eastern Asia | 38,430 | 5.2% |
| Eastern Europe | 7,833 | 1.1% |
| Ecuador | 86 | 0.0% |
| Egypt | 384 | 0.1% |
| El Salvador | 925 | 0.1% |
| England | 1,114 | 0.2% |
| Eritrea | 2,065 | 0.3% |
| Ethiopia | 5,335 | 0.7% |
| Europe | 19,150 | 2.6% |
| Fiji | 199 | 0.0% |
| France | 1,081 | 0.2% |
| Germany | 2,405 | 0.3% |
| Ghana | 141 | 0.0% |
| Greece | 202 | 0.0% |
| Guatemala | 879 | 0.1% |
| Guyana | 43 | 0.0% |
| Haiti | 144 | 0.0% |
| Honduras | 387 | 0.1% |
| Hong Kong | 1,822 | 0.3% |
| Hungary | 281 | 0.0% |
| India | 14,937 | 2.0% |
| Indonesia | 479 | 0.1% |
| Iran | 2,043 | 0.3% |
| Iraq | 368 | 0.1% |
| Ireland | 357 | 0.1% |
| Israel | 544 | 0.1% |
| Italy | 627 | 0.1% |
| Jamaica | 127 | 0.0% |
| Japan | 3,164 | 0.4% |
| Jordan | 223 | 0.0% |
| Kazakhstan | 112 | 0.0% |
| Kenya | 1,308 | 0.2% |
| Korea | 5,960 | 0.8% |
| Kuwait | 35 | 0.0% |
| Laos | 619 | 0.1% |
| Latin America | 18,177 | 2.5% |
| Latvia | 101 | 0.0% |
| Lebanon | 288 | 0.0% |
| Liberia | 41 | 0.0% |
| Lithuania | 262 | 0.0% |
| Malaysia | 636 | 0.1% |
| Mexico | 9,567 | 1.3% |
| Micronesia | 65 | 0.0% |
| Middle Africa | 375 | 0.1% |
| Moldova | 138 | 0.0% |
| Morocco | 148 | 0.0% |
| Nepal | 393 | 0.1% |
| Netherlands | 455 | 0.1% |
| Nicaragua | 154 | 0.0% |
| Nigeria | 359 | 0.1% |
| North Macedonia | 63 | 0.0% |
| Northern Africa | 942 | 0.1% |
| Northern Europe | 5,376 | 0.7% |
| Norway | 270 | 0.0% |
| Oceania | 2,006 | 0.3% |
| Pakistan | 647 | 0.1% |
| Panama | 170 | 0.0% |
| Peru | 644 | 0.1% |
| Philippines | 8,608 | 1.2% |
| Poland | 865 | 0.1% |
| Portugal | 169 | 0.0% |
| Romania | 738 | 0.1% |
| Russia | 1,908 | 0.3% |
| Saudi Arabia | 296 | 0.0% |
| Scotland | 291 | 0.0% |
| Senegal | 124 | 0.0% |
| Serbia | 28 | 0.0% |
| Sierra Leone | 64 | 0.0% |
| Singapore | 509 | 0.1% |
| Somalia | 2,628 | 0.4% |
| South Africa | 710 | 0.1% |
| South America | 4,602 | 0.6% |
| South Central Asia | 19,406 | 2.6% |
| South Eastern Asia | 22,018 | 3.0% |
| Southern Europe | 1,372 | 0.2% |
| Spain | 374 | 0.1% |
| Sri Lanka | 152 | 0.0% |
| Sudan | 99 | 0.0% |
| Sweden | 469 | 0.1% |
| Switzerland | 367 | 0.1% |
| Syria | 100 | 0.0% |
| Taiwan | 4,320 | 0.6% |
| Thailand | 1,143 | 0.2% |
| Trinidad and Tobago | 456 | 0.1% |
| Turkey | 456 | 0.1% |
| Uganda | 170 | 0.0% |
| Ukraine | 1,665 | 0.2% |
| Uruguay | 9 | 0.0% |
| Uzbekistan | 357 | 0.1% |
| Venezuela | 334 | 0.1% |
| Vietnam | 9,100 | 1.2% |
| Western Africa | 1,191 | 0.2% |
| Western Asia | 2,872 | 0.4% |
| Western Europe | 4,550 | 0.6% |
| Yemen | 170 | 0.0% |
| Zaire | 275 | 0.0% |
| Zimbabwe | 79 | 0.0% | View All 130 Rows |
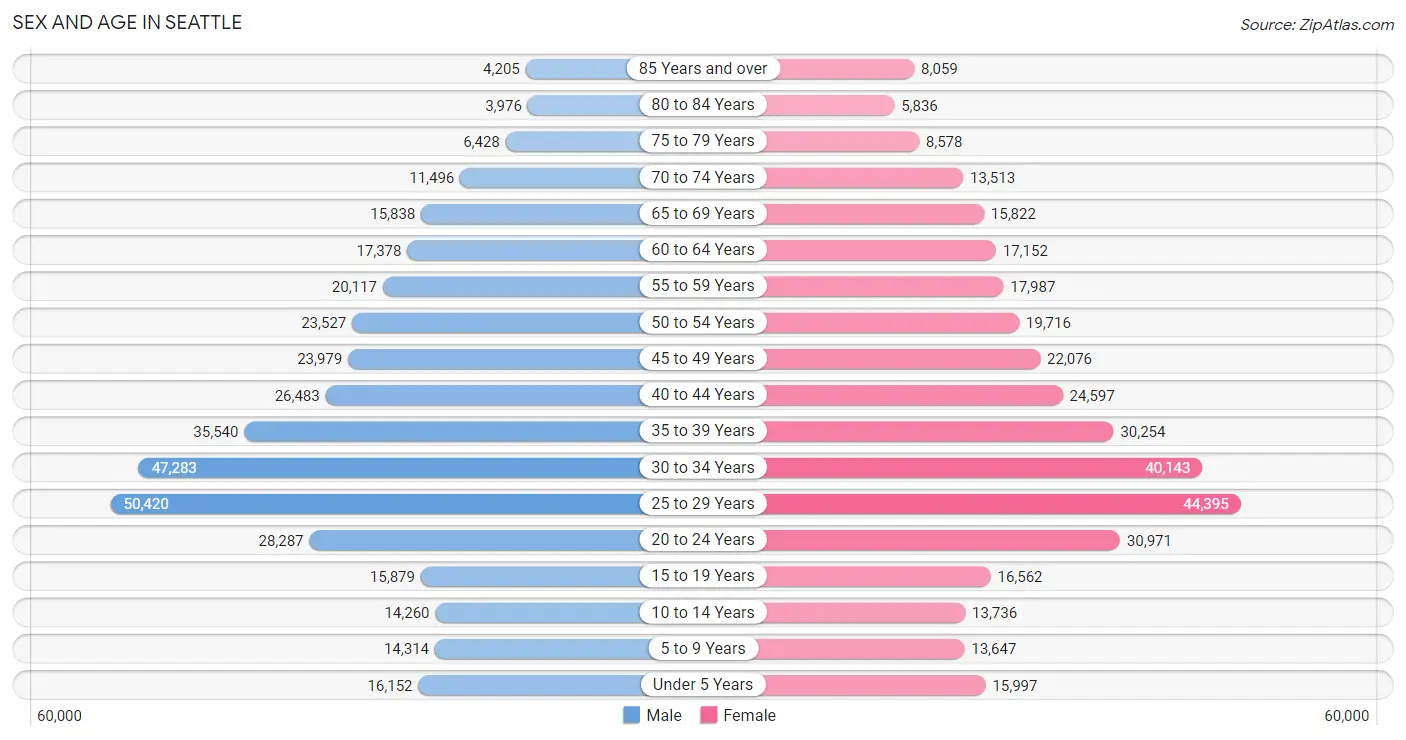
Sex and Age in Seattle
Sex and Age in Seattle
The most populous age groups in Seattle are 25 to 29 Years (50,420 | 13.4%) for men and 25 to 29 Years (44,395 | 12.4%) for women.
| Age Bracket | Male | Female |
| Under 5 Years | 16,152 (4.3%) | 15,997 (4.5%) |
| 5 to 9 Years | 14,314 (3.8%) | 13,647 (3.8%) |
| 10 to 14 Years | 14,260 (3.8%) | 13,736 (3.8%) |
| 15 to 19 Years | 15,879 (4.2%) | 16,562 (4.6%) |
| 20 to 24 Years | 28,287 (7.5%) | 30,971 (8.6%) |
| 25 to 29 Years | 50,420 (13.4%) | 44,395 (12.4%) |
| 30 to 34 Years | 47,283 (12.6%) | 40,143 (11.2%) |
| 35 to 39 Years | 35,540 (9.5%) | 30,254 (8.4%) |
| 40 to 44 Years | 26,483 (7.0%) | 24,597 (6.9%) |
| 45 to 49 Years | 23,979 (6.4%) | 22,076 (6.1%) |
| 50 to 54 Years | 23,527 (6.3%) | 19,716 (5.5%) |
| 55 to 59 Years | 20,117 (5.4%) | 17,987 (5.0%) |
| 60 to 64 Years | 17,378 (4.6%) | 17,152 (4.8%) |
| 65 to 69 Years | 15,838 (4.2%) | 15,822 (4.4%) |
| 70 to 74 Years | 11,496 (3.1%) | 13,513 (3.8%) |
| 75 to 79 Years | 6,428 (1.7%) | 8,578 (2.4%) |
| 80 to 84 Years | 3,976 (1.1%) | 5,836 (1.6%) |
| 85 Years and over | 4,205 (1.1%) | 8,059 (2.2%) |
| Total | 375,562 (100.0%) | 359,041 (100.0%) |
Families and Households in Seattle
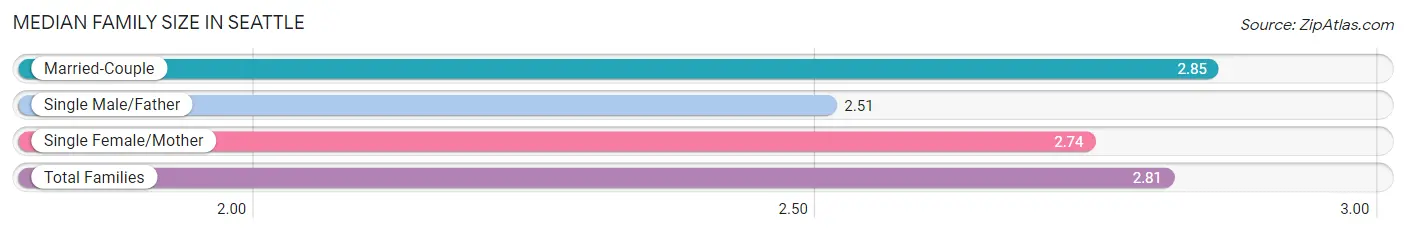
Median Family Size in Seattle
The median family size in Seattle is 2.81 persons per family, with married-couple families (120,103 | 80.5%) accounting for the largest median family size of 2.85 persons per family. On the other hand, single male/father families (9,247 | 6.2%) represent the smallest median family size with 2.51 persons per family.
| Family Type | # Families | Family Size |
| Married-Couple | 120,103 (80.5%) | 2.85 |
| Single Male/Father | 9,247 (6.2%) | 2.51 |
| Single Female/Mother | 19,784 (13.3%) | 2.74 |
| Total Families | 149,134 (100.0%) | 2.81 |
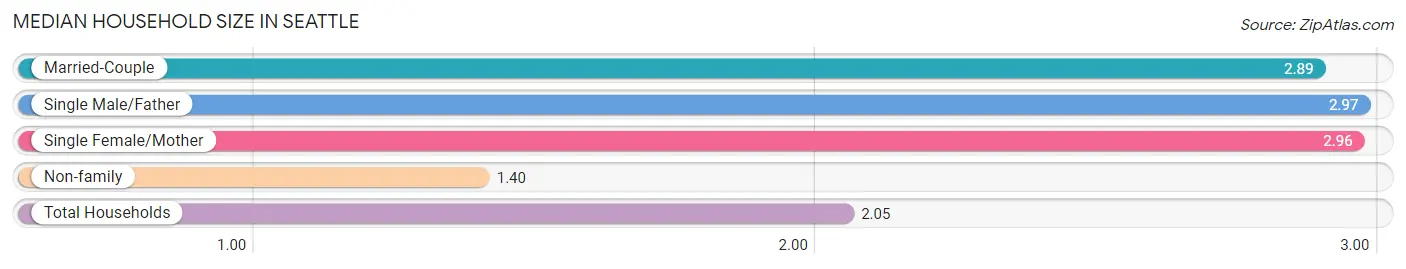
Median Household Size in Seattle
The median household size in Seattle is 2.05 persons per household, with single male/father households (9,247 | 2.7%) accounting for the largest median household size of 2.97 persons per household. non-family households (196,112 | 56.8%) represent the smallest median household size with 1.40 persons per household.
| Household Type | # Households | Household Size |
| Married-Couple | 120,103 (34.8%) | 2.89 |
| Single Male/Father | 9,247 (2.7%) | 2.97 |
| Single Female/Mother | 19,784 (5.7%) | 2.96 |
| Non-family | 196,112 (56.8%) | 1.40 |
| Total Households | 345,246 (100.0%) | 2.05 |
Household Size by Marriage Status in Seattle
Out of a total of 345,246 households in Seattle, 149,134 (43.2%) are family households, while 196,112 (56.8%) are nonfamily households. The most numerous type of family households are 2-person households, comprising 76,016, and the most common type of nonfamily households are 1-person households, comprising 140,603.
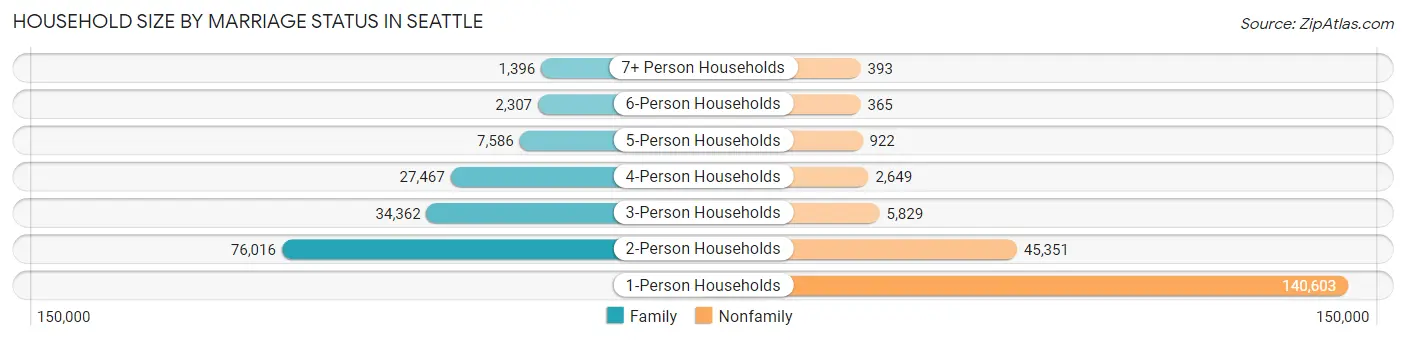
| Household Size | Family Households | Nonfamily Households |
| 1-Person Households | - | 140,603 (40.7%) |
| 2-Person Households | 76,016 (22.0%) | 45,351 (13.1%) |
| 3-Person Households | 34,362 (10.0%) | 5,829 (1.7%) |
| 4-Person Households | 27,467 (8.0%) | 2,649 (0.8%) |
| 5-Person Households | 7,586 (2.2%) | 922 (0.3%) |
| 6-Person Households | 2,307 (0.7%) | 365 (0.1%) |
| 7+ Person Households | 1,396 (0.4%) | 393 (0.1%) |
| Total | 149,134 (43.2%) | 196,112 (56.8%) |
Female Fertility in Seattle
Fertility by Age in Seattle
Average fertility rate in Seattle is 32.0 births per 1,000 women. Women in the age bracket of 35 to 50 years have the highest fertility rate with 40.0 births per 1,000 women. Women in the age bracket of 20 to 34 years acount for 51.7% of all women with births.
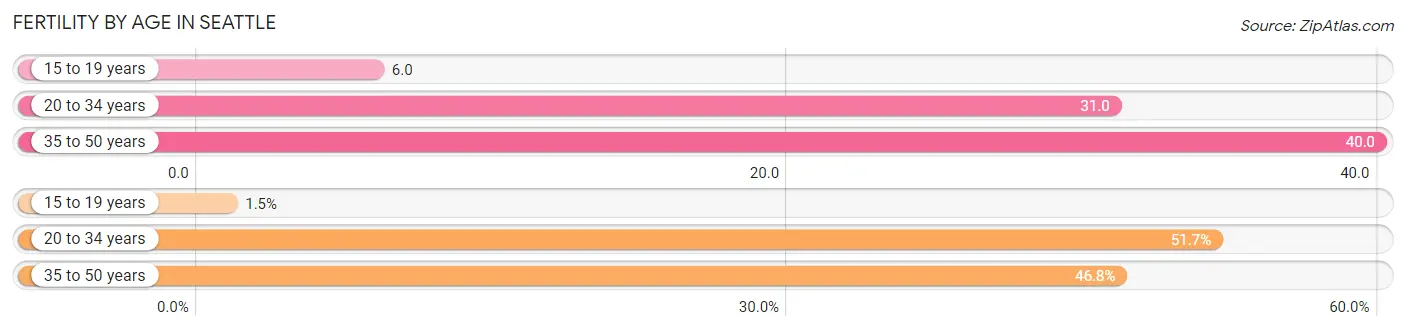
| Age Bracket | Women with Births | Births / 1,000 Women |
| 15 to 19 years | 106 (1.5%) | 6.0 |
| 20 to 34 years | 3,554 (51.7%) | 31.0 |
| 35 to 50 years | 3,219 (46.8%) | 40.0 |
| Total | 6,879 (100.0%) | 32.0 |
Fertility by Age by Marriage Status in Seattle
84.3% of women with births (6,879) in Seattle are married. The highest percentage of unmarried women with births falls into 15 to 19 years age bracket with 89.6% of them unmarried at the time of birth, while the lowest percentage of unmarried women with births belong to 35 to 50 years age bracket with 10.7% of them unmarried.
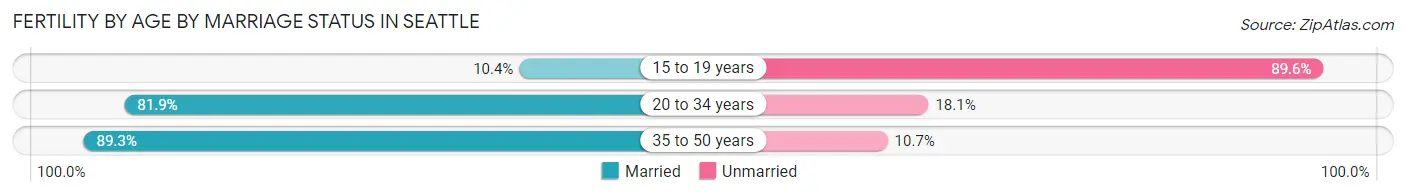
| Age Bracket | Married | Unmarried |
| 15 to 19 years | 11 (10.4%) | 95 (89.6%) |
| 20 to 34 years | 2,911 (81.9%) | 643 (18.1%) |
| 35 to 50 years | 2,875 (89.3%) | 344 (10.7%) |
| Total | 5,799 (84.3%) | 1,080 (15.7%) |
Fertility by Education in Seattle
Average fertility rate in Seattle is 32.0 births per 1,000 women. Women with the education attainment of graduate degree have the highest fertility rate of 46.0 births per 1,000 women, while women with the education attainment of college or associate's degree have the lowest fertility at 23.0 births per 1,000 women. Women with the education attainment of graduate degree represent 39.3% of all women with births.
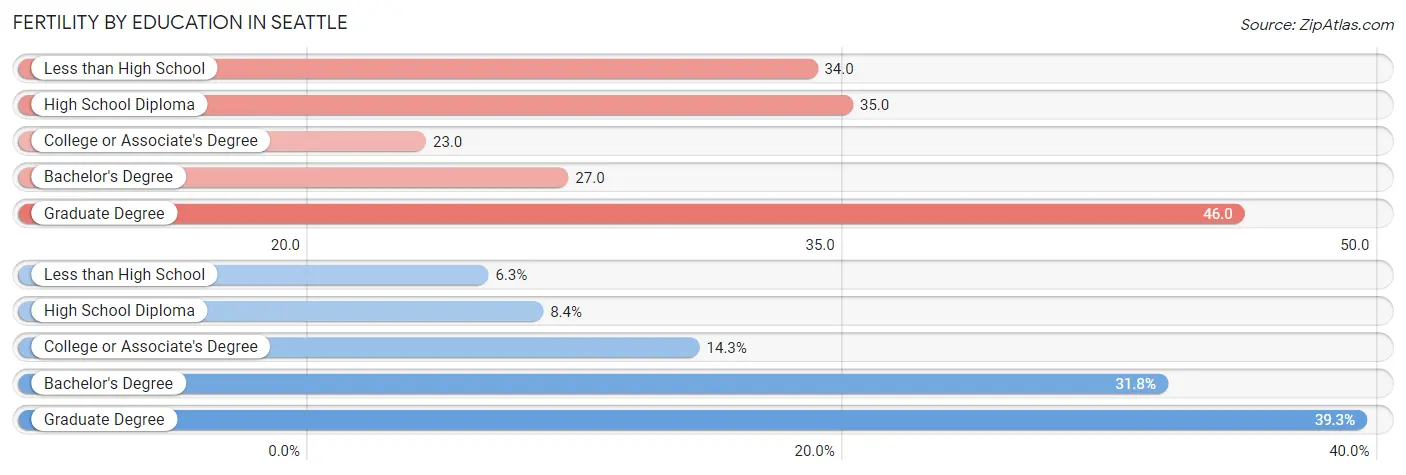
| Educational Attainment | Women with Births | Births / 1,000 Women |
| Less than High School | 436 (6.3%) | 34.0 |
| High School Diploma | 577 (8.4%) | 35.0 |
| College or Associate's Degree | 980 (14.2%) | 23.0 |
| Bachelor's Degree | 2,186 (31.8%) | 27.0 |
| Graduate Degree | 2,700 (39.3%) | 46.0 |
| Total | 6,879 (100.0%) | 32.0 |
Fertility by Education by Marriage Status in Seattle
15.7% of women with births in Seattle are unmarried. Women with the educational attainment of bachelor's degree are most likely to be married with 96.3% of them married at childbirth, while women with the educational attainment of high school diploma are least likely to be married with 51.1% of them unmarried at childbirth.
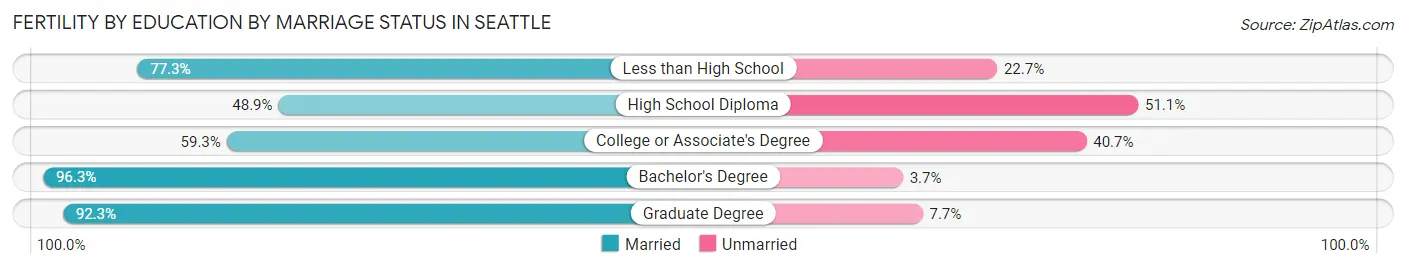
| Educational Attainment | Married | Unmarried |
| Less than High School | 337 (77.3%) | 99 (22.7%) |
| High School Diploma | 282 (48.9%) | 295 (51.1%) |
| College or Associate's Degree | 581 (59.3%) | 399 (40.7%) |
| Bachelor's Degree | 2,105 (96.3%) | 81 (3.7%) |
| Graduate Degree | 2,492 (92.3%) | 208 (7.7%) |
| Total | 5,799 (84.3%) | 1,080 (15.7%) |
Employment Characteristics in Seattle
Employment by Class of Employer in Seattle
Among the 444,319 employed individuals in Seattle, private company employees (296,112 | 66.6%), not-for-profit organizations (50,036 | 11.3%), and state government employees (26,645 | 6.0%) make up the most common classes of employment.
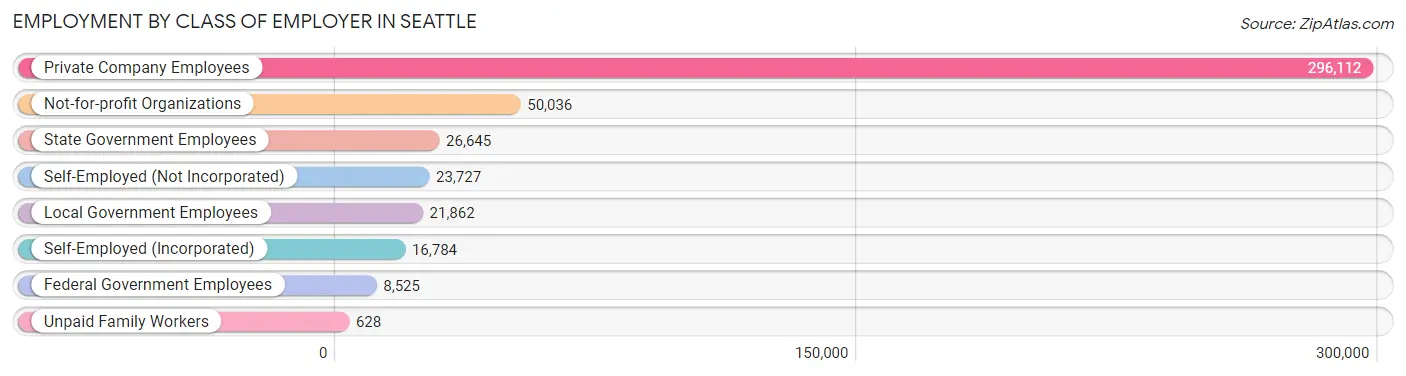
| Employer Class | # Employees | % Employees |
| Private Company Employees | 296,112 | 66.6% |
| Self-Employed (Incorporated) | 16,784 | 3.8% |
| Self-Employed (Not Incorporated) | 23,727 | 5.3% |
| Not-for-profit Organizations | 50,036 | 11.3% |
| Local Government Employees | 21,862 | 4.9% |
| State Government Employees | 26,645 | 6.0% |
| Federal Government Employees | 8,525 | 1.9% |
| Unpaid Family Workers | 628 | 0.1% |
| Total | 444,319 | 100.0% |
Employment Status by Age in Seattle
According to the labor force statistics for Seattle, out of the total population over 16 years of age (641,230), 73.9% or 473,869 individuals are in the labor force, with 4.2% or 19,902 of them unemployed. The age group with the highest labor force participation rate is 30 to 34 years, with 91.7% or 80,170 individuals in the labor force. Within the labor force, the 16 to 19 years age range has the highest percentage of unemployed individuals, with 16.7% or 1,675 of them being unemployed.
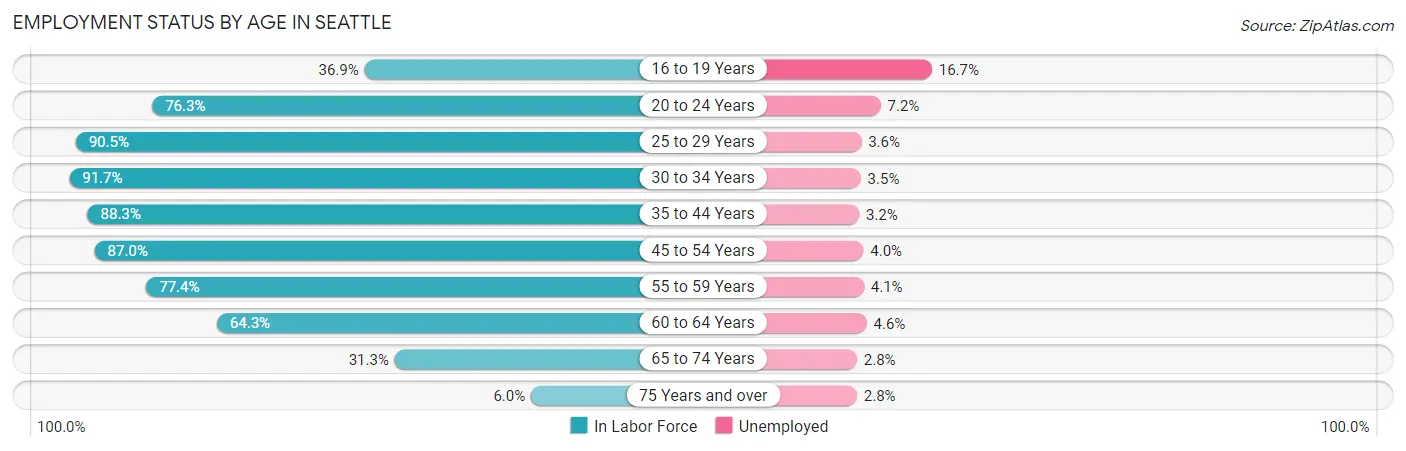
| Age Bracket | In Labor Force | Unemployed |
| 16 to 19 Years | 10,027 (36.9%) | 1,675 (16.7%) |
| 20 to 24 Years | 45,214 (76.3%) | 3,255 (7.2%) |
| 25 to 29 Years | 85,808 (90.5%) | 3,089 (3.6%) |
| 30 to 34 Years | 80,170 (91.7%) | 2,806 (3.5%) |
| 35 to 44 Years | 103,200 (88.3%) | 3,302 (3.2%) |
| 45 to 54 Years | 77,689 (87.0%) | 3,108 (4.0%) |
| 55 to 59 Years | 29,492 (77.4%) | 1,209 (4.1%) |
| 60 to 64 Years | 22,203 (64.3%) | 1,021 (4.6%) |
| 65 to 74 Years | 17,737 (31.3%) | 497 (2.8%) |
| 75 Years and over | 2,225 (6.0%) | 62 (2.8%) |
| Total | 473,869 (73.9%) | 19,902 (4.2%) |
Employment Status by Educational Attainment in Seattle
According to labor force statistics for Seattle, 86.4% of individuals (398,345) out of the total population between 25 and 64 years of age (461,047) are in the labor force, with 3.6% or 14,340 of them being unemployed. The group with the highest labor force participation rate are those with the educational attainment of bachelor's degree or higher, with 90.7% or 289,823 individuals in the labor force. Within the labor force, individuals with high school diploma education have the highest percentage of unemployment, with 6.7% or 2,006 of them being unemployed.
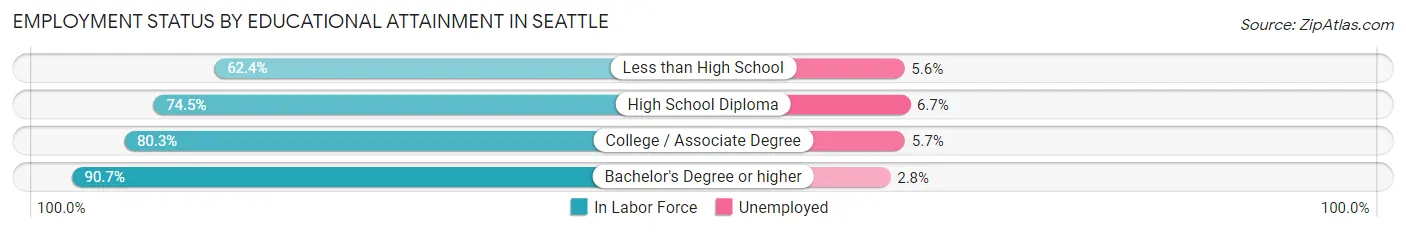
| Educational Attainment | In Labor Force | Unemployed |
| Less than High School | 9,784 (62.4%) | 878 (5.6%) |
| High School Diploma | 29,943 (74.5%) | 2,693 (6.7%) |
| College / Associate Degree | 68,765 (80.3%) | 4,881 (5.7%) |
| Bachelor's Degree or higher | 289,823 (90.7%) | 8,947 (2.8%) |
| Total | 398,345 (86.4%) | 16,598 (3.6%) |
Employment Occupations by Sex in Seattle
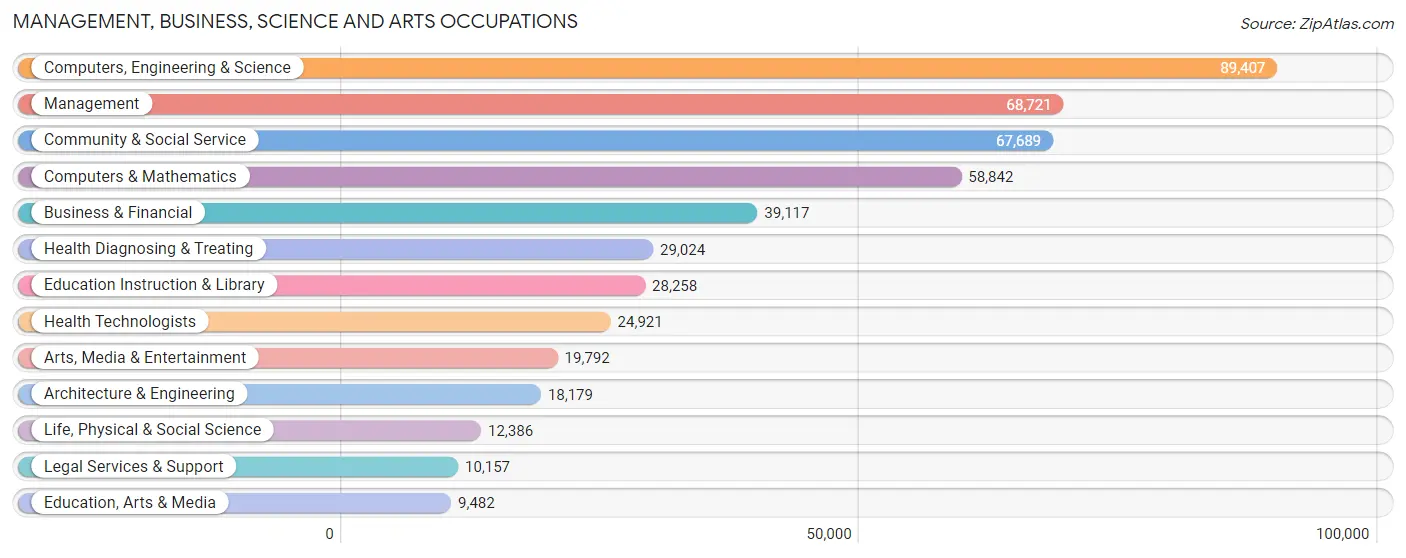
Management, Business, Science and Arts Occupations
The most common Management, Business, Science and Arts occupations in Seattle are Computers, Engineering & Science (89,407 | 19.8%), Management (68,721 | 15.2%), Community & Social Service (67,689 | 14.9%), Computers & Mathematics (58,842 | 13.0%), and Business & Financial (39,117 | 8.6%).
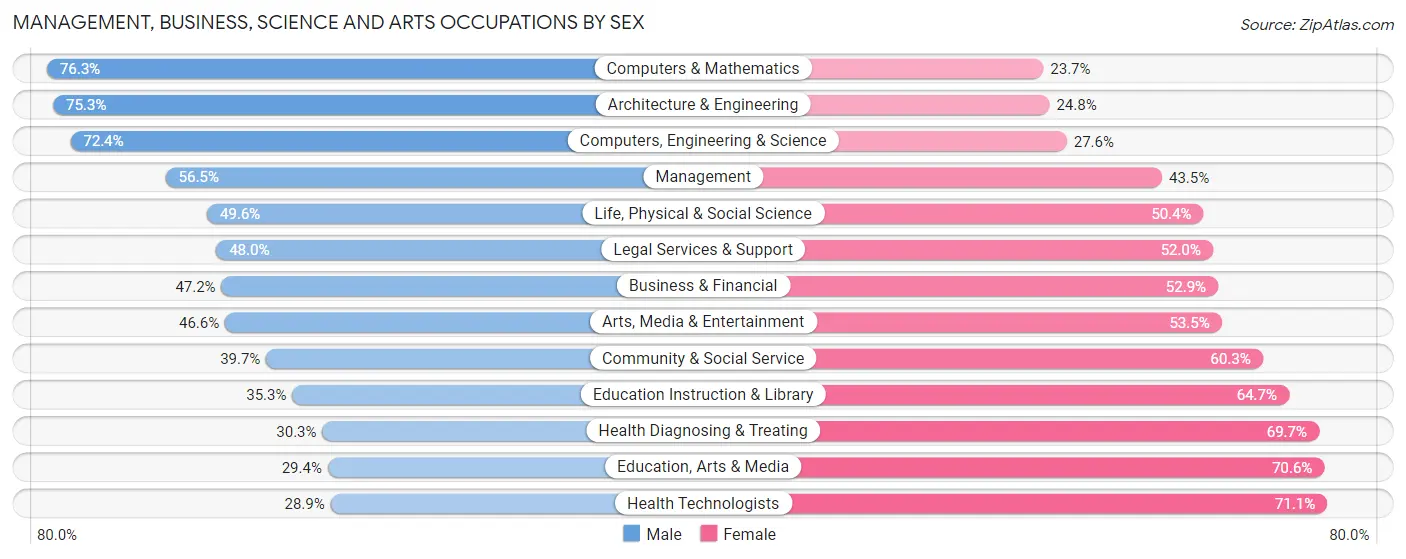
Management, Business, Science and Arts Occupations by Sex
Within the Management, Business, Science and Arts occupations in Seattle, the most male-oriented occupations are Computers & Mathematics (76.3%), Architecture & Engineering (75.2%), and Computers, Engineering & Science (72.4%), while the most female-oriented occupations are Health Technologists (71.1%), Education, Arts & Media (70.6%), and Health Diagnosing & Treating (69.7%).
| Occupation | Male | Female |
| Management | 38,801 (56.5%) | 29,920 (43.5%) |
| Business & Financial | 18,445 (47.1%) | 20,672 (52.8%) |
| Computers, Engineering & Science | 64,694 (72.4%) | 24,713 (27.6%) |
| Computers & Mathematics | 44,877 (76.3%) | 13,965 (23.7%) |
| Architecture & Engineering | 13,679 (75.2%) | 4,500 (24.7%) |
| Life, Physical & Social Science | 6,138 (49.6%) | 6,248 (50.4%) |
| Community & Social Service | 26,859 (39.7%) | 40,830 (60.3%) |
| Education, Arts & Media | 2,789 (29.4%) | 6,693 (70.6%) |
| Legal Services & Support | 4,876 (48.0%) | 5,281 (52.0%) |
| Education Instruction & Library | 9,981 (35.3%) | 18,277 (64.7%) |
| Arts, Media & Entertainment | 9,213 (46.6%) | 10,579 (53.4%) |
| Health Diagnosing & Treating | 8,797 (30.3%) | 20,227 (69.7%) |
| Health Technologists | 7,212 (28.9%) | 17,709 (71.1%) |
| Total (Category) | 157,596 (53.6%) | 136,362 (46.4%) |
| Total (Overall) | 242,689 (53.6%) | 210,039 (46.4%) |
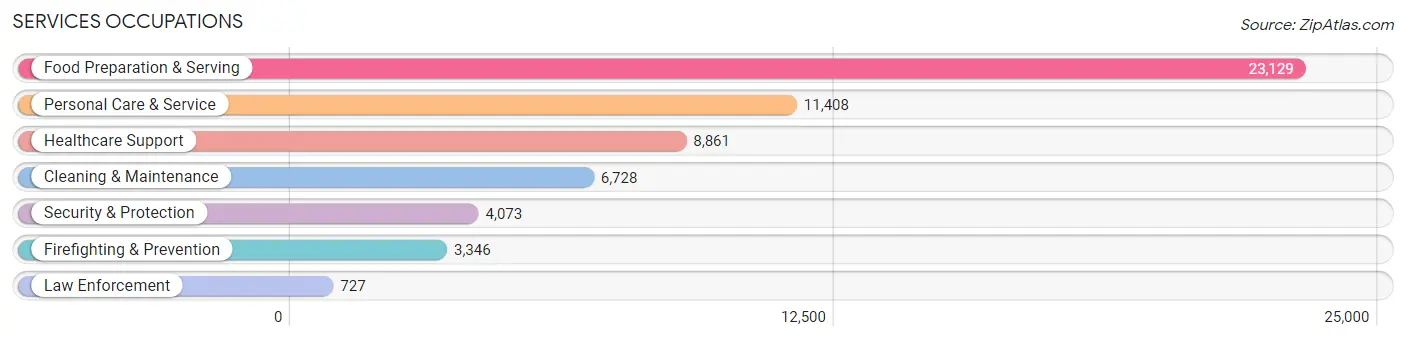
Services Occupations
The most common Services occupations in Seattle are Food Preparation & Serving (23,129 | 5.1%), Personal Care & Service (11,408 | 2.5%), Healthcare Support (8,861 | 2.0%), Cleaning & Maintenance (6,728 | 1.5%), and Security & Protection (4,073 | 0.9%).
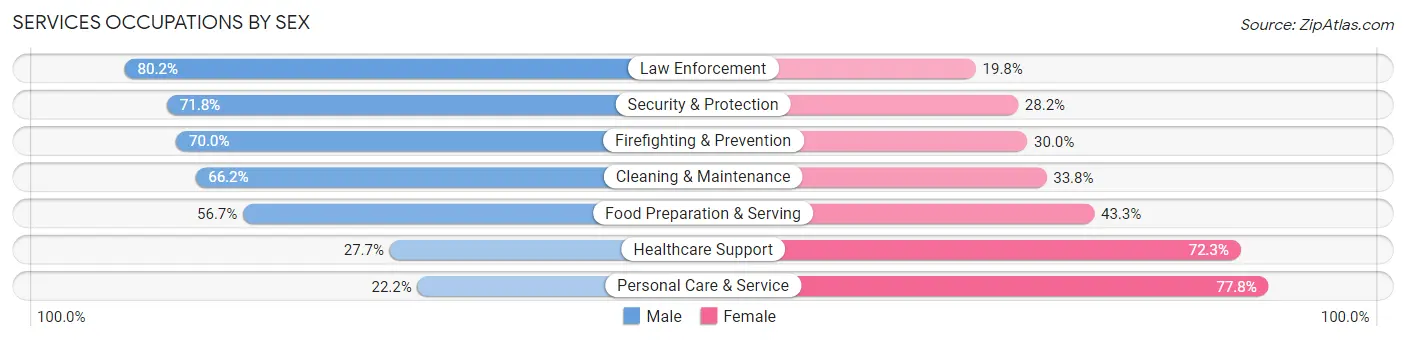
Services Occupations by Sex
Within the Services occupations in Seattle, the most male-oriented occupations are Law Enforcement (80.2%), Security & Protection (71.8%), and Firefighting & Prevention (70.0%), while the most female-oriented occupations are Personal Care & Service (77.8%), Healthcare Support (72.3%), and Food Preparation & Serving (43.3%).
| Occupation | Male | Female |
| Healthcare Support | 2,453 (27.7%) | 6,408 (72.3%) |
| Security & Protection | 2,925 (71.8%) | 1,148 (28.2%) |
| Firefighting & Prevention | 2,342 (70.0%) | 1,004 (30.0%) |
| Law Enforcement | 583 (80.2%) | 144 (19.8%) |
| Food Preparation & Serving | 13,122 (56.7%) | 10,007 (43.3%) |
| Cleaning & Maintenance | 4,453 (66.2%) | 2,275 (33.8%) |
| Personal Care & Service | 2,531 (22.2%) | 8,877 (77.8%) |
| Total (Category) | 25,484 (47.0%) | 28,715 (53.0%) |
| Total (Overall) | 242,689 (53.6%) | 210,039 (46.4%) |
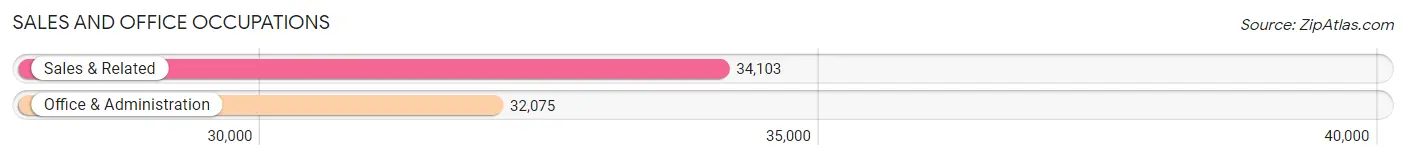
Sales and Office Occupations
The most common Sales and Office occupations in Seattle are Sales & Related (34,103 | 7.5%), and Office & Administration (32,075 | 7.1%).
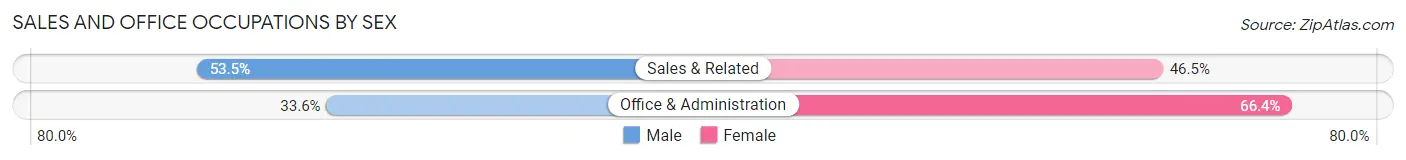
Sales and Office Occupations by Sex
| Occupation | Male | Female |
| Sales & Related | 18,247 (53.5%) | 15,856 (46.5%) |
| Office & Administration | 10,769 (33.6%) | 21,306 (66.4%) |
| Total (Category) | 29,016 (43.9%) | 37,162 (56.1%) |
| Total (Overall) | 242,689 (53.6%) | 210,039 (46.4%) |
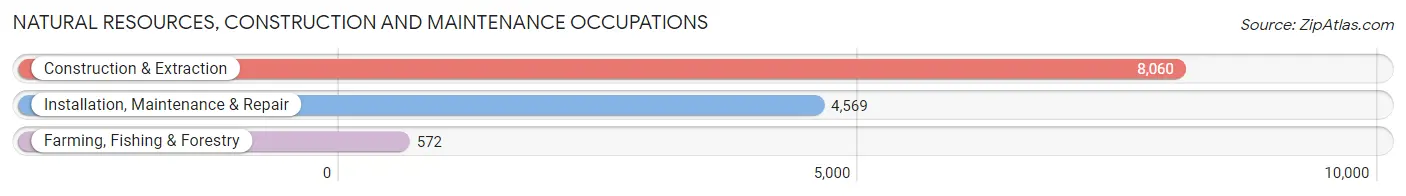
Natural Resources, Construction and Maintenance Occupations
The most common Natural Resources, Construction and Maintenance occupations in Seattle are Construction & Extraction (8,060 | 1.8%), Installation, Maintenance & Repair (4,569 | 1.0%), and Farming, Fishing & Forestry (572 | 0.1%).
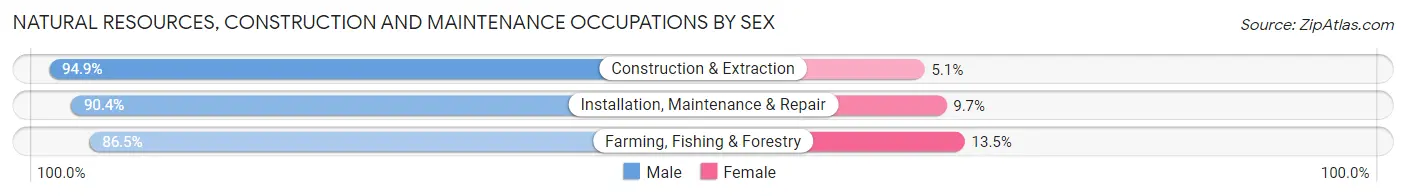
Natural Resources, Construction and Maintenance Occupations by Sex
| Occupation | Male | Female |
| Farming, Fishing & Forestry | 495 (86.5%) | 77 (13.5%) |
| Construction & Extraction | 7,649 (94.9%) | 411 (5.1%) |
| Installation, Maintenance & Repair | 4,128 (90.3%) | 441 (9.7%) |
| Total (Category) | 12,272 (93.0%) | 929 (7.0%) |
| Total (Overall) | 242,689 (53.6%) | 210,039 (46.4%) |
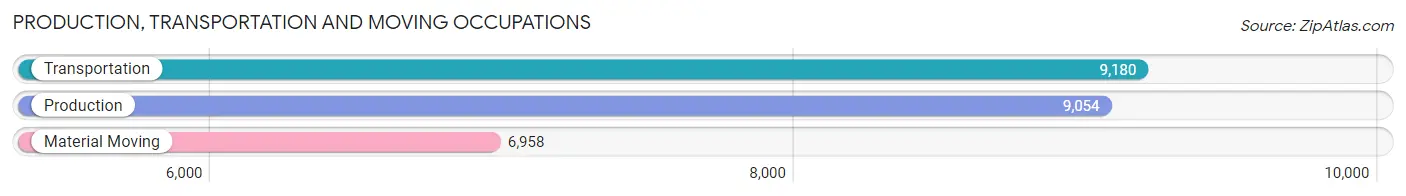
Production, Transportation and Moving Occupations
The most common Production, Transportation and Moving occupations in Seattle are Transportation (9,180 | 2.0%), Production (9,054 | 2.0%), and Material Moving (6,958 | 1.5%).
Production, Transportation and Moving Occupations by Sex
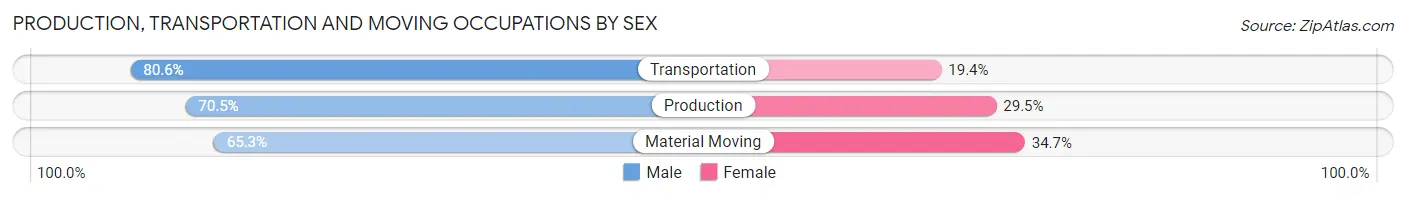
| Occupation | Male | Female |
| Production | 6,382 (70.5%) | 2,672 (29.5%) |
| Transportation | 7,397 (80.6%) | 1,783 (19.4%) |
| Material Moving | 4,542 (65.3%) | 2,416 (34.7%) |
| Total (Category) | 18,321 (72.7%) | 6,871 (27.3%) |
| Total (Overall) | 242,689 (53.6%) | 210,039 (46.4%) |
Employment Industries by Sex in Seattle
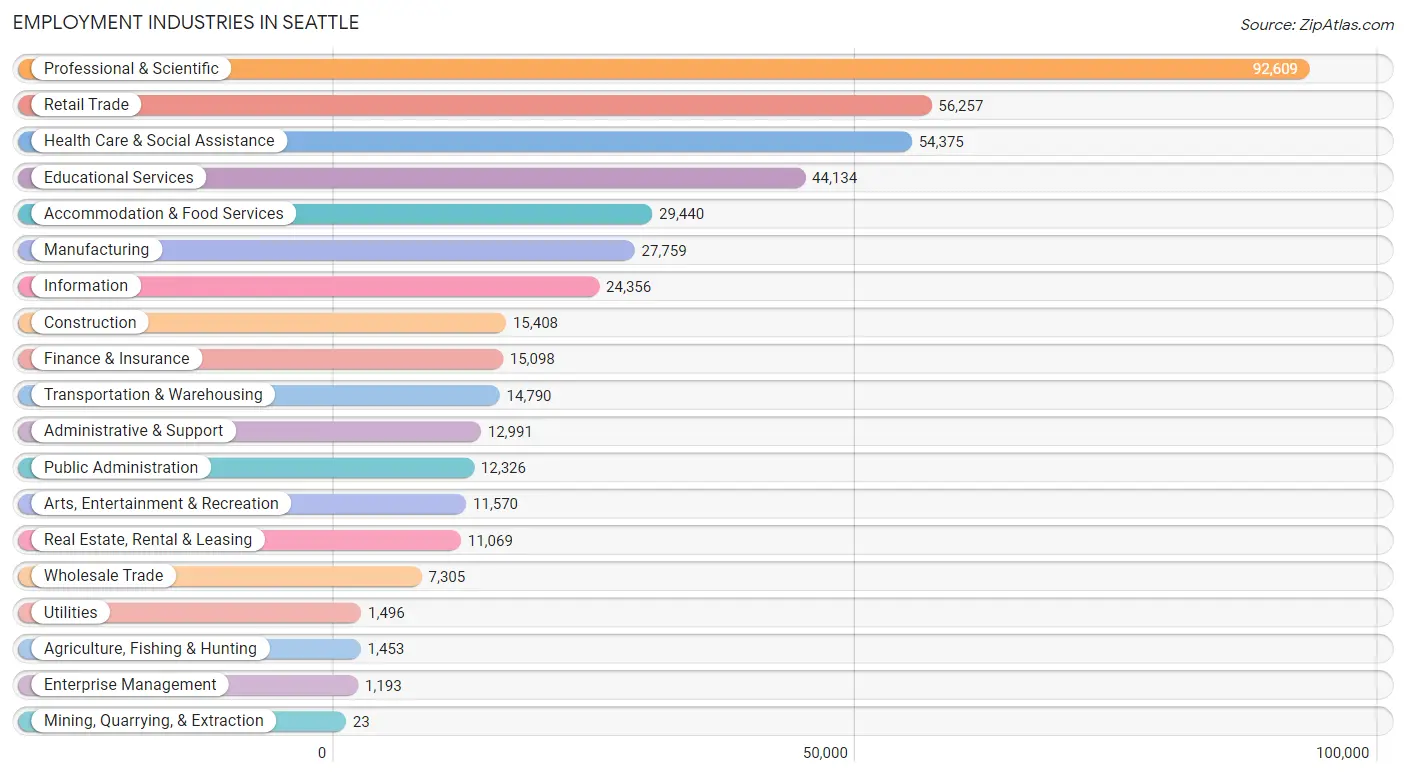
Employment Industries in Seattle
The major employment industries in Seattle include Professional & Scientific (92,609 | 20.5%), Retail Trade (56,257 | 12.4%), Health Care & Social Assistance (54,375 | 12.0%), Educational Services (44,134 | 9.8%), and Accommodation & Food Services (29,440 | 6.5%).
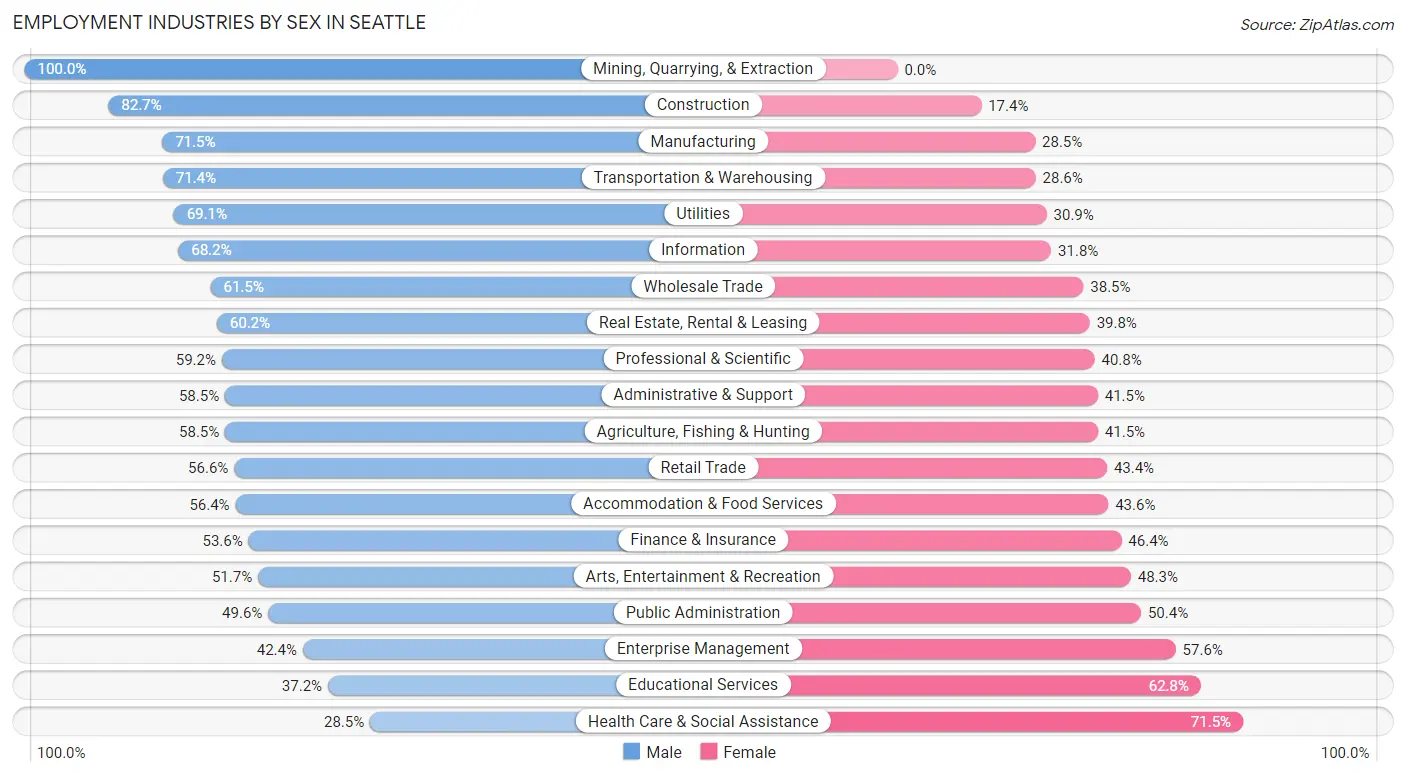
Employment Industries by Sex in Seattle
The Seattle industries that see more men than women are Mining, Quarrying, & Extraction (100.0%), Construction (82.7%), and Manufacturing (71.5%), whereas the industries that tend to have a higher number of women are Health Care & Social Assistance (71.5%), Educational Services (62.8%), and Enterprise Management (57.6%).
| Industry | Male | Female |
| Agriculture, Fishing & Hunting | 850 (58.5%) | 603 (41.5%) |
| Mining, Quarrying, & Extraction | 23 (100.0%) | 0 (0.0%) |
| Construction | 12,735 (82.7%) | 2,673 (17.3%) |
| Manufacturing | 19,848 (71.5%) | 7,911 (28.5%) |
| Wholesale Trade | 4,493 (61.5%) | 2,812 (38.5%) |
| Retail Trade | 31,859 (56.6%) | 24,398 (43.4%) |
| Transportation & Warehousing | 10,559 (71.4%) | 4,231 (28.6%) |
| Utilities | 1,034 (69.1%) | 462 (30.9%) |
| Information | 16,607 (68.2%) | 7,749 (31.8%) |
| Finance & Insurance | 8,099 (53.6%) | 6,999 (46.4%) |
| Real Estate, Rental & Leasing | 6,663 (60.2%) | 4,406 (39.8%) |
| Professional & Scientific | 54,817 (59.2%) | 37,792 (40.8%) |
| Enterprise Management | 506 (42.4%) | 687 (57.6%) |
| Administrative & Support | 7,602 (58.5%) | 5,389 (41.5%) |
| Educational Services | 16,425 (37.2%) | 27,709 (62.8%) |
| Health Care & Social Assistance | 15,498 (28.5%) | 38,877 (71.5%) |
| Arts, Entertainment & Recreation | 5,980 (51.7%) | 5,590 (48.3%) |
| Accommodation & Food Services | 16,593 (56.4%) | 12,847 (43.6%) |
| Public Administration | 6,113 (49.6%) | 6,213 (50.4%) |
| Total | 242,689 (53.6%) | 210,039 (46.4%) |
Education in Seattle
School Enrollment in Seattle
The most common levels of schooling among the 153,032 students in Seattle are college / undergraduate (51,450 | 33.6%), middle school (22,416 | 14.6%), and elementary school (21,962 | 14.3%).
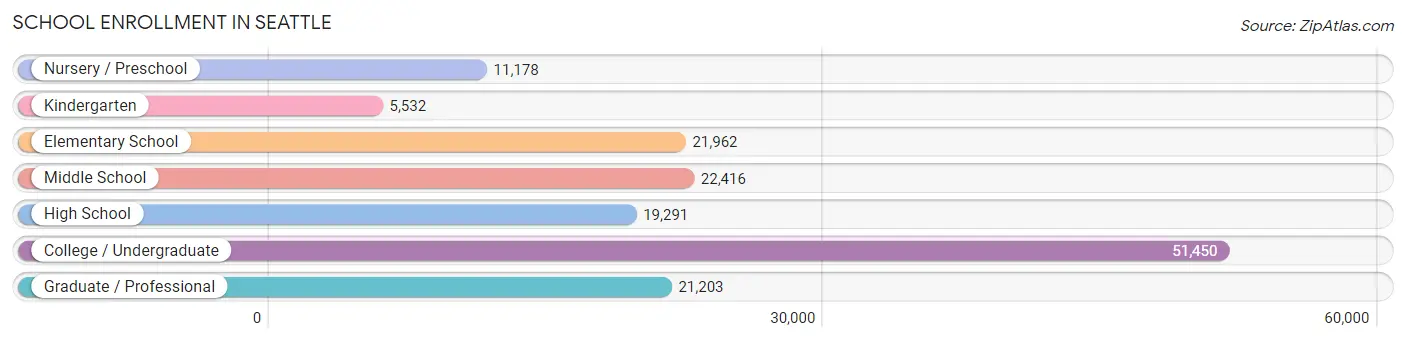
| School Level | # Students | % Students |
| Nursery / Preschool | 11,178 | 7.3% |
| Kindergarten | 5,532 | 3.6% |
| Elementary School | 21,962 | 14.3% |
| Middle School | 22,416 | 14.6% |
| High School | 19,291 | 12.6% |
| College / Undergraduate | 51,450 | 33.6% |
| Graduate / Professional | 21,203 | 13.9% |
| Total | 153,032 | 100.0% |
School Enrollment by Age by Funding Source in Seattle
Out of a total of 153,032 students who are enrolled in schools in Seattle, 39,176 (25.6%) attend a private institution, while the remaining 113,856 (74.4%) are enrolled in public schools. The age group of 3 to 4 year olds has the highest likelihood of being enrolled in private schools, with 5,644 (65.4% in the age bracket) enrolled. Conversely, the age group of 18 to 19 year olds has the lowest likelihood of being enrolled in a private school, with 12,776 (81.3% in the age bracket) attending a public institution.
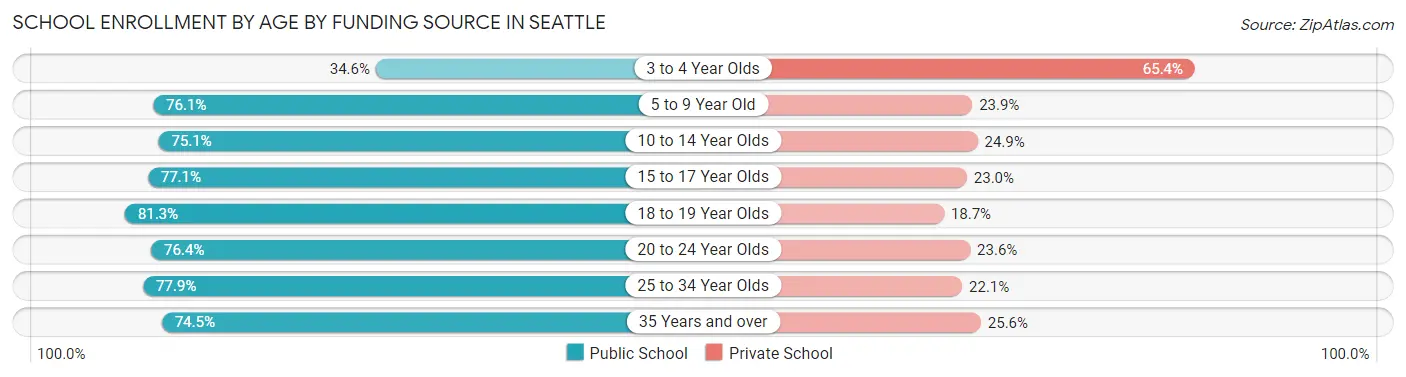
| Age Bracket | Public School | Private School |
| 3 to 4 Year Olds | 2,985 (34.6%) | 5,644 (65.4%) |
| 5 to 9 Year Old | 20,495 (76.1%) | 6,451 (23.9%) |
| 10 to 14 Year Olds | 20,585 (75.1%) | 6,835 (24.9%) |
| 15 to 17 Year Olds | 11,179 (77.0%) | 3,330 (23.0%) |
| 18 to 19 Year Olds | 12,776 (81.3%) | 2,935 (18.7%) |
| 20 to 24 Year Olds | 21,569 (76.4%) | 6,649 (23.6%) |
| 25 to 34 Year Olds | 16,738 (77.9%) | 4,737 (22.1%) |
| 35 Years and over | 7,537 (74.5%) | 2,587 (25.6%) |
| Total | 113,856 (74.4%) | 39,176 (25.6%) |
Educational Attainment by Field of Study in Seattle
Business (52,939 | 12.8%), social sciences (52,820 | 12.7%), engineering (43,030 | 10.4%), computers & mathematics (36,342 | 8.8%), and bio, nature & agricultural (32,603 | 7.9%) are the most common fields of study among 414,629 individuals in Seattle who have obtained a bachelor's degree or higher.
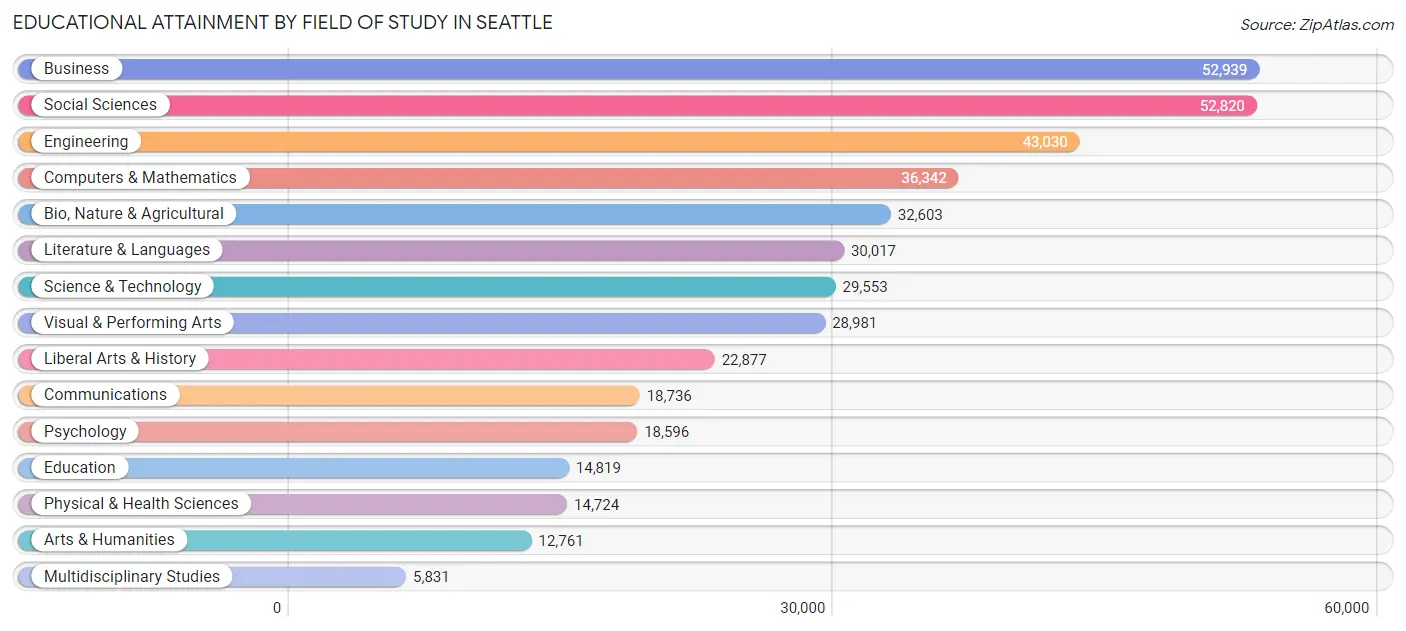
| Field of Study | # Graduates | % Graduates |
| Computers & Mathematics | 36,342 | 8.8% |
| Bio, Nature & Agricultural | 32,603 | 7.9% |
| Physical & Health Sciences | 14,724 | 3.5% |
| Psychology | 18,596 | 4.5% |
| Social Sciences | 52,820 | 12.7% |
| Engineering | 43,030 | 10.4% |
| Multidisciplinary Studies | 5,831 | 1.4% |
| Science & Technology | 29,553 | 7.1% |
| Business | 52,939 | 12.8% |
| Education | 14,819 | 3.6% |
| Literature & Languages | 30,017 | 7.2% |
| Liberal Arts & History | 22,877 | 5.5% |
| Visual & Performing Arts | 28,981 | 7.0% |
| Communications | 18,736 | 4.5% |
| Arts & Humanities | 12,761 | 3.1% |
| Total | 414,629 | 100.0% |
Transportation & Commute in Seattle
Vehicle Availability by Sex in Seattle
The most prevalent vehicle ownership categories in Seattle are males with 1 vehicle (87,549, accounting for 36.9%) and females with 1 vehicle (77,978, making up 43.2%).
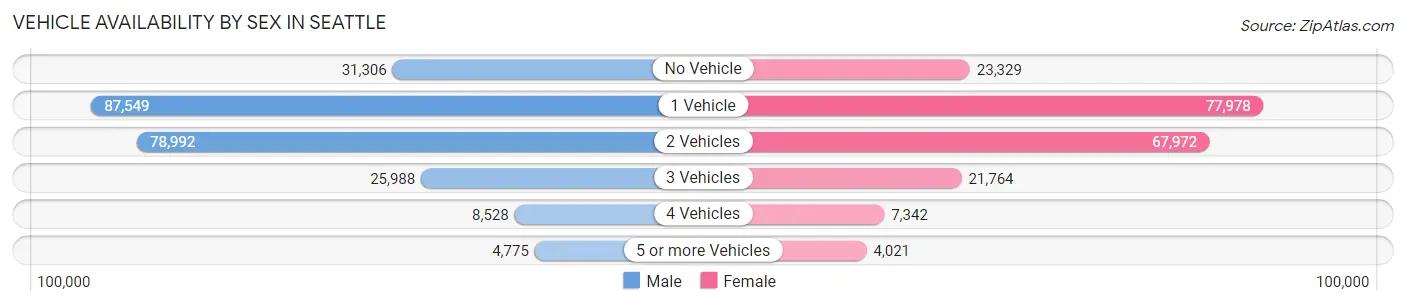
| Vehicles Available | Male | Female |
| No Vehicle | 31,306 (13.2%) | 23,329 (11.5%) |
| 1 Vehicle | 87,549 (36.9%) | 77,978 (38.5%) |
| 2 Vehicles | 78,992 (33.3%) | 67,972 (33.6%) |
| 3 Vehicles | 25,988 (11.0%) | 21,764 (10.7%) |
| 4 Vehicles | 8,528 (3.6%) | 7,342 (3.6%) |
| 5 or more Vehicles | 4,775 (2.0%) | 4,021 (2.0%) |
| Total | 237,138 (100.0%) | 202,406 (100.0%) |
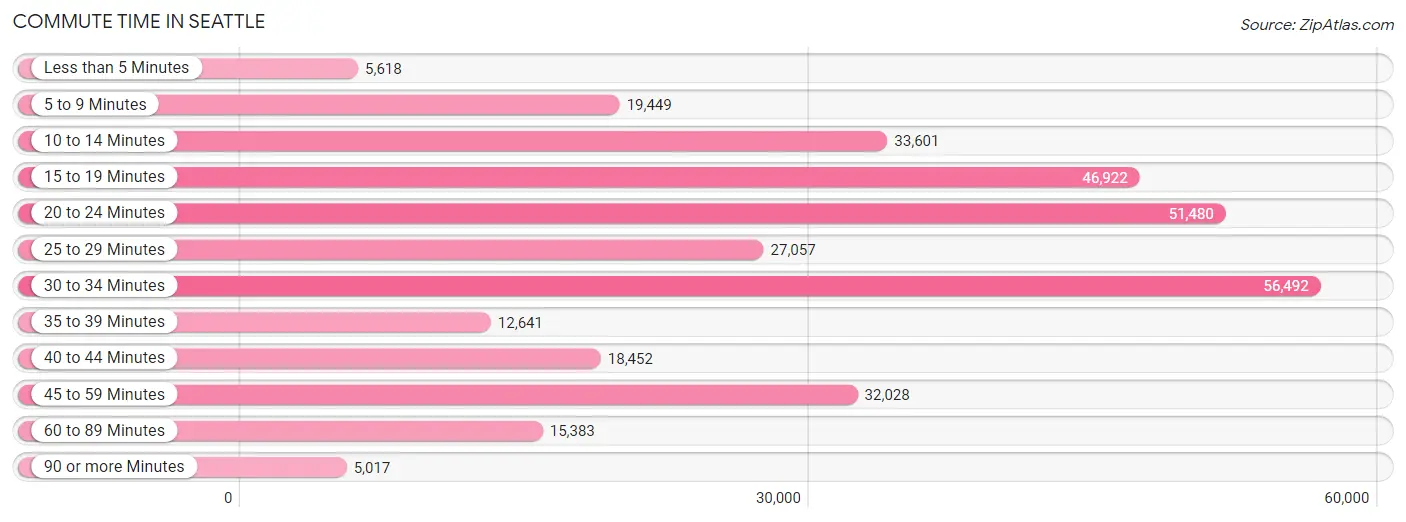
Commute Time in Seattle
The most frequently occuring commute durations in Seattle are 30 to 34 minutes (56,492 commuters, 17.4%), 20 to 24 minutes (51,480 commuters, 15.9%), and 15 to 19 minutes (46,922 commuters, 14.5%).
| Commute Time | # Commuters | % Commuters |
| Less than 5 Minutes | 5,618 | 1.7% |
| 5 to 9 Minutes | 19,449 | 6.0% |
| 10 to 14 Minutes | 33,601 | 10.4% |
| 15 to 19 Minutes | 46,922 | 14.5% |
| 20 to 24 Minutes | 51,480 | 15.9% |
| 25 to 29 Minutes | 27,057 | 8.4% |
| 30 to 34 Minutes | 56,492 | 17.4% |
| 35 to 39 Minutes | 12,641 | 3.9% |
| 40 to 44 Minutes | 18,452 | 5.7% |
| 45 to 59 Minutes | 32,028 | 9.9% |
| 60 to 89 Minutes | 15,383 | 4.8% |
| 90 or more Minutes | 5,017 | 1.5% |
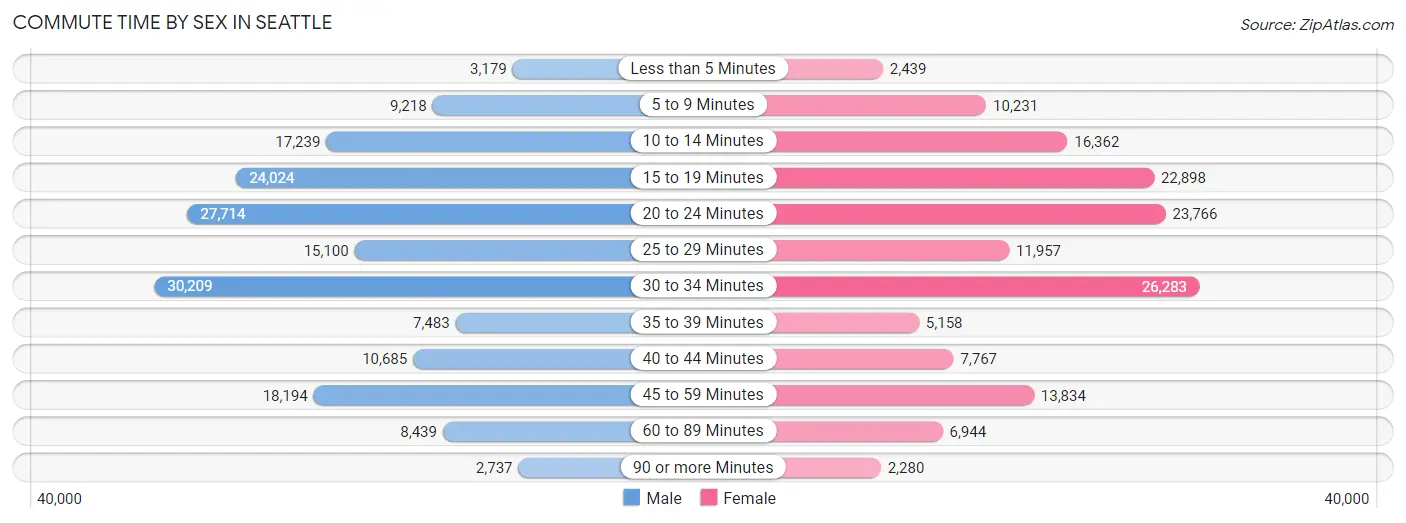
Commute Time by Sex in Seattle
The most common commute times in Seattle are 30 to 34 minutes (30,209 commuters, 17.3%) for males and 30 to 34 minutes (26,283 commuters, 17.5%) for females.
| Commute Time | Male | Female |
| Less than 5 Minutes | 3,179 (1.8%) | 2,439 (1.6%) |
| 5 to 9 Minutes | 9,218 (5.3%) | 10,231 (6.8%) |
| 10 to 14 Minutes | 17,239 (9.9%) | 16,362 (10.9%) |
| 15 to 19 Minutes | 24,024 (13.8%) | 22,898 (15.3%) |
| 20 to 24 Minutes | 27,714 (15.9%) | 23,766 (15.9%) |
| 25 to 29 Minutes | 15,100 (8.7%) | 11,957 (8.0%) |
| 30 to 34 Minutes | 30,209 (17.3%) | 26,283 (17.5%) |
| 35 to 39 Minutes | 7,483 (4.3%) | 5,158 (3.4%) |
| 40 to 44 Minutes | 10,685 (6.1%) | 7,767 (5.2%) |
| 45 to 59 Minutes | 18,194 (10.4%) | 13,834 (9.2%) |
| 60 to 89 Minutes | 8,439 (4.8%) | 6,944 (4.6%) |
| 90 or more Minutes | 2,737 (1.6%) | 2,280 (1.5%) |
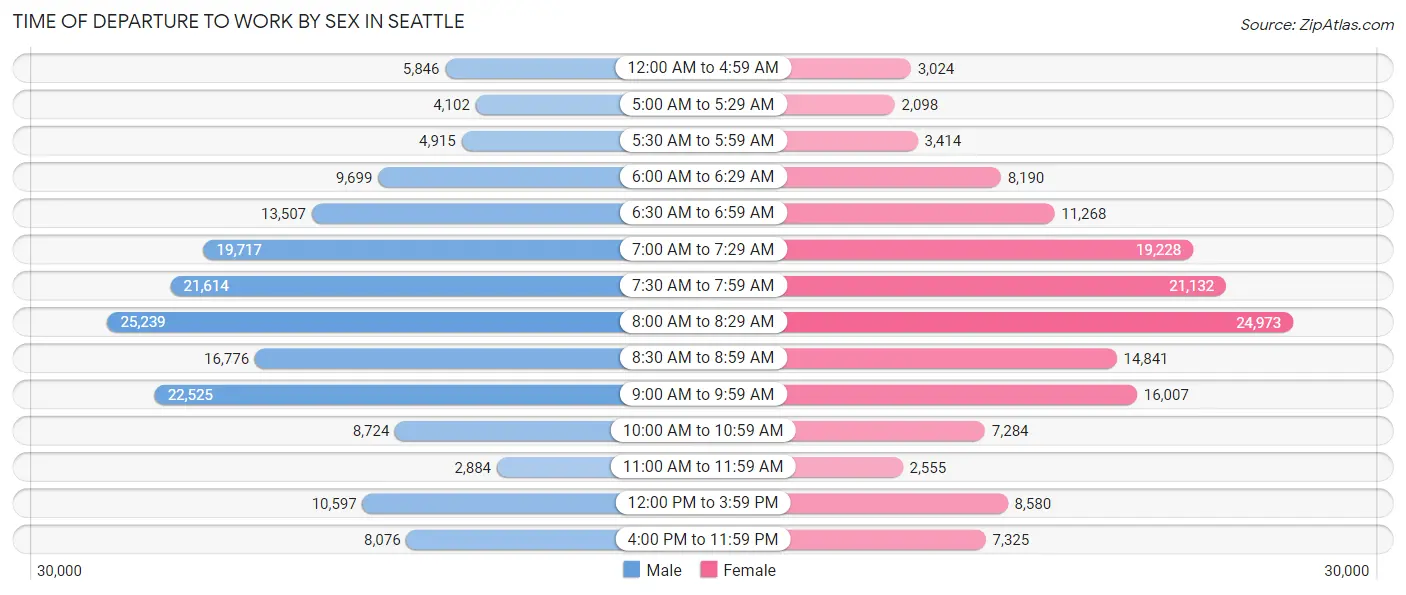
Time of Departure to Work by Sex in Seattle
The most frequent times of departure to work in Seattle are 8:00 AM to 8:29 AM (25,239, 14.5%) for males and 8:00 AM to 8:29 AM (24,973, 16.7%) for females.
| Time of Departure | Male | Female |
| 12:00 AM to 4:59 AM | 5,846 (3.4%) | 3,024 (2.0%) |
| 5:00 AM to 5:29 AM | 4,102 (2.4%) | 2,098 (1.4%) |
| 5:30 AM to 5:59 AM | 4,915 (2.8%) | 3,414 (2.3%) |
| 6:00 AM to 6:29 AM | 9,699 (5.6%) | 8,190 (5.5%) |
| 6:30 AM to 6:59 AM | 13,507 (7.7%) | 11,268 (7.5%) |
| 7:00 AM to 7:29 AM | 19,717 (11.3%) | 19,228 (12.8%) |
| 7:30 AM to 7:59 AM | 21,614 (12.4%) | 21,132 (14.1%) |
| 8:00 AM to 8:29 AM | 25,239 (14.5%) | 24,973 (16.7%) |
| 8:30 AM to 8:59 AM | 16,776 (9.6%) | 14,841 (9.9%) |
| 9:00 AM to 9:59 AM | 22,525 (12.9%) | 16,007 (10.7%) |
| 10:00 AM to 10:59 AM | 8,724 (5.0%) | 7,284 (4.9%) |
| 11:00 AM to 11:59 AM | 2,884 (1.7%) | 2,555 (1.7%) |
| 12:00 PM to 3:59 PM | 10,597 (6.1%) | 8,580 (5.7%) |
| 4:00 PM to 11:59 PM | 8,076 (4.6%) | 7,325 (4.9%) |
| Total | 174,221 (100.0%) | 149,919 (100.0%) |
Housing Occupancy in Seattle
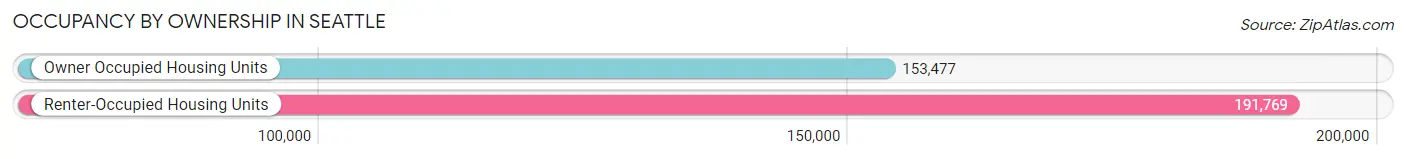
Occupancy by Ownership in Seattle
Of the total 345,246 dwellings in Seattle, owner-occupied units account for 153,477 (44.5%), while renter-occupied units make up 191,769 (55.5%).
| Occupancy | # Housing Units | % Housing Units |
| Owner Occupied Housing Units | 153,477 | 44.5% |
| Renter-Occupied Housing Units | 191,769 | 55.5% |
| Total Occupied Housing Units | 345,246 | 100.0% |
Occupancy by Household Size in Seattle
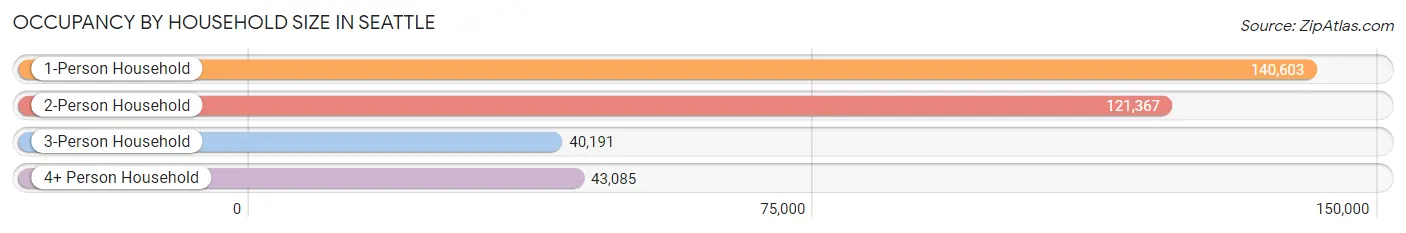
| Household Size | # Housing Units | % Housing Units |
| 1-Person Household | 140,603 | 40.7% |
| 2-Person Household | 121,367 | 35.1% |
| 3-Person Household | 40,191 | 11.6% |
| 4+ Person Household | 43,085 | 12.5% |
| Total Housing Units | 345,246 | 100.0% |
Occupancy by Ownership by Household Size in Seattle
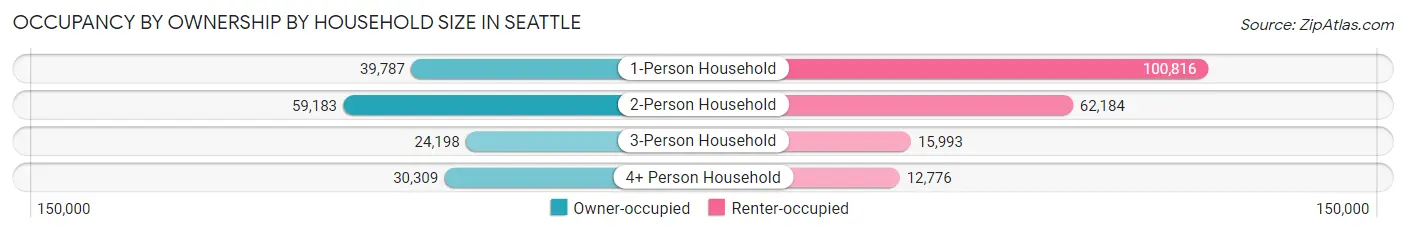
| Household Size | Owner-occupied | Renter-occupied |
| 1-Person Household | 39,787 (28.3%) | 100,816 (71.7%) |
| 2-Person Household | 59,183 (48.8%) | 62,184 (51.2%) |
| 3-Person Household | 24,198 (60.2%) | 15,993 (39.8%) |
| 4+ Person Household | 30,309 (70.4%) | 12,776 (29.6%) |
| Total Housing Units | 153,477 (44.5%) | 191,769 (55.5%) |
Occupancy by Educational Attainment in Seattle
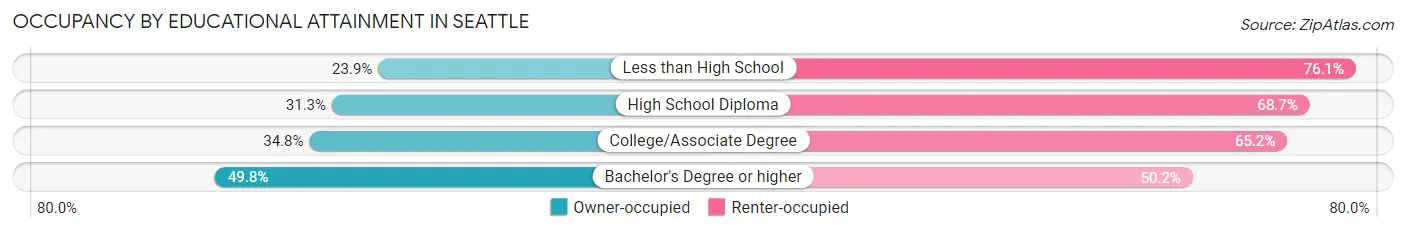
| Household Size | Owner-occupied | Renter-occupied |
| Less than High School | 3,083 (23.9%) | 9,805 (76.1%) |
| High School Diploma | 8,452 (31.3%) | 18,575 (68.7%) |
| College/Associate Degree | 23,571 (34.8%) | 44,091 (65.2%) |
| Bachelor's Degree or higher | 118,371 (49.8%) | 119,298 (50.2%) |
Occupancy by Age of Householder in Seattle
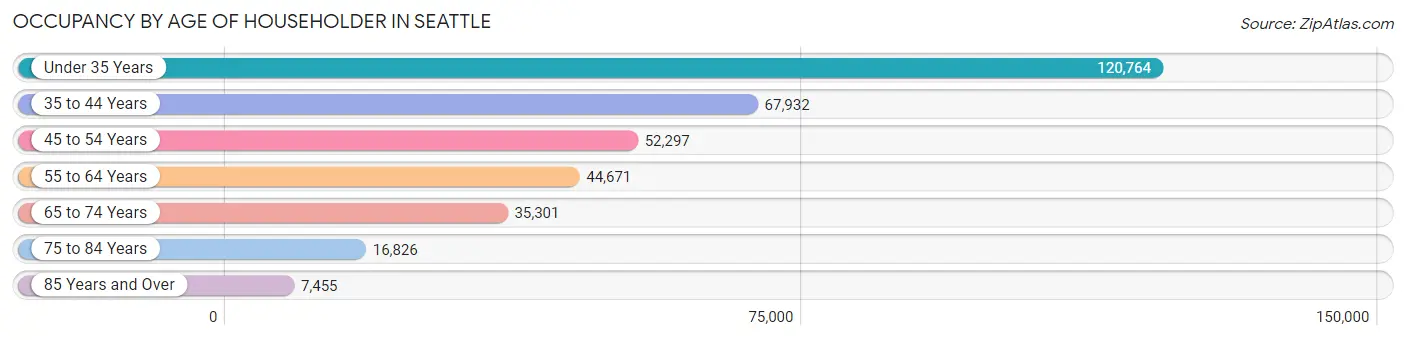
| Age Bracket | # Households | % Households |
| Under 35 Years | 120,764 | 35.0% |
| 35 to 44 Years | 67,932 | 19.7% |
| 45 to 54 Years | 52,297 | 15.1% |
| 55 to 64 Years | 44,671 | 12.9% |
| 65 to 74 Years | 35,301 | 10.2% |
| 75 to 84 Years | 16,826 | 4.9% |
| 85 Years and Over | 7,455 | 2.2% |
| Total | 345,246 | 100.0% |
Housing Finances in Seattle
Median Income by Occupancy in Seattle
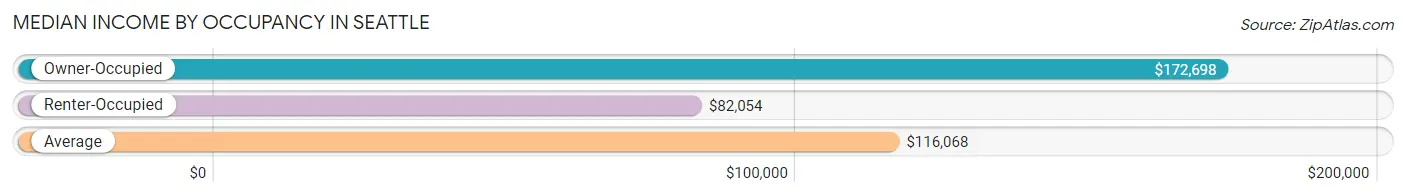
| Occupancy Type | # Households | Median Income |
| Owner-Occupied | 153,477 (44.5%) | $172,698 |
| Renter-Occupied | 191,769 (55.5%) | $82,054 |
| Average | 345,246 (100.0%) | $116,068 |
Occupancy by Householder Income Bracket in Seattle
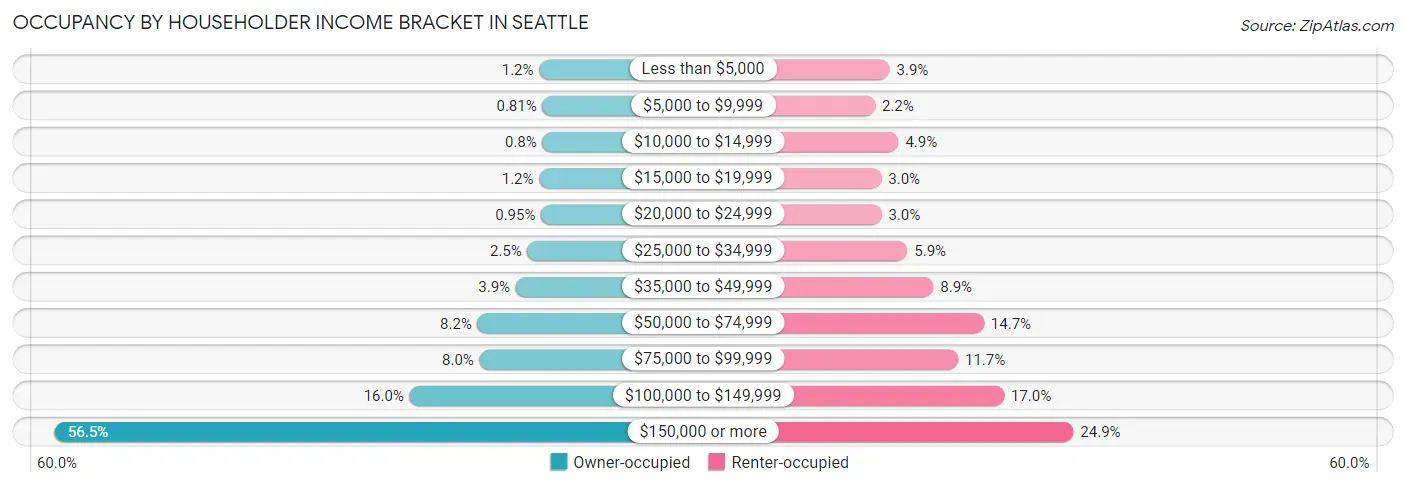
| Income Bracket | Owner-occupied | Renter-occupied |
| Less than $5,000 | 1,799 (1.2%) | 7,453 (3.9%) |
| $5,000 to $9,999 | 1,236 (0.8%) | 4,258 (2.2%) |
| $10,000 to $14,999 | 1,221 (0.8%) | 9,420 (4.9%) |
| $15,000 to $19,999 | 1,803 (1.2%) | 5,664 (2.9%) |
| $20,000 to $24,999 | 1,465 (0.9%) | 5,689 (3.0%) |
| $25,000 to $34,999 | 3,846 (2.5%) | 11,351 (5.9%) |
| $35,000 to $49,999 | 5,905 (3.8%) | 17,047 (8.9%) |
| $50,000 to $74,999 | 12,622 (8.2%) | 28,138 (14.7%) |
| $75,000 to $99,999 | 12,270 (8.0%) | 22,463 (11.7%) |
| $100,000 to $149,999 | 24,544 (16.0%) | 32,537 (17.0%) |
| $150,000 or more | 86,766 (56.5%) | 47,749 (24.9%) |
| Total | 153,477 (100.0%) | 191,769 (100.0%) |
Monthly Housing Cost Tiers in Seattle
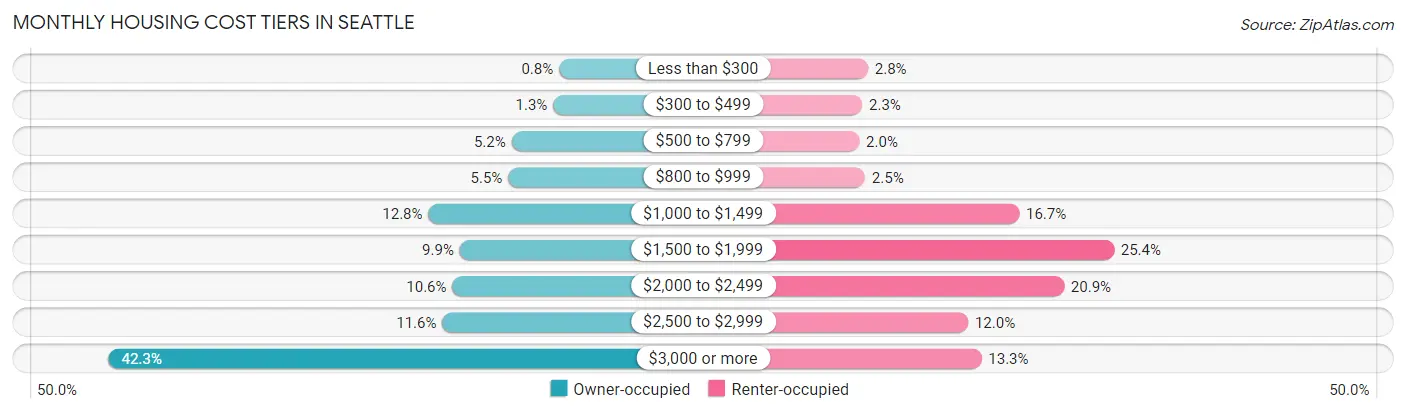
| Monthly Cost | Owner-occupied | Renter-occupied |
| Less than $300 | 1,227 (0.8%) | 5,369 (2.8%) |
| $300 to $499 | 2,056 (1.3%) | 4,348 (2.3%) |
| $500 to $799 | 7,936 (5.2%) | 3,830 (2.0%) |
| $800 to $999 | 8,416 (5.5%) | 4,849 (2.5%) |
| $1,000 to $1,499 | 19,691 (12.8%) | 32,063 (16.7%) |
| $1,500 to $1,999 | 15,261 (9.9%) | 48,779 (25.4%) |
| $2,000 to $2,499 | 16,293 (10.6%) | 39,982 (20.8%) |
| $2,500 to $2,999 | 17,728 (11.6%) | 23,044 (12.0%) |
| $3,000 or more | 64,869 (42.3%) | 25,418 (13.3%) |
| Total | 153,477 (100.0%) | 191,769 (100.0%) |
Physical Housing Characteristics in Seattle
Housing Structures in Seattle
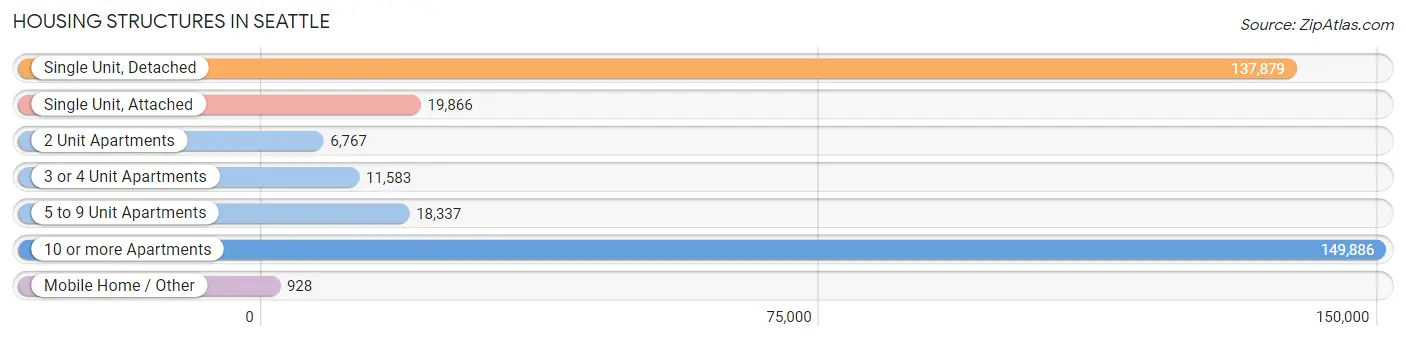
| Structure Type | # Housing Units | % Housing Units |
| Single Unit, Detached | 137,879 | 39.9% |
| Single Unit, Attached | 19,866 | 5.8% |
| 2 Unit Apartments | 6,767 | 2.0% |
| 3 or 4 Unit Apartments | 11,583 | 3.4% |
| 5 to 9 Unit Apartments | 18,337 | 5.3% |
| 10 or more Apartments | 149,886 | 43.4% |
| Mobile Home / Other | 928 | 0.3% |
| Total | 345,246 | 100.0% |
Housing Structures by Occupancy in Seattle
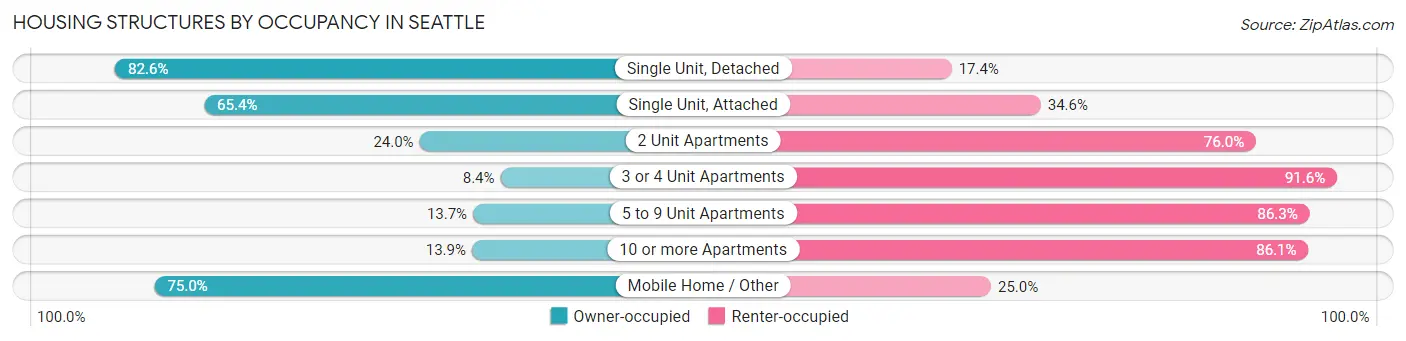
| Structure Type | Owner-occupied | Renter-occupied |
| Single Unit, Detached | 113,851 (82.6%) | 24,028 (17.4%) |
| Single Unit, Attached | 12,996 (65.4%) | 6,870 (34.6%) |
| 2 Unit Apartments | 1,623 (24.0%) | 5,144 (76.0%) |
| 3 or 4 Unit Apartments | 972 (8.4%) | 10,611 (91.6%) |
| 5 to 9 Unit Apartments | 2,508 (13.7%) | 15,829 (86.3%) |
| 10 or more Apartments | 20,831 (13.9%) | 129,055 (86.1%) |
| Mobile Home / Other | 696 (75.0%) | 232 (25.0%) |
| Total | 153,477 (44.5%) | 191,769 (55.5%) |
Housing Structures by Number of Rooms in Seattle
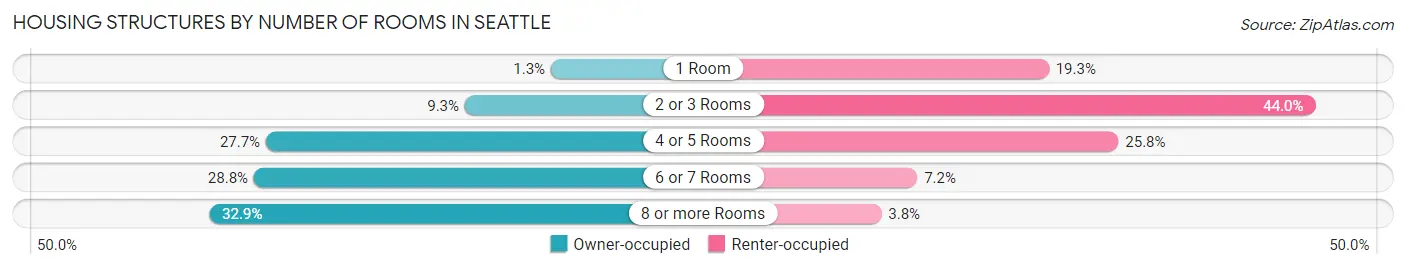
| Number of Rooms | Owner-occupied | Renter-occupied |
| 1 Room | 2,024 (1.3%) | 37,024 (19.3%) |
| 2 or 3 Rooms | 14,250 (9.3%) | 84,317 (44.0%) |
| 4 or 5 Rooms | 42,477 (27.7%) | 49,382 (25.8%) |
| 6 or 7 Rooms | 44,185 (28.8%) | 13,704 (7.1%) |
| 8 or more Rooms | 50,541 (32.9%) | 7,342 (3.8%) |
| Total | 153,477 (100.0%) | 191,769 (100.0%) |
Housing Structure by Heating Type in Seattle
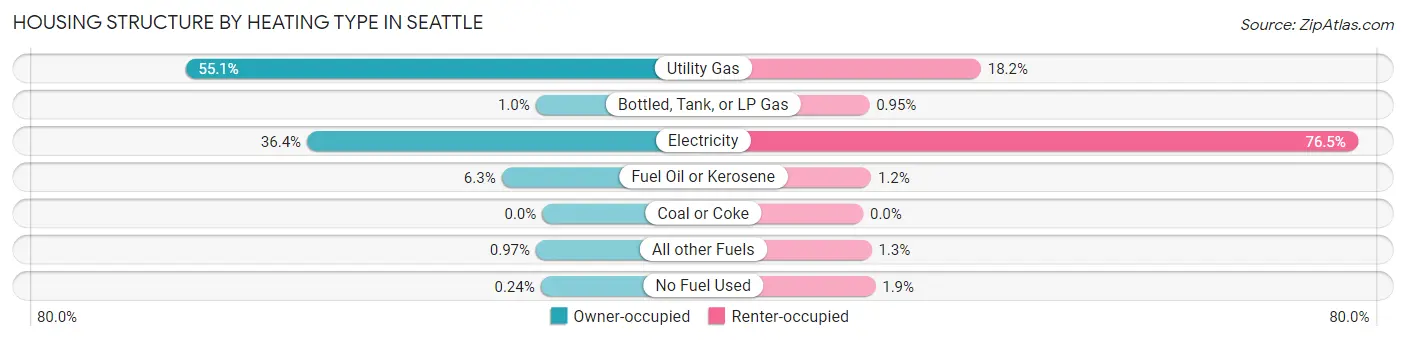
| Heating Type | Owner-occupied | Renter-occupied |
| Utility Gas | 84,621 (55.1%) | 34,898 (18.2%) |
| Bottled, Tank, or LP Gas | 1,552 (1.0%) | 1,814 (0.9%) |
| Electricity | 55,801 (36.4%) | 146,602 (76.4%) |
| Fuel Oil or Kerosene | 9,644 (6.3%) | 2,347 (1.2%) |
| Coal or Coke | 0 (0.0%) | 0 (0.0%) |
| All other Fuels | 1,495 (1.0%) | 2,489 (1.3%) |
| No Fuel Used | 364 (0.2%) | 3,619 (1.9%) |
| Total | 153,477 (100.0%) | 191,769 (100.0%) |
Household Vehicle Usage in Seattle
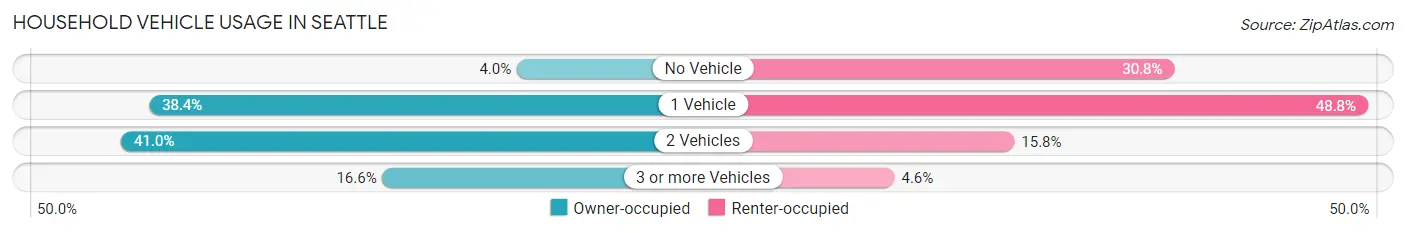
| Vehicles per Household | Owner-occupied | Renter-occupied |
| No Vehicle | 6,191 (4.0%) | 58,971 (30.7%) |
| 1 Vehicle | 58,913 (38.4%) | 93,594 (48.8%) |
| 2 Vehicles | 62,905 (41.0%) | 30,330 (15.8%) |
| 3 or more Vehicles | 25,468 (16.6%) | 8,874 (4.6%) |
| Total | 153,477 (100.0%) | 191,769 (100.0%) |
Real Estate & Mortgages in Seattle
Real Estate and Mortgage Overview in Seattle
| Characteristic | Without Mortgage | With Mortgage |
| Housing Units | 43,692 | 109,785 |
| Median Property Value | $876,300 | $881,200 |
| Median Household Income | $108,899 | $70,940 |
| Monthly Housing Costs | $1,081 | $63,667 |
| Real Estate Taxes | $6,977 | $1,433 |
Property Value by Mortgage Status in Seattle
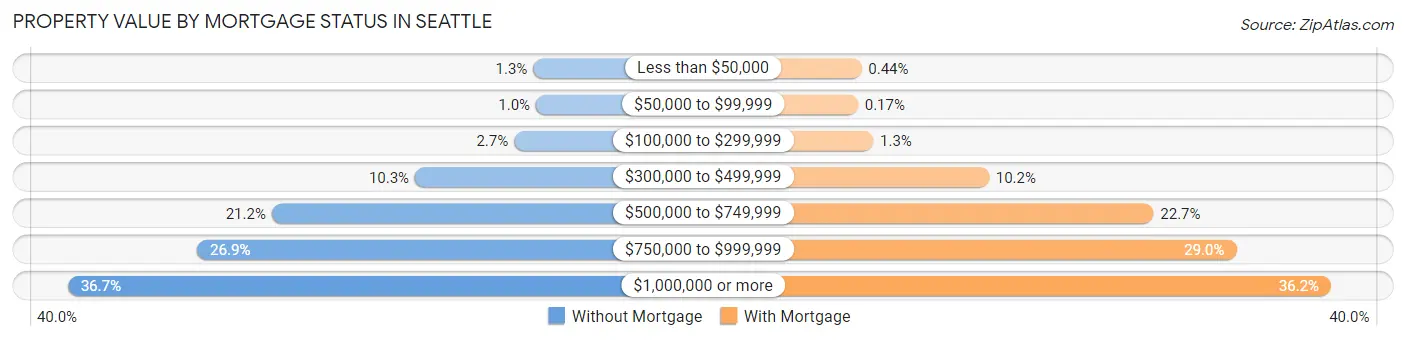
| Property Value | Without Mortgage | With Mortgage |
| Less than $50,000 | 548 (1.3%) | 480 (0.4%) |
| $50,000 to $99,999 | 454 (1.0%) | 182 (0.2%) |
| $100,000 to $299,999 | 1,184 (2.7%) | 1,466 (1.3%) |
| $300,000 to $499,999 | 4,484 (10.3%) | 11,144 (10.2%) |
| $500,000 to $749,999 | 9,250 (21.2%) | 24,906 (22.7%) |
| $750,000 to $999,999 | 11,732 (26.9%) | 31,848 (29.0%) |
| $1,000,000 or more | 16,040 (36.7%) | 39,759 (36.2%) |
| Total | 43,692 (100.0%) | 109,785 (100.0%) |
Household Income by Mortgage Status in Seattle
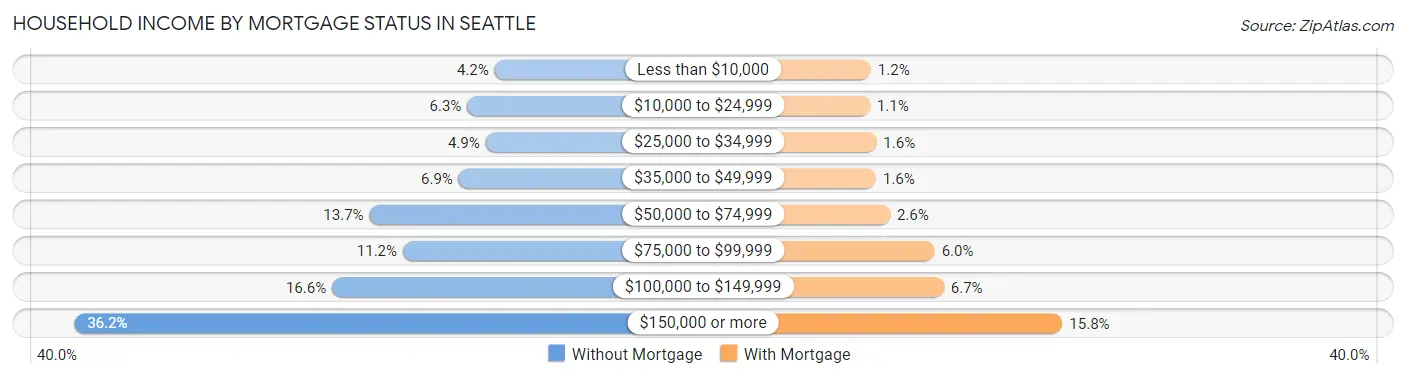
| Household Income | Without Mortgage | With Mortgage |
| Less than $10,000 | 1,830 (4.2%) | 1,288 (1.2%) |
| $10,000 to $24,999 | 2,745 (6.3%) | 1,205 (1.1%) |
| $25,000 to $34,999 | 2,131 (4.9%) | 1,744 (1.6%) |
| $35,000 to $49,999 | 3,029 (6.9%) | 1,715 (1.6%) |
| $50,000 to $74,999 | 6,001 (13.7%) | 2,876 (2.6%) |
| $75,000 to $99,999 | 4,884 (11.2%) | 6,621 (6.0%) |
| $100,000 to $149,999 | 7,246 (16.6%) | 7,386 (6.7%) |
| $150,000 or more | 15,826 (36.2%) | 17,298 (15.8%) |
| Total | 43,692 (100.0%) | 109,785 (100.0%) |
Property Value to Household Income Ratio in Seattle
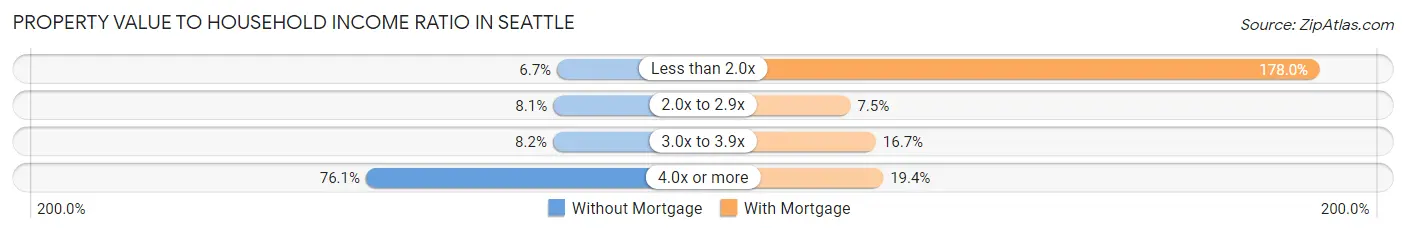
| Value-to-Income Ratio | Without Mortgage | With Mortgage |
| Less than 2.0x | 2,908 (6.7%) | 195,381 (178.0%) |
| 2.0x to 2.9x | 3,524 (8.1%) | 8,189 (7.5%) |
| 3.0x to 3.9x | 3,571 (8.2%) | 18,345 (16.7%) |
| 4.0x or more | 33,230 (76.1%) | 21,246 (19.4%) |
| Total | 43,692 (100.0%) | 109,785 (100.0%) |
Real Estate Taxes by Mortgage Status in Seattle
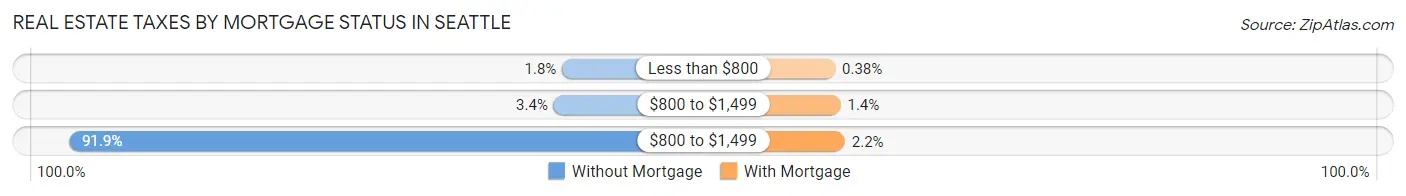
| Property Taxes | Without Mortgage | With Mortgage |
| Less than $800 | 791 (1.8%) | 414 (0.4%) |
| $800 to $1,499 | 1,462 (3.4%) | 1,506 (1.4%) |
| $800 to $1,499 | 40,148 (91.9%) | 2,363 (2.1%) |
| Total | 43,692 (100.0%) | 109,785 (100.0%) |
Health & Disability in Seattle
Health Insurance Coverage by Age in Seattle
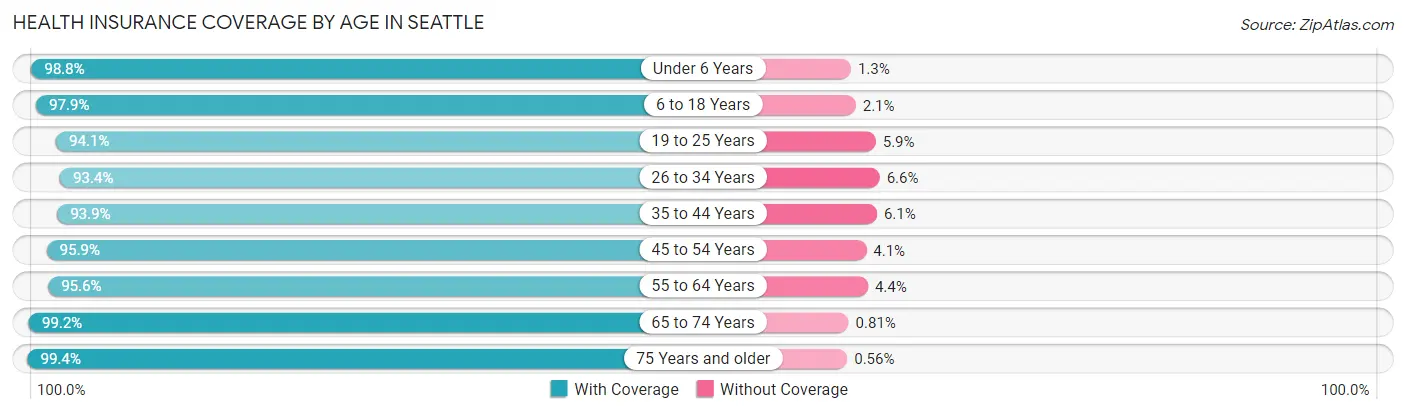
| Age Bracket | With Coverage | Without Coverage |
| Under 6 Years | 37,093 (98.8%) | 470 (1.3%) |
| 6 to 18 Years | 71,667 (97.9%) | 1,564 (2.1%) |
| 19 to 25 Years | 81,077 (94.1%) | 5,055 (5.9%) |
| 26 to 34 Years | 152,562 (93.4%) | 10,797 (6.6%) |
| 35 to 44 Years | 109,204 (93.9%) | 7,076 (6.1%) |
| 45 to 54 Years | 85,220 (95.9%) | 3,656 (4.1%) |
| 55 to 64 Years | 69,192 (95.6%) | 3,194 (4.4%) |
| 65 to 74 Years | 55,577 (99.2%) | 455 (0.8%) |
| 75 Years and older | 34,796 (99.4%) | 195 (0.6%) |
| Total | 696,388 (95.6%) | 32,462 (4.4%) |
Health Insurance Coverage by Citizenship Status in Seattle
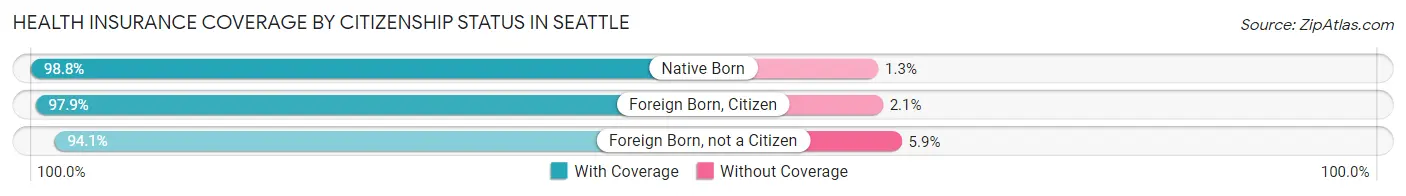
| Citizenship Status | With Coverage | Without Coverage |
| Native Born | 37,093 (98.8%) | 470 (1.3%) |
| Foreign Born, Citizen | 71,667 (97.9%) | 1,564 (2.1%) |
| Foreign Born, not a Citizen | 81,077 (94.1%) | 5,055 (5.9%) |
Health Insurance Coverage by Household Income in Seattle
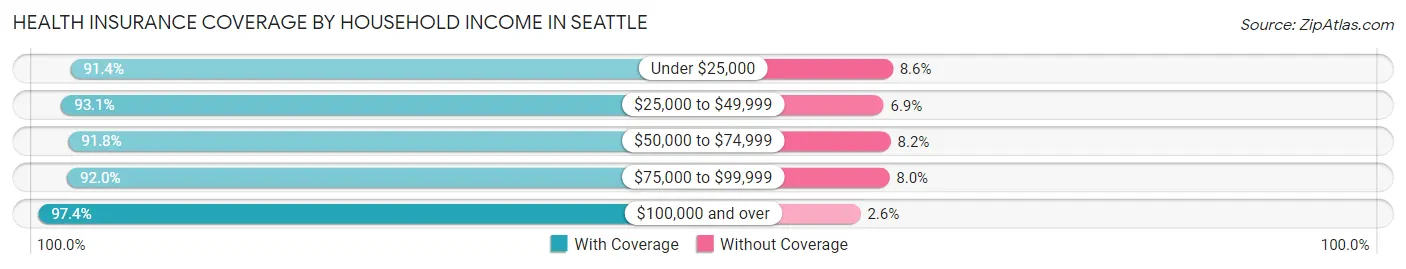
| Household Income | With Coverage | Without Coverage |
| Under $25,000 | 51,141 (91.4%) | 4,813 (8.6%) |
| $25,000 to $49,999 | 57,425 (93.1%) | 4,243 (6.9%) |
| $50,000 to $74,999 | 60,974 (91.8%) | 5,454 (8.2%) |
| $75,000 to $99,999 | 58,293 (92.0%) | 5,055 (8.0%) |
| $100,000 and over | 448,724 (97.4%) | 11,783 (2.6%) |
Public vs Private Health Insurance Coverage by Age in Seattle
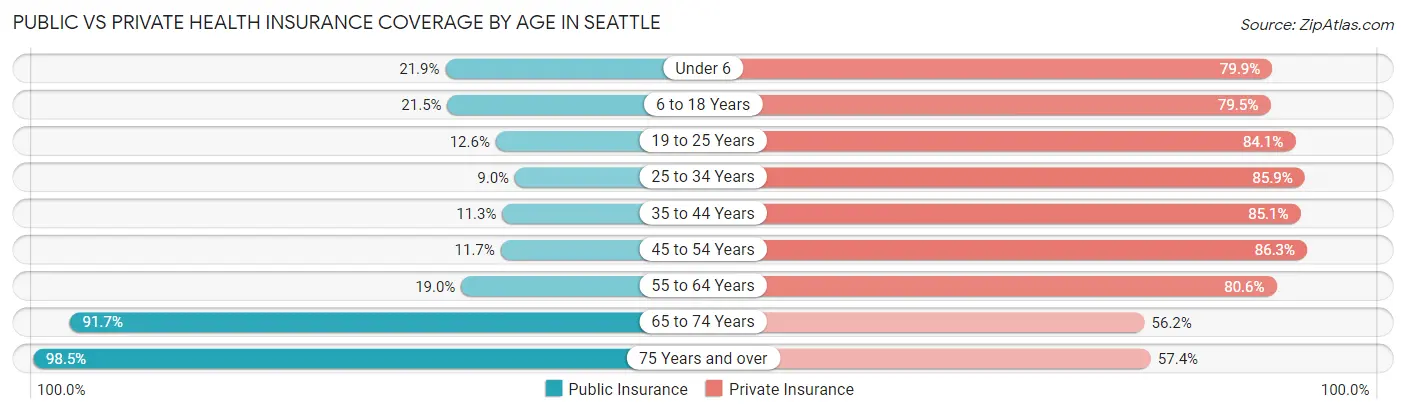
| Age Bracket | Public Insurance | Private Insurance |
| Under 6 | 8,230 (21.9%) | 30,000 (79.9%) |
| 6 to 18 Years | 15,758 (21.5%) | 58,212 (79.5%) |
| 19 to 25 Years | 10,806 (12.6%) | 72,464 (84.1%) |
| 25 to 34 Years | 14,666 (9.0%) | 140,326 (85.9%) |
| 35 to 44 Years | 13,178 (11.3%) | 98,952 (85.1%) |
| 45 to 54 Years | 10,357 (11.7%) | 76,716 (86.3%) |
| 55 to 64 Years | 13,728 (19.0%) | 58,375 (80.6%) |
| 65 to 74 Years | 51,354 (91.6%) | 31,495 (56.2%) |
| 75 Years and over | 34,447 (98.5%) | 20,077 (57.4%) |
| Total | 172,524 (23.7%) | 586,617 (80.5%) |
Disability Status by Sex by Age in Seattle
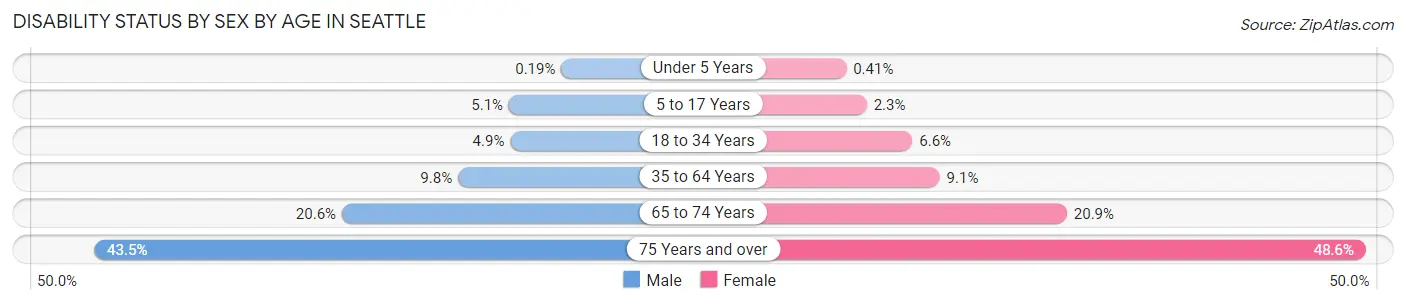
| Age Bracket | Male | Female |
| Under 5 Years | 30 (0.2%) | 65 (0.4%) |
| 5 to 17 Years | 1,814 (5.1%) | 803 (2.3%) |
| 18 to 34 Years | 6,552 (4.9%) | 8,159 (6.6%) |
| 35 to 64 Years | 14,279 (9.8%) | 11,949 (9.1%) |
| 65 to 74 Years | 5,554 (20.5%) | 6,058 (20.9%) |
| 75 Years and over | 6,098 (43.5%) | 10,206 (48.6%) |
Disability Class by Sex by Age in Seattle
Disability Class: Hearing Difficulty
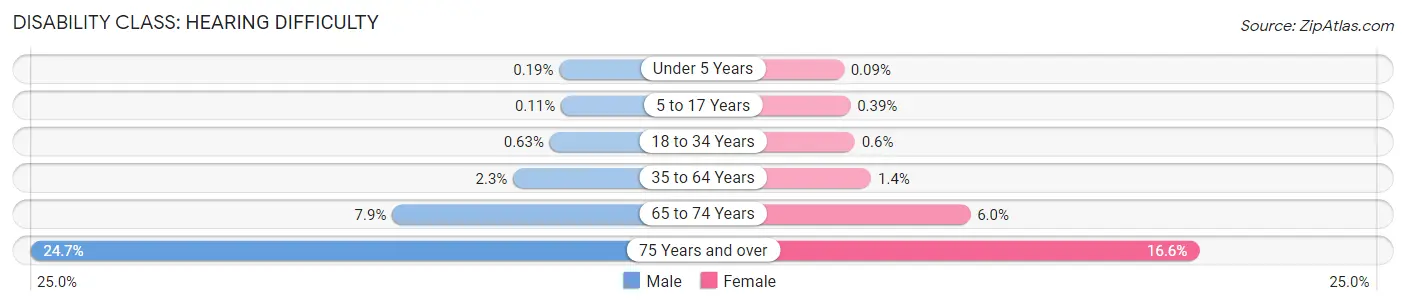
| Age Bracket | Male | Female |
| Under 5 Years | 30 (0.2%) | 15 (0.1%) |
| 5 to 17 Years | 38 (0.1%) | 136 (0.4%) |
| 18 to 34 Years | 834 (0.6%) | 746 (0.6%) |
| 35 to 64 Years | 3,396 (2.3%) | 1,785 (1.4%) |
| 65 to 74 Years | 2,147 (7.9%) | 1,730 (6.0%) |
| 75 Years and over | 3,464 (24.7%) | 3,479 (16.6%) |
Disability Class: Vision Difficulty
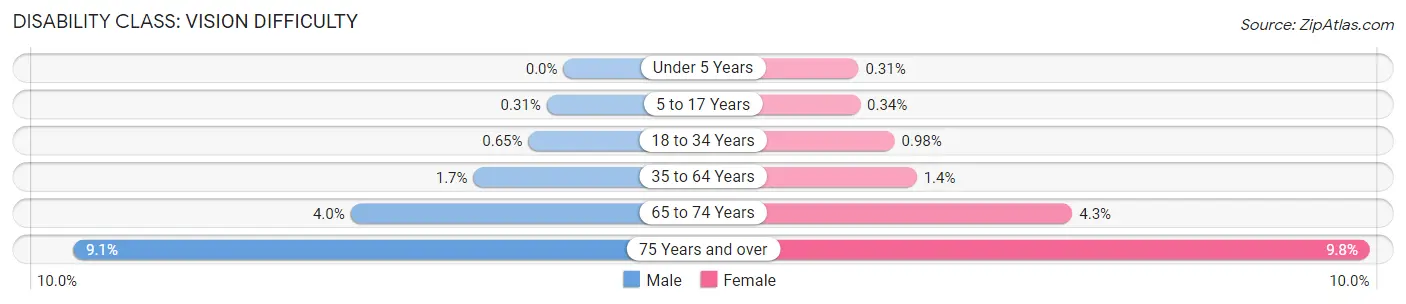
| Age Bracket | Male | Female |
| Under 5 Years | 0 (0.0%) | 50 (0.3%) |
| 5 to 17 Years | 111 (0.3%) | 118 (0.3%) |
| 18 to 34 Years | 859 (0.6%) | 1,217 (1.0%) |
| 35 to 64 Years | 2,430 (1.7%) | 1,829 (1.4%) |
| 65 to 74 Years | 1,067 (4.0%) | 1,242 (4.3%) |
| 75 Years and over | 1,274 (9.1%) | 2,057 (9.8%) |
Disability Class: Cognitive Difficulty
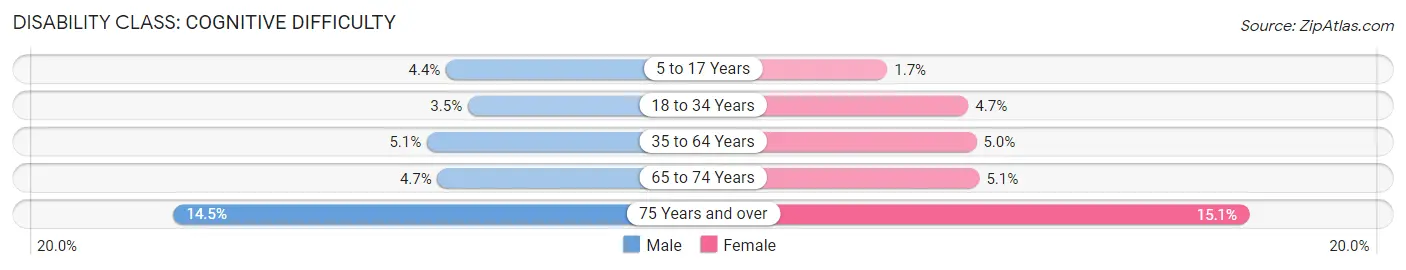
| Age Bracket | Male | Female |
| 5 to 17 Years | 1,562 (4.3%) | 587 (1.7%) |
| 18 to 34 Years | 4,713 (3.5%) | 5,853 (4.7%) |
| 35 to 64 Years | 7,389 (5.1%) | 6,580 (5.0%) |
| 65 to 74 Years | 1,262 (4.7%) | 1,481 (5.1%) |
| 75 Years and over | 2,026 (14.5%) | 3,171 (15.1%) |
Disability Class: Ambulatory Difficulty
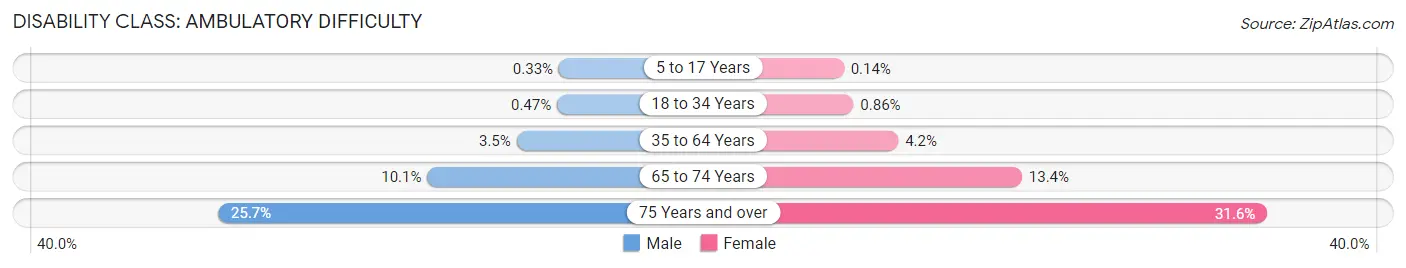
| Age Bracket | Male | Female |
| 5 to 17 Years | 119 (0.3%) | 50 (0.1%) |
| 18 to 34 Years | 622 (0.5%) | 1,073 (0.9%) |
| 35 to 64 Years | 5,071 (3.5%) | 5,510 (4.2%) |
| 65 to 74 Years | 2,731 (10.1%) | 3,879 (13.4%) |
| 75 Years and over | 3,593 (25.7%) | 6,628 (31.6%) |
Disability Class: Self-Care Difficulty
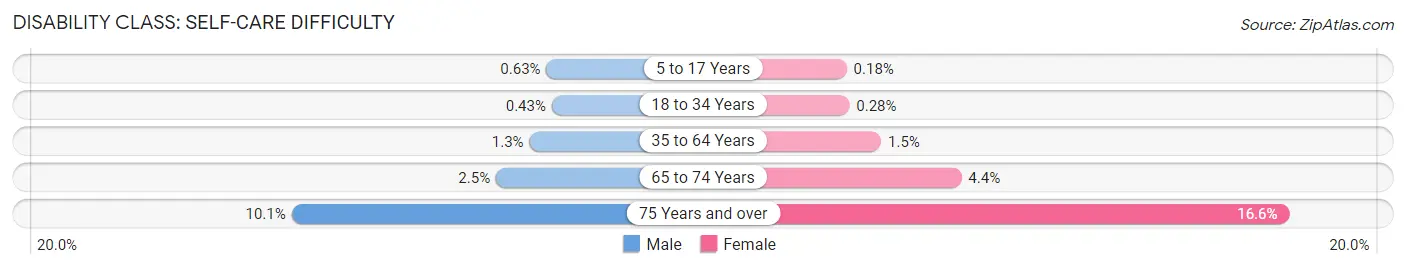
| Age Bracket | Male | Female |
| 5 to 17 Years | 225 (0.6%) | 64 (0.2%) |
| 18 to 34 Years | 570 (0.4%) | 348 (0.3%) |
| 35 to 64 Years | 1,842 (1.3%) | 1,917 (1.5%) |
| 65 to 74 Years | 676 (2.5%) | 1,289 (4.4%) |
| 75 Years and over | 1,413 (10.1%) | 3,485 (16.6%) |
Technology Access in Seattle
Computing Device Access in Seattle
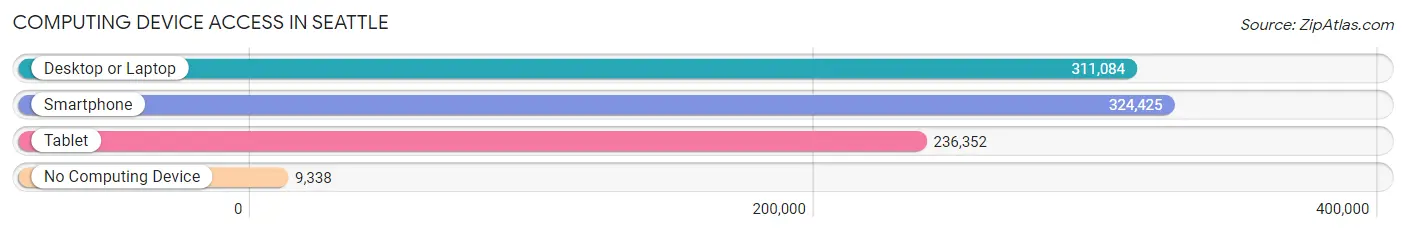
| Device Type | # Households | % Households |
| Desktop or Laptop | 311,084 | 90.1% |
| Smartphone | 324,425 | 94.0% |
| Tablet | 236,352 | 68.5% |
| No Computing Device | 9,338 | 2.7% |
| Total | 345,246 | 100.0% |
Internet Access in Seattle
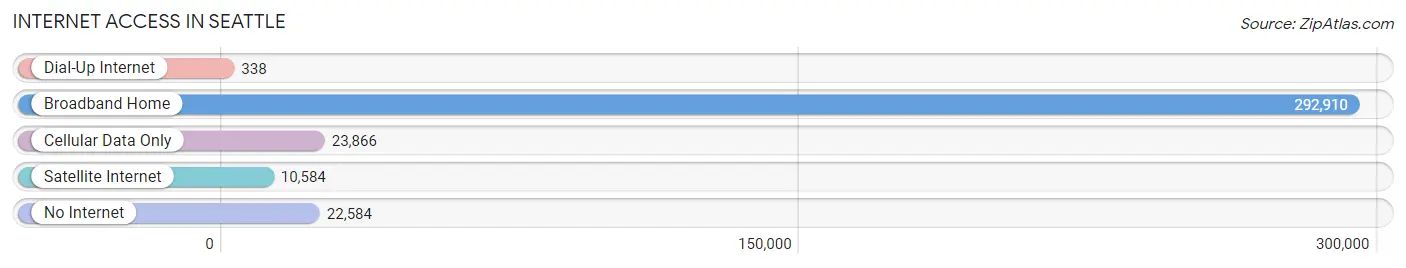
| Internet Type | # Households | % Households |
| Dial-Up Internet | 338 | 0.1% |
| Broadband Home | 292,910 | 84.8% |
| Cellular Data Only | 23,866 | 6.9% |
| Satellite Internet | 10,584 | 3.1% |
| No Internet | 22,584 | 6.5% |
| Total | 345,246 | 100.0% |
Seattle Summary
Seattle, Washington is a major city located in the Pacific Northwest region of the United States. It is the largest city in the state of Washington and the county seat of King County. Seattle is situated on an isthmus between Puget Sound and Lake Washington, about 100 miles south of the Canada–United States border. The city is home to an estimated 730,000 people, making it the largest city in the Pacific Northwest region and the 15th largest in the United States.
History
The area that is now Seattle was first inhabited by Native American tribes, including the Duwamish, Suquamish, and Muckleshoot. The first European settlers arrived in the area in 1851, led by Arthur A. Denny and his party. The settlement was named "Seattle" after Chief Sealth of the Duwamish and Suquamish tribes. The city quickly grew, and by 1853, it had a population of over 2,000.
In 1889, Seattle was incorporated as a city. The city experienced a period of rapid growth in the late 19th and early 20th centuries, fueled by the Klondike Gold Rush and the arrival of the Great Northern Railway. By 1910, the population had grown to over 80,000.
During the mid-20th century, Seattle experienced a period of economic decline, as the city's manufacturing and shipping industries declined. However, the city experienced a resurgence in the late 20th century, as the technology industry began to take off.
Geography
Seattle is located in the Pacific Northwest region of the United States, on an isthmus between Puget Sound and Lake Washington. The city is surrounded by mountains, including the Cascade Range to the east and the Olympic Mountains to the west. The city is also home to numerous bodies of water, including Lake Union, Green Lake, and the Duwamish River.
The city has a total area of 142.5 square miles, of which 135.6 square miles is land and 6.9 square miles is water. The city has a mild climate, with temperatures ranging from an average low of 37°F in January to an average high of 75°F in July.
Economy
Seattle's economy is largely driven by the technology industry, with major companies such as Amazon, Microsoft, and Boeing having their headquarters in the city. Other major industries in the city include finance, healthcare, and tourism.
The city is also home to numerous universities and colleges, including the University of Washington, Seattle University, and Seattle Pacific University. These institutions provide a large number of jobs in the city, as well as a highly educated workforce.
Demographics
As of 2019, the population of Seattle was estimated to be 730,000. The city has a diverse population, with the largest racial/ethnic groups being White (60.2%), Asian (15.2%), Black or African American (7.9%), and Hispanic or Latino (7.2%).
The median household income in Seattle is $86,837, and the median home value is $735,000. The city has a high cost of living, with the average rent for a one-bedroom apartment being $2,000.
Conclusion
Seattle, Washington is a major city located in the Pacific Northwest region of the United States. It is the largest city in the state of Washington and the county seat of King County. The city has a long and rich history, and has experienced a period of rapid growth in the late 19th and early 20th centuries. Seattle is situated on an isthmus between Puget Sound and Lake Washington, and is home to an estimated 730,000 people. The city's economy is largely driven by the technology industry, and it is also home to numerous universities and colleges. The city has a diverse population, with the largest racial/ethnic groups being White, Asian, Black or African American, and Hispanic or Latino.
Common Questions
What is Per Capita Income in Seattle?
Per Capita income in Seattle is $77,616.
What is the Median Family Income in Seattle?
Median Family Income in Seattle is $169,878.
What is the Median Household income in Seattle?
Median Household Income in Seattle is $116,068.
What is Income or Wage Gap in Seattle?
Income or Wage Gap in Seattle is 27.7%.
Women in Seattle earn 72.3 cents for every dollar earned by a man.
What is Family Income Deficit in Seattle?
Family Income Deficit in Seattle is $10,926.
Families that are below poverty line in Seattle earn $10,926 less on average than the poverty threshold level.
What is Inequality or Gini Index in Seattle?
Inequality or Gini Index in Seattle is 0.49.
What is the Total Population of Seattle?
Total Population of Seattle is 734,603.
What is the Total Male Population of Seattle?
Total Male Population of Seattle is 375,562.
What is the Total Female Population of Seattle?
Total Female Population of Seattle is 359,041.
What is the Ratio of Males per 100 Females in Seattle?
There are 104.60 Males per 100 Females in Seattle.
What is the Ratio of Females per 100 Males in Seattle?
There are 95.60 Females per 100 Males in Seattle.
What is the Median Population Age in Seattle?
Median Population Age in Seattle is 35.4 Years.
What is the Average Family Size in Seattle
Average Family Size in Seattle is 2.8 People.
What is the Average Household Size in Seattle
Average Household Size in Seattle is 2.0 People.
How Large is the Labor Force in Seattle?
There are 473,869 People in the Labor Forcein in Seattle.
What is the Percentage of People in the Labor Force in Seattle?
73.9% of People are in the Labor Force in Seattle.
What is the Unemployment Rate in Seattle?
Unemployment Rate in Seattle is 4.2%.