Bothell West, WA Map & Demographics
Bothell West Map
Bothell West Overview
$64,056
PER CAPITA INCOME
$162,883
AVG FAMILY INCOME
$143,551
AVG HOUSEHOLD INCOME
36.5%
WAGE / INCOME GAP [ % ]
63.5¢/ $1
WAGE / INCOME GAP [ $ ]
0.39
INEQUALITY / GINI INDEX
20,530
TOTAL POPULATION
10,703
MALE POPULATION
9,827
FEMALE POPULATION
108.91
MALES / 100 FEMALES
91.82
FEMALES / 100 MALES
38.8
MEDIAN AGE
3.1
AVG FAMILY SIZE
2.7
AVG HOUSEHOLD SIZE
11,796
LABOR FORCE [ PEOPLE ]
71.2%
PERCENT IN LABOR FORCE
3.2%
UNEMPLOYMENT RATE
Income in Bothell West
Income Overview in Bothell West
Per Capita Income in Bothell West is $64,056, while median incomes of families and households are $162,883 and $143,551 respectively.
| Characteristic | Number | Measure |
| Per Capita Income | 20,530 | $64,056 |
| Median Family Income | 5,466 | $162,883 |
| Mean Family Income | 5,466 | $194,042 |
| Median Household Income | 7,463 | $143,551 |
| Mean Household Income | 7,463 | $172,428 |
| Income Deficit | 5,466 | $0 |
| Wage / Income Gap (%) | 20,530 | 36.55% |
| Wage / Income Gap ($) | 20,530 | 63.45¢ per $1 |
| Gini / Inequality Index | 20,530 | 0.39 |
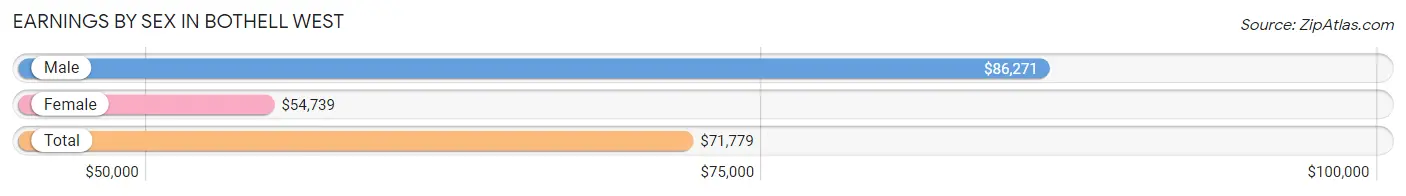
Earnings by Sex in Bothell West
Average Earnings in Bothell West are $71,779, $86,271 for men and $54,739 for women, a difference of 36.5%.
| Sex | Number | Average Earnings |
| Male | 7,178 (57.9%) | $86,271 |
| Female | 5,220 (42.1%) | $54,739 |
| Total | 12,398 (100.0%) | $71,779 |
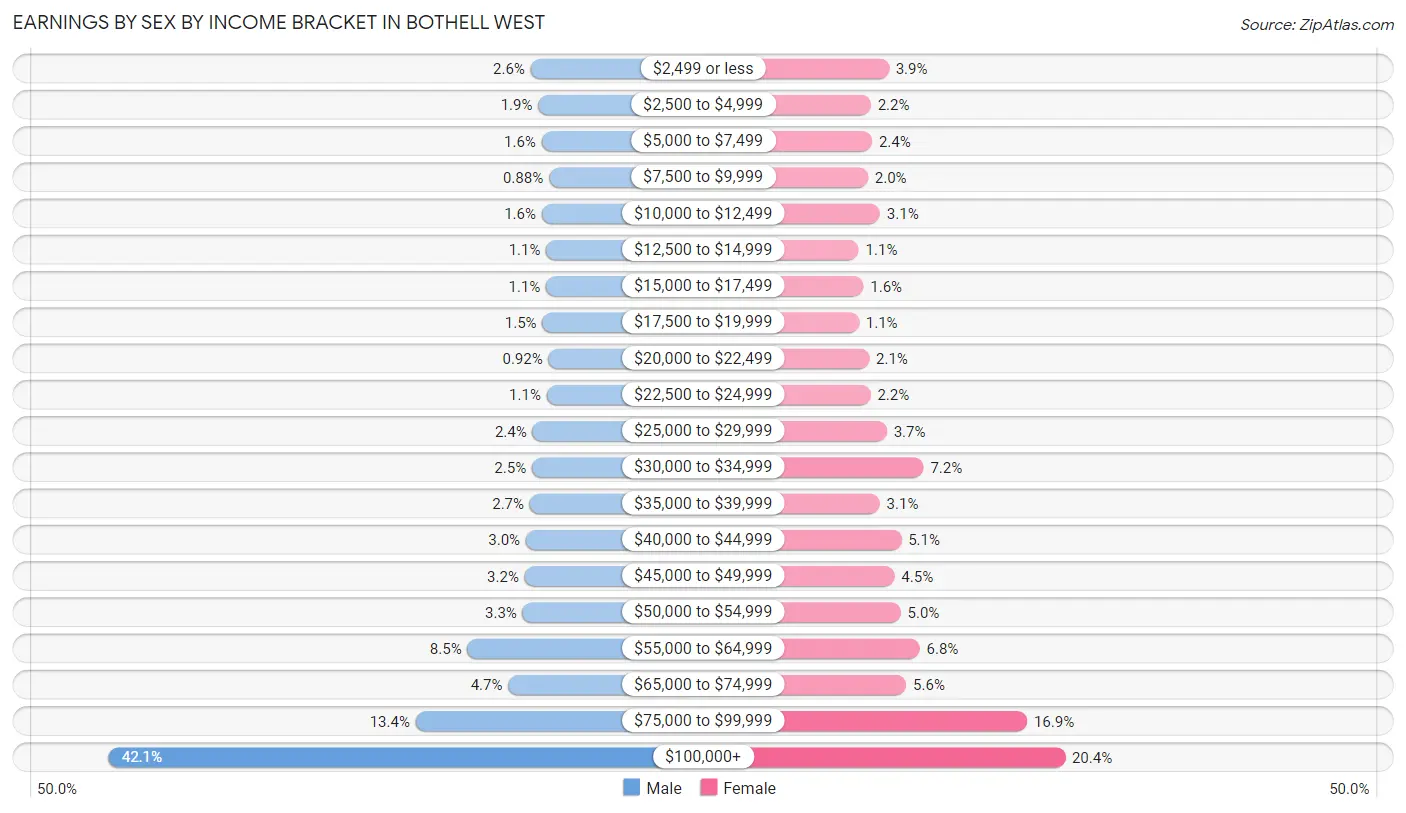
Earnings by Sex by Income Bracket in Bothell West
The most common earnings brackets in Bothell West are $100,000+ for men (3,023 | 42.1%) and $100,000+ for women (1,067 | 20.4%).
| Income | Male | Female |
| $2,499 or less | 186 (2.6%) | 205 (3.9%) |
| $2,500 to $4,999 | 135 (1.9%) | 117 (2.2%) |
| $5,000 to $7,499 | 112 (1.6%) | 123 (2.4%) |
| $7,500 to $9,999 | 63 (0.9%) | 103 (2.0%) |
| $10,000 to $12,499 | 111 (1.5%) | 162 (3.1%) |
| $12,500 to $14,999 | 81 (1.1%) | 58 (1.1%) |
| $15,000 to $17,499 | 82 (1.1%) | 81 (1.5%) |
| $17,500 to $19,999 | 107 (1.5%) | 59 (1.1%) |
| $20,000 to $22,499 | 66 (0.9%) | 109 (2.1%) |
| $22,500 to $24,999 | 78 (1.1%) | 116 (2.2%) |
| $25,000 to $29,999 | 174 (2.4%) | 195 (3.7%) |
| $30,000 to $34,999 | 177 (2.5%) | 375 (7.2%) |
| $35,000 to $39,999 | 192 (2.7%) | 161 (3.1%) |
| $40,000 to $44,999 | 218 (3.0%) | 266 (5.1%) |
| $45,000 to $49,999 | 226 (3.2%) | 233 (4.5%) |
| $50,000 to $54,999 | 240 (3.3%) | 263 (5.0%) |
| $55,000 to $64,999 | 611 (8.5%) | 356 (6.8%) |
| $65,000 to $74,999 | 337 (4.7%) | 290 (5.6%) |
| $75,000 to $99,999 | 959 (13.4%) | 881 (16.9%) |
| $100,000+ | 3,023 (42.1%) | 1,067 (20.4%) |
| Total | 7,178 (100.0%) | 5,220 (100.0%) |
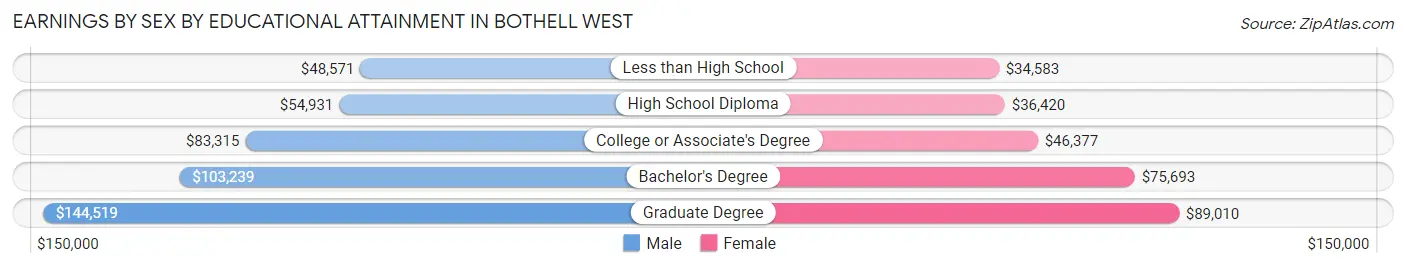
Earnings by Sex by Educational Attainment in Bothell West
Average earnings in Bothell West are $95,481 for men and $63,879 for women, a difference of 33.1%. Men with an educational attainment of graduate degree enjoy the highest average annual earnings of $144,519, while those with less than high school education earn the least with $48,571. Women with an educational attainment of graduate degree earn the most with the average annual earnings of $89,010, while those with less than high school education have the smallest earnings of $34,583.
| Educational Attainment | Male Income | Female Income |
| Less than High School | $48,571 | $34,583 |
| High School Diploma | $54,931 | $36,420 |
| College or Associate's Degree | $83,315 | $46,377 |
| Bachelor's Degree | $103,239 | $75,693 |
| Graduate Degree | $144,519 | $89,010 |
| Total | $95,481 | $63,879 |
Family Income in Bothell West
Family Income Brackets in Bothell West
According to the Bothell West family income data, there are 1,995 families falling into the $200,000+ income range, which is the most common income bracket and makes up 36.5% of all families. Conversely, the $10,000 to $14,999 income bracket is the least frequent group with only 27 families (0.5%) belonging to this category.
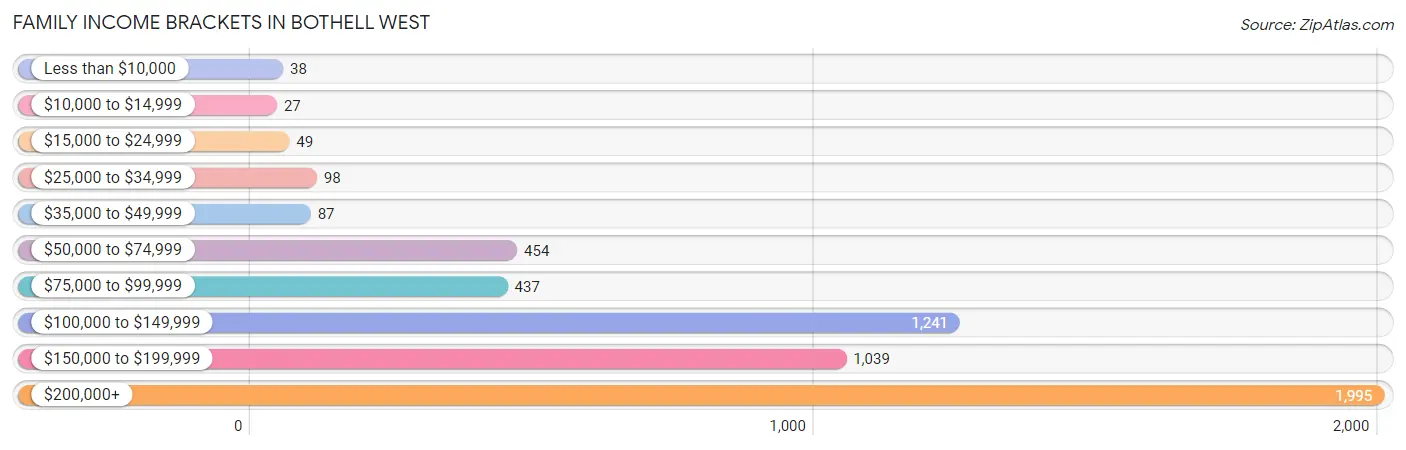
| Income Bracket | # Families | % Families |
| Less than $10,000 | 38 | 0.7% |
| $10,000 to $14,999 | 27 | 0.5% |
| $15,000 to $24,999 | 49 | 0.9% |
| $25,000 to $34,999 | 98 | 1.8% |
| $35,000 to $49,999 | 87 | 1.6% |
| $50,000 to $74,999 | 454 | 8.3% |
| $75,000 to $99,999 | 437 | 8.0% |
| $100,000 to $149,999 | 1,241 | 22.7% |
| $150,000 to $199,999 | 1,039 | 19.0% |
| $200,000+ | 1,995 | 36.5% |
Family Income by Famaliy Size in Bothell West
6-person families (214 | 3.9%) account for the highest median family income in Bothell West with $237,195 per family, while 2-person families (2,264 | 41.4%) have the highest median income of $68,558 per family member.
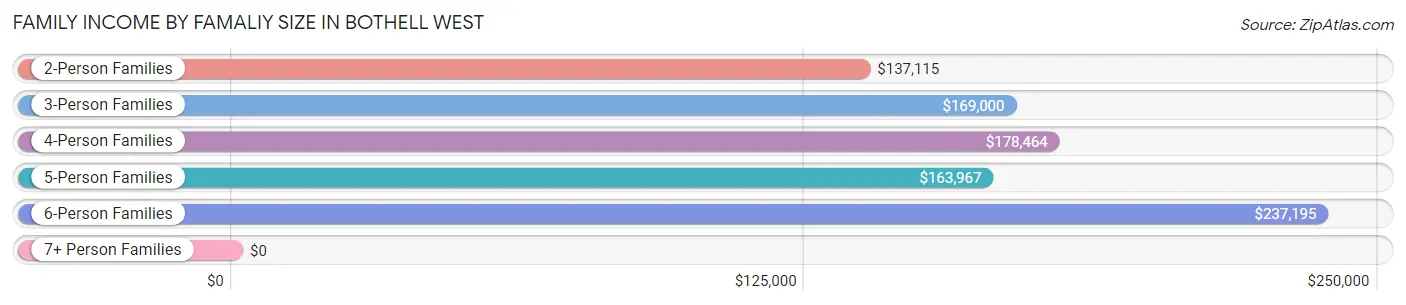
| Income Bracket | # Families | Median Income |
| 2-Person Families | 2,264 (41.4%) | $137,115 |
| 3-Person Families | 1,280 (23.4%) | $169,000 |
| 4-Person Families | 1,399 (25.6%) | $178,464 |
| 5-Person Families | 278 (5.1%) | $163,967 |
| 6-Person Families | 214 (3.9%) | $237,195 |
| 7+ Person Families | 31 (0.6%) | $0 |
| Total | 5,466 (100.0%) | $162,883 |
Family Income by Number of Earners in Bothell West
The median family income in Bothell West is $162,883, with families comprising 3+ earners (761) having the highest median family income of $197,109, while families with no earners (468) have the lowest median family income of $63,690, accounting for 13.9% and 8.6% of families, respectively.
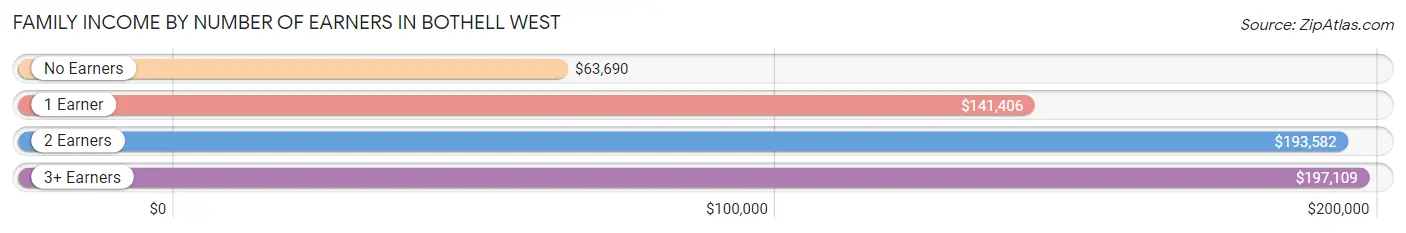
| Number of Earners | # Families | Median Income |
| No Earners | 468 (8.6%) | $63,690 |
| 1 Earner | 1,433 (26.2%) | $141,406 |
| 2 Earners | 2,804 (51.3%) | $193,582 |
| 3+ Earners | 761 (13.9%) | $197,109 |
| Total | 5,466 (100.0%) | $162,883 |
Household Income in Bothell West
Household Income Brackets in Bothell West
With 2,314 households falling in the category, the $200,000+ income range is the most frequent in Bothell West, accounting for 31.0% of all households. In contrast, only 52 households (0.7%) fall into the $10,000 to $14,999 income bracket, making it the least populous group.
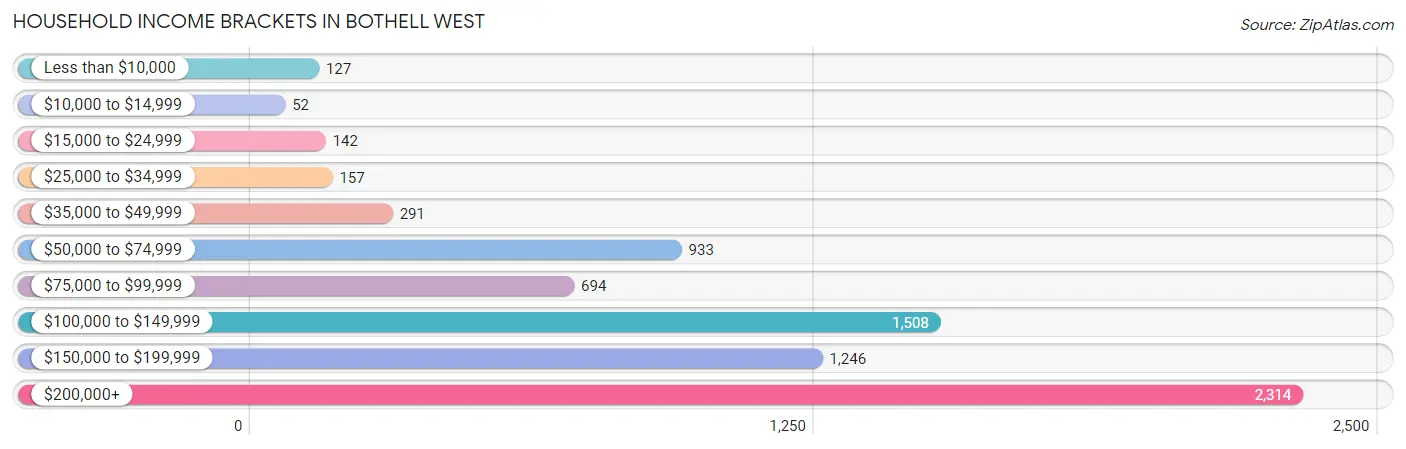
| Income Bracket | # Households | % Households |
| Less than $10,000 | 127 | 1.7% |
| $10,000 to $14,999 | 52 | 0.7% |
| $15,000 to $24,999 | 142 | 1.9% |
| $25,000 to $34,999 | 157 | 2.1% |
| $35,000 to $49,999 | 291 | 3.9% |
| $50,000 to $74,999 | 933 | 12.5% |
| $75,000 to $99,999 | 694 | 9.3% |
| $100,000 to $149,999 | 1,508 | 20.2% |
| $150,000 to $199,999 | 1,246 | 16.7% |
| $200,000+ | 2,314 | 31.0% |
Household Income by Householder Age in Bothell West
The median household income in Bothell West is $143,551, with the highest median household income of $162,984 found in the 25 to 44 years age bracket for the primary householder. A total of 2,926 households (39.2%) fall into this category. Meanwhile, the 65+ years age bracket for the primary householder has the lowest median household income of $72,740, with 1,285 households (17.2%) in this group.
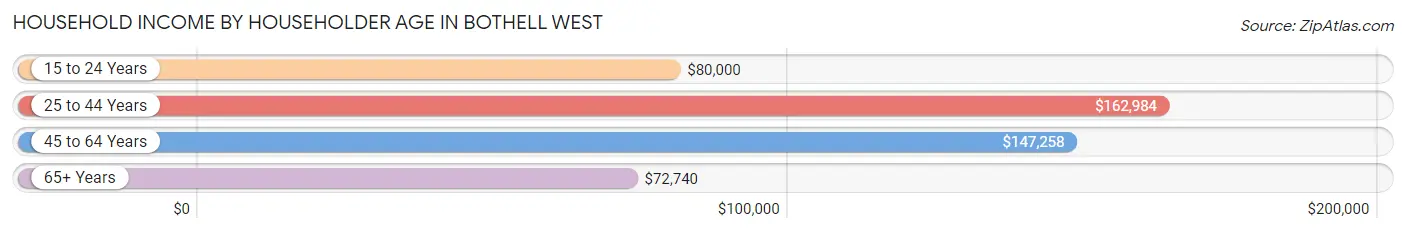
| Income Bracket | # Households | Median Income |
| 15 to 24 Years | 160 (2.1%) | $80,000 |
| 25 to 44 Years | 2,926 (39.2%) | $162,984 |
| 45 to 64 Years | 3,092 (41.4%) | $147,258 |
| 65+ Years | 1,285 (17.2%) | $72,740 |
| Total | 7,463 (100.0%) | $143,551 |
Poverty in Bothell West
Income Below Poverty by Sex and Age in Bothell West
With 2.8% poverty level for males and 3.9% for females among the residents of Bothell West, 18 to 24 year old males and 75 year old and over females are the most vulnerable to poverty, with 105 males (11.7%) and 47 females (11.1%) in their respective age groups living below the poverty level.
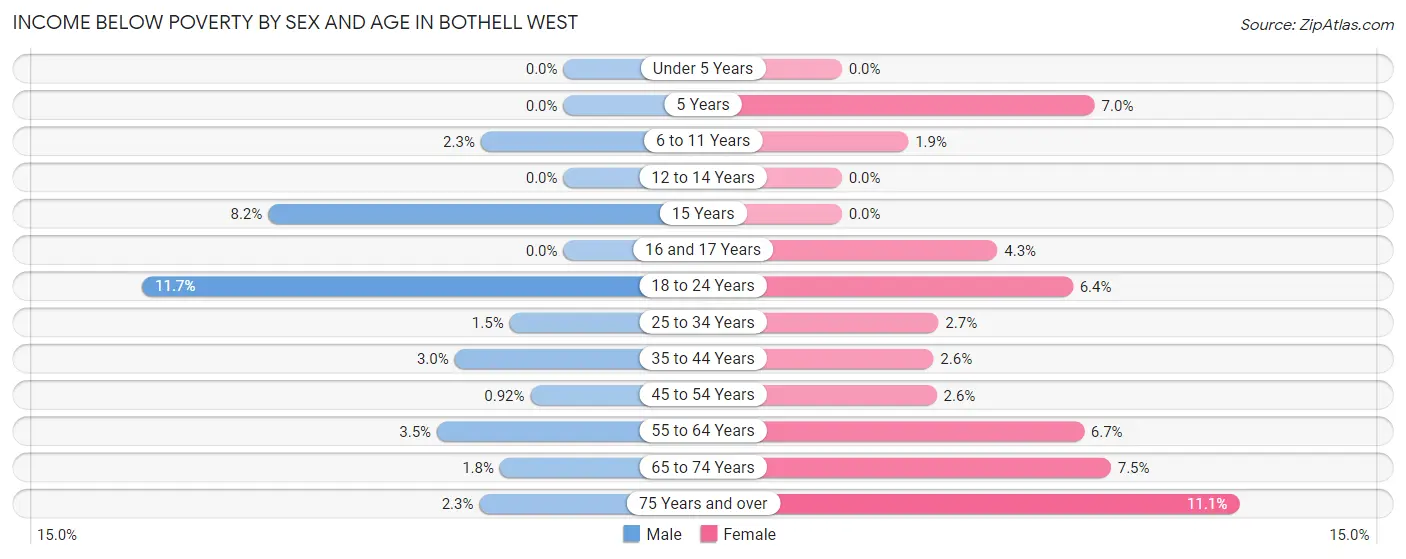
| Age Bracket | Male | Female |
| Under 5 Years | 0 (0.0%) | 0 (0.0%) |
| 5 Years | 0 (0.0%) | 10 (7.0%) |
| 6 to 11 Years | 19 (2.3%) | 11 (1.8%) |
| 12 to 14 Years | 0 (0.0%) | 0 (0.0%) |
| 15 Years | 12 (8.2%) | 0 (0.0%) |
| 16 and 17 Years | 0 (0.0%) | 11 (4.3%) |
| 18 to 24 Years | 105 (11.7%) | 46 (6.4%) |
| 25 to 34 Years | 20 (1.5%) | 39 (2.7%) |
| 35 to 44 Years | 59 (3.0%) | 43 (2.5%) |
| 45 to 54 Years | 16 (0.9%) | 41 (2.6%) |
| 55 to 64 Years | 43 (3.5%) | 79 (6.7%) |
| 65 to 74 Years | 14 (1.8%) | 57 (7.5%) |
| 75 Years and over | 8 (2.3%) | 47 (11.1%) |
| Total | 296 (2.8%) | 384 (3.9%) |
Income Above Poverty by Sex and Age in Bothell West
According to the poverty statistics in Bothell West, males aged under 5 years and females aged under 5 years are the age groups that are most secure financially, with 100.0% of males and 100.0% of females in these age groups living above the poverty line.
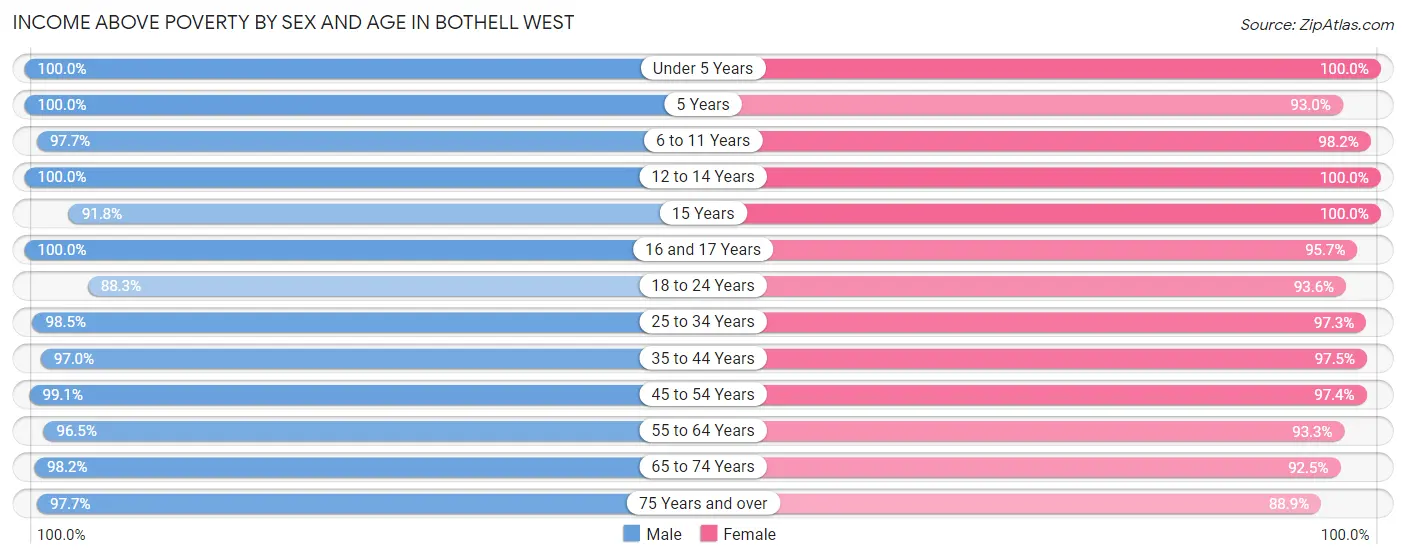
| Age Bracket | Male | Female |
| Under 5 Years | 663 (100.0%) | 678 (100.0%) |
| 5 Years | 83 (100.0%) | 132 (93.0%) |
| 6 to 11 Years | 806 (97.7%) | 584 (98.2%) |
| 12 to 14 Years | 408 (100.0%) | 287 (100.0%) |
| 15 Years | 134 (91.8%) | 102 (100.0%) |
| 16 and 17 Years | 266 (100.0%) | 243 (95.7%) |
| 18 to 24 Years | 790 (88.3%) | 669 (93.6%) |
| 25 to 34 Years | 1,317 (98.5%) | 1,409 (97.3%) |
| 35 to 44 Years | 1,888 (97.0%) | 1,640 (97.5%) |
| 45 to 54 Years | 1,720 (99.1%) | 1,511 (97.4%) |
| 55 to 64 Years | 1,178 (96.5%) | 1,093 (93.3%) |
| 65 to 74 Years | 779 (98.2%) | 704 (92.5%) |
| 75 Years and over | 334 (97.7%) | 378 (88.9%) |
| Total | 10,366 (97.2%) | 9,430 (96.1%) |
Income Below Poverty Among Married-Couple Families in Bothell West
The poverty statistics for married-couple families in Bothell West show that 1.6% or 78 of the total 4,775 families live below the poverty line. Families with no children have the highest poverty rate of 2.4%, comprising of 57 families. On the other hand, families with 3 or 4 children have the lowest poverty rate of 0.0%, which includes 0 families.
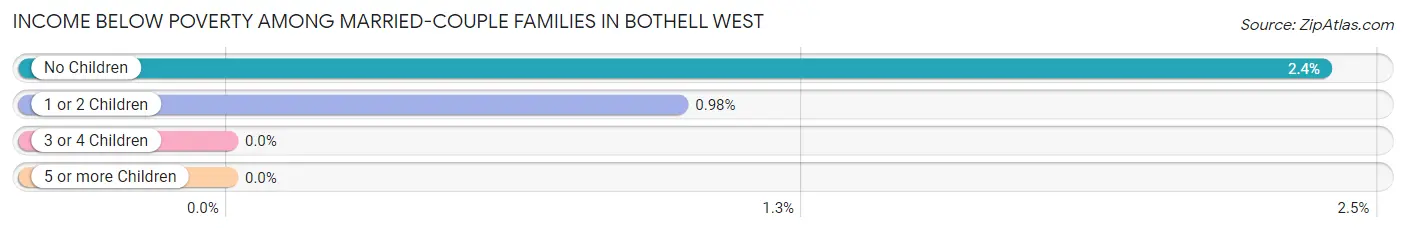
| Children | Above Poverty | Below Poverty |
| No Children | 2,343 (97.6%) | 57 (2.4%) |
| 1 or 2 Children | 2,132 (99.0%) | 21 (1.0%) |
| 3 or 4 Children | 222 (100.0%) | 0 (0.0%) |
| 5 or more Children | 0 (0.0%) | 0 (0.0%) |
| Total | 4,697 (98.4%) | 78 (1.6%) |
Income Below Poverty Among Single-Parent Households in Bothell West
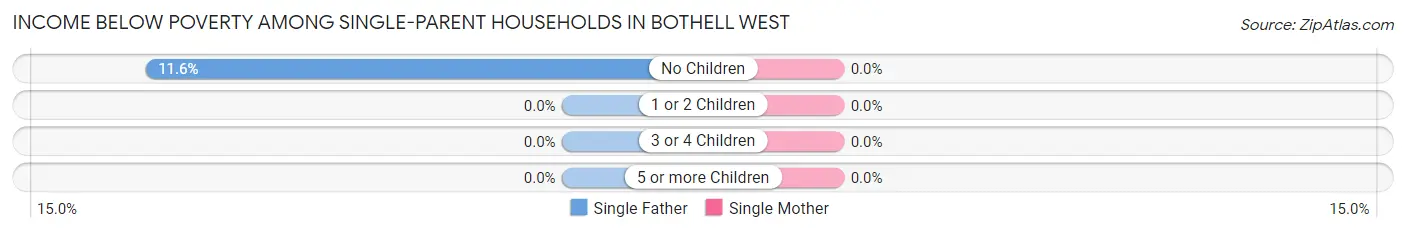
| Children | Single Father | Single Mother |
| No Children | 25 (11.6%) | 0 (0.0%) |
| 1 or 2 Children | 0 (0.0%) | 0 (0.0%) |
| 3 or 4 Children | 0 (0.0%) | 0 (0.0%) |
| 5 or more Children | 0 (0.0%) | 0 (0.0%) |
| Total | 25 (8.7%) | 0 (0.0%) |
Income Below Poverty Among Married-Couple vs Single-Parent Households in Bothell West
The poverty data for Bothell West shows that 78 of the married-couple family households (1.6%) and 25 of the single-parent households (3.6%) are living below the poverty level. Within the married-couple family households, those with no children have the highest poverty rate, with 57 households (2.4%) falling below the poverty line. Among the single-parent households, those with no children have the highest poverty rate, with 25 household (6.1%) living below poverty.
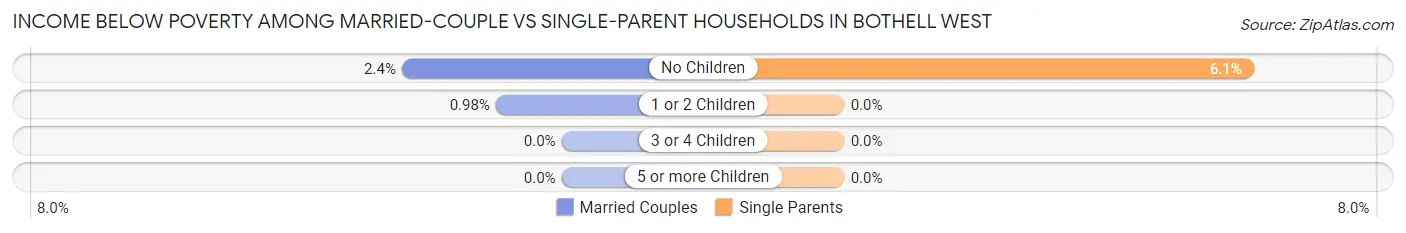
| Children | Married-Couple Families | Single-Parent Households |
| No Children | 57 (2.4%) | 25 (6.1%) |
| 1 or 2 Children | 21 (1.0%) | 0 (0.0%) |
| 3 or 4 Children | 0 (0.0%) | 0 (0.0%) |
| 5 or more Children | 0 (0.0%) | 0 (0.0%) |
| Total | 78 (1.6%) | 25 (3.6%) |
Race in Bothell West
The most populous races in Bothell West are White / Caucasian (12,982 | 63.2%), Asian (4,053 | 19.7%), and Two or more Races (2,139 | 10.4%).
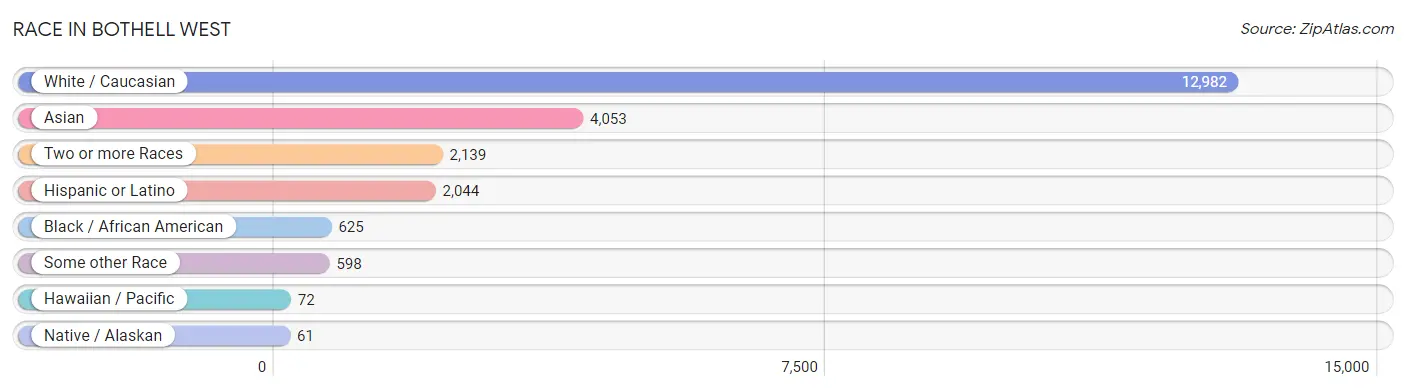
| Race | # Population | % Population |
| Asian | 4,053 | 19.7% |
| Black / African American | 625 | 3.0% |
| Hawaiian / Pacific | 72 | 0.4% |
| Hispanic or Latino | 2,044 | 10.0% |
| Native / Alaskan | 61 | 0.3% |
| White / Caucasian | 12,982 | 63.2% |
| Two or more Races | 2,139 | 10.4% |
| Some other Race | 598 | 2.9% |
| Total | 20,530 | 100.0% |
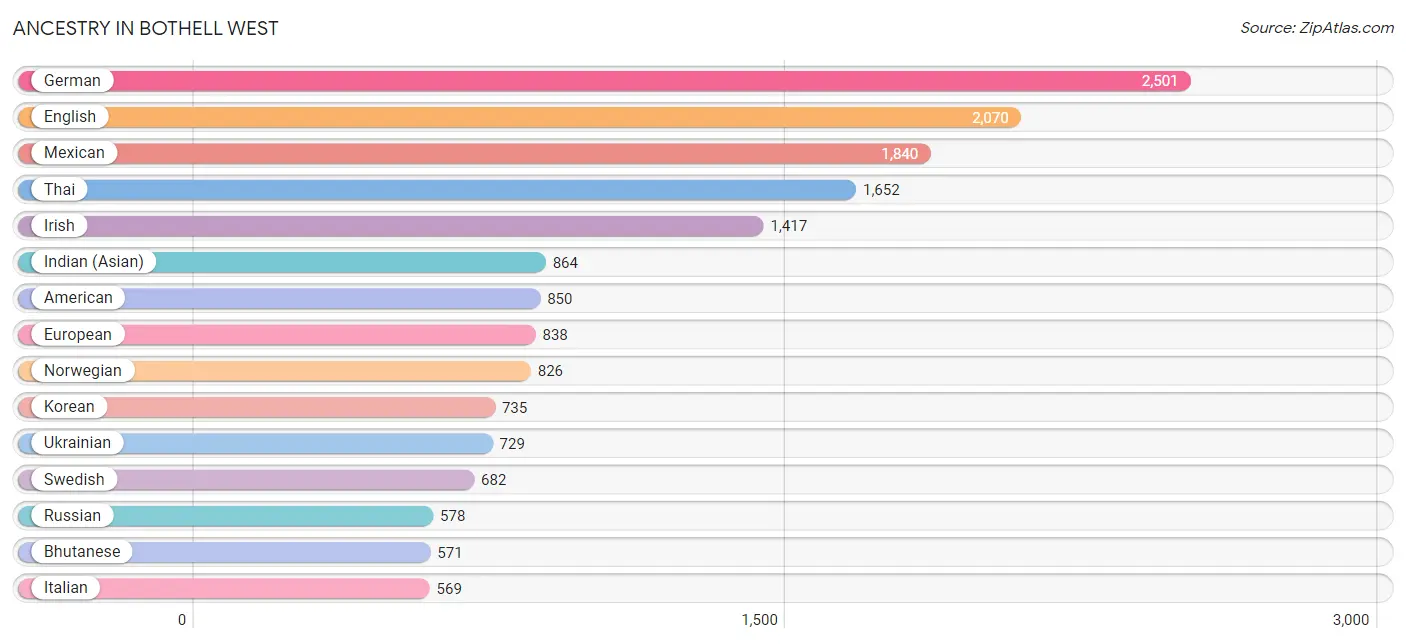
Ancestry in Bothell West
The most populous ancestries reported in Bothell West are German (2,501 | 12.2%), English (2,070 | 10.1%), Mexican (1,840 | 9.0%), Thai (1,652 | 8.1%), and Irish (1,417 | 6.9%), together accounting for 46.2% of all Bothell West residents.
| Ancestry | # Population | % Population |
| Alaskan Athabascan | 12 | 0.1% |
| Aleut | 45 | 0.2% |
| American | 850 | 4.1% |
| Arab | 123 | 0.6% |
| Australian | 28 | 0.1% |
| Austrian | 97 | 0.5% |
| Bahamian | 20 | 0.1% |
| Bhutanese | 571 | 2.8% |
| Blackfeet | 16 | 0.1% |
| Brazilian | 88 | 0.4% |
| British | 160 | 0.8% |
| Bulgarian | 39 | 0.2% |
| Burmese | 535 | 2.6% |
| Cajun | 2 | 0.0% |
| Cambodian | 13 | 0.1% |
| Canadian | 64 | 0.3% |
| Central American | 36 | 0.2% |
| Colombian | 46 | 0.2% |
| Cree | 17 | 0.1% |
| Croatian | 33 | 0.2% |
| Cuban | 101 | 0.5% |
| Czech | 9 | 0.0% |
| Czechoslovakian | 53 | 0.3% |
| Danish | 103 | 0.5% |
| Dutch | 248 | 1.2% |
| Eastern European | 170 | 0.8% |
| English | 2,070 | 10.1% |
| Ethiopian | 45 | 0.2% |
| European | 838 | 4.1% |
| Filipino | 34 | 0.2% |
| Finnish | 84 | 0.4% |
| French | 549 | 2.7% |
| French American Indian | 7 | 0.0% |
| French Canadian | 154 | 0.7% |
| German | 2,501 | 12.2% |
| Greek | 49 | 0.2% |
| Guamanian / Chamorro | 122 | 0.6% |
| Guatemalan | 31 | 0.2% |
| Guyanese | 58 | 0.3% |
| Hungarian | 17 | 0.1% |
| Indian (Asian) | 864 | 4.2% |
| Iranian | 109 | 0.5% |
| Irish | 1,417 | 6.9% |
| Italian | 569 | 2.8% |
| Jamaican | 8 | 0.0% |
| Japanese | 99 | 0.5% |
| Kenyan | 56 | 0.3% |
| Korean | 735 | 3.6% |
| Laotian | 146 | 0.7% |
| Lebanese | 74 | 0.4% |
| Liberian | 4 | 0.0% |
| Lithuanian | 15 | 0.1% |
| Malaysian | 42 | 0.2% |
| Mexican | 1,840 | 9.0% |
| Mexican American Indian | 73 | 0.4% |
| Native Hawaiian | 65 | 0.3% |
| Nicaraguan | 5 | 0.0% |
| Northern European | 137 | 0.7% |
| Norwegian | 826 | 4.0% |
| Osage | 7 | 0.0% |
| Pakistani | 224 | 1.1% |
| Palestinian | 37 | 0.2% |
| Peruvian | 12 | 0.1% |
| Polish | 315 | 1.5% |
| Portuguese | 15 | 0.1% |
| Romanian | 121 | 0.6% |
| Russian | 578 | 2.8% |
| Scandinavian | 241 | 1.2% |
| Scotch-Irish | 76 | 0.4% |
| Scottish | 505 | 2.5% |
| Serbian | 16 | 0.1% |
| Sioux | 28 | 0.1% |
| Slovak | 11 | 0.1% |
| South American | 58 | 0.3% |
| Spanish | 9 | 0.0% |
| Sri Lankan | 256 | 1.3% |
| Subsaharan African | 172 | 0.8% |
| Swedish | 682 | 3.3% |
| Swiss | 83 | 0.4% |
| Thai | 1,652 | 8.1% |
| Tlingit-Haida | 126 | 0.6% |
| Tongan | 74 | 0.4% |
| Trinidadian and Tobagonian | 27 | 0.1% |
| Turkish | 30 | 0.2% |
| Ukrainian | 729 | 3.5% |
| Vietnamese | 24 | 0.1% |
| Welsh | 117 | 0.6% |
| Yugoslavian | 8 | 0.0% | View All 88 Rows |
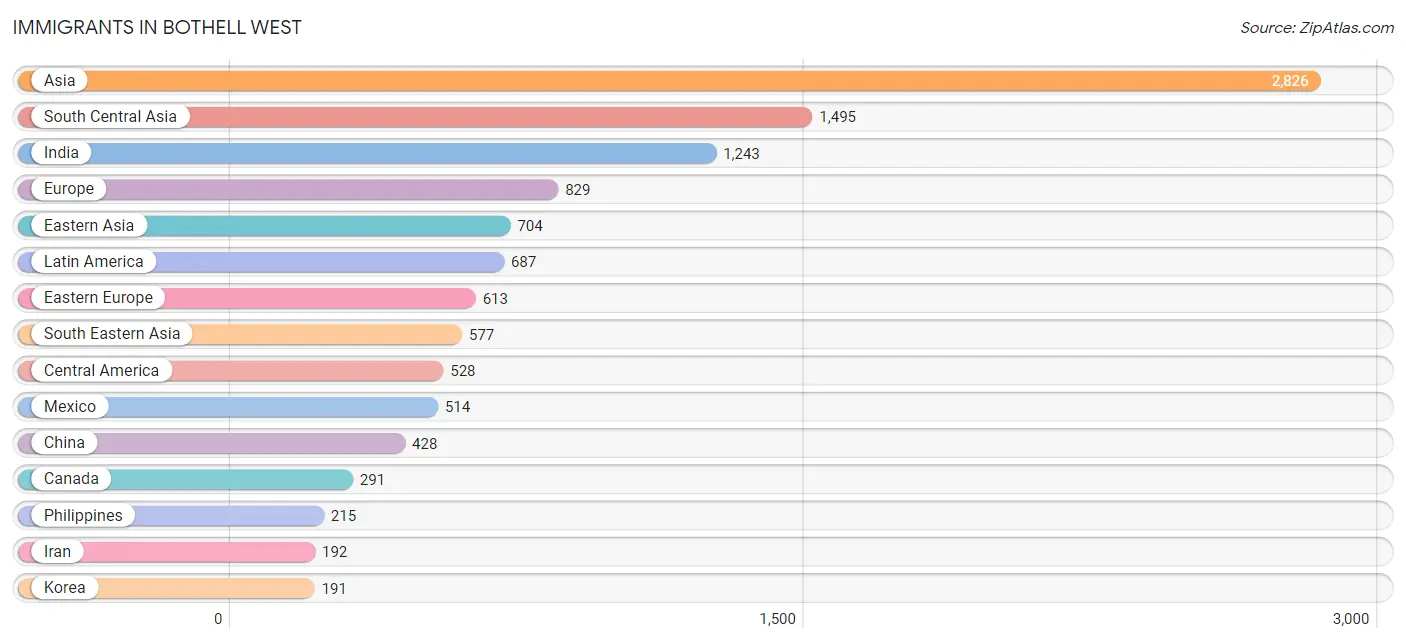
Immigrants in Bothell West
The most numerous immigrant groups reported in Bothell West came from Asia (2,826 | 13.8%), South Central Asia (1,495 | 7.3%), India (1,243 | 6.0%), Europe (829 | 4.0%), and Eastern Asia (704 | 3.4%), together accounting for 34.6% of all Bothell West residents.
| Immigration Origin | # Population | % Population |
| Africa | 137 | 0.7% |
| Asia | 2,826 | 13.8% |
| Australia | 14 | 0.1% |
| Austria | 42 | 0.2% |
| Bangladesh | 16 | 0.1% |
| Belarus | 11 | 0.1% |
| Brazil | 45 | 0.2% |
| Bulgaria | 29 | 0.1% |
| Cambodia | 29 | 0.1% |
| Canada | 291 | 1.4% |
| Caribbean | 92 | 0.4% |
| Central America | 528 | 2.6% |
| China | 428 | 2.1% |
| Colombia | 10 | 0.1% |
| Croatia | 8 | 0.0% |
| Cuba | 84 | 0.4% |
| Eastern Africa | 85 | 0.4% |
| Eastern Asia | 704 | 3.4% |
| Eastern Europe | 613 | 3.0% |
| England | 34 | 0.2% |
| Eritrea | 22 | 0.1% |
| Ethiopia | 34 | 0.2% |
| Europe | 829 | 4.0% |
| France | 16 | 0.1% |
| Germany | 33 | 0.2% |
| Guatemala | 9 | 0.0% |
| Hong Kong | 40 | 0.2% |
| India | 1,243 | 6.0% |
| Indonesia | 121 | 0.6% |
| Iran | 192 | 0.9% |
| Ireland | 8 | 0.0% |
| Italy | 28 | 0.1% |
| Jamaica | 8 | 0.0% |
| Japan | 75 | 0.4% |
| Kazakhstan | 8 | 0.0% |
| Kenya | 23 | 0.1% |
| Korea | 191 | 0.9% |
| Laos | 13 | 0.1% |
| Latin America | 687 | 3.4% |
| Lebanon | 16 | 0.1% |
| Liberia | 2 | 0.0% |
| Lithuania | 11 | 0.1% |
| Malaysia | 15 | 0.1% |
| Mexico | 514 | 2.5% |
| Moldova | 27 | 0.1% |
| Nicaragua | 5 | 0.0% |
| Northern Africa | 9 | 0.0% |
| Northern Europe | 80 | 0.4% |
| Oceania | 14 | 0.1% |
| Peru | 12 | 0.1% |
| Philippines | 215 | 1.1% |
| Poland | 30 | 0.2% |
| Romania | 99 | 0.5% |
| Russia | 148 | 0.7% |
| Sierra Leone | 2 | 0.0% |
| South Africa | 16 | 0.1% |
| South America | 67 | 0.3% |
| South Central Asia | 1,495 | 7.3% |
| South Eastern Asia | 577 | 2.8% |
| Southern Europe | 28 | 0.1% |
| Sri Lanka | 36 | 0.2% |
| Switzerland | 17 | 0.1% |
| Taiwan | 20 | 0.1% |
| Thailand | 23 | 0.1% |
| Turkey | 16 | 0.1% |
| Ukraine | 187 | 0.9% |
| Vietnam | 161 | 0.8% |
| Western Africa | 27 | 0.1% |
| Western Asia | 32 | 0.2% |
| Western Europe | 108 | 0.5% | View All 70 Rows |
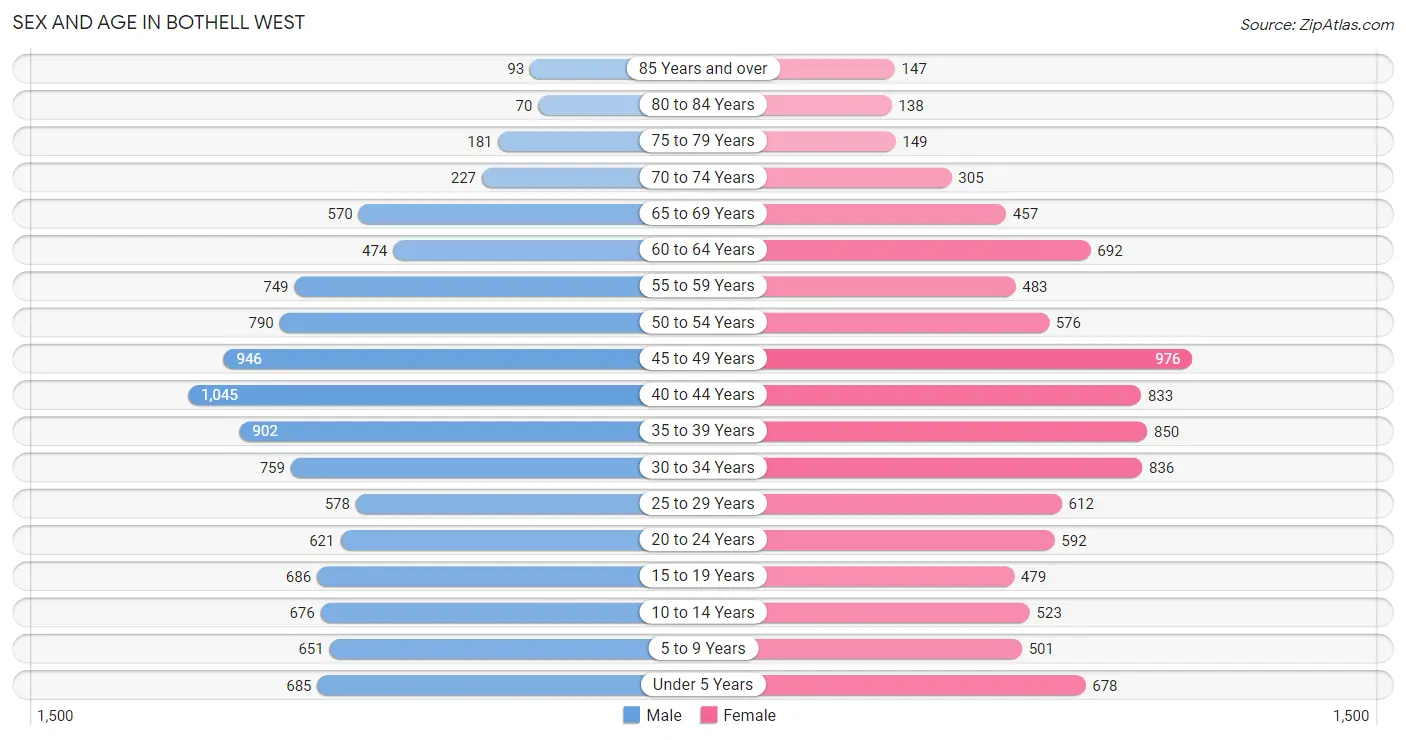
Sex and Age in Bothell West
Sex and Age in Bothell West
The most populous age groups in Bothell West are 40 to 44 Years (1,045 | 9.8%) for men and 45 to 49 Years (976 | 9.9%) for women.
| Age Bracket | Male | Female |
| Under 5 Years | 685 (6.4%) | 678 (6.9%) |
| 5 to 9 Years | 651 (6.1%) | 501 (5.1%) |
| 10 to 14 Years | 676 (6.3%) | 523 (5.3%) |
| 15 to 19 Years | 686 (6.4%) | 479 (4.9%) |
| 20 to 24 Years | 621 (5.8%) | 592 (6.0%) |
| 25 to 29 Years | 578 (5.4%) | 612 (6.2%) |
| 30 to 34 Years | 759 (7.1%) | 836 (8.5%) |
| 35 to 39 Years | 902 (8.4%) | 850 (8.6%) |
| 40 to 44 Years | 1,045 (9.8%) | 833 (8.5%) |
| 45 to 49 Years | 946 (8.8%) | 976 (9.9%) |
| 50 to 54 Years | 790 (7.4%) | 576 (5.9%) |
| 55 to 59 Years | 749 (7.0%) | 483 (4.9%) |
| 60 to 64 Years | 474 (4.4%) | 692 (7.0%) |
| 65 to 69 Years | 570 (5.3%) | 457 (4.6%) |
| 70 to 74 Years | 227 (2.1%) | 305 (3.1%) |
| 75 to 79 Years | 181 (1.7%) | 149 (1.5%) |
| 80 to 84 Years | 70 (0.6%) | 138 (1.4%) |
| 85 Years and over | 93 (0.9%) | 147 (1.5%) |
| Total | 10,703 (100.0%) | 9,827 (100.0%) |
Families and Households in Bothell West
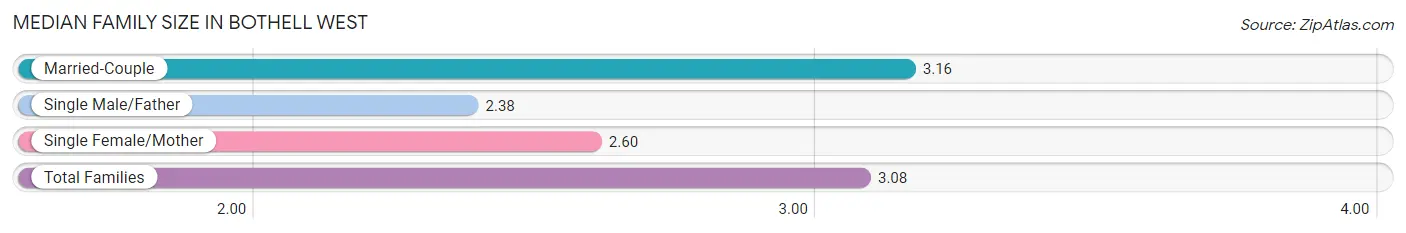
Median Family Size in Bothell West
The median family size in Bothell West is 3.08 persons per family, with married-couple families (4,775 | 87.4%) accounting for the largest median family size of 3.16 persons per family. On the other hand, single male/father families (287 | 5.2%) represent the smallest median family size with 2.38 persons per family.
| Family Type | # Families | Family Size |
| Married-Couple | 4,775 (87.4%) | 3.16 |
| Single Male/Father | 287 (5.2%) | 2.38 |
| Single Female/Mother | 404 (7.4%) | 2.60 |
| Total Families | 5,466 (100.0%) | 3.08 |
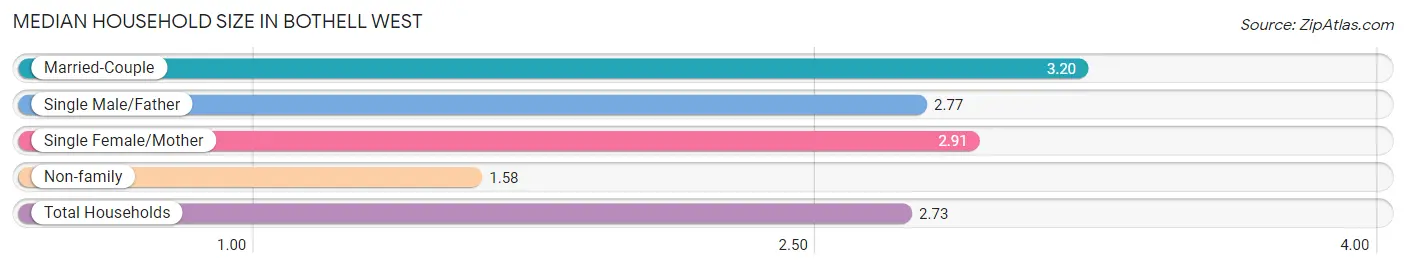
Median Household Size in Bothell West
The median household size in Bothell West is 2.73 persons per household, with married-couple households (4,775 | 64.0%) accounting for the largest median household size of 3.2 persons per household. non-family households (1,997 | 26.8%) represent the smallest median household size with 1.58 persons per household.
| Household Type | # Households | Household Size |
| Married-Couple | 4,775 (64.0%) | 3.20 |
| Single Male/Father | 287 (3.8%) | 2.77 |
| Single Female/Mother | 404 (5.4%) | 2.91 |
| Non-family | 1,997 (26.8%) | 1.58 |
| Total Households | 7,463 (100.0%) | 2.73 |
Household Size by Marriage Status in Bothell West
Out of a total of 7,463 households in Bothell West, 5,466 (73.2%) are family households, while 1,997 (26.8%) are nonfamily households. The most numerous type of family households are 2-person households, comprising 2,124, and the most common type of nonfamily households are 1-person households, comprising 1,326.
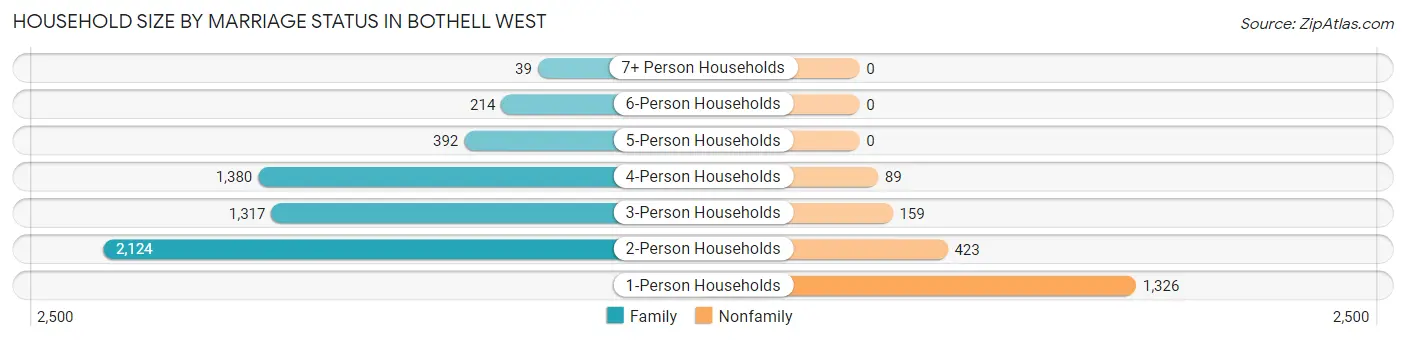
| Household Size | Family Households | Nonfamily Households |
| 1-Person Households | - | 1,326 (17.8%) |
| 2-Person Households | 2,124 (28.5%) | 423 (5.7%) |
| 3-Person Households | 1,317 (17.6%) | 159 (2.1%) |
| 4-Person Households | 1,380 (18.5%) | 89 (1.2%) |
| 5-Person Households | 392 (5.2%) | 0 (0.0%) |
| 6-Person Households | 214 (2.9%) | 0 (0.0%) |
| 7+ Person Households | 39 (0.5%) | 0 (0.0%) |
| Total | 5,466 (73.2%) | 1,997 (26.8%) |
Female Fertility in Bothell West
Fertility by Age in Bothell West
Average fertility rate in Bothell West is 48.0 births per 1,000 women. Women in the age bracket of 20 to 34 years have the highest fertility rate with 101.0 births per 1,000 women. Women in the age bracket of 20 to 34 years acount for 80.8% of all women with births.
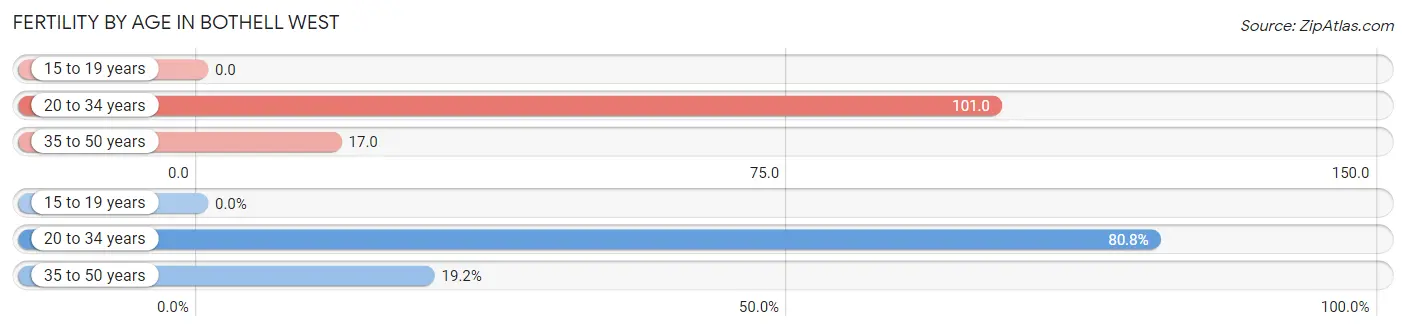
| Age Bracket | Women with Births | Births / 1,000 Women |
| 15 to 19 years | 0 (0.0%) | 0.0 |
| 20 to 34 years | 206 (80.8%) | 101.0 |
| 35 to 50 years | 49 (19.2%) | 17.0 |
| Total | 255 (100.0%) | 48.0 |
Fertility by Age by Marriage Status in Bothell West
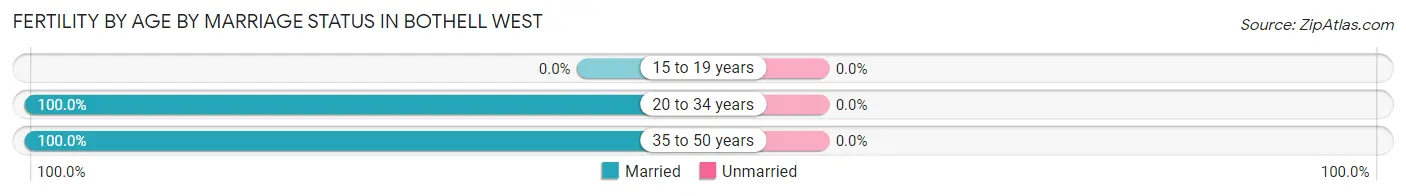
| Age Bracket | Married | Unmarried |
| 15 to 19 years | 0 (0.0%) | 0 (0.0%) |
| 20 to 34 years | 206 (100.0%) | 0 (0.0%) |
| 35 to 50 years | 49 (100.0%) | 0 (0.0%) |
| Total | 255 (100.0%) | 0 (0.0%) |
Fertility by Education in Bothell West
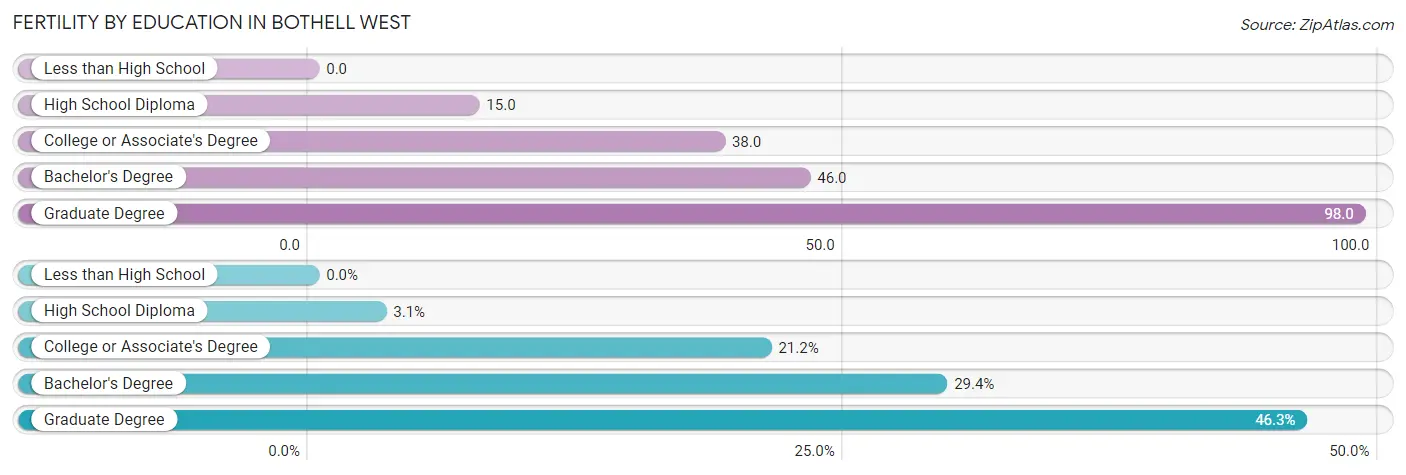
| Educational Attainment | Women with Births | Births / 1,000 Women |
| Less than High School | 0 (0.0%) | 0.0 |
| High School Diploma | 8 (3.1%) | 15.0 |
| College or Associate's Degree | 54 (21.2%) | 38.0 |
| Bachelor's Degree | 75 (29.4%) | 46.0 |
| Graduate Degree | 118 (46.3%) | 98.0 |
| Total | 255 (100.0%) | 48.0 |
Fertility by Education by Marriage Status in Bothell West
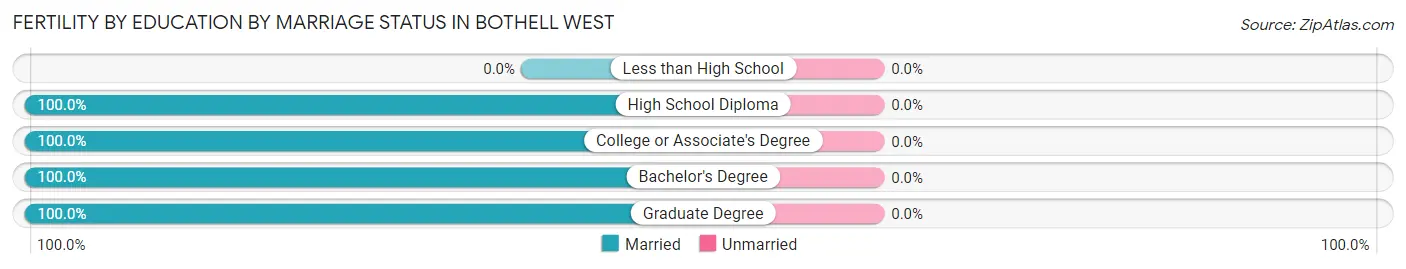
| Educational Attainment | Married | Unmarried |
| Less than High School | 0 (0.0%) | 0 (0.0%) |
| High School Diploma | 8 (100.0%) | 0 (0.0%) |
| College or Associate's Degree | 54 (100.0%) | 0 (0.0%) |
| Bachelor's Degree | 75 (100.0%) | 0 (0.0%) |
| Graduate Degree | 118 (100.0%) | 0 (0.0%) |
| Total | 255 (100.0%) | 0 (0.0%) |
Employment Characteristics in Bothell West
Employment by Class of Employer in Bothell West
Among the 11,277 employed individuals in Bothell West, private company employees (8,135 | 72.1%), not-for-profit organizations (1,066 | 9.5%), and local government employees (682 | 6.0%) make up the most common classes of employment.
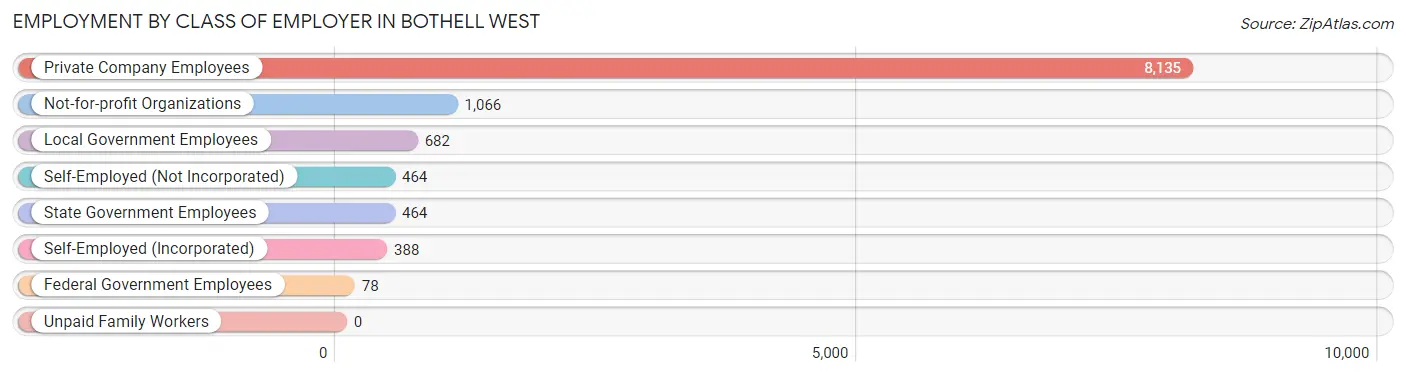
| Employer Class | # Employees | % Employees |
| Private Company Employees | 8,135 | 72.1% |
| Self-Employed (Incorporated) | 388 | 3.4% |
| Self-Employed (Not Incorporated) | 464 | 4.1% |
| Not-for-profit Organizations | 1,066 | 9.5% |
| Local Government Employees | 682 | 6.0% |
| State Government Employees | 464 | 4.1% |
| Federal Government Employees | 78 | 0.7% |
| Unpaid Family Workers | 0 | 0.0% |
| Total | 11,277 | 100.0% |
Employment Status by Age in Bothell West
According to the labor force statistics for Bothell West, out of the total population over 16 years of age (16,568), 71.2% or 11,796 individuals are in the labor force, with 3.2% or 377 of them unemployed. The age group with the highest labor force participation rate is 35 to 44 years, with 89.3% or 3,242 individuals in the labor force. Within the labor force, the 75 years and over age range has the highest percentage of unemployed individuals, with 11.4% or 9 of them being unemployed.
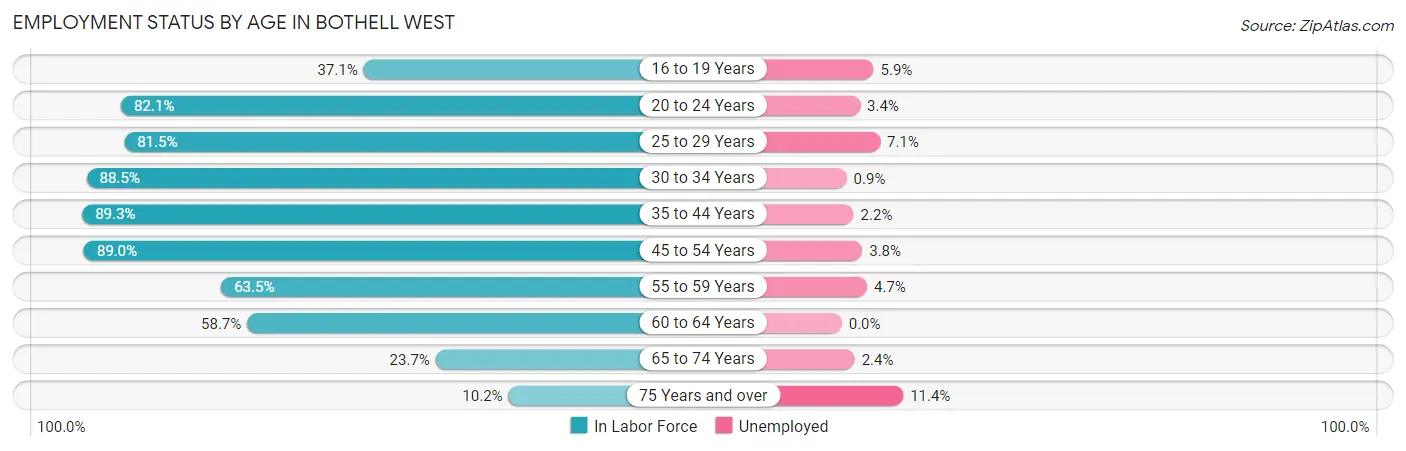
| Age Bracket | In Labor Force | Unemployed |
| 16 to 19 Years | 340 (37.1%) | 20 (5.9%) |
| 20 to 24 Years | 996 (82.1%) | 34 (3.4%) |
| 25 to 29 Years | 970 (81.5%) | 69 (7.1%) |
| 30 to 34 Years | 1,412 (88.5%) | 13 (0.9%) |
| 35 to 44 Years | 3,242 (89.3%) | 71 (2.2%) |
| 45 to 54 Years | 2,926 (89.0%) | 111 (3.8%) |
| 55 to 59 Years | 782 (63.5%) | 37 (4.7%) |
| 60 to 64 Years | 684 (58.7%) | 0 (0.0%) |
| 65 to 74 Years | 369 (23.7%) | 9 (2.4%) |
| 75 Years and over | 79 (10.2%) | 9 (11.4%) |
| Total | 11,796 (71.2%) | 377 (3.2%) |
Employment Status by Educational Attainment in Bothell West
According to labor force statistics for Bothell West, 82.8% of individuals (10,020) out of the total population between 25 and 64 years of age (12,101) are in the labor force, with 3.0% or 301 of them being unemployed. The group with the highest labor force participation rate are those with the educational attainment of bachelor's degree or higher, with 85.5% or 5,914 individuals in the labor force. Within the labor force, individuals with high school diploma education have the highest percentage of unemployment, with 7.4% or 91 of them being unemployed.
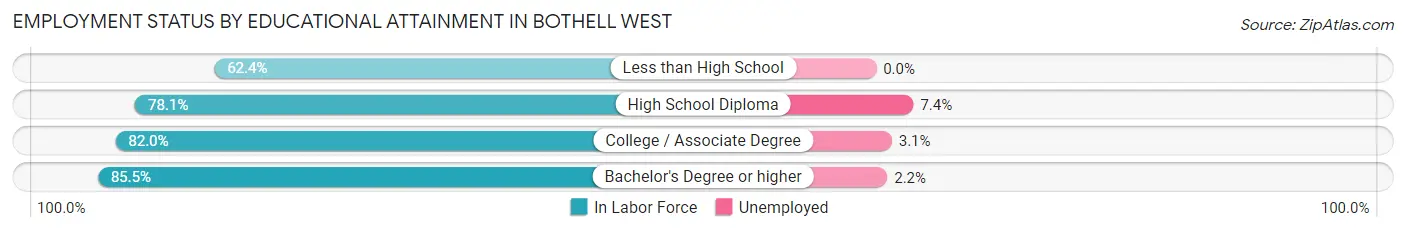
| Educational Attainment | In Labor Force | Unemployed |
| Less than High School | 277 (62.4%) | 0 (0.0%) |
| High School Diploma | 1,236 (78.1%) | 117 (7.4%) |
| College / Associate Degree | 2,590 (82.0%) | 98 (3.1%) |
| Bachelor's Degree or higher | 5,914 (85.5%) | 152 (2.2%) |
| Total | 10,020 (82.8%) | 363 (3.0%) |
Employment Occupations by Sex in Bothell West
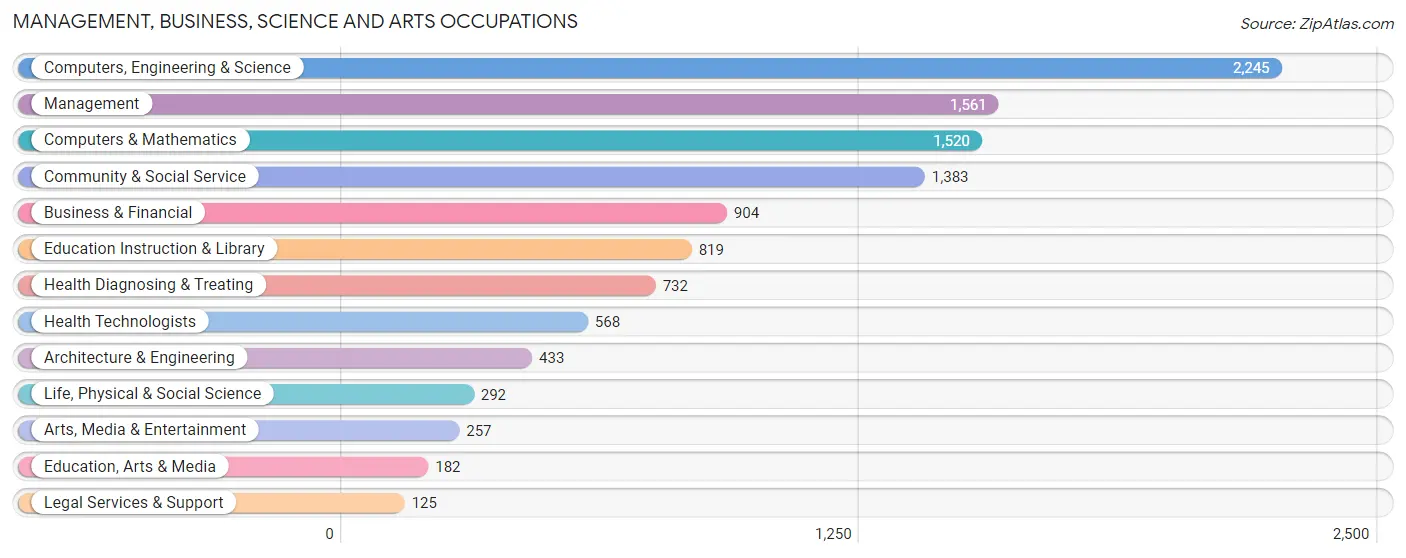
Management, Business, Science and Arts Occupations
The most common Management, Business, Science and Arts occupations in Bothell West are Computers, Engineering & Science (2,245 | 19.6%), Management (1,561 | 13.7%), Computers & Mathematics (1,520 | 13.3%), Community & Social Service (1,383 | 12.1%), and Business & Financial (904 | 7.9%).
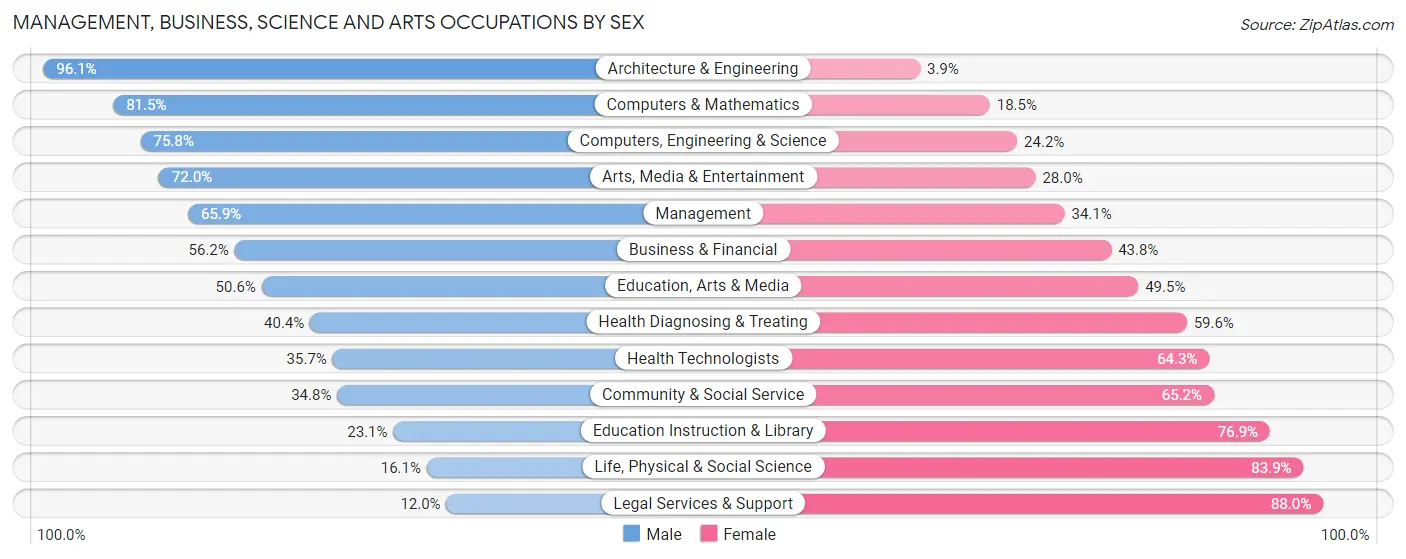
Management, Business, Science and Arts Occupations by Sex
Within the Management, Business, Science and Arts occupations in Bothell West, the most male-oriented occupations are Architecture & Engineering (96.1%), Computers & Mathematics (81.5%), and Computers, Engineering & Science (75.8%), while the most female-oriented occupations are Legal Services & Support (88.0%), Life, Physical & Social Science (83.9%), and Education Instruction & Library (76.9%).
| Occupation | Male | Female |
| Management | 1,029 (65.9%) | 532 (34.1%) |
| Business & Financial | 508 (56.2%) | 396 (43.8%) |
| Computers, Engineering & Science | 1,702 (75.8%) | 543 (24.2%) |
| Computers & Mathematics | 1,239 (81.5%) | 281 (18.5%) |
| Architecture & Engineering | 416 (96.1%) | 17 (3.9%) |
| Life, Physical & Social Science | 47 (16.1%) | 245 (83.9%) |
| Community & Social Service | 481 (34.8%) | 902 (65.2%) |
| Education, Arts & Media | 92 (50.5%) | 90 (49.4%) |
| Legal Services & Support | 15 (12.0%) | 110 (88.0%) |
| Education Instruction & Library | 189 (23.1%) | 630 (76.9%) |
| Arts, Media & Entertainment | 185 (72.0%) | 72 (28.0%) |
| Health Diagnosing & Treating | 296 (40.4%) | 436 (59.6%) |
| Health Technologists | 203 (35.7%) | 365 (64.3%) |
| Total (Category) | 4,016 (58.8%) | 2,809 (41.2%) |
| Total (Overall) | 6,602 (57.8%) | 4,827 (42.2%) |
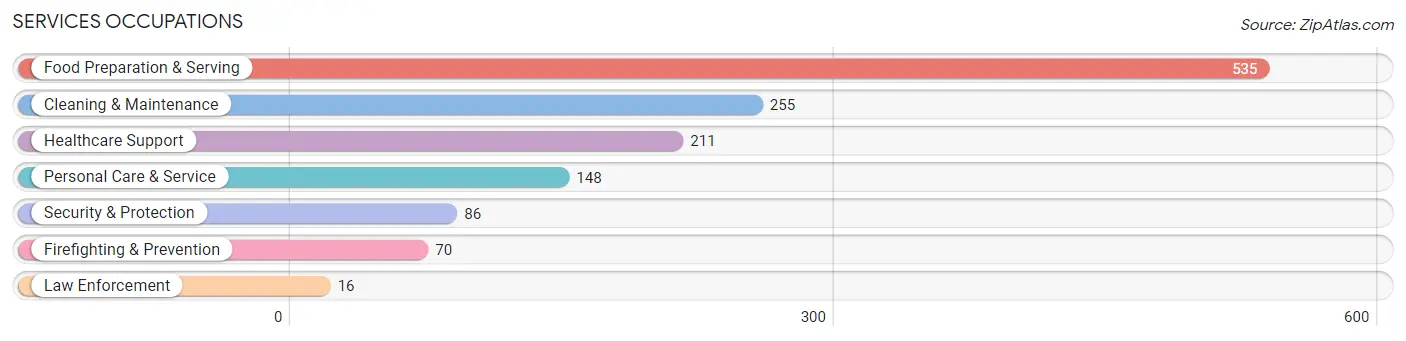
Services Occupations
The most common Services occupations in Bothell West are Food Preparation & Serving (535 | 4.7%), Cleaning & Maintenance (255 | 2.2%), Healthcare Support (211 | 1.8%), Personal Care & Service (148 | 1.3%), and Security & Protection (86 | 0.7%).
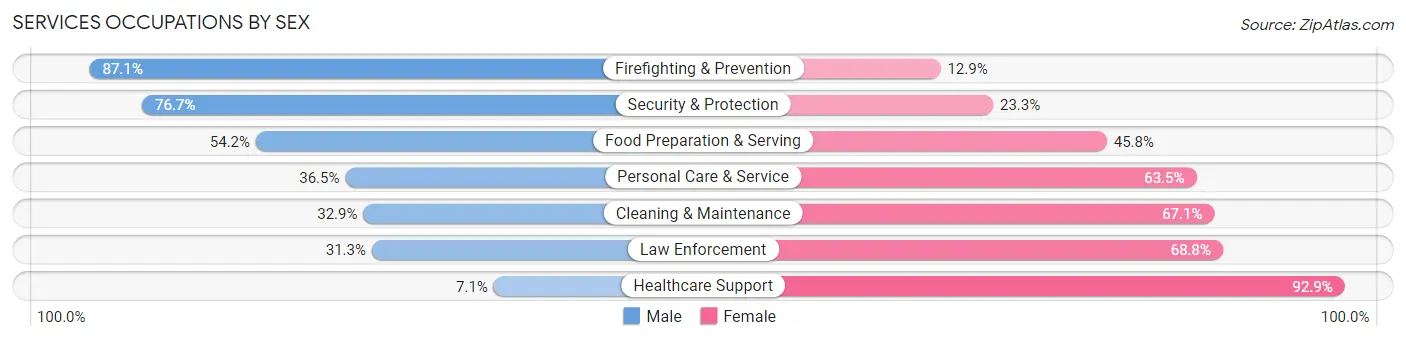
Services Occupations by Sex
Within the Services occupations in Bothell West, the most male-oriented occupations are Firefighting & Prevention (87.1%), Security & Protection (76.7%), and Food Preparation & Serving (54.2%), while the most female-oriented occupations are Healthcare Support (92.9%), Law Enforcement (68.8%), and Cleaning & Maintenance (67.1%).
| Occupation | Male | Female |
| Healthcare Support | 15 (7.1%) | 196 (92.9%) |
| Security & Protection | 66 (76.7%) | 20 (23.3%) |
| Firefighting & Prevention | 61 (87.1%) | 9 (12.9%) |
| Law Enforcement | 5 (31.2%) | 11 (68.8%) |
| Food Preparation & Serving | 290 (54.2%) | 245 (45.8%) |
| Cleaning & Maintenance | 84 (32.9%) | 171 (67.1%) |
| Personal Care & Service | 54 (36.5%) | 94 (63.5%) |
| Total (Category) | 509 (41.2%) | 726 (58.8%) |
| Total (Overall) | 6,602 (57.8%) | 4,827 (42.2%) |
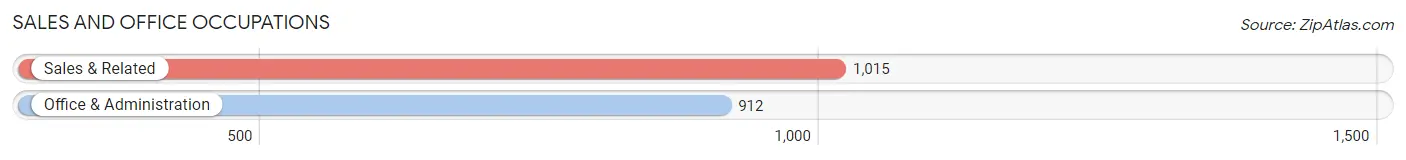
Sales and Office Occupations
The most common Sales and Office occupations in Bothell West are Sales & Related (1,015 | 8.9%), and Office & Administration (912 | 8.0%).
Sales and Office Occupations by Sex
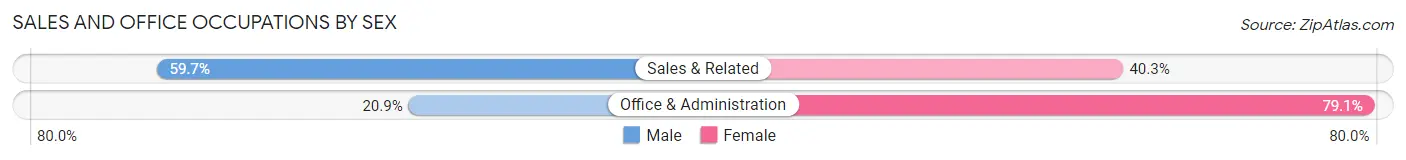
| Occupation | Male | Female |
| Sales & Related | 606 (59.7%) | 409 (40.3%) |
| Office & Administration | 191 (20.9%) | 721 (79.1%) |
| Total (Category) | 797 (41.4%) | 1,130 (58.6%) |
| Total (Overall) | 6,602 (57.8%) | 4,827 (42.2%) |
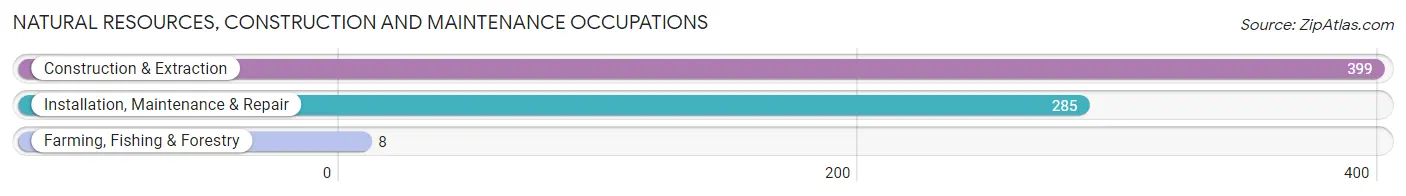
Natural Resources, Construction and Maintenance Occupations
The most common Natural Resources, Construction and Maintenance occupations in Bothell West are Construction & Extraction (399 | 3.5%), Installation, Maintenance & Repair (285 | 2.5%), and Farming, Fishing & Forestry (8 | 0.1%).
Natural Resources, Construction and Maintenance Occupations by Sex
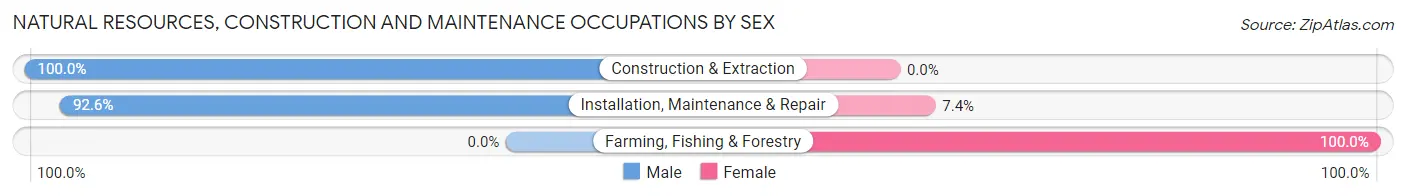
| Occupation | Male | Female |
| Farming, Fishing & Forestry | 0 (0.0%) | 8 (100.0%) |
| Construction & Extraction | 399 (100.0%) | 0 (0.0%) |
| Installation, Maintenance & Repair | 264 (92.6%) | 21 (7.4%) |
| Total (Category) | 663 (95.8%) | 29 (4.2%) |
| Total (Overall) | 6,602 (57.8%) | 4,827 (42.2%) |
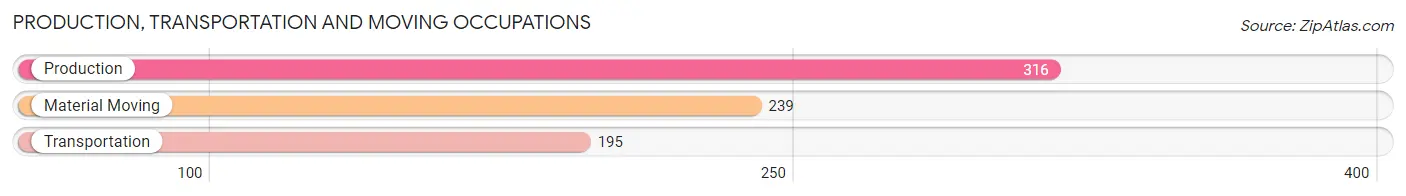
Production, Transportation and Moving Occupations
The most common Production, Transportation and Moving occupations in Bothell West are Production (316 | 2.8%), Material Moving (239 | 2.1%), and Transportation (195 | 1.7%).
Production, Transportation and Moving Occupations by Sex
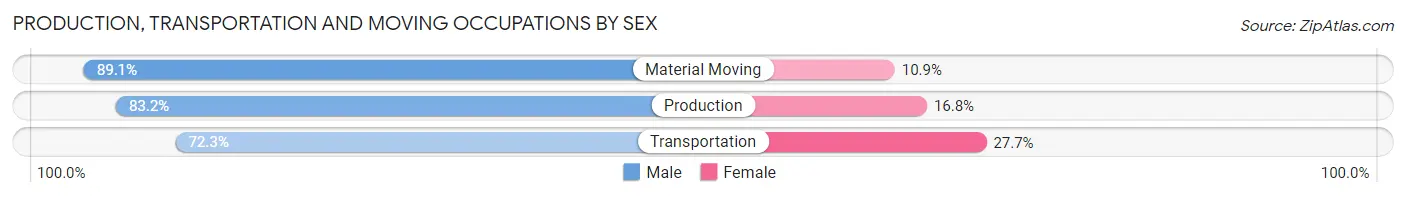
| Occupation | Male | Female |
| Production | 263 (83.2%) | 53 (16.8%) |
| Transportation | 141 (72.3%) | 54 (27.7%) |
| Material Moving | 213 (89.1%) | 26 (10.9%) |
| Total (Category) | 617 (82.3%) | 133 (17.7%) |
| Total (Overall) | 6,602 (57.8%) | 4,827 (42.2%) |
Employment Industries by Sex in Bothell West
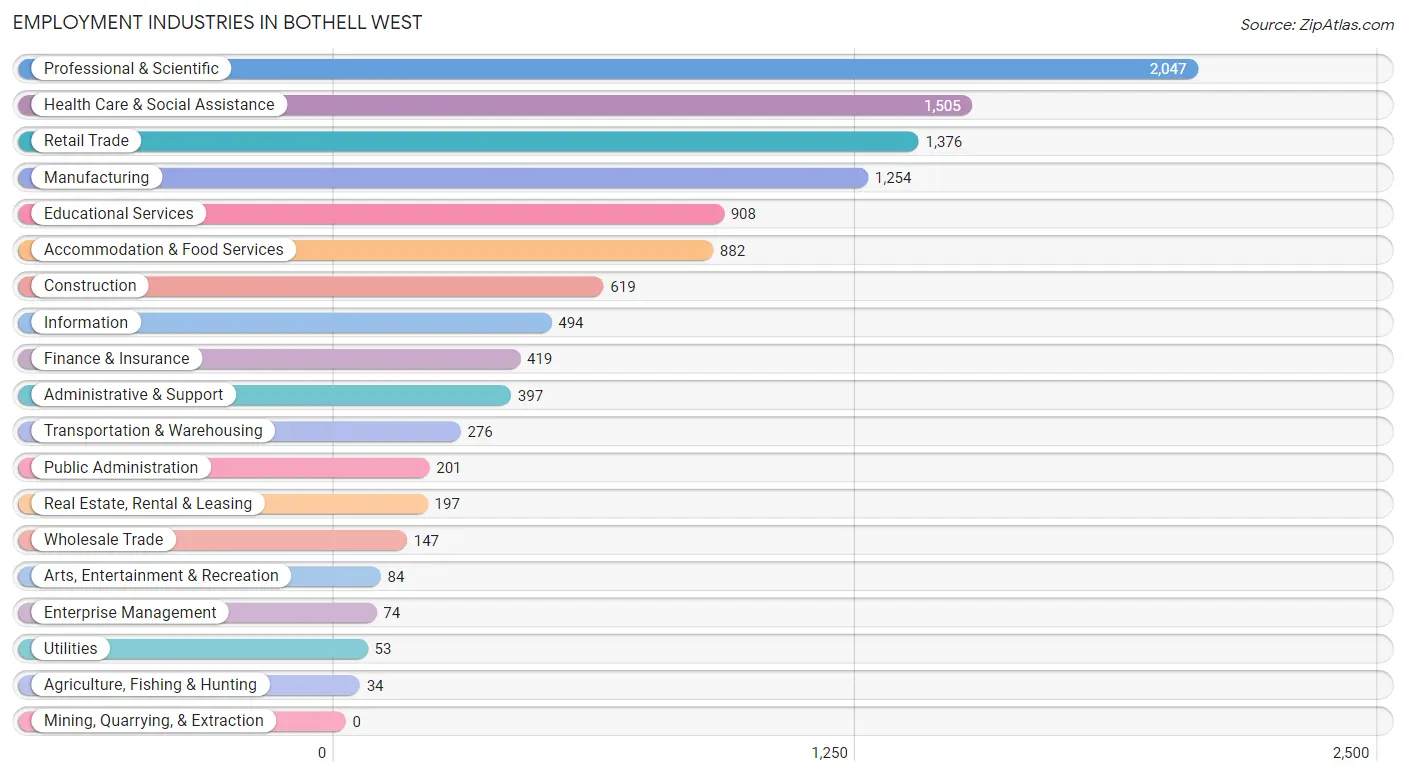
Employment Industries in Bothell West
The major employment industries in Bothell West include Professional & Scientific (2,047 | 17.9%), Health Care & Social Assistance (1,505 | 13.2%), Retail Trade (1,376 | 12.0%), Manufacturing (1,254 | 11.0%), and Educational Services (908 | 7.9%).
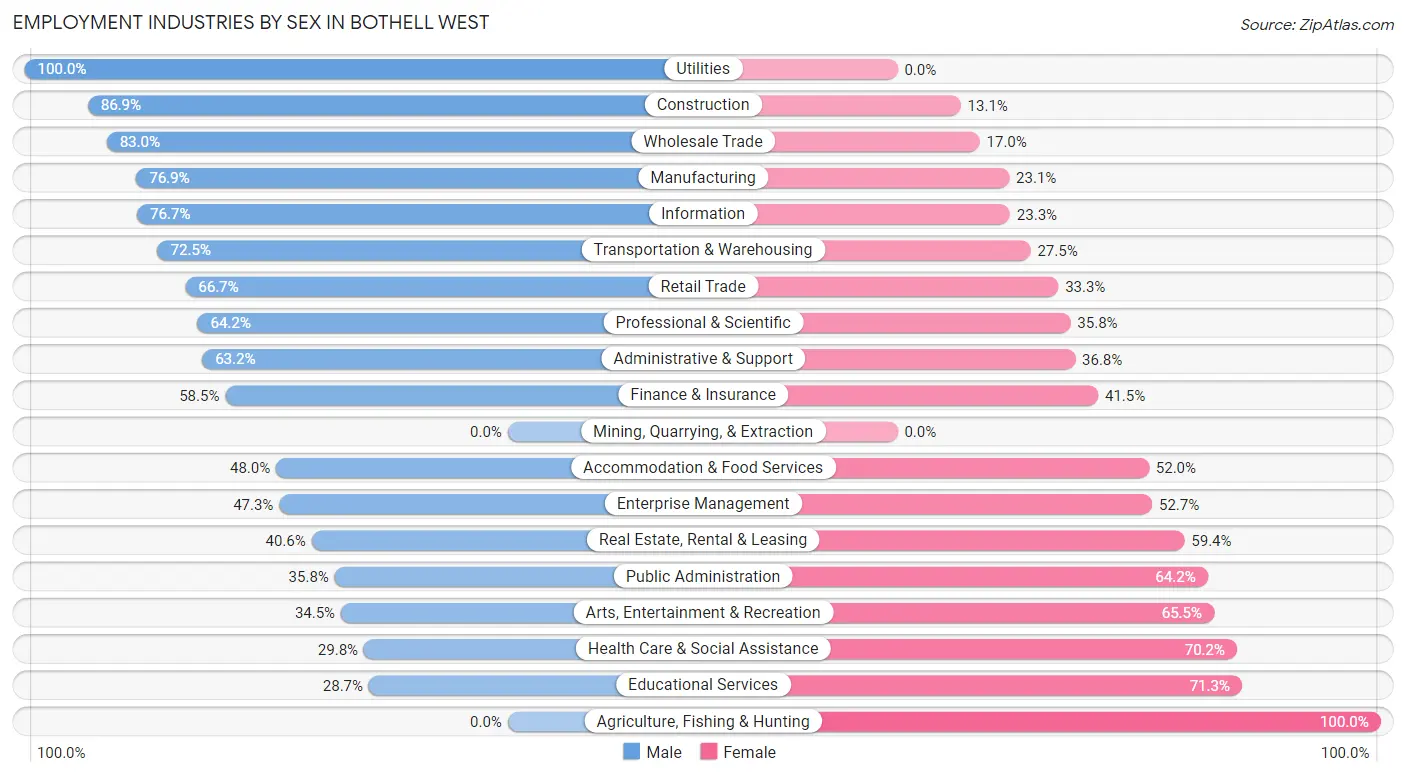
Employment Industries by Sex in Bothell West
The Bothell West industries that see more men than women are Utilities (100.0%), Construction (86.9%), and Wholesale Trade (83.0%), whereas the industries that tend to have a higher number of women are Agriculture, Fishing & Hunting (100.0%), Educational Services (71.3%), and Health Care & Social Assistance (70.2%).
| Industry | Male | Female |
| Agriculture, Fishing & Hunting | 0 (0.0%) | 34 (100.0%) |
| Mining, Quarrying, & Extraction | 0 (0.0%) | 0 (0.0%) |
| Construction | 538 (86.9%) | 81 (13.1%) |
| Manufacturing | 964 (76.9%) | 290 (23.1%) |
| Wholesale Trade | 122 (83.0%) | 25 (17.0%) |
| Retail Trade | 918 (66.7%) | 458 (33.3%) |
| Transportation & Warehousing | 200 (72.5%) | 76 (27.5%) |
| Utilities | 53 (100.0%) | 0 (0.0%) |
| Information | 379 (76.7%) | 115 (23.3%) |
| Finance & Insurance | 245 (58.5%) | 174 (41.5%) |
| Real Estate, Rental & Leasing | 80 (40.6%) | 117 (59.4%) |
| Professional & Scientific | 1,314 (64.2%) | 733 (35.8%) |
| Enterprise Management | 35 (47.3%) | 39 (52.7%) |
| Administrative & Support | 251 (63.2%) | 146 (36.8%) |
| Educational Services | 261 (28.7%) | 647 (71.3%) |
| Health Care & Social Assistance | 448 (29.8%) | 1,057 (70.2%) |
| Arts, Entertainment & Recreation | 29 (34.5%) | 55 (65.5%) |
| Accommodation & Food Services | 423 (48.0%) | 459 (52.0%) |
| Public Administration | 72 (35.8%) | 129 (64.2%) |
| Total | 6,602 (57.8%) | 4,827 (42.2%) |
Education in Bothell West
School Enrollment in Bothell West
The most common levels of schooling among the 4,805 students in Bothell West are high school (1,069 | 22.3%), middle school (1,029 | 21.4%), and elementary school (854 | 17.8%).
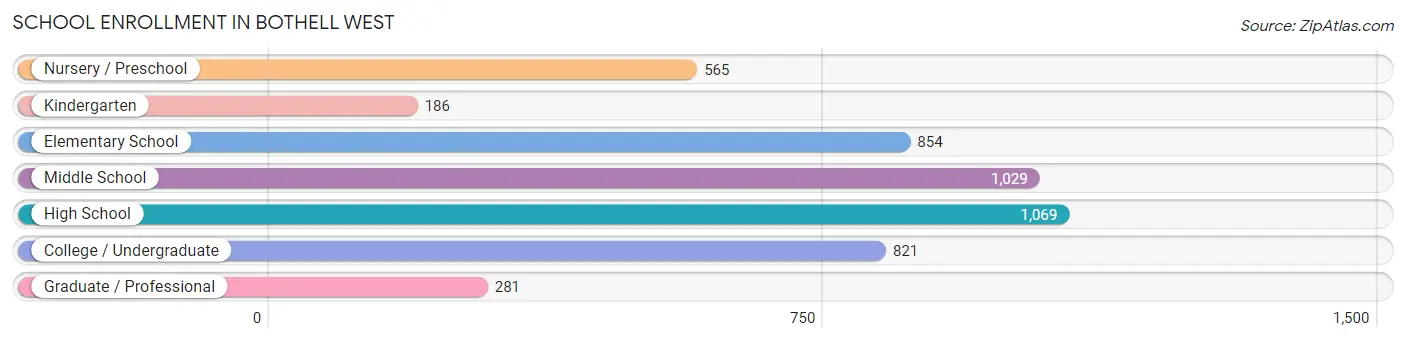
| School Level | # Students | % Students |
| Nursery / Preschool | 565 | 11.8% |
| Kindergarten | 186 | 3.9% |
| Elementary School | 854 | 17.8% |
| Middle School | 1,029 | 21.4% |
| High School | 1,069 | 22.3% |
| College / Undergraduate | 821 | 17.1% |
| Graduate / Professional | 281 | 5.9% |
| Total | 4,805 | 100.0% |
School Enrollment by Age by Funding Source in Bothell West
Out of a total of 4,805 students who are enrolled in schools in Bothell West, 865 (18.0%) attend a private institution, while the remaining 3,940 (82.0%) are enrolled in public schools. The age group of 3 to 4 year olds has the highest likelihood of being enrolled in private schools, with 393 (83.6% in the age bracket) enrolled. Conversely, the age group of 18 to 19 year olds has the lowest likelihood of being enrolled in a private school, with 343 (98.3% in the age bracket) attending a public institution.
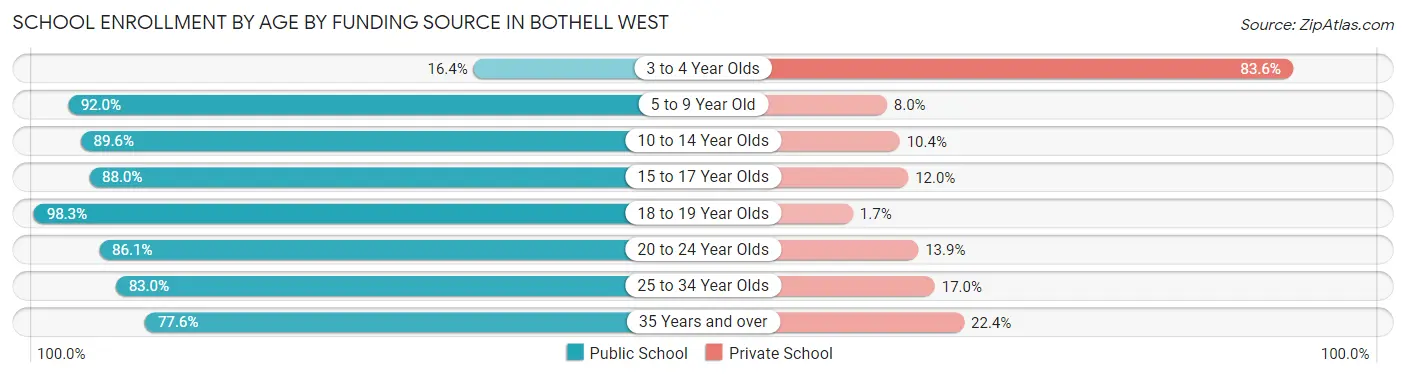
| Age Bracket | Public School | Private School |
| 3 to 4 Year Olds | 77 (16.4%) | 393 (83.6%) |
| 5 to 9 Year Old | 995 (92.0%) | 87 (8.0%) |
| 10 to 14 Year Olds | 1,055 (89.6%) | 123 (10.4%) |
| 15 to 17 Year Olds | 659 (88.0%) | 90 (12.0%) |
| 18 to 19 Year Olds | 343 (98.3%) | 6 (1.7%) |
| 20 to 24 Year Olds | 341 (86.1%) | 55 (13.9%) |
| 25 to 34 Year Olds | 264 (83.0%) | 54 (17.0%) |
| 35 Years and over | 204 (77.6%) | 59 (22.4%) |
| Total | 3,940 (82.0%) | 865 (18.0%) |
Educational Attainment by Field of Study in Bothell West
Engineering (1,501 | 17.1%), computers & mathematics (1,153 | 13.2%), business (1,041 | 11.9%), science & technology (799 | 9.1%), and bio, nature & agricultural (610 | 7.0%) are the most common fields of study among 8,771 individuals in Bothell West who have obtained a bachelor's degree or higher.
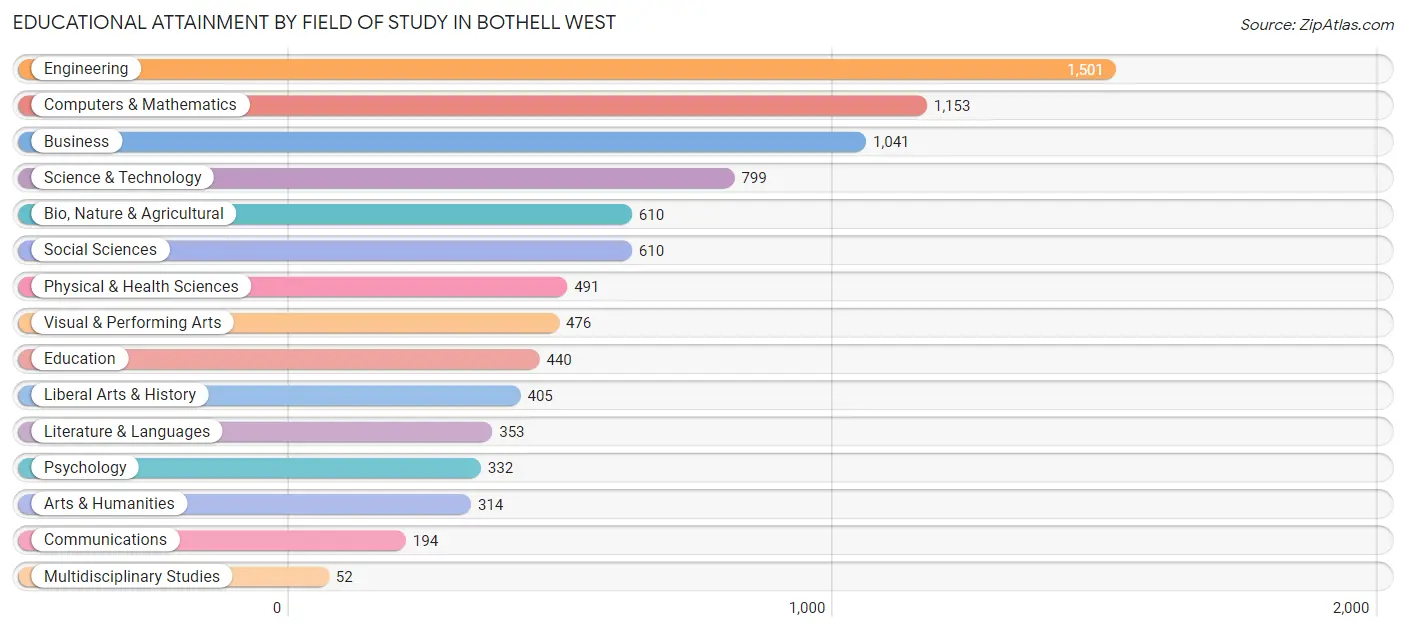
| Field of Study | # Graduates | % Graduates |
| Computers & Mathematics | 1,153 | 13.2% |
| Bio, Nature & Agricultural | 610 | 7.0% |
| Physical & Health Sciences | 491 | 5.6% |
| Psychology | 332 | 3.8% |
| Social Sciences | 610 | 7.0% |
| Engineering | 1,501 | 17.1% |
| Multidisciplinary Studies | 52 | 0.6% |
| Science & Technology | 799 | 9.1% |
| Business | 1,041 | 11.9% |
| Education | 440 | 5.0% |
| Literature & Languages | 353 | 4.0% |
| Liberal Arts & History | 405 | 4.6% |
| Visual & Performing Arts | 476 | 5.4% |
| Communications | 194 | 2.2% |
| Arts & Humanities | 314 | 3.6% |
| Total | 8,771 | 100.0% |
Transportation & Commute in Bothell West
Vehicle Availability by Sex in Bothell West
The most prevalent vehicle ownership categories in Bothell West are males with 2 vehicles (3,365, accounting for 51.7%) and females with 2 vehicles (2,483, making up 71.1%).
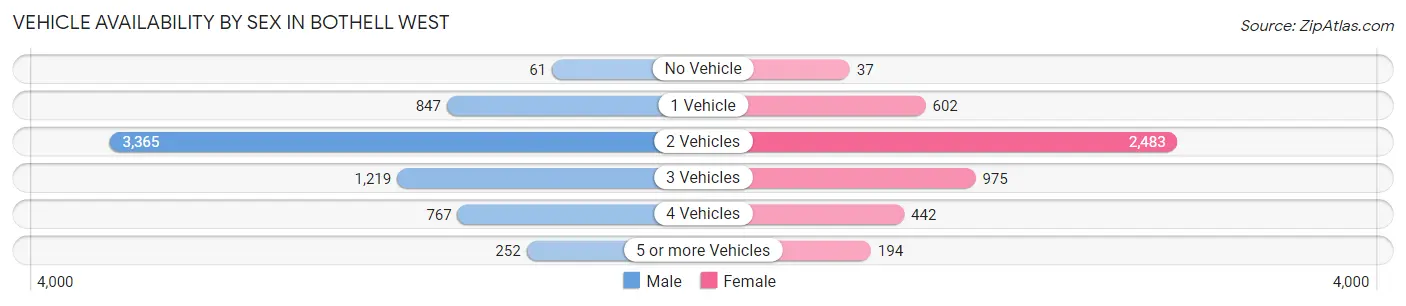
| Vehicles Available | Male | Female |
| No Vehicle | 61 (0.9%) | 37 (0.8%) |
| 1 Vehicle | 847 (13.0%) | 602 (12.7%) |
| 2 Vehicles | 3,365 (51.7%) | 2,483 (52.5%) |
| 3 Vehicles | 1,219 (18.7%) | 975 (20.6%) |
| 4 Vehicles | 767 (11.8%) | 442 (9.3%) |
| 5 or more Vehicles | 252 (3.9%) | 194 (4.1%) |
| Total | 6,511 (100.0%) | 4,733 (100.0%) |
Commute Time in Bothell West
The most frequently occuring commute durations in Bothell West are 45 to 59 minutes (1,266 commuters, 14.4%), 60 to 89 minutes (1,160 commuters, 13.2%), and 20 to 24 minutes (1,120 commuters, 12.8%).
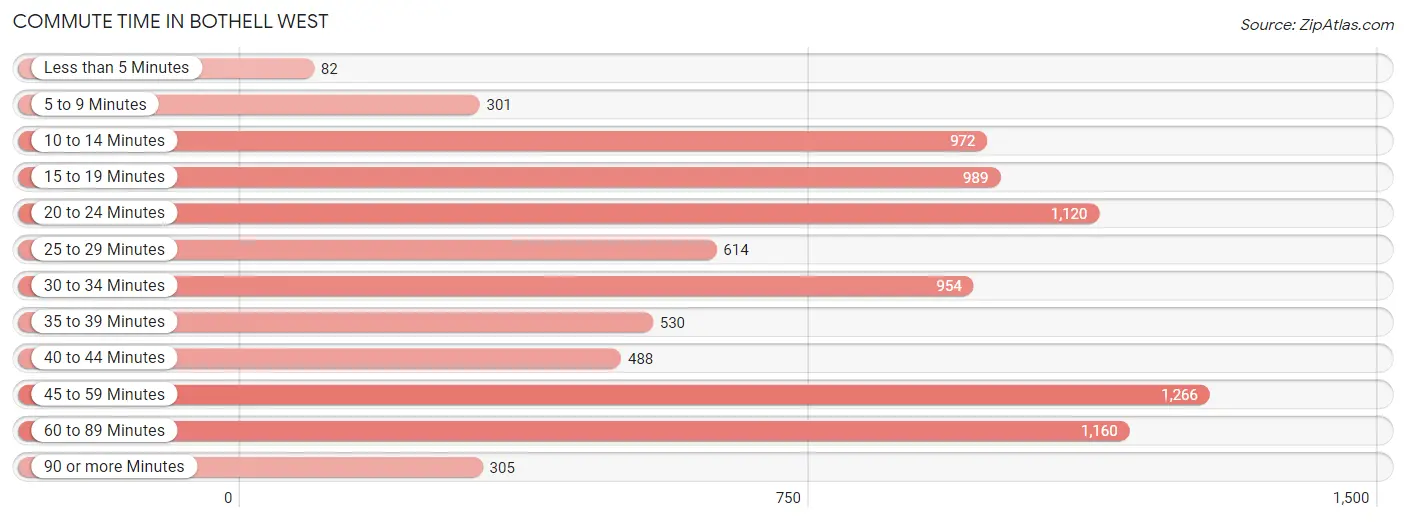
| Commute Time | # Commuters | % Commuters |
| Less than 5 Minutes | 82 | 0.9% |
| 5 to 9 Minutes | 301 | 3.4% |
| 10 to 14 Minutes | 972 | 11.1% |
| 15 to 19 Minutes | 989 | 11.3% |
| 20 to 24 Minutes | 1,120 | 12.8% |
| 25 to 29 Minutes | 614 | 7.0% |
| 30 to 34 Minutes | 954 | 10.9% |
| 35 to 39 Minutes | 530 | 6.0% |
| 40 to 44 Minutes | 488 | 5.6% |
| 45 to 59 Minutes | 1,266 | 14.4% |
| 60 to 89 Minutes | 1,160 | 13.2% |
| 90 or more Minutes | 305 | 3.5% |
Commute Time by Sex in Bothell West
The most common commute times in Bothell West are 45 to 59 minutes (834 commuters, 16.5%) for males and 10 to 14 minutes (591 commuters, 15.9%) for females.
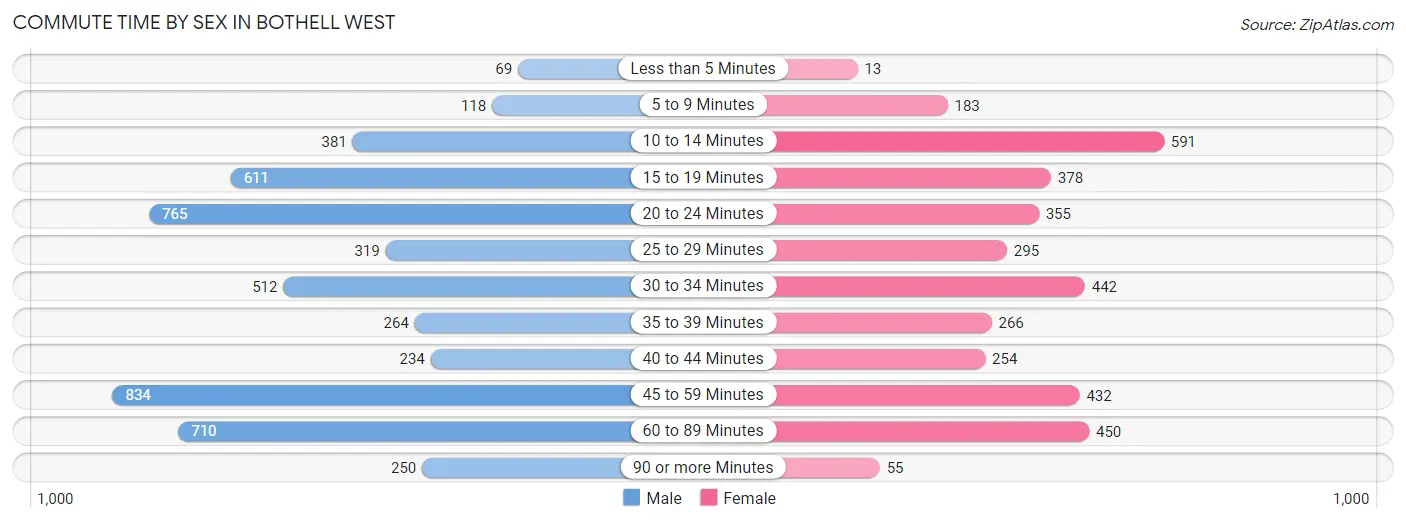
| Commute Time | Male | Female |
| Less than 5 Minutes | 69 (1.4%) | 13 (0.4%) |
| 5 to 9 Minutes | 118 (2.3%) | 183 (4.9%) |
| 10 to 14 Minutes | 381 (7.5%) | 591 (15.9%) |
| 15 to 19 Minutes | 611 (12.1%) | 378 (10.2%) |
| 20 to 24 Minutes | 765 (15.1%) | 355 (9.6%) |
| 25 to 29 Minutes | 319 (6.3%) | 295 (7.9%) |
| 30 to 34 Minutes | 512 (10.1%) | 442 (11.9%) |
| 35 to 39 Minutes | 264 (5.2%) | 266 (7.2%) |
| 40 to 44 Minutes | 234 (4.6%) | 254 (6.8%) |
| 45 to 59 Minutes | 834 (16.5%) | 432 (11.6%) |
| 60 to 89 Minutes | 710 (14.0%) | 450 (12.1%) |
| 90 or more Minutes | 250 (4.9%) | 55 (1.5%) |
Time of Departure to Work by Sex in Bothell West
The most frequent times of departure to work in Bothell West are 9:00 AM to 9:59 AM (690, 13.6%) for males and 6:30 AM to 6:59 AM (617, 16.6%) for females.
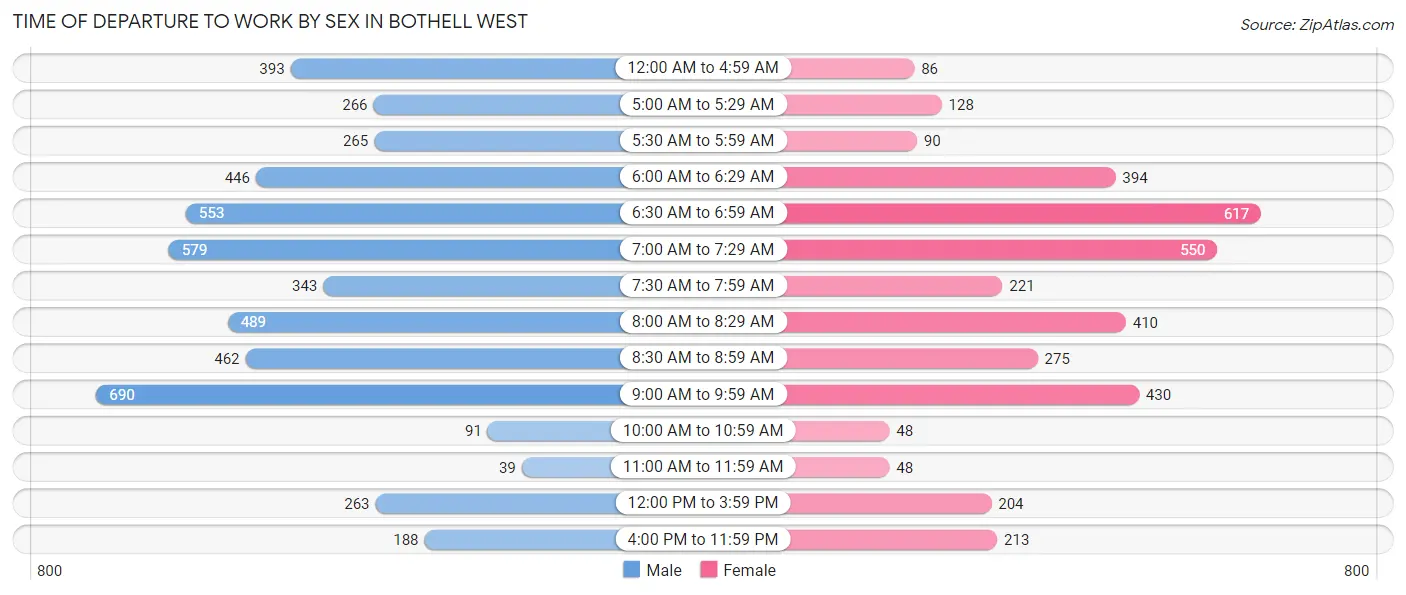
| Time of Departure | Male | Female |
| 12:00 AM to 4:59 AM | 393 (7.8%) | 86 (2.3%) |
| 5:00 AM to 5:29 AM | 266 (5.2%) | 128 (3.5%) |
| 5:30 AM to 5:59 AM | 265 (5.2%) | 90 (2.4%) |
| 6:00 AM to 6:29 AM | 446 (8.8%) | 394 (10.6%) |
| 6:30 AM to 6:59 AM | 553 (10.9%) | 617 (16.6%) |
| 7:00 AM to 7:29 AM | 579 (11.4%) | 550 (14.8%) |
| 7:30 AM to 7:59 AM | 343 (6.8%) | 221 (5.9%) |
| 8:00 AM to 8:29 AM | 489 (9.7%) | 410 (11.0%) |
| 8:30 AM to 8:59 AM | 462 (9.1%) | 275 (7.4%) |
| 9:00 AM to 9:59 AM | 690 (13.6%) | 430 (11.6%) |
| 10:00 AM to 10:59 AM | 91 (1.8%) | 48 (1.3%) |
| 11:00 AM to 11:59 AM | 39 (0.8%) | 48 (1.3%) |
| 12:00 PM to 3:59 PM | 263 (5.2%) | 204 (5.5%) |
| 4:00 PM to 11:59 PM | 188 (3.7%) | 213 (5.7%) |
| Total | 5,067 (100.0%) | 3,714 (100.0%) |
Housing Occupancy in Bothell West
Occupancy by Ownership in Bothell West
Of the total 7,463 dwellings in Bothell West, owner-occupied units account for 5,928 (79.4%), while renter-occupied units make up 1,535 (20.6%).
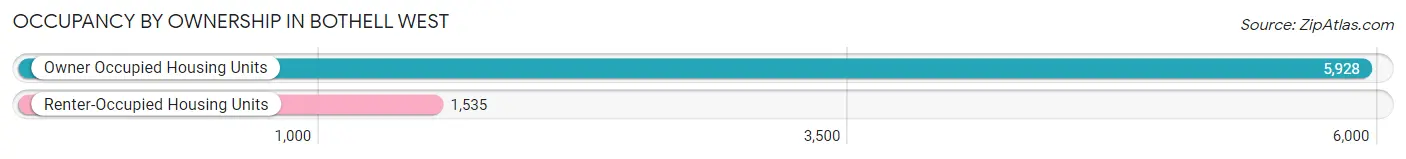
| Occupancy | # Housing Units | % Housing Units |
| Owner Occupied Housing Units | 5,928 | 79.4% |
| Renter-Occupied Housing Units | 1,535 | 20.6% |
| Total Occupied Housing Units | 7,463 | 100.0% |
Occupancy by Household Size in Bothell West
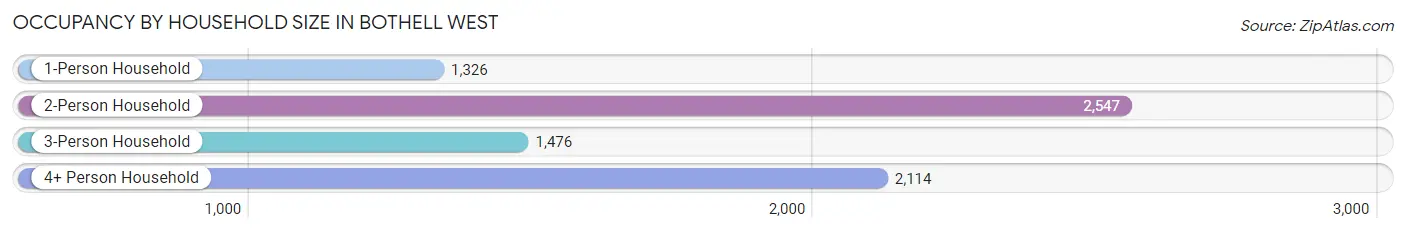
| Household Size | # Housing Units | % Housing Units |
| 1-Person Household | 1,326 | 17.8% |
| 2-Person Household | 2,547 | 34.1% |
| 3-Person Household | 1,476 | 19.8% |
| 4+ Person Household | 2,114 | 28.3% |
| Total Housing Units | 7,463 | 100.0% |
Occupancy by Ownership by Household Size in Bothell West
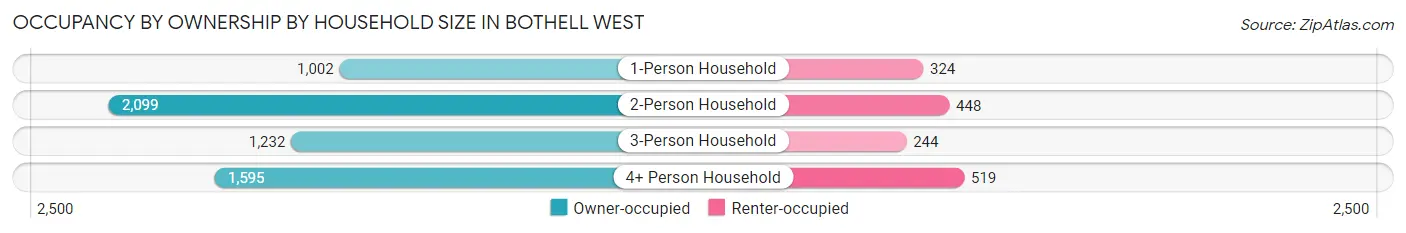
| Household Size | Owner-occupied | Renter-occupied |
| 1-Person Household | 1,002 (75.6%) | 324 (24.4%) |
| 2-Person Household | 2,099 (82.4%) | 448 (17.6%) |
| 3-Person Household | 1,232 (83.5%) | 244 (16.5%) |
| 4+ Person Household | 1,595 (75.4%) | 519 (24.5%) |
| Total Housing Units | 5,928 (79.4%) | 1,535 (20.6%) |
Occupancy by Educational Attainment in Bothell West
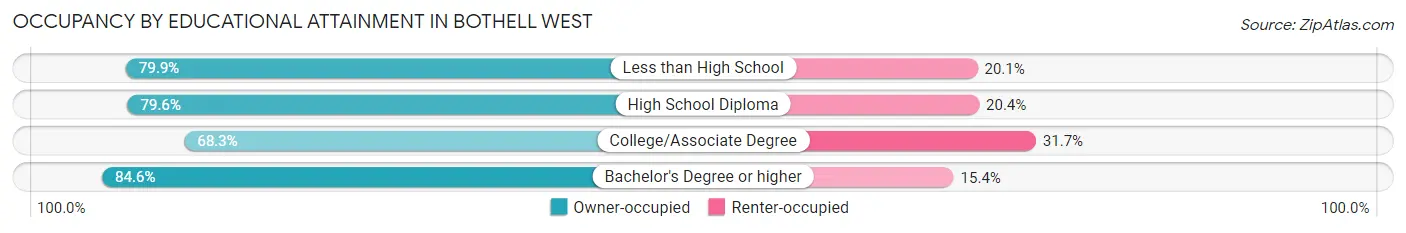
| Household Size | Owner-occupied | Renter-occupied |
| Less than High School | 183 (79.9%) | 46 (20.1%) |
| High School Diploma | 550 (79.6%) | 141 (20.4%) |
| College/Associate Degree | 1,437 (68.3%) | 666 (31.7%) |
| Bachelor's Degree or higher | 3,758 (84.6%) | 682 (15.4%) |
Occupancy by Age of Householder in Bothell West
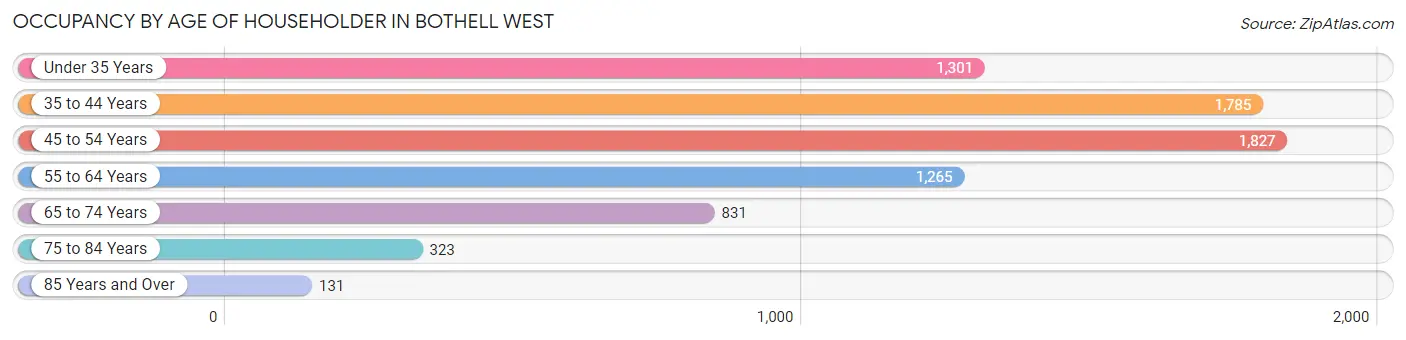
| Age Bracket | # Households | % Households |
| Under 35 Years | 1,301 | 17.4% |
| 35 to 44 Years | 1,785 | 23.9% |
| 45 to 54 Years | 1,827 | 24.5% |
| 55 to 64 Years | 1,265 | 17.0% |
| 65 to 74 Years | 831 | 11.1% |
| 75 to 84 Years | 323 | 4.3% |
| 85 Years and Over | 131 | 1.8% |
| Total | 7,463 | 100.0% |
Housing Finances in Bothell West
Median Income by Occupancy in Bothell West
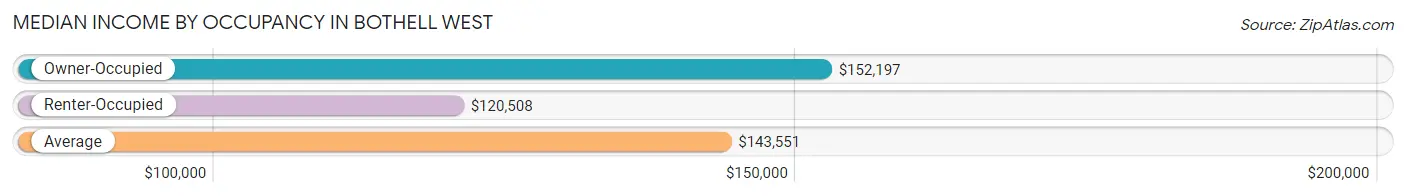
| Occupancy Type | # Households | Median Income |
| Owner-Occupied | 5,928 (79.4%) | $152,197 |
| Renter-Occupied | 1,535 (20.6%) | $120,508 |
| Average | 7,463 (100.0%) | $143,551 |
Occupancy by Householder Income Bracket in Bothell West
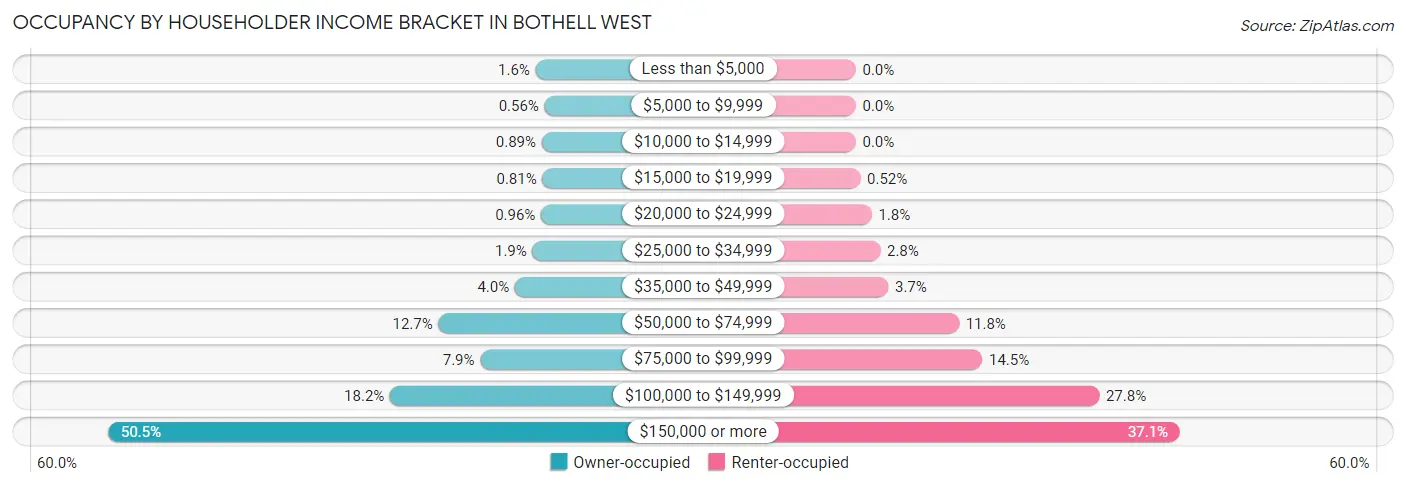
| Income Bracket | Owner-occupied | Renter-occupied |
| Less than $5,000 | 94 (1.6%) | 0 (0.0%) |
| $5,000 to $9,999 | 33 (0.6%) | 0 (0.0%) |
| $10,000 to $14,999 | 53 (0.9%) | 0 (0.0%) |
| $15,000 to $19,999 | 48 (0.8%) | 8 (0.5%) |
| $20,000 to $24,999 | 57 (1.0%) | 28 (1.8%) |
| $25,000 to $34,999 | 115 (1.9%) | 43 (2.8%) |
| $35,000 to $49,999 | 234 (4.0%) | 57 (3.7%) |
| $50,000 to $74,999 | 752 (12.7%) | 181 (11.8%) |
| $75,000 to $99,999 | 469 (7.9%) | 222 (14.5%) |
| $100,000 to $149,999 | 1,080 (18.2%) | 427 (27.8%) |
| $150,000 or more | 2,993 (50.5%) | 569 (37.1%) |
| Total | 5,928 (100.0%) | 1,535 (100.0%) |
Monthly Housing Cost Tiers in Bothell West
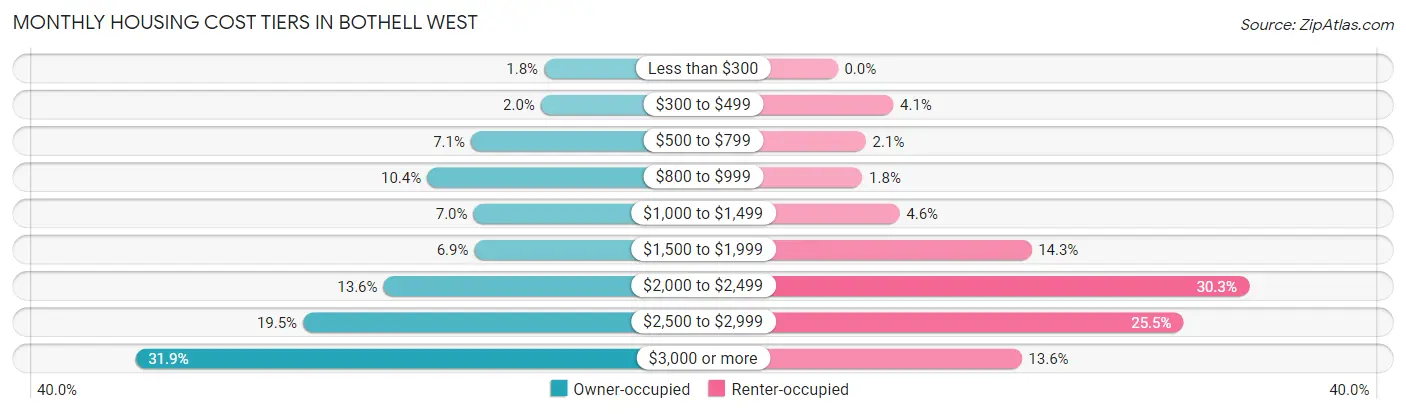
| Monthly Cost | Owner-occupied | Renter-occupied |
| Less than $300 | 104 (1.8%) | 0 (0.0%) |
| $300 to $499 | 118 (2.0%) | 63 (4.1%) |
| $500 to $799 | 423 (7.1%) | 32 (2.1%) |
| $800 to $999 | 614 (10.4%) | 28 (1.8%) |
| $1,000 to $1,499 | 412 (7.0%) | 70 (4.6%) |
| $1,500 to $1,999 | 408 (6.9%) | 219 (14.3%) |
| $2,000 to $2,499 | 805 (13.6%) | 465 (30.3%) |
| $2,500 to $2,999 | 1,156 (19.5%) | 391 (25.5%) |
| $3,000 or more | 1,888 (31.9%) | 208 (13.6%) |
| Total | 5,928 (100.0%) | 1,535 (100.0%) |
Physical Housing Characteristics in Bothell West
Housing Structures in Bothell West
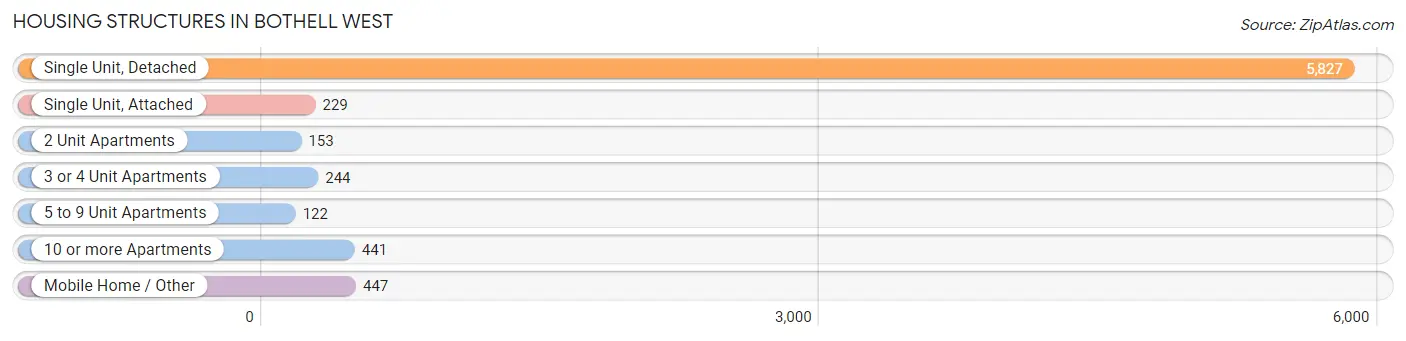
| Structure Type | # Housing Units | % Housing Units |
| Single Unit, Detached | 5,827 | 78.1% |
| Single Unit, Attached | 229 | 3.1% |
| 2 Unit Apartments | 153 | 2.1% |
| 3 or 4 Unit Apartments | 244 | 3.3% |
| 5 to 9 Unit Apartments | 122 | 1.6% |
| 10 or more Apartments | 441 | 5.9% |
| Mobile Home / Other | 447 | 6.0% |
| Total | 7,463 | 100.0% |
Housing Structures by Occupancy in Bothell West
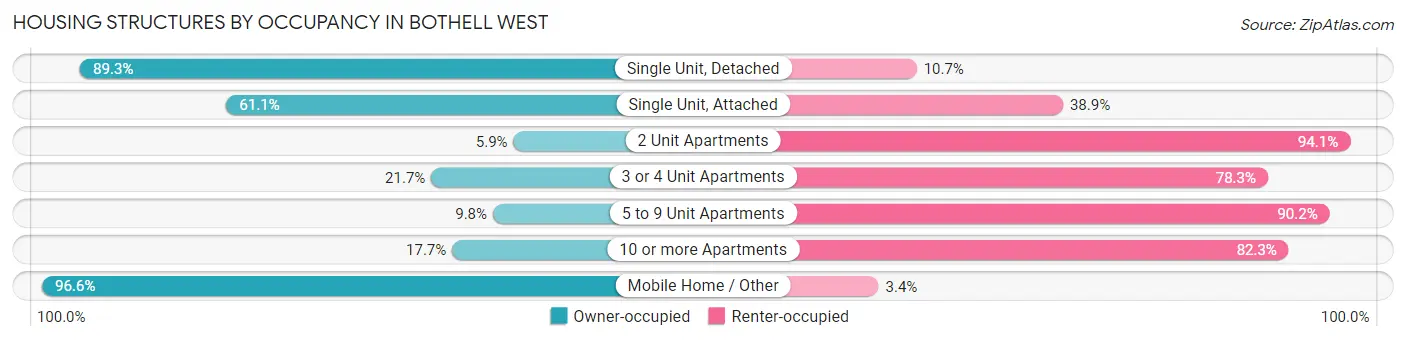
| Structure Type | Owner-occupied | Renter-occupied |
| Single Unit, Detached | 5,204 (89.3%) | 623 (10.7%) |
| Single Unit, Attached | 140 (61.1%) | 89 (38.9%) |
| 2 Unit Apartments | 9 (5.9%) | 144 (94.1%) |
| 3 or 4 Unit Apartments | 53 (21.7%) | 191 (78.3%) |
| 5 to 9 Unit Apartments | 12 (9.8%) | 110 (90.2%) |
| 10 or more Apartments | 78 (17.7%) | 363 (82.3%) |
| Mobile Home / Other | 432 (96.6%) | 15 (3.4%) |
| Total | 5,928 (79.4%) | 1,535 (20.6%) |
Housing Structures by Number of Rooms in Bothell West
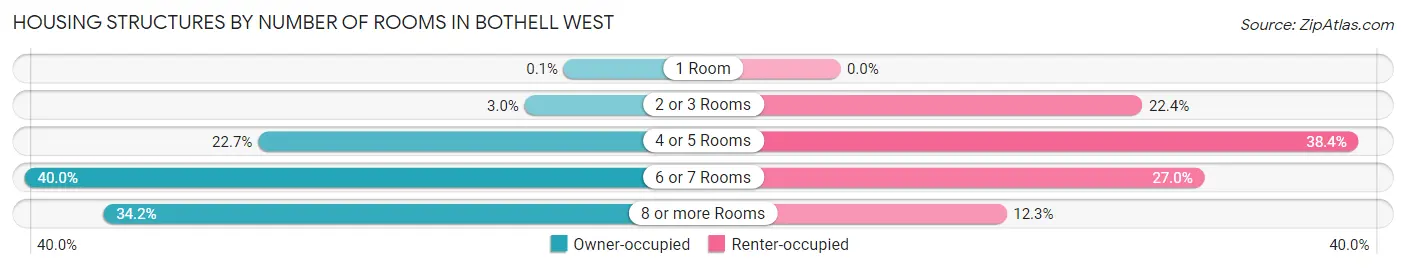
| Number of Rooms | Owner-occupied | Renter-occupied |
| 1 Room | 6 (0.1%) | 0 (0.0%) |
| 2 or 3 Rooms | 178 (3.0%) | 343 (22.4%) |
| 4 or 5 Rooms | 1,347 (22.7%) | 589 (38.4%) |
| 6 or 7 Rooms | 2,371 (40.0%) | 414 (27.0%) |
| 8 or more Rooms | 2,026 (34.2%) | 189 (12.3%) |
| Total | 5,928 (100.0%) | 1,535 (100.0%) |
Housing Structure by Heating Type in Bothell West
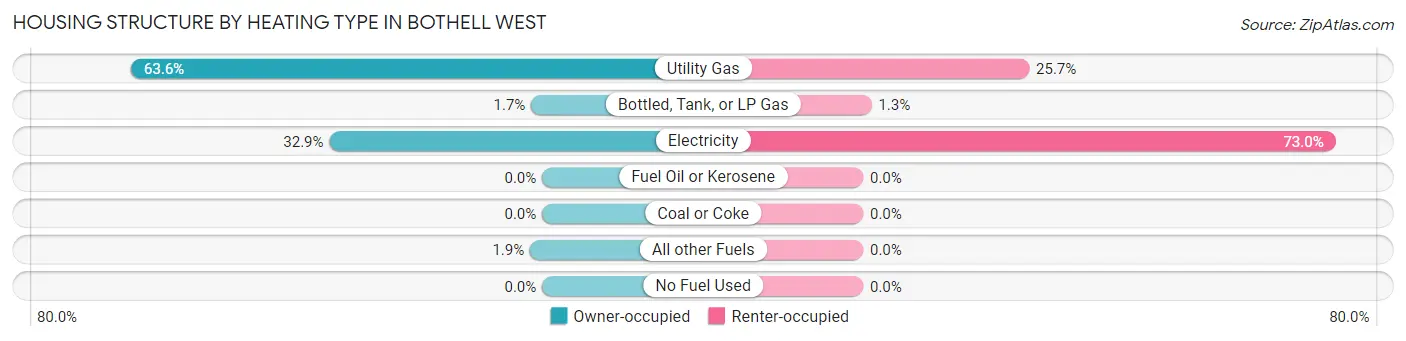
| Heating Type | Owner-occupied | Renter-occupied |
| Utility Gas | 3,768 (63.6%) | 394 (25.7%) |
| Bottled, Tank, or LP Gas | 100 (1.7%) | 20 (1.3%) |
| Electricity | 1,950 (32.9%) | 1,121 (73.0%) |
| Fuel Oil or Kerosene | 0 (0.0%) | 0 (0.0%) |
| Coal or Coke | 0 (0.0%) | 0 (0.0%) |
| All other Fuels | 110 (1.9%) | 0 (0.0%) |
| No Fuel Used | 0 (0.0%) | 0 (0.0%) |
| Total | 5,928 (100.0%) | 1,535 (100.0%) |
Household Vehicle Usage in Bothell West
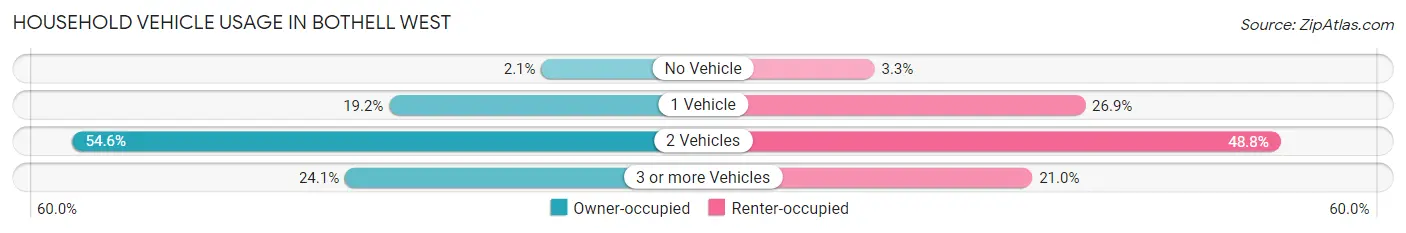
| Vehicles per Household | Owner-occupied | Renter-occupied |
| No Vehicle | 125 (2.1%) | 51 (3.3%) |
| 1 Vehicle | 1,136 (19.2%) | 413 (26.9%) |
| 2 Vehicles | 3,238 (54.6%) | 749 (48.8%) |
| 3 or more Vehicles | 1,429 (24.1%) | 322 (21.0%) |
| Total | 5,928 (100.0%) | 1,535 (100.0%) |
Real Estate & Mortgages in Bothell West
Real Estate and Mortgage Overview in Bothell West
| Characteristic | Without Mortgage | With Mortgage |
| Housing Units | 1,446 | 4,482 |
| Median Property Value | $507,700 | $714,500 |
| Median Household Income | $80,833 | $2,627 |
| Monthly Housing Costs | $838 | $1,878 |
| Real Estate Taxes | $4,634 | $105 |
Property Value by Mortgage Status in Bothell West
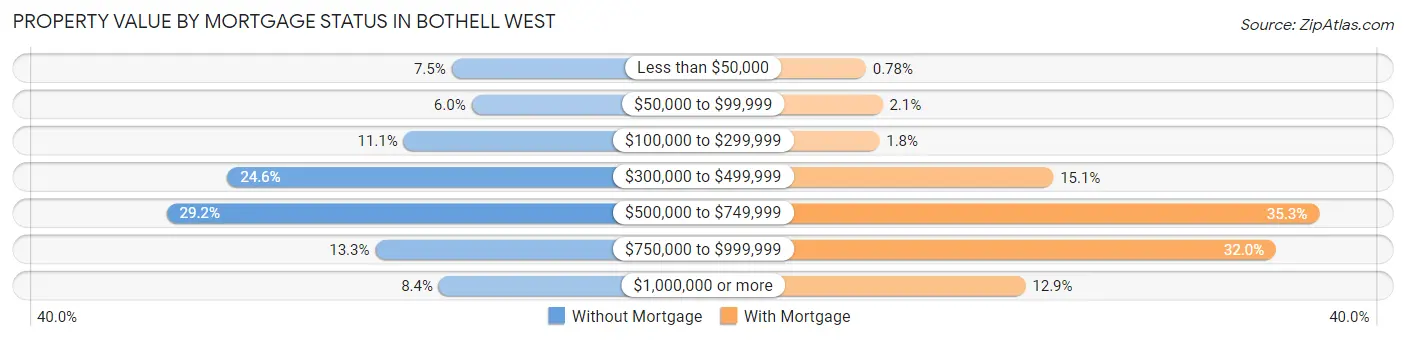
| Property Value | Without Mortgage | With Mortgage |
| Less than $50,000 | 108 (7.5%) | 35 (0.8%) |
| $50,000 to $99,999 | 86 (5.9%) | 92 (2.1%) |
| $100,000 to $299,999 | 161 (11.1%) | 81 (1.8%) |
| $300,000 to $499,999 | 355 (24.5%) | 675 (15.1%) |
| $500,000 to $749,999 | 422 (29.2%) | 1,583 (35.3%) |
| $750,000 to $999,999 | 192 (13.3%) | 1,436 (32.0%) |
| $1,000,000 or more | 122 (8.4%) | 580 (12.9%) |
| Total | 1,446 (100.0%) | 4,482 (100.0%) |
Household Income by Mortgage Status in Bothell West
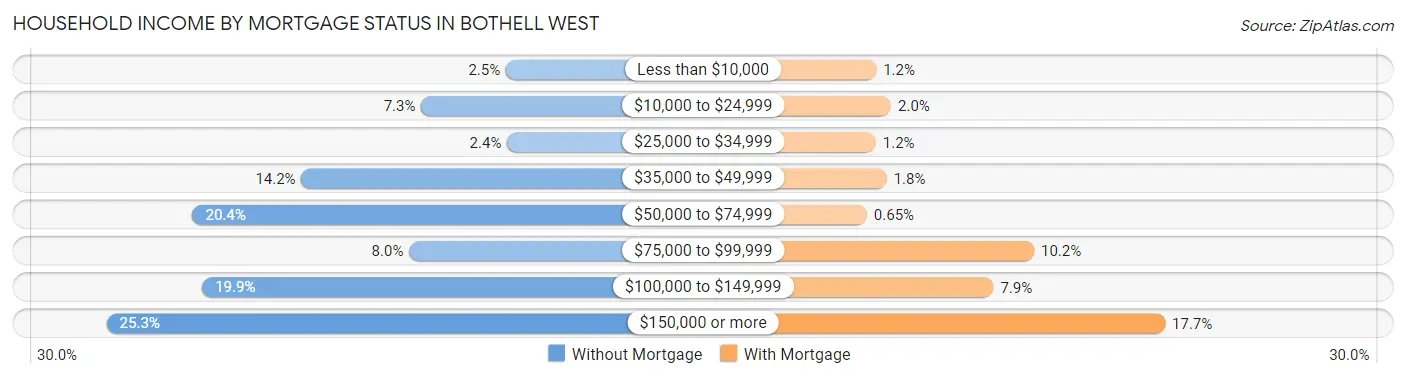
| Household Income | Without Mortgage | With Mortgage |
| Less than $10,000 | 36 (2.5%) | 53 (1.2%) |
| $10,000 to $24,999 | 106 (7.3%) | 91 (2.0%) |
| $25,000 to $34,999 | 35 (2.4%) | 52 (1.2%) |
| $35,000 to $49,999 | 205 (14.2%) | 80 (1.8%) |
| $50,000 to $74,999 | 295 (20.4%) | 29 (0.6%) |
| $75,000 to $99,999 | 116 (8.0%) | 457 (10.2%) |
| $100,000 to $149,999 | 287 (19.9%) | 353 (7.9%) |
| $150,000 or more | 366 (25.3%) | 793 (17.7%) |
| Total | 1,446 (100.0%) | 4,482 (100.0%) |
Property Value to Household Income Ratio in Bothell West
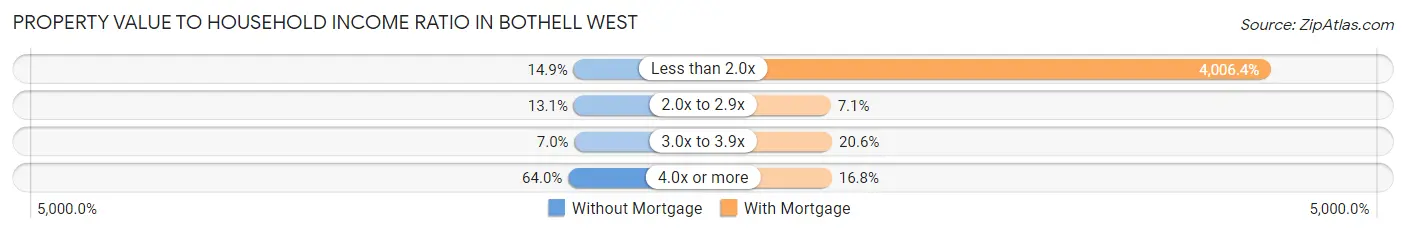
| Value-to-Income Ratio | Without Mortgage | With Mortgage |
| Less than 2.0x | 216 (14.9%) | 179,568 (4,006.4%) |
| 2.0x to 2.9x | 190 (13.1%) | 318 (7.1%) |
| 3.0x to 3.9x | 101 (7.0%) | 921 (20.5%) |
| 4.0x or more | 926 (64.0%) | 752 (16.8%) |
| Total | 1,446 (100.0%) | 4,482 (100.0%) |
Real Estate Taxes by Mortgage Status in Bothell West
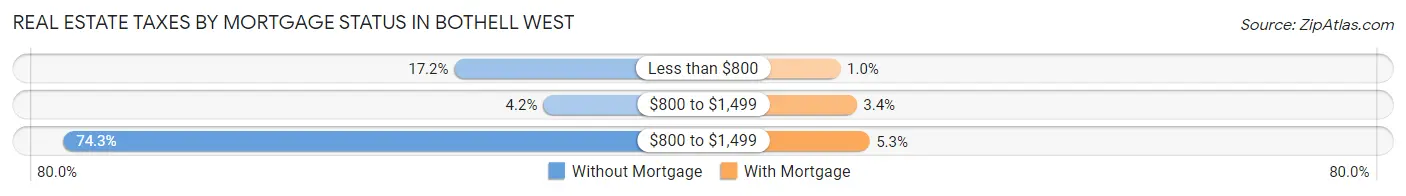
| Property Taxes | Without Mortgage | With Mortgage |
| Less than $800 | 249 (17.2%) | 46 (1.0%) |
| $800 to $1,499 | 61 (4.2%) | 153 (3.4%) |
| $800 to $1,499 | 1,075 (74.3%) | 237 (5.3%) |
| Total | 1,446 (100.0%) | 4,482 (100.0%) |
Health & Disability in Bothell West
Health Insurance Coverage by Age in Bothell West
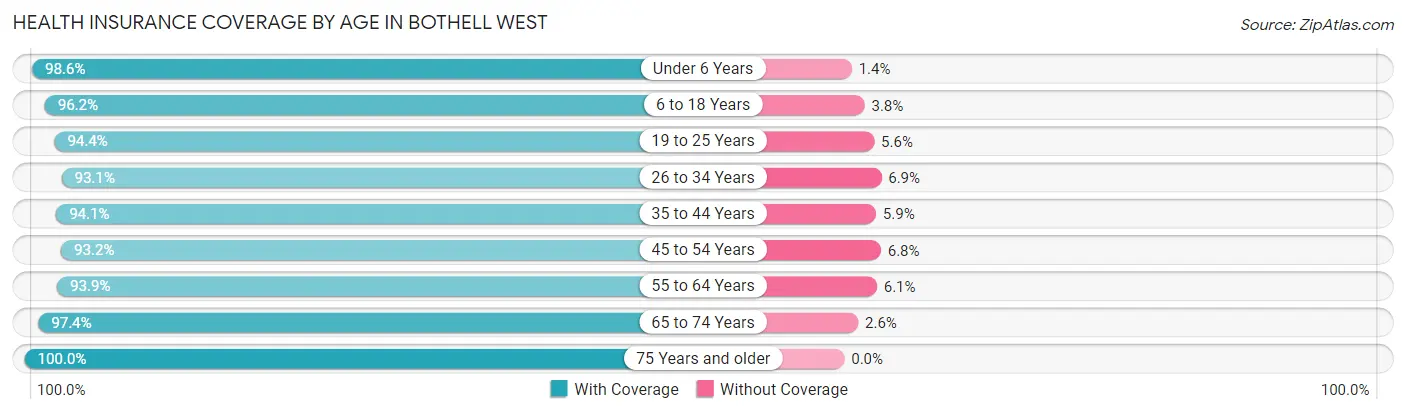
| Age Bracket | With Coverage | Without Coverage |
| Under 6 Years | 1,566 (98.6%) | 22 (1.4%) |
| 6 to 18 Years | 3,033 (96.2%) | 119 (3.8%) |
| 19 to 25 Years | 1,526 (94.4%) | 90 (5.6%) |
| 26 to 34 Years | 2,347 (93.1%) | 174 (6.9%) |
| 35 to 44 Years | 3,416 (94.1%) | 214 (5.9%) |
| 45 to 54 Years | 3,064 (93.2%) | 224 (6.8%) |
| 55 to 64 Years | 2,248 (93.9%) | 145 (6.1%) |
| 65 to 74 Years | 1,514 (97.4%) | 40 (2.6%) |
| 75 Years and older | 767 (100.0%) | 0 (0.0%) |
| Total | 19,481 (95.0%) | 1,028 (5.0%) |
Health Insurance Coverage by Citizenship Status in Bothell West
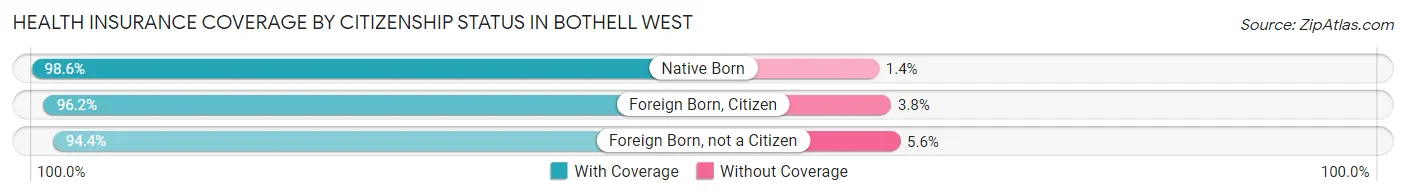
| Citizenship Status | With Coverage | Without Coverage |
| Native Born | 1,566 (98.6%) | 22 (1.4%) |
| Foreign Born, Citizen | 3,033 (96.2%) | 119 (3.8%) |
| Foreign Born, not a Citizen | 1,526 (94.4%) | 90 (5.6%) |
Health Insurance Coverage by Household Income in Bothell West
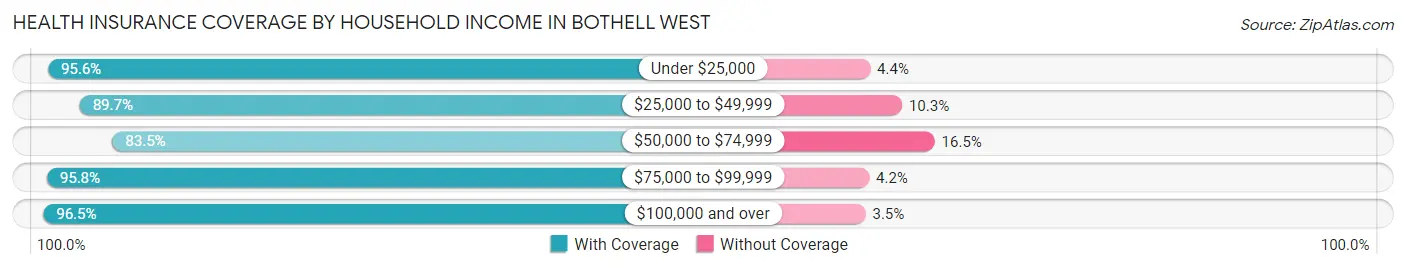
| Household Income | With Coverage | Without Coverage |
| Under $25,000 | 415 (95.6%) | 19 (4.4%) |
| $25,000 to $49,999 | 720 (89.7%) | 83 (10.3%) |
| $50,000 to $74,999 | 1,441 (83.5%) | 284 (16.5%) |
| $75,000 to $99,999 | 1,605 (95.8%) | 70 (4.2%) |
| $100,000 and over | 15,212 (96.5%) | 554 (3.5%) |
Public vs Private Health Insurance Coverage by Age in Bothell West
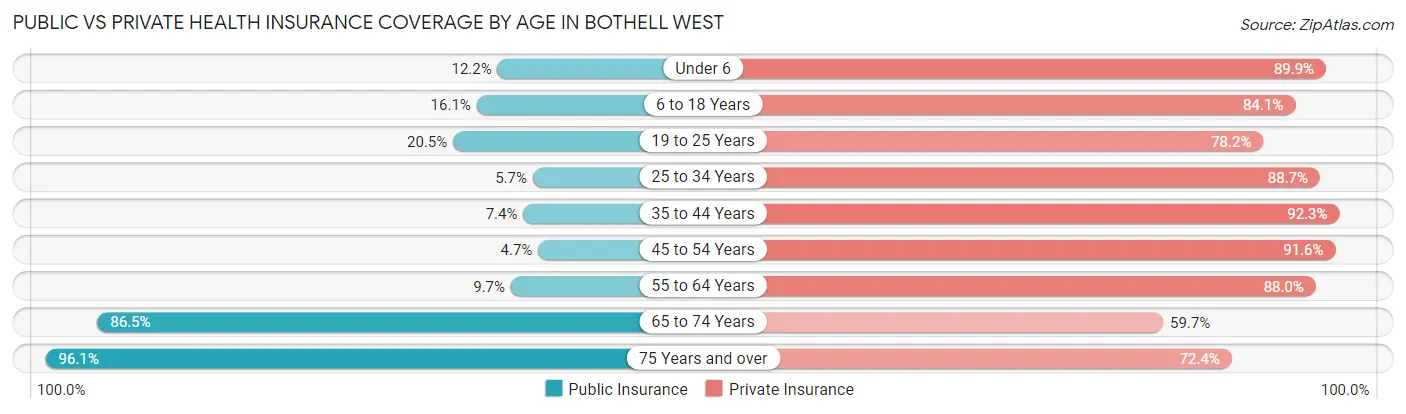
| Age Bracket | Public Insurance | Private Insurance |
| Under 6 | 194 (12.2%) | 1,427 (89.9%) |
| 6 to 18 Years | 507 (16.1%) | 2,652 (84.1%) |
| 19 to 25 Years | 331 (20.5%) | 1,264 (78.2%) |
| 25 to 34 Years | 143 (5.7%) | 2,237 (88.7%) |
| 35 to 44 Years | 270 (7.4%) | 3,352 (92.3%) |
| 45 to 54 Years | 154 (4.7%) | 3,012 (91.6%) |
| 55 to 64 Years | 233 (9.7%) | 2,105 (88.0%) |
| 65 to 74 Years | 1,344 (86.5%) | 927 (59.7%) |
| 75 Years and over | 737 (96.1%) | 555 (72.4%) |
| Total | 3,913 (19.1%) | 17,531 (85.5%) |
Disability Status by Sex by Age in Bothell West
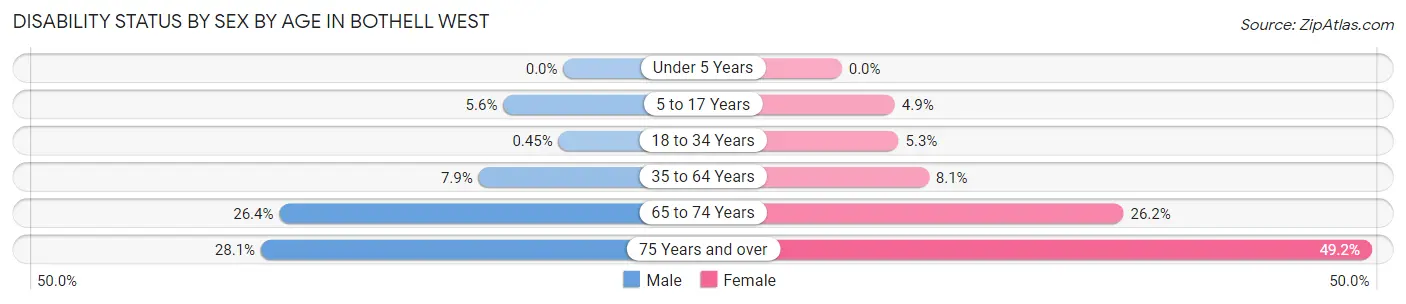
| Age Bracket | Male | Female |
| Under 5 Years | 0 (0.0%) | 0 (0.0%) |
| 5 to 17 Years | 97 (5.6%) | 68 (4.9%) |
| 18 to 34 Years | 10 (0.4%) | 114 (5.3%) |
| 35 to 64 Years | 386 (7.9%) | 356 (8.1%) |
| 65 to 74 Years | 209 (26.4%) | 199 (26.2%) |
| 75 Years and over | 96 (28.1%) | 209 (49.2%) |
Disability Class by Sex by Age in Bothell West
Disability Class: Hearing Difficulty
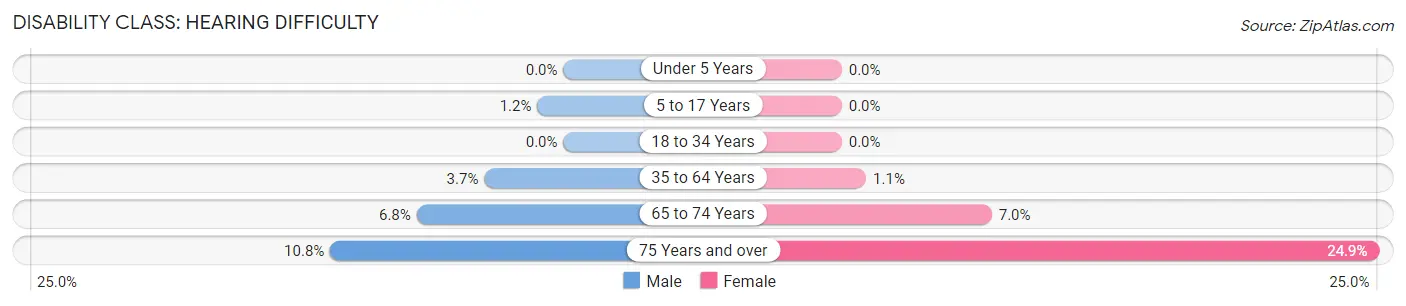
| Age Bracket | Male | Female |
| Under 5 Years | 0 (0.0%) | 0 (0.0%) |
| 5 to 17 Years | 21 (1.2%) | 0 (0.0%) |
| 18 to 34 Years | 0 (0.0%) | 0 (0.0%) |
| 35 to 64 Years | 180 (3.7%) | 50 (1.1%) |
| 65 to 74 Years | 54 (6.8%) | 53 (7.0%) |
| 75 Years and over | 37 (10.8%) | 106 (24.9%) |
Disability Class: Vision Difficulty
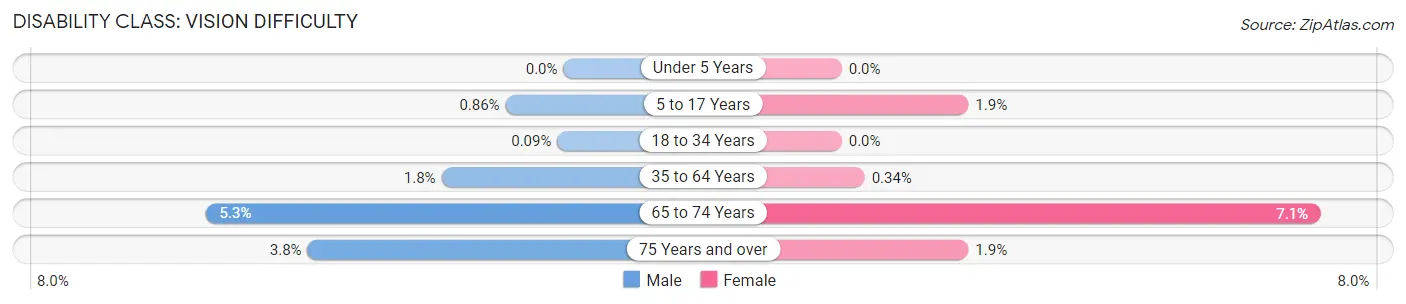
| Age Bracket | Male | Female |
| Under 5 Years | 0 (0.0%) | 0 (0.0%) |
| 5 to 17 Years | 15 (0.9%) | 26 (1.9%) |
| 18 to 34 Years | 2 (0.1%) | 0 (0.0%) |
| 35 to 64 Years | 89 (1.8%) | 15 (0.3%) |
| 65 to 74 Years | 42 (5.3%) | 54 (7.1%) |
| 75 Years and over | 13 (3.8%) | 8 (1.9%) |
Disability Class: Cognitive Difficulty
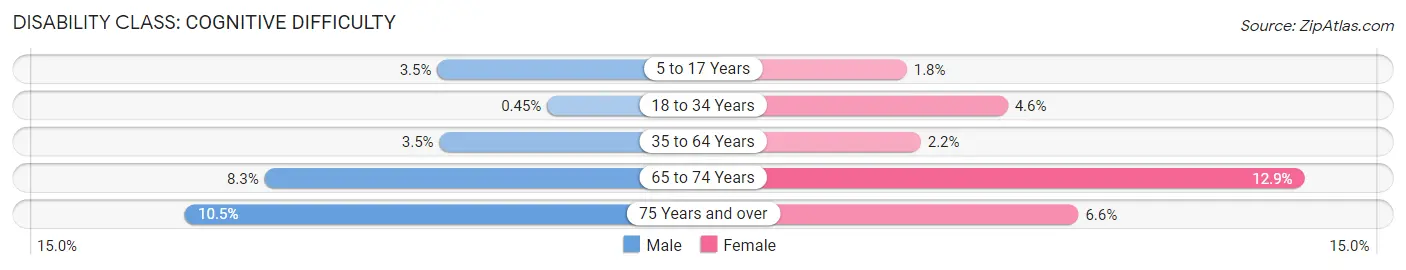
| Age Bracket | Male | Female |
| 5 to 17 Years | 61 (3.5%) | 25 (1.8%) |
| 18 to 34 Years | 10 (0.4%) | 100 (4.6%) |
| 35 to 64 Years | 169 (3.5%) | 97 (2.2%) |
| 65 to 74 Years | 66 (8.3%) | 98 (12.9%) |
| 75 Years and over | 36 (10.5%) | 28 (6.6%) |
Disability Class: Ambulatory Difficulty
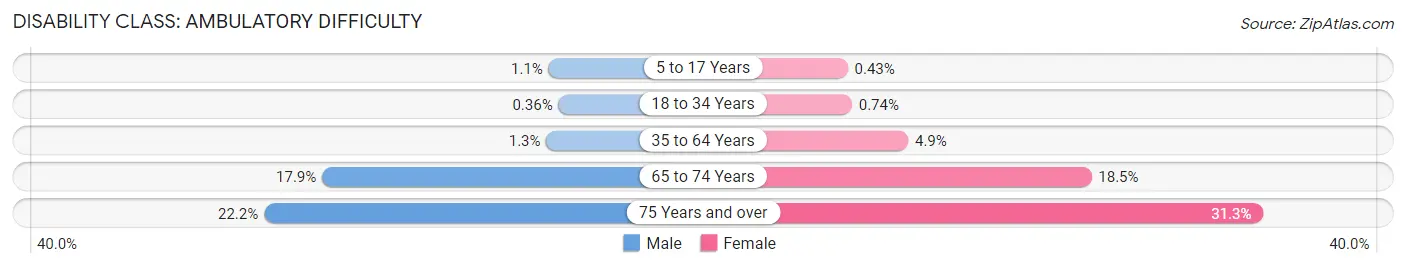
| Age Bracket | Male | Female |
| 5 to 17 Years | 19 (1.1%) | 6 (0.4%) |
| 18 to 34 Years | 8 (0.4%) | 16 (0.7%) |
| 35 to 64 Years | 62 (1.3%) | 217 (4.9%) |
| 65 to 74 Years | 142 (17.9%) | 141 (18.5%) |
| 75 Years and over | 76 (22.2%) | 133 (31.3%) |
Disability Class: Self-Care Difficulty
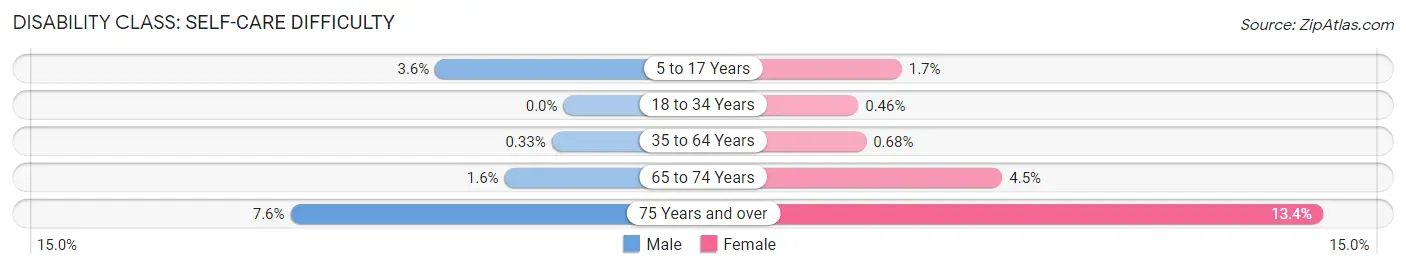
| Age Bracket | Male | Female |
| 5 to 17 Years | 62 (3.6%) | 23 (1.7%) |
| 18 to 34 Years | 0 (0.0%) | 10 (0.5%) |
| 35 to 64 Years | 16 (0.3%) | 30 (0.7%) |
| 65 to 74 Years | 13 (1.6%) | 34 (4.5%) |
| 75 Years and over | 26 (7.6%) | 57 (13.4%) |
Technology Access in Bothell West
Computing Device Access in Bothell West
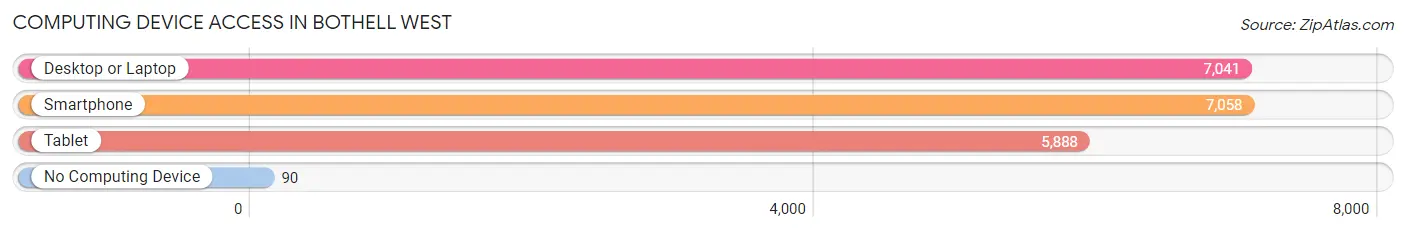
| Device Type | # Households | % Households |
| Desktop or Laptop | 7,041 | 94.4% |
| Smartphone | 7,058 | 94.6% |
| Tablet | 5,888 | 78.9% |
| No Computing Device | 90 | 1.2% |
| Total | 7,463 | 100.0% |
Internet Access in Bothell West
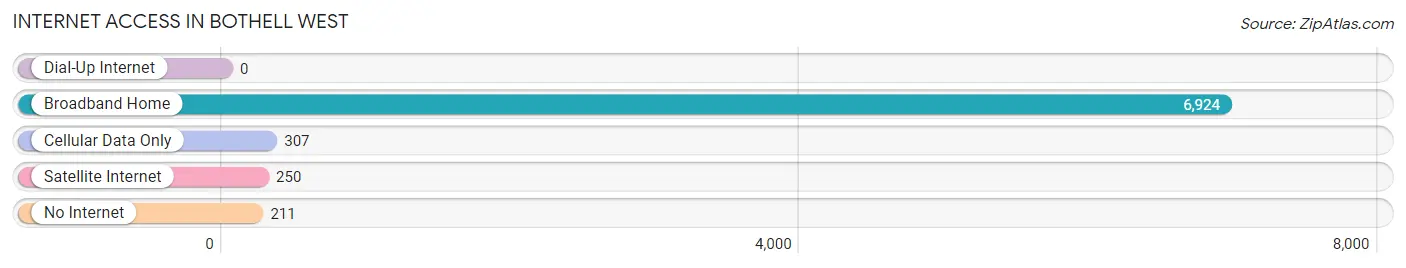
| Internet Type | # Households | % Households |
| Dial-Up Internet | 0 | 0.0% |
| Broadband Home | 6,924 | 92.8% |
| Cellular Data Only | 307 | 4.1% |
| Satellite Internet | 250 | 3.4% |
| No Internet | 211 | 2.8% |
| Total | 7,463 | 100.0% |
Bothell West Summary
Bothell West, WA is a small city located in King County, Washington, United States. It is situated approximately 20 miles northeast of Seattle and is part of the Seattle metropolitan area. Bothell West is bordered by the cities of Bothell, Woodinville, and Kirkland. The population of Bothell West was 8,845 at the 2010 census.
History
The area that is now Bothell West was originally inhabited by the Sammamish people, a Native American tribe. The first European settlers arrived in the area in the late 1800s, and the area was officially incorporated as the City of Bothell West in 1909. The city was named after the nearby Bothell Creek, which was named after the first settler in the area, David Bothell.
In the early 1900s, the area was primarily agricultural, with dairy farms and berry farms being the main sources of income. In the 1950s, the area began to experience rapid growth as the Seattle metropolitan area expanded. This growth was fueled by the construction of Interstate 405, which connected Bothell West to Seattle and other nearby cities.
Geography
Bothell West is located in King County, Washington, United States. It is situated approximately 20 miles northeast of Seattle and is part of the Seattle metropolitan area. Bothell West is bordered by the cities of Bothell, Woodinville, and Kirkland. The city has a total area of 4.2 square miles, all of which is land.
The city is located in the Sammamish River Valley, which is surrounded by the Cascade Mountains to the east and the Olympic Mountains to the west. The city is located at an elevation of approximately 200 feet above sea level.
Economy
The economy of Bothell West is primarily driven by the technology industry. The city is home to several major technology companies, including Microsoft, Amazon, and T-Mobile. The city is also home to several smaller technology companies, as well as a number of retail stores and restaurants.
The city is also home to several educational institutions, including the University of Washington Bothell, Cascadia College, and the Northshore School District.
Demographics
As of the 2010 census, the population of Bothell West was 8,845. The racial makeup of the city was 73.3% White, 11.2% Asian, 8.2% Hispanic or Latino, 4.2% African American, and 3.1% from other races.
The median household income in Bothell West was $76,845, and the median family income was $90,945. The per capita income in Bothell West was $35,945.
Conclusion
Bothell West, WA is a small city located in King County, Washington, United States. It is situated approximately 20 miles northeast of Seattle and is part of the Seattle metropolitan area. Bothell West is bordered by the cities of Bothell, Woodinville, and Kirkland. The population of Bothell West was 8,845 at the 2010 census. The economy of Bothell West is primarily driven by the technology industry, and the city is home to several major technology companies, as well as educational institutions and retail stores. The racial makeup of the city was 73.3% White, 11.2% Asian, 8.2% Hispanic or Latino, 4.2% African American, and 3.1% from other races. The median household income in Bothell West was $76,845, and the median family income was $90,945.
Common Questions
What is Per Capita Income in Bothell West?
Per Capita income in Bothell West is $64,056.
What is the Median Family Income in Bothell West?
Median Family Income in Bothell West is $162,883.
What is the Median Household income in Bothell West?
Median Household Income in Bothell West is $143,551.
What is Income or Wage Gap in Bothell West?
Income or Wage Gap in Bothell West is 36.5%.
Women in Bothell West earn 63.5 cents for every dollar earned by a man.
What is Inequality or Gini Index in Bothell West?
Inequality or Gini Index in Bothell West is 0.39.
What is the Total Population of Bothell West?
Total Population of Bothell West is 20,530.
What is the Total Male Population of Bothell West?
Total Male Population of Bothell West is 10,703.
What is the Total Female Population of Bothell West?
Total Female Population of Bothell West is 9,827.
What is the Ratio of Males per 100 Females in Bothell West?
There are 108.91 Males per 100 Females in Bothell West.
What is the Ratio of Females per 100 Males in Bothell West?
There are 91.82 Females per 100 Males in Bothell West.
What is the Median Population Age in Bothell West?
Median Population Age in Bothell West is 38.8 Years.
What is the Average Family Size in Bothell West
Average Family Size in Bothell West is 3.1 People.
What is the Average Household Size in Bothell West
Average Household Size in Bothell West is 2.7 People.
How Large is the Labor Force in Bothell West?
There are 11,796 People in the Labor Forcein in Bothell West.
What is the Percentage of People in the Labor Force in Bothell West?
71.2% of People are in the Labor Force in Bothell West.
What is the Unemployment Rate in Bothell West?
Unemployment Rate in Bothell West is 3.2%.