Hunts Point, WA Map & Demographics
Hunts Point Map
Hunts Point Overview
$258,149
PER CAPITA INCOME
$250,001
AVG FAMILY INCOME
$250,001
AVG HOUSEHOLD INCOME
51.1%
WAGE / INCOME GAP [ % ]
48.9¢/ $1
WAGE / INCOME GAP [ $ ]
0.53
INEQUALITY / GINI INDEX
323
TOTAL POPULATION
161
MALE POPULATION
162
FEMALE POPULATION
99.38
MALES / 100 FEMALES
100.62
FEMALES / 100 MALES
58.6
MEDIAN AGE
2.7
AVG FAMILY SIZE
2.4
AVG HOUSEHOLD SIZE
124
LABOR FORCE [ PEOPLE ]
44.6%
PERCENT IN LABOR FORCE
0.8%
UNEMPLOYMENT RATE
Hunts Point Area Codes
Income in Hunts Point
Income Overview in Hunts Point
Per Capita Income in Hunts Point is $258,149, while median incomes of families and households are $250,001 and $250,001 respectively.
| Characteristic | Number | Measure |
| Per Capita Income | 323 | $258,149 |
| Median Family Income | 104 | $250,001 |
| Mean Family Income | 104 | $549,394 |
| Median Household Income | 136 | $250,001 |
| Mean Household Income | 136 | $609,224 |
| Income Deficit | 104 | $0 |
| Wage / Income Gap (%) | 323 | 51.07% |
| Wage / Income Gap ($) | 323 | 48.93¢ per $1 |
| Gini / Inequality Index | 323 | 0.53 |
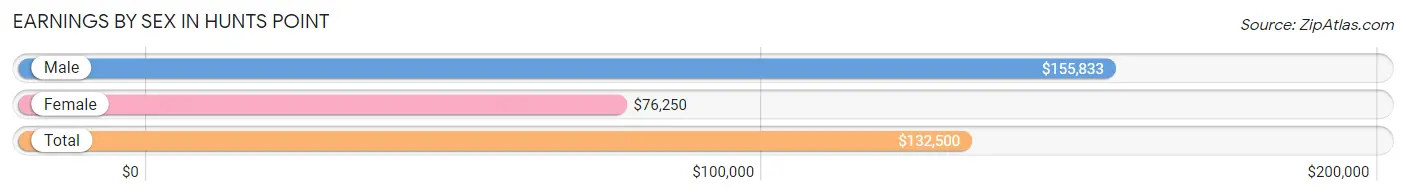
Earnings by Sex in Hunts Point
Average Earnings in Hunts Point are $132,500, $155,833 for men and $76,250 for women, a difference of 51.1%.
| Sex | Number | Average Earnings |
| Male | 86 (65.1%) | $155,833 |
| Female | 46 (34.8%) | $76,250 |
| Total | 132 (100.0%) | $132,500 |
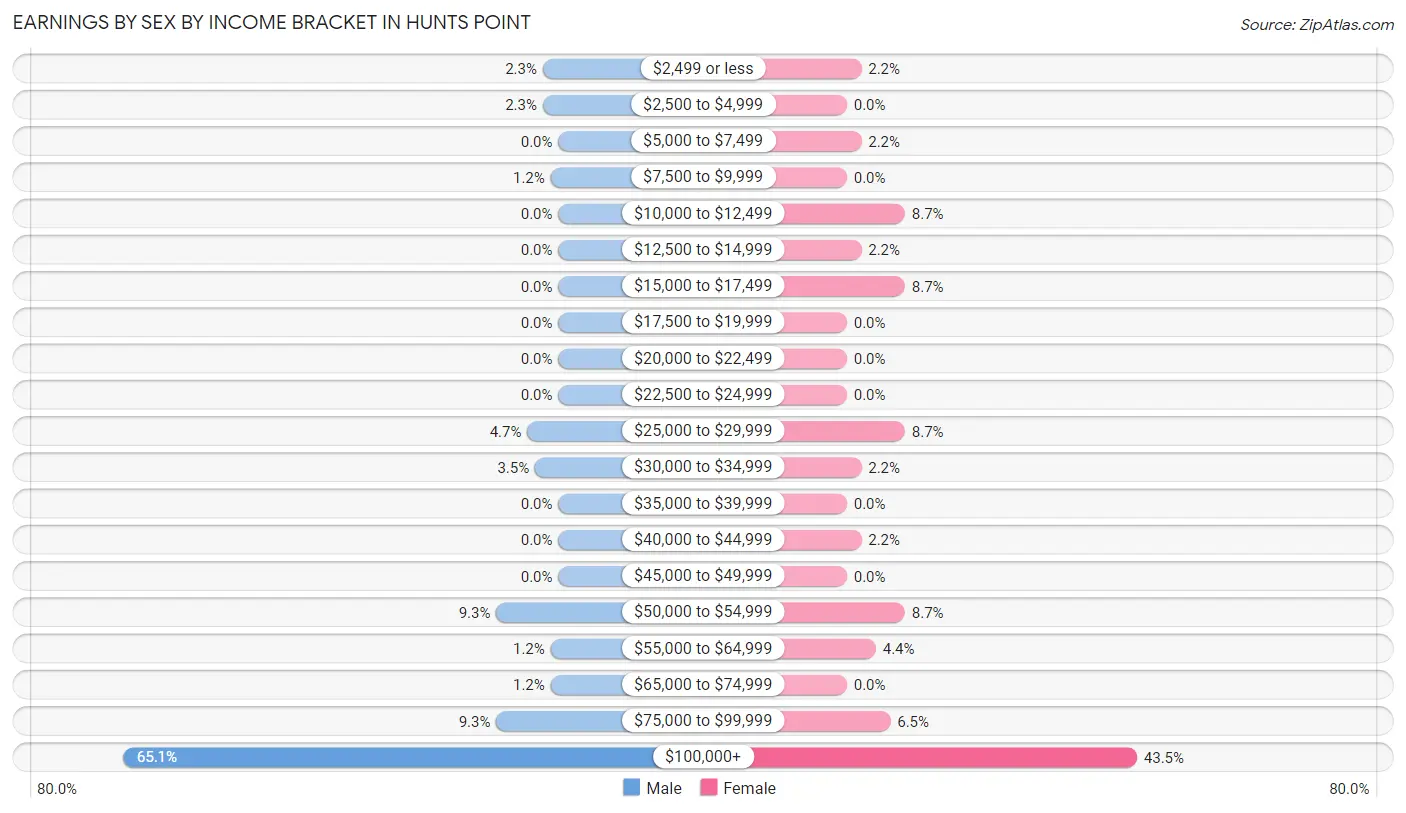
Earnings by Sex by Income Bracket in Hunts Point
The most common earnings brackets in Hunts Point are $100,000+ for men (56 | 65.1%) and $100,000+ for women (20 | 43.5%).
| Income | Male | Female |
| $2,499 or less | 2 (2.3%) | 1 (2.2%) |
| $2,500 to $4,999 | 2 (2.3%) | 0 (0.0%) |
| $5,000 to $7,499 | 0 (0.0%) | 1 (2.2%) |
| $7,500 to $9,999 | 1 (1.2%) | 0 (0.0%) |
| $10,000 to $12,499 | 0 (0.0%) | 4 (8.7%) |
| $12,500 to $14,999 | 0 (0.0%) | 1 (2.2%) |
| $15,000 to $17,499 | 0 (0.0%) | 4 (8.7%) |
| $17,500 to $19,999 | 0 (0.0%) | 0 (0.0%) |
| $20,000 to $22,499 | 0 (0.0%) | 0 (0.0%) |
| $22,500 to $24,999 | 0 (0.0%) | 0 (0.0%) |
| $25,000 to $29,999 | 4 (4.6%) | 4 (8.7%) |
| $30,000 to $34,999 | 3 (3.5%) | 1 (2.2%) |
| $35,000 to $39,999 | 0 (0.0%) | 0 (0.0%) |
| $40,000 to $44,999 | 0 (0.0%) | 1 (2.2%) |
| $45,000 to $49,999 | 0 (0.0%) | 0 (0.0%) |
| $50,000 to $54,999 | 8 (9.3%) | 4 (8.7%) |
| $55,000 to $64,999 | 1 (1.2%) | 2 (4.3%) |
| $65,000 to $74,999 | 1 (1.2%) | 0 (0.0%) |
| $75,000 to $99,999 | 8 (9.3%) | 3 (6.5%) |
| $100,000+ | 56 (65.1%) | 20 (43.5%) |
| Total | 86 (100.0%) | 46 (100.0%) |
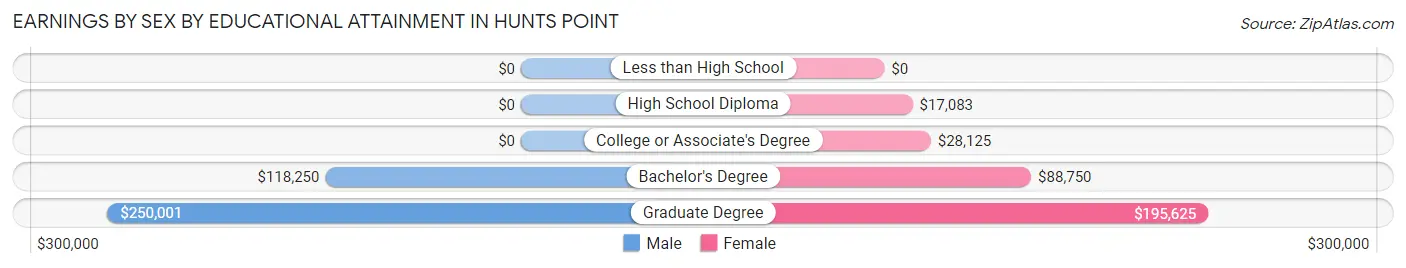
Earnings by Sex by Educational Attainment in Hunts Point
Average earnings in Hunts Point are $157,500 for men and $91,250 for women, a difference of 42.1%. Men with an educational attainment of graduate degree enjoy the highest average annual earnings of $250,001, while those with bachelor's degree education earn the least with $118,250. Women with an educational attainment of graduate degree earn the most with the average annual earnings of $195,625, while those with high school diploma education have the smallest earnings of $17,083.
| Educational Attainment | Male Income | Female Income |
| Less than High School | - | - |
| High School Diploma | - | - |
| College or Associate's Degree | - | - |
| Bachelor's Degree | $118,250 | $88,750 |
| Graduate Degree | $250,001 | $195,625 |
| Total | $157,500 | $91,250 |
Family Income in Hunts Point
Family Income Brackets in Hunts Point
According to the Hunts Point family income data, there are 60 families falling into the $200,000+ income range, which is the most common income bracket and makes up 57.7% of all families.
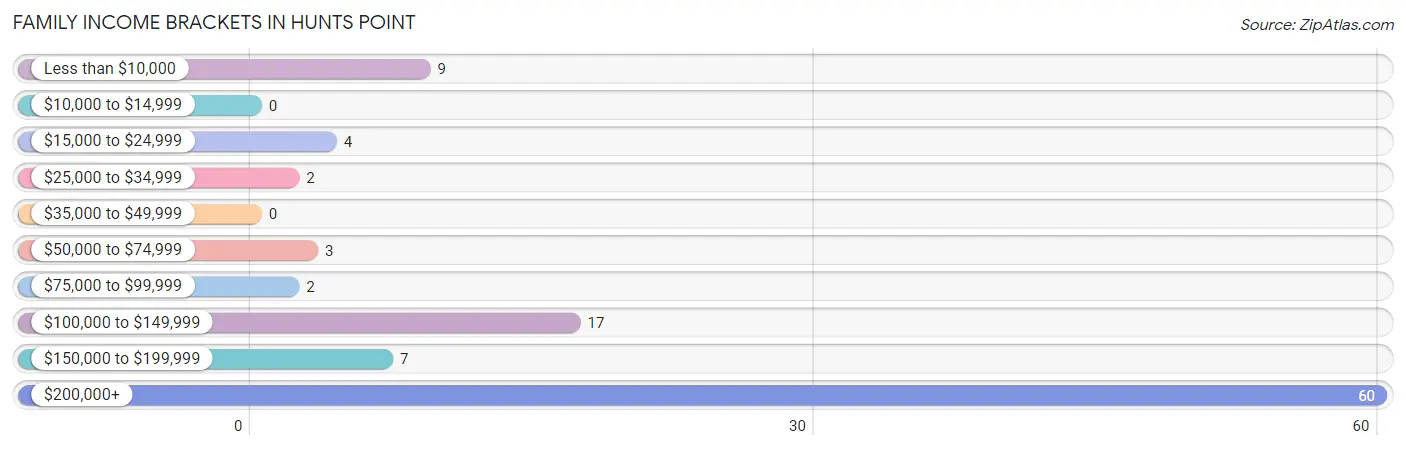
| Income Bracket | # Families | % Families |
| Less than $10,000 | 9 | 8.7% |
| $10,000 to $14,999 | 0 | 0.0% |
| $15,000 to $24,999 | 4 | 3.8% |
| $25,000 to $34,999 | 2 | 1.9% |
| $35,000 to $49,999 | 0 | 0.0% |
| $50,000 to $74,999 | 3 | 2.9% |
| $75,000 to $99,999 | 2 | 1.9% |
| $100,000 to $149,999 | 17 | 16.3% |
| $150,000 to $199,999 | 7 | 6.7% |
| $200,000+ | 60 | 57.7% |
Family Income by Famaliy Size in Hunts Point
2-person families (66 | 63.5%) account for the highest median family income in Hunts Point with $250,001 per family, while 2-person families (66 | 63.5%) have the highest median income of $125,000 per family member.
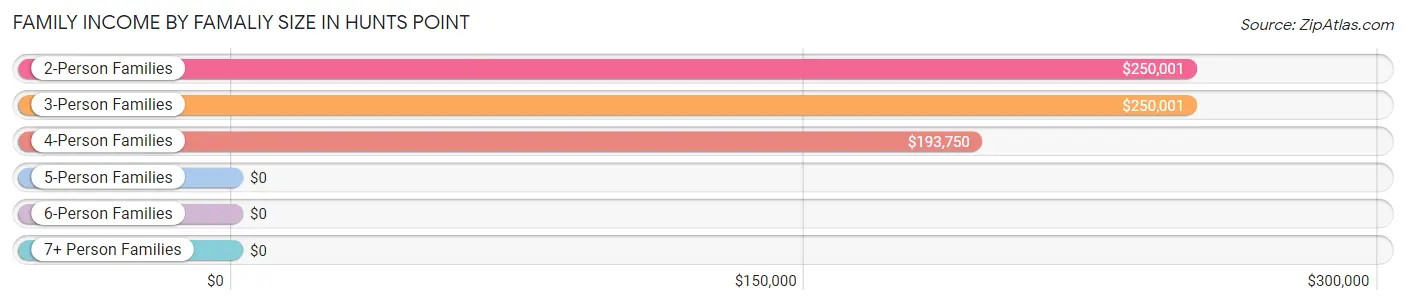
| Income Bracket | # Families | Median Income |
| 2-Person Families | 66 (63.5%) | $250,001 |
| 3-Person Families | 13 (12.5%) | $250,001 |
| 4-Person Families | 19 (18.3%) | $193,750 |
| 5-Person Families | 4 (3.8%) | $0 |
| 6-Person Families | 1 (1.0%) | $0 |
| 7+ Person Families | 1 (1.0%) | $0 |
| Total | 104 (100.0%) | $250,001 |
Family Income by Number of Earners in Hunts Point
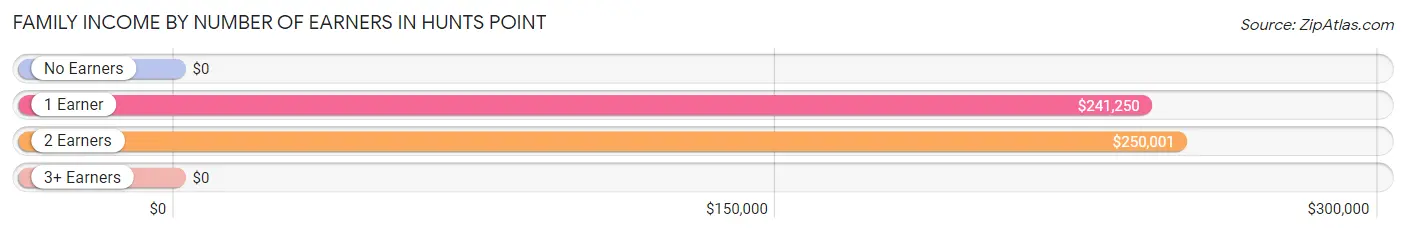
| Number of Earners | # Families | Median Income |
| No Earners | 31 (29.8%) | $0 |
| 1 Earner | 42 (40.4%) | $241,250 |
| 2 Earners | 29 (27.9%) | $250,001 |
| 3+ Earners | 2 (1.9%) | $0 |
| Total | 104 (100.0%) | $250,001 |
Household Income in Hunts Point
Household Income Brackets in Hunts Point
With 88 households falling in the category, the $200,000+ income range is the most frequent in Hunts Point, accounting for 64.7% of all households.
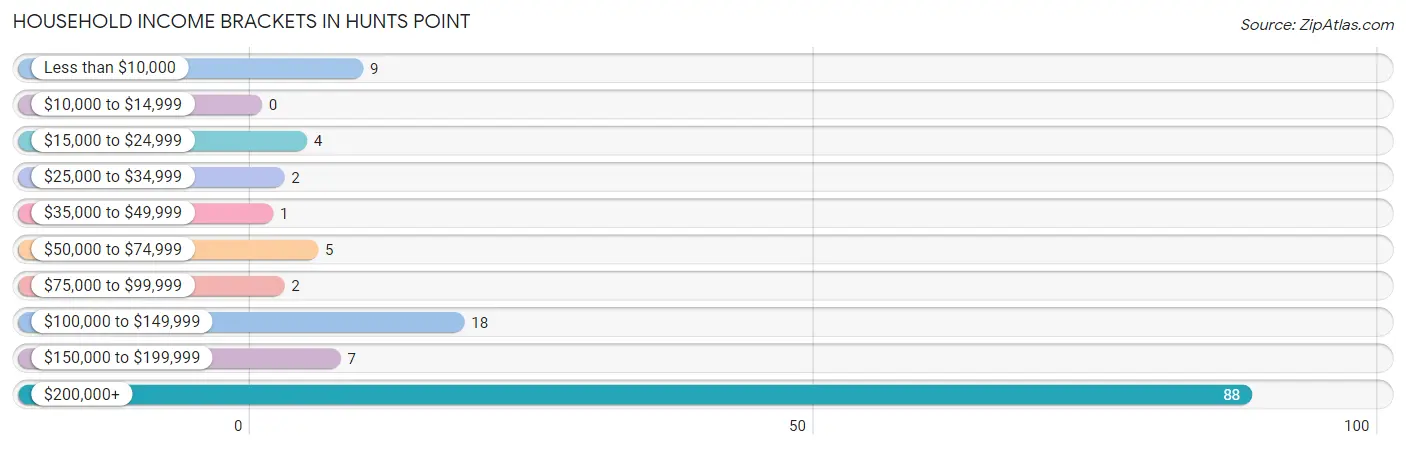
| Income Bracket | # Households | % Households |
| Less than $10,000 | 9 | 6.6% |
| $10,000 to $14,999 | 0 | 0.0% |
| $15,000 to $24,999 | 4 | 2.9% |
| $25,000 to $34,999 | 2 | 1.5% |
| $35,000 to $49,999 | 1 | 0.7% |
| $50,000 to $74,999 | 5 | 3.7% |
| $75,000 to $99,999 | 2 | 1.5% |
| $100,000 to $149,999 | 18 | 13.2% |
| $150,000 to $199,999 | 7 | 5.1% |
| $200,000+ | 88 | 64.7% |
Household Income by Householder Age in Hunts Point
The median household income in Hunts Point is $250,001, with the highest median household income of $250,001 found in the 25 to 44 years age bracket for the primary householder. A total of 12 households (8.8%) fall into this category.
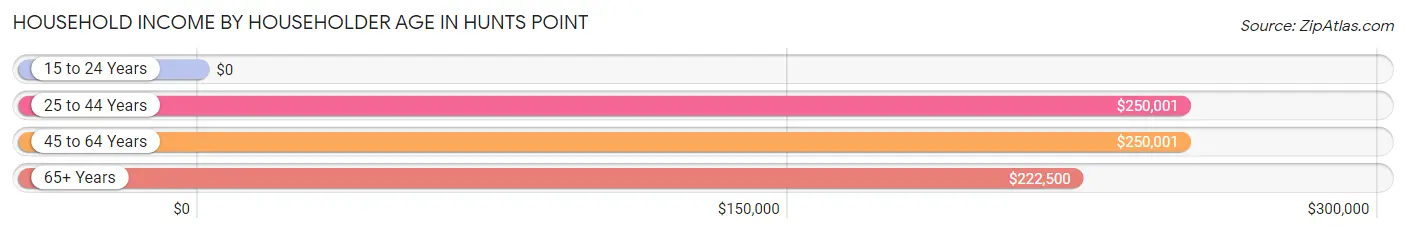
| Income Bracket | # Households | Median Income |
| 15 to 24 Years | 0 (0.0%) | $0 |
| 25 to 44 Years | 12 (8.8%) | $250,001 |
| 45 to 64 Years | 56 (41.2%) | $250,001 |
| 65+ Years | 68 (50.0%) | $222,500 |
| Total | 136 (100.0%) | $250,001 |
Poverty in Hunts Point
Income Below Poverty by Sex and Age in Hunts Point
With 7.4% poverty level for males and 8.6% for females among the residents of Hunts Point, 16 and 17 year old males and 18 to 24 year old females are the most vulnerable to poverty, with 2 males (33.3%) and 3 females (60.0%) in their respective age groups living below the poverty level.
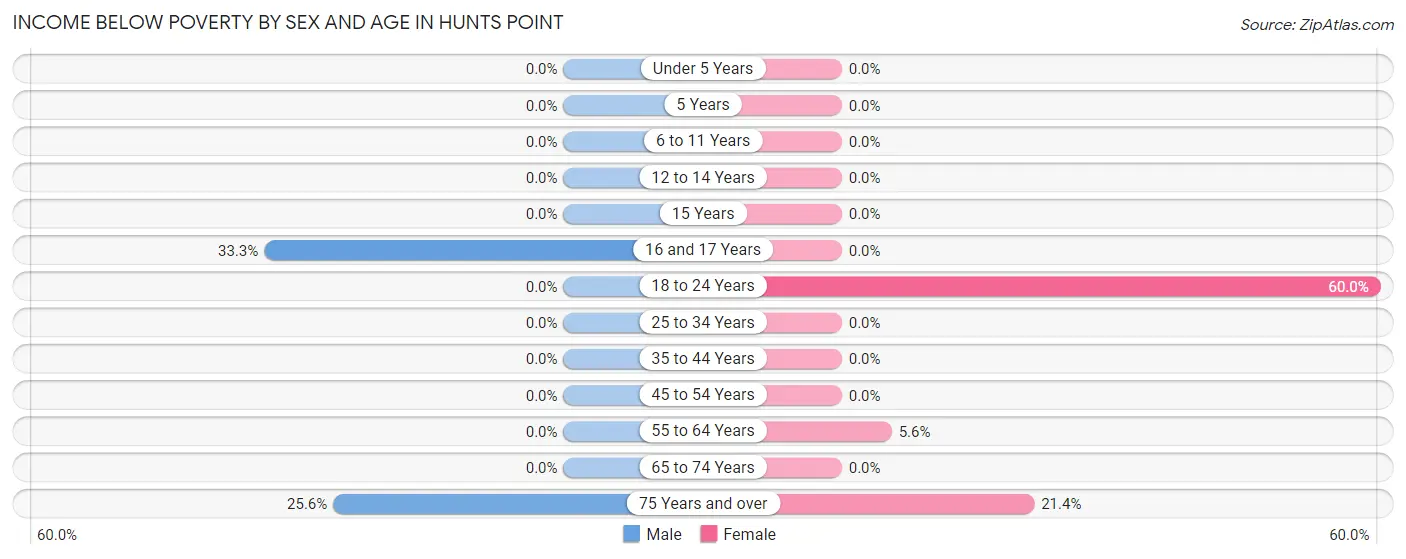
| Age Bracket | Male | Female |
| Under 5 Years | 0 (0.0%) | 0 (0.0%) |
| 5 Years | 0 (0.0%) | 0 (0.0%) |
| 6 to 11 Years | 0 (0.0%) | 0 (0.0%) |
| 12 to 14 Years | 0 (0.0%) | 0 (0.0%) |
| 15 Years | 0 (0.0%) | 0 (0.0%) |
| 16 and 17 Years | 2 (33.3%) | 0 (0.0%) |
| 18 to 24 Years | 0 (0.0%) | 3 (60.0%) |
| 25 to 34 Years | 0 (0.0%) | 0 (0.0%) |
| 35 to 44 Years | 0 (0.0%) | 0 (0.0%) |
| 45 to 54 Years | 0 (0.0%) | 0 (0.0%) |
| 55 to 64 Years | 0 (0.0%) | 2 (5.6%) |
| 65 to 74 Years | 0 (0.0%) | 0 (0.0%) |
| 75 Years and over | 10 (25.6%) | 9 (21.4%) |
| Total | 12 (7.4%) | 14 (8.6%) |
Income Above Poverty by Sex and Age in Hunts Point
According to the poverty statistics in Hunts Point, males aged under 5 years and females aged under 5 years are the age groups that are most secure financially, with 100.0% of males and 100.0% of females in these age groups living above the poverty line.
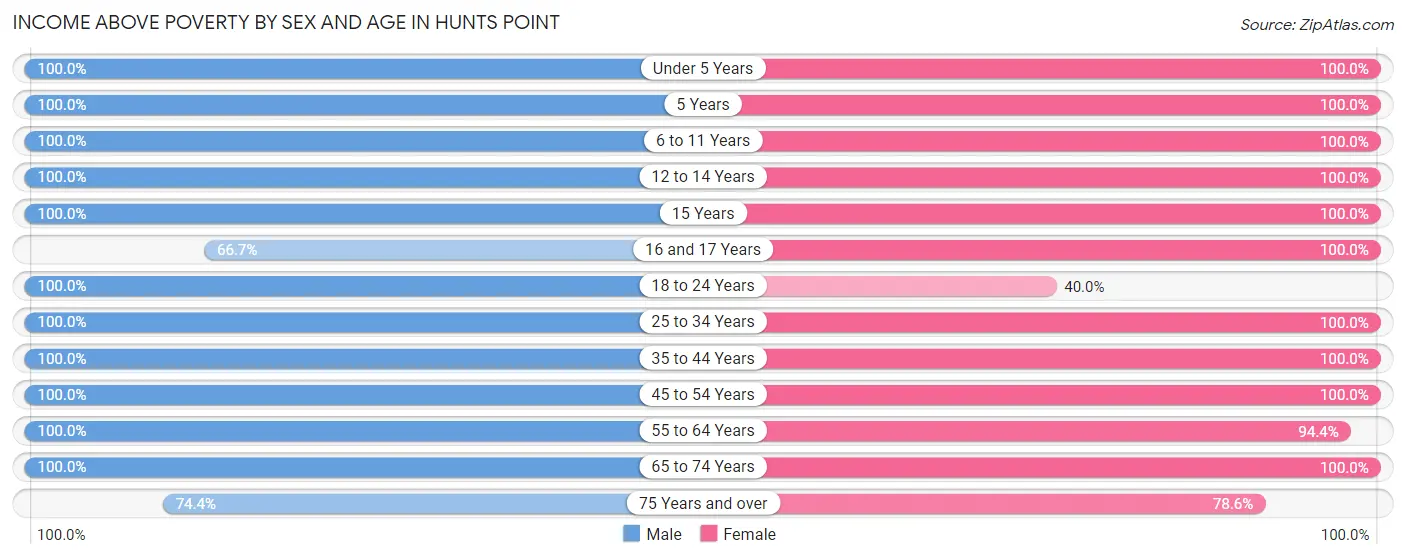
| Age Bracket | Male | Female |
| Under 5 Years | 6 (100.0%) | 3 (100.0%) |
| 5 Years | 3 (100.0%) | 1 (100.0%) |
| 6 to 11 Years | 6 (100.0%) | 8 (100.0%) |
| 12 to 14 Years | 6 (100.0%) | 5 (100.0%) |
| 15 Years | 5 (100.0%) | 2 (100.0%) |
| 16 and 17 Years | 4 (66.7%) | 2 (100.0%) |
| 18 to 24 Years | 3 (100.0%) | 2 (40.0%) |
| 25 to 34 Years | 10 (100.0%) | 3 (100.0%) |
| 35 to 44 Years | 10 (100.0%) | 13 (100.0%) |
| 45 to 54 Years | 22 (100.0%) | 23 (100.0%) |
| 55 to 64 Years | 25 (100.0%) | 34 (94.4%) |
| 65 to 74 Years | 20 (100.0%) | 19 (100.0%) |
| 75 Years and over | 29 (74.4%) | 33 (78.6%) |
| Total | 149 (92.5%) | 148 (91.4%) |
Income Below Poverty Among Married-Couple Families in Hunts Point
The poverty statistics for married-couple families in Hunts Point show that 9.3% or 9 of the total 97 families live below the poverty line. Families with no children have the highest poverty rate of 12.0%, comprising of 9 families. On the other hand, families with 1 or 2 children have the lowest poverty rate of 0.0%, which includes 0 families.
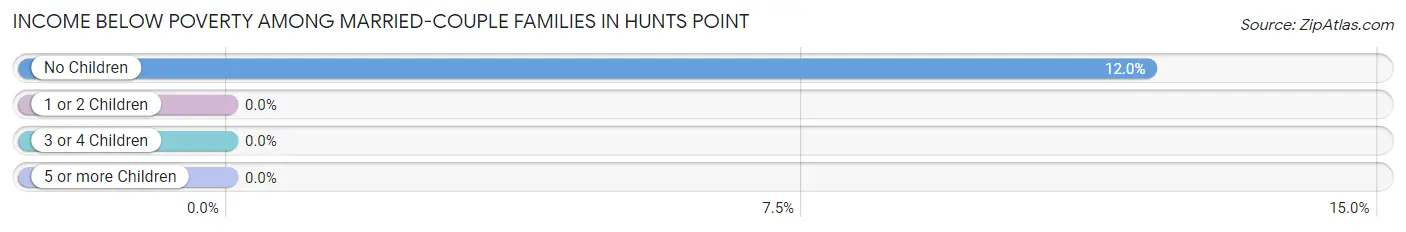
| Children | Above Poverty | Below Poverty |
| No Children | 66 (88.0%) | 9 (12.0%) |
| 1 or 2 Children | 16 (100.0%) | 0 (0.0%) |
| 3 or 4 Children | 6 (100.0%) | 0 (0.0%) |
| 5 or more Children | 0 (0.0%) | 0 (0.0%) |
| Total | 88 (90.7%) | 9 (9.3%) |
Income Below Poverty Among Single-Parent Households in Hunts Point
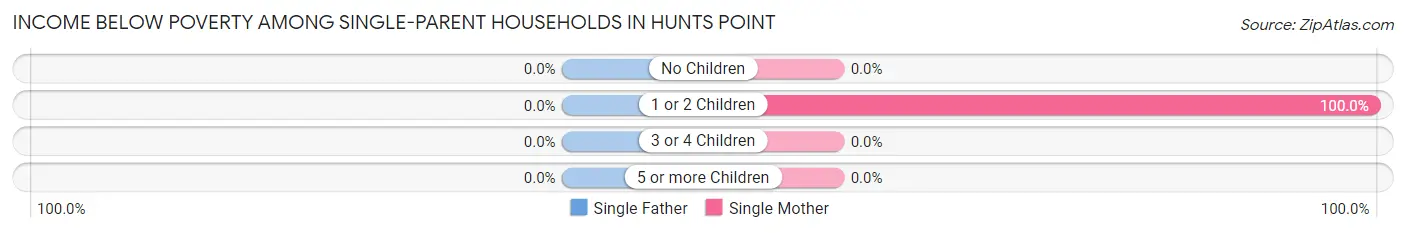
| Children | Single Father | Single Mother |
| No Children | 0 (0.0%) | 0 (0.0%) |
| 1 or 2 Children | 0 (0.0%) | 2 (100.0%) |
| 3 or 4 Children | 0 (0.0%) | 0 (0.0%) |
| 5 or more Children | 0 (0.0%) | 0 (0.0%) |
| Total | 0 (0.0%) | 2 (33.3%) |
Income Below Poverty Among Married-Couple vs Single-Parent Households in Hunts Point
The poverty data for Hunts Point shows that 9 of the married-couple family households (9.3%) and 2 of the single-parent households (28.6%) are living below the poverty level. Within the married-couple family households, those with no children have the highest poverty rate, with 9 households (12.0%) falling below the poverty line. Among the single-parent households, those with 1 or 2 children have the highest poverty rate, with 2 household (100.0%) living below poverty.
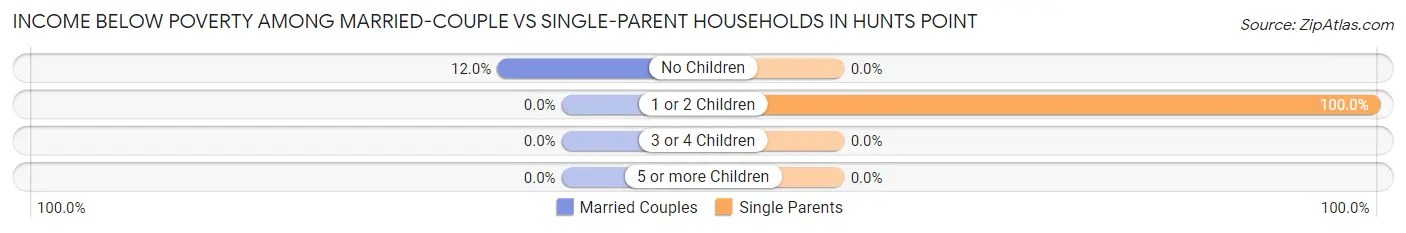
| Children | Married-Couple Families | Single-Parent Households |
| No Children | 9 (12.0%) | 0 (0.0%) |
| 1 or 2 Children | 0 (0.0%) | 2 (100.0%) |
| 3 or 4 Children | 0 (0.0%) | 0 (0.0%) |
| 5 or more Children | 0 (0.0%) | 0 (0.0%) |
| Total | 9 (9.3%) | 2 (28.6%) |
Race in Hunts Point
The most populous races in Hunts Point are White / Caucasian (245 | 75.8%), Asian (53 | 16.4%), and Two or more Races (23 | 7.1%).
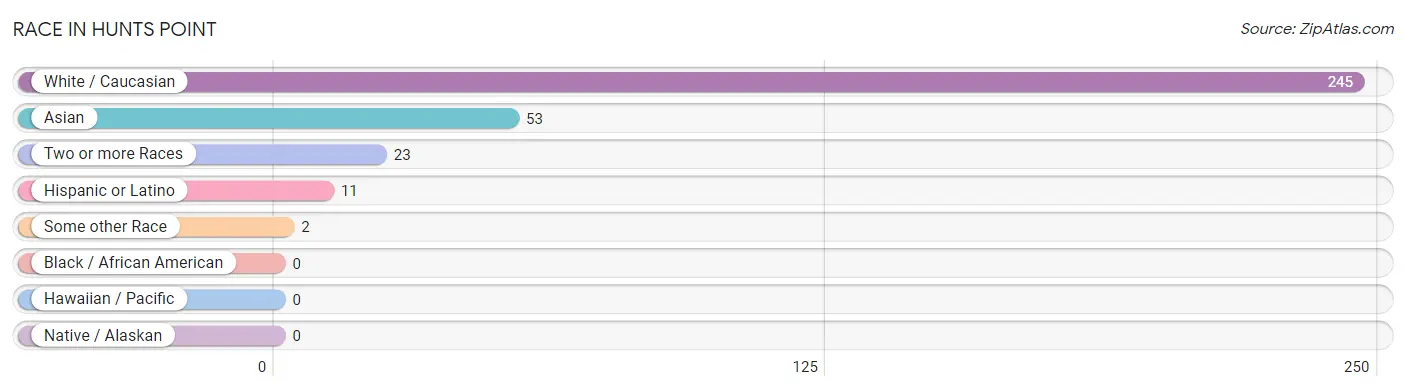
| Race | # Population | % Population |
| Asian | 53 | 16.4% |
| Black / African American | 0 | 0.0% |
| Hawaiian / Pacific | 0 | 0.0% |
| Hispanic or Latino | 11 | 3.4% |
| Native / Alaskan | 0 | 0.0% |
| White / Caucasian | 245 | 75.8% |
| Two or more Races | 23 | 7.1% |
| Some other Race | 2 | 0.6% |
| Total | 323 | 100.0% |
Ancestry in Hunts Point
The most populous ancestries reported in Hunts Point are English (70 | 21.7%), German (42 | 13.0%), Irish (42 | 13.0%), Indian (Asian) (34 | 10.5%), and American (24 | 7.4%), together accounting for 65.6% of all Hunts Point residents.
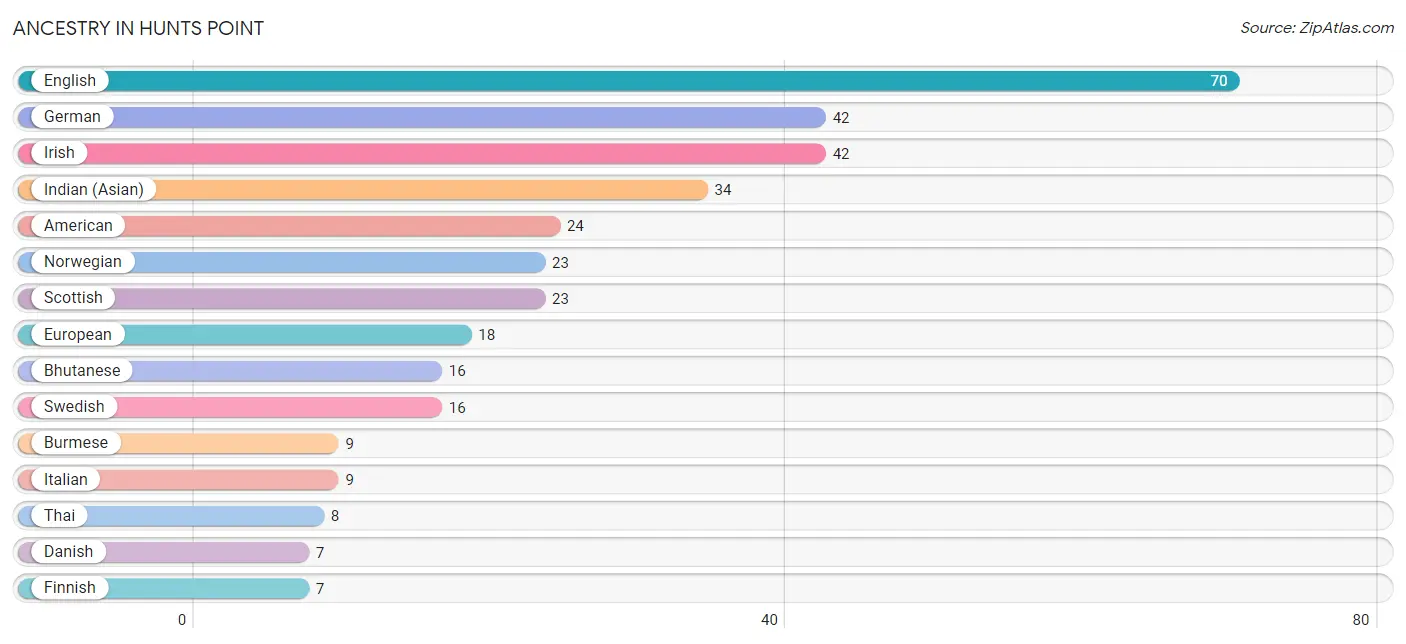
| Ancestry | # Population | % Population |
| American | 24 | 7.4% |
| Austrian | 3 | 0.9% |
| Bhutanese | 16 | 5.0% |
| British | 3 | 0.9% |
| Burmese | 9 | 2.8% |
| Canadian | 2 | 0.6% |
| Central American | 5 | 1.5% |
| Croatian | 2 | 0.6% |
| Czech | 1 | 0.3% |
| Danish | 7 | 2.2% |
| Dutch | 4 | 1.2% |
| Eastern European | 2 | 0.6% |
| English | 70 | 21.7% |
| European | 18 | 5.6% |
| Finnish | 7 | 2.2% |
| French | 7 | 2.2% |
| German | 42 | 13.0% |
| Greek | 1 | 0.3% |
| Guatemalan | 2 | 0.6% |
| Indian (Asian) | 34 | 10.5% |
| Iranian | 2 | 0.6% |
| Irish | 42 | 13.0% |
| Italian | 9 | 2.8% |
| Korean | 6 | 1.9% |
| Latvian | 1 | 0.3% |
| Mexican | 6 | 1.9% |
| Nicaraguan | 3 | 0.9% |
| Norwegian | 23 | 7.1% |
| Polish | 3 | 0.9% |
| Russian | 2 | 0.6% |
| Scandinavian | 2 | 0.6% |
| Scotch-Irish | 7 | 2.2% |
| Scottish | 23 | 7.1% |
| Slavic | 2 | 0.6% |
| Slovak | 1 | 0.3% |
| Sri Lankan | 6 | 1.9% |
| Swedish | 16 | 5.0% |
| Swiss | 2 | 0.6% |
| Thai | 8 | 2.5% |
| Welsh | 1 | 0.3% | View All 40 Rows |
Immigrants in Hunts Point
The most numerous immigrant groups reported in Hunts Point came from Asia (41 | 12.7%), Eastern Asia (33 | 10.2%), China (27 | 8.4%), Europe (9 | 2.8%), and Northern Europe (9 | 2.8%), together accounting for 36.8% of all Hunts Point residents.
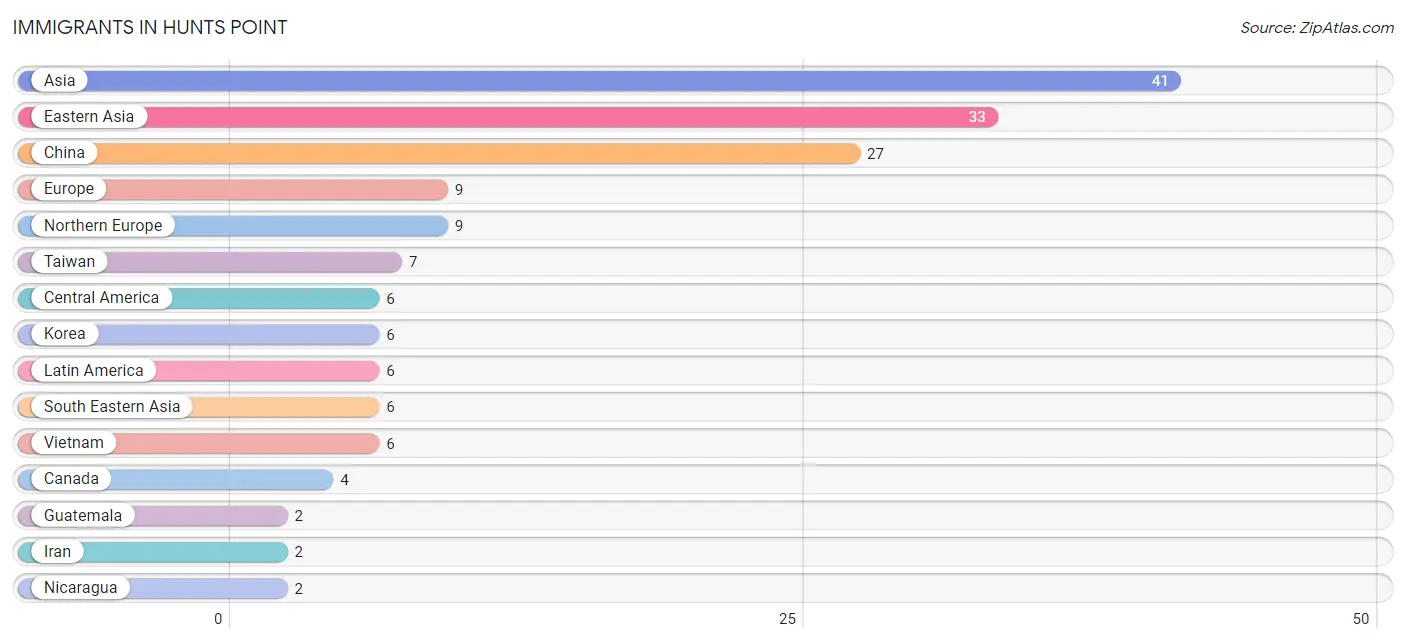
| Immigration Origin | # Population | % Population |
| Asia | 41 | 12.7% |
| Canada | 4 | 1.2% |
| Central America | 6 | 1.9% |
| China | 27 | 8.4% |
| Denmark | 1 | 0.3% |
| Eastern Asia | 33 | 10.2% |
| Europe | 9 | 2.8% |
| Guatemala | 2 | 0.6% |
| Hong Kong | 1 | 0.3% |
| Iran | 2 | 0.6% |
| Korea | 6 | 1.9% |
| Latin America | 6 | 1.9% |
| Nicaragua | 2 | 0.6% |
| Northern Europe | 9 | 2.8% |
| Norway | 2 | 0.6% |
| Panama | 2 | 0.6% |
| South Central Asia | 2 | 0.6% |
| South Eastern Asia | 6 | 1.9% |
| Sweden | 2 | 0.6% |
| Taiwan | 7 | 2.2% |
| Vietnam | 6 | 1.9% | View All 21 Rows |
Sex and Age in Hunts Point
Sex and Age in Hunts Point
The most populous age groups in Hunts Point are 75 to 79 Years (24 | 14.9%) for men and 75 to 79 Years (23 | 14.2%) for women.
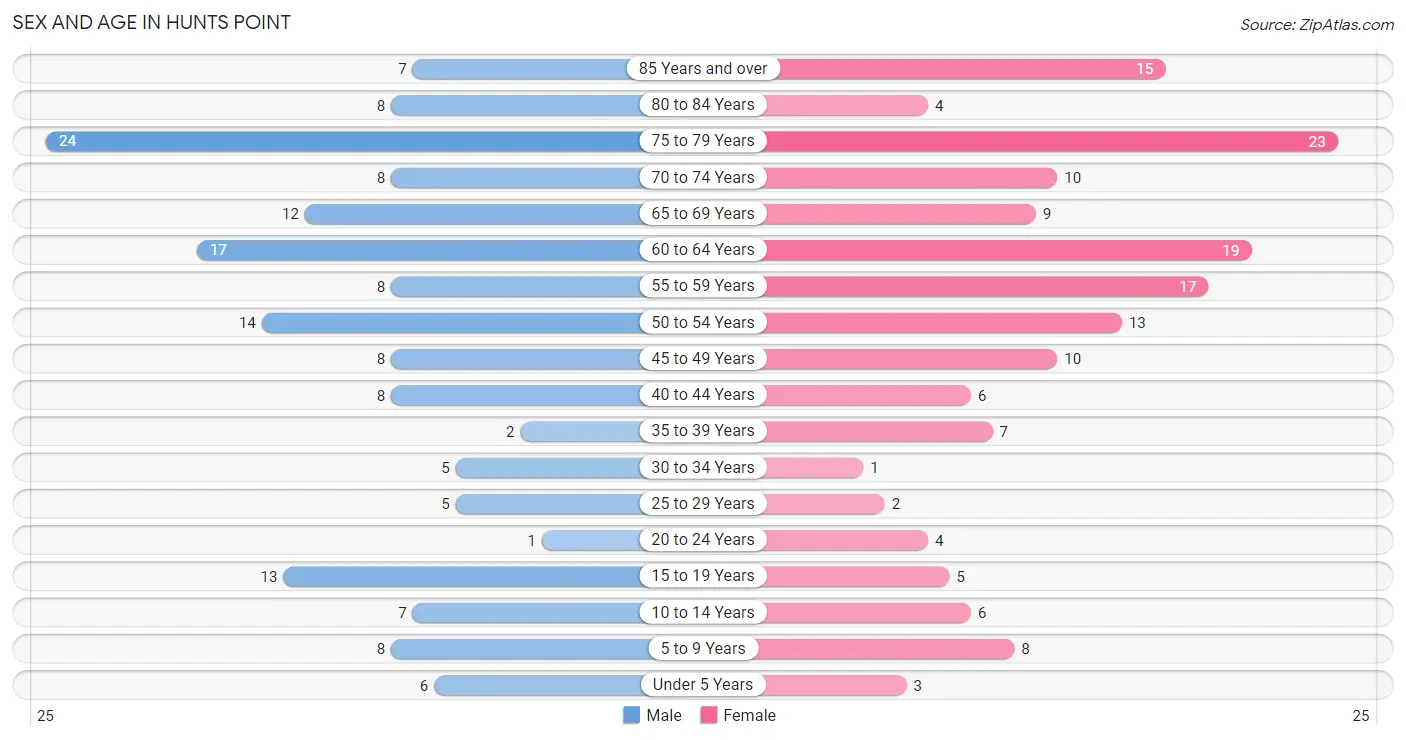
| Age Bracket | Male | Female |
| Under 5 Years | 6 (3.7%) | 3 (1.8%) |
| 5 to 9 Years | 8 (5.0%) | 8 (4.9%) |
| 10 to 14 Years | 7 (4.3%) | 6 (3.7%) |
| 15 to 19 Years | 13 (8.1%) | 5 (3.1%) |
| 20 to 24 Years | 1 (0.6%) | 4 (2.5%) |
| 25 to 29 Years | 5 (3.1%) | 2 (1.2%) |
| 30 to 34 Years | 5 (3.1%) | 1 (0.6%) |
| 35 to 39 Years | 2 (1.2%) | 7 (4.3%) |
| 40 to 44 Years | 8 (5.0%) | 6 (3.7%) |
| 45 to 49 Years | 8 (5.0%) | 10 (6.2%) |
| 50 to 54 Years | 14 (8.7%) | 13 (8.0%) |
| 55 to 59 Years | 8 (5.0%) | 17 (10.5%) |
| 60 to 64 Years | 17 (10.6%) | 19 (11.7%) |
| 65 to 69 Years | 12 (7.4%) | 9 (5.6%) |
| 70 to 74 Years | 8 (5.0%) | 10 (6.2%) |
| 75 to 79 Years | 24 (14.9%) | 23 (14.2%) |
| 80 to 84 Years | 8 (5.0%) | 4 (2.5%) |
| 85 Years and over | 7 (4.3%) | 15 (9.3%) |
| Total | 161 (100.0%) | 162 (100.0%) |
Families and Households in Hunts Point
Median Family Size in Hunts Point
The median family size in Hunts Point is 2.70 persons per family, with single female/mother families (6 | 5.8%) accounting for the largest median family size of 3.83 persons per family. On the other hand, married-couple families (97 | 93.3%) represent the smallest median family size with 2.63 persons per family.
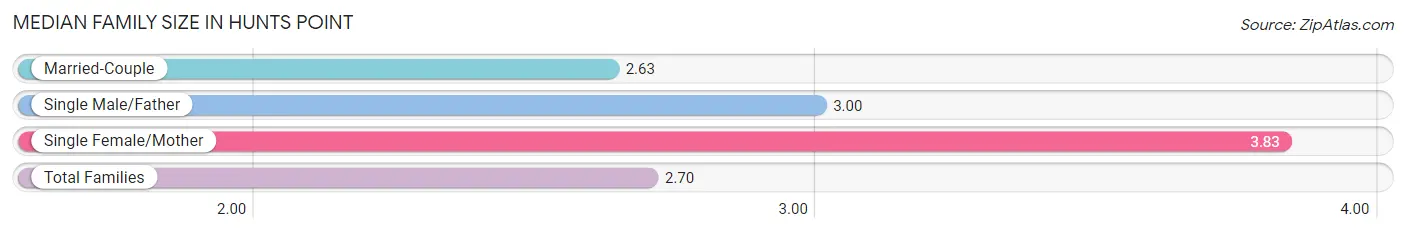
| Family Type | # Families | Family Size |
| Married-Couple | 97 (93.3%) | 2.63 |
| Single Male/Father | 1 (1.0%) | 3.00 |
| Single Female/Mother | 6 (5.8%) | 3.83 |
| Total Families | 104 (100.0%) | 2.70 |
Median Household Size in Hunts Point
The median household size in Hunts Point is 2.38 persons per household, with single male/father households (1 | 0.7%) accounting for the largest median household size of 5 persons per household. non-family households (32 | 23.5%) represent the smallest median household size with 1.25 persons per household.
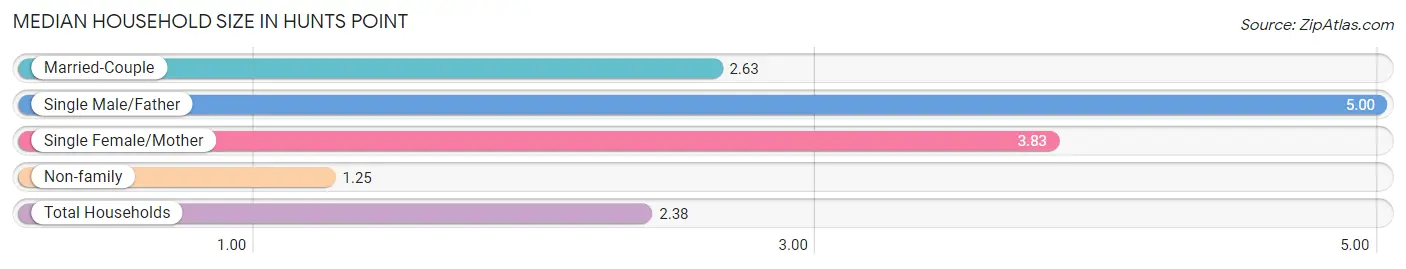
| Household Type | # Households | Household Size |
| Married-Couple | 97 (71.3%) | 2.63 |
| Single Male/Father | 1 (0.7%) | 5.00 |
| Single Female/Mother | 6 (4.4%) | 3.83 |
| Non-family | 32 (23.5%) | 1.25 |
| Total Households | 136 (100.0%) | 2.38 |
Household Size by Marriage Status in Hunts Point
Out of a total of 136 households in Hunts Point, 104 (76.5%) are family households, while 32 (23.5%) are nonfamily households. The most numerous type of family households are 2-person households, comprising 66, and the most common type of nonfamily households are 1-person households, comprising 25.
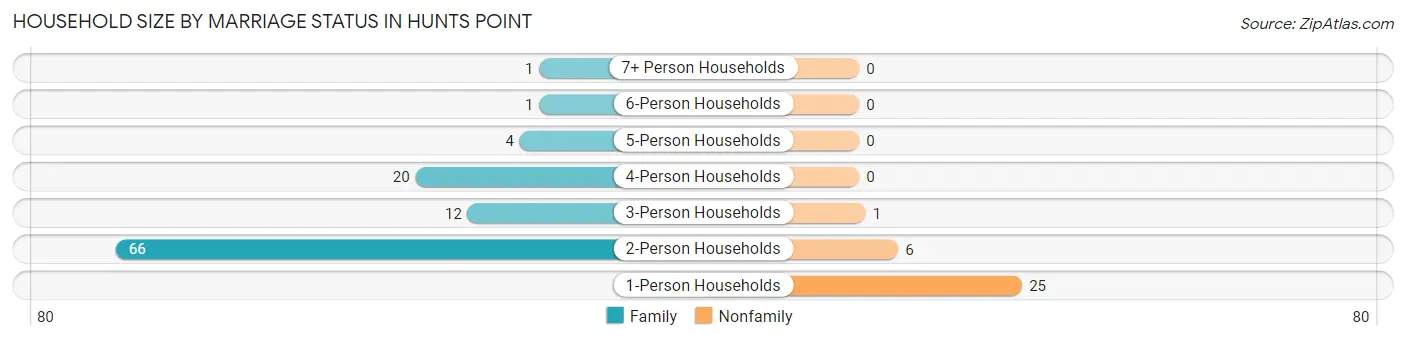
| Household Size | Family Households | Nonfamily Households |
| 1-Person Households | - | 25 (18.4%) |
| 2-Person Households | 66 (48.5%) | 6 (4.4%) |
| 3-Person Households | 12 (8.8%) | 1 (0.7%) |
| 4-Person Households | 20 (14.7%) | 0 (0.0%) |
| 5-Person Households | 4 (2.9%) | 0 (0.0%) |
| 6-Person Households | 1 (0.7%) | 0 (0.0%) |
| 7+ Person Households | 1 (0.7%) | 0 (0.0%) |
| Total | 104 (76.5%) | 32 (23.5%) |
Female Fertility in Hunts Point
Fertility by Age in Hunts Point
Average fertility rate in Hunts Point is 51.0 births per 1,000 women. Women in the age bracket of 35 to 50 years have the highest fertility rate with 74.0 births per 1,000 women. Women in the age bracket of 35 to 50 years acount for 100.0% of all women with births.
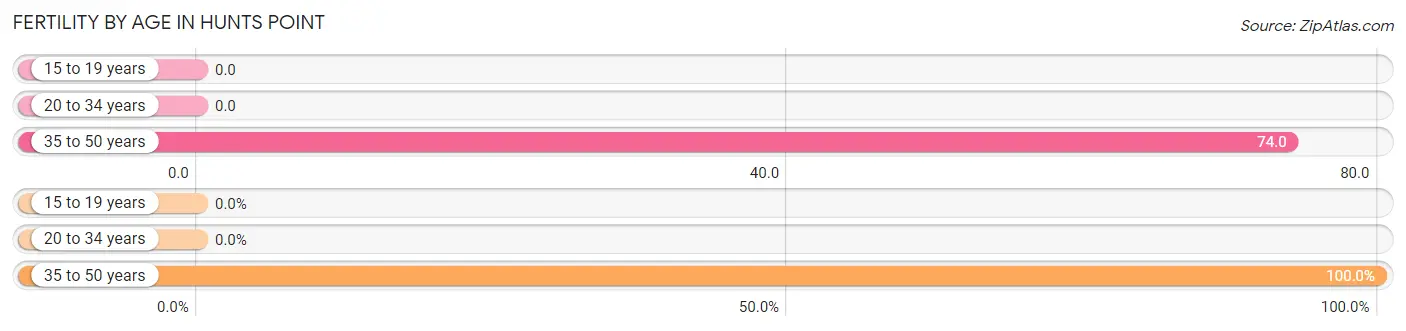
| Age Bracket | Women with Births | Births / 1,000 Women |
| 15 to 19 years | 0 (0.0%) | 0.0 |
| 20 to 34 years | 0 (0.0%) | 0.0 |
| 35 to 50 years | 2 (100.0%) | 74.0 |
| Total | 2 (100.0%) | 51.0 |
Fertility by Age by Marriage Status in Hunts Point
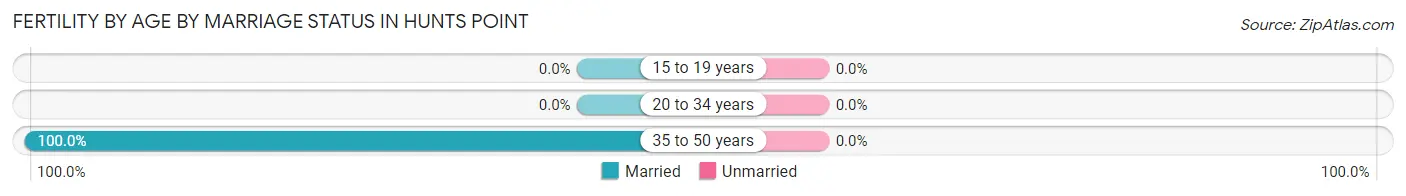
| Age Bracket | Married | Unmarried |
| 15 to 19 years | 0 (0.0%) | 0 (0.0%) |
| 20 to 34 years | 0 (0.0%) | 0 (0.0%) |
| 35 to 50 years | 2 (100.0%) | 0 (0.0%) |
| Total | 2 (100.0%) | 0 (0.0%) |
Fertility by Education in Hunts Point
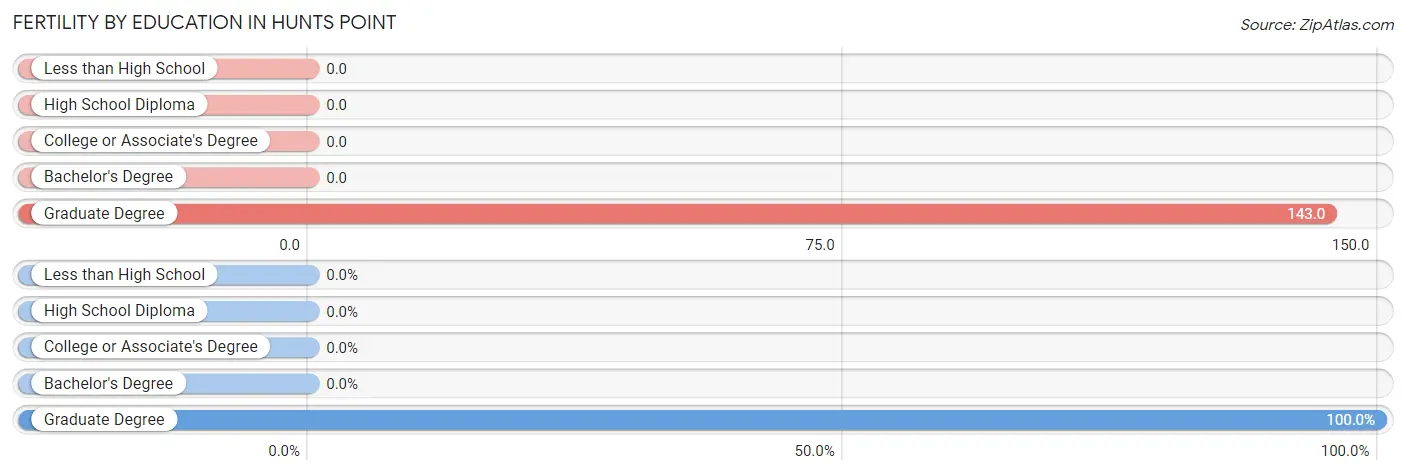
| Educational Attainment | Women with Births | Births / 1,000 Women |
| Less than High School | 0 (0.0%) | 0.0 |
| High School Diploma | 0 (0.0%) | 0.0 |
| College or Associate's Degree | 0 (0.0%) | 0.0 |
| Bachelor's Degree | 0 (0.0%) | 0.0 |
| Graduate Degree | 2 (100.0%) | 143.0 |
| Total | 2 (100.0%) | 51.0 |
Fertility by Education by Marriage Status in Hunts Point
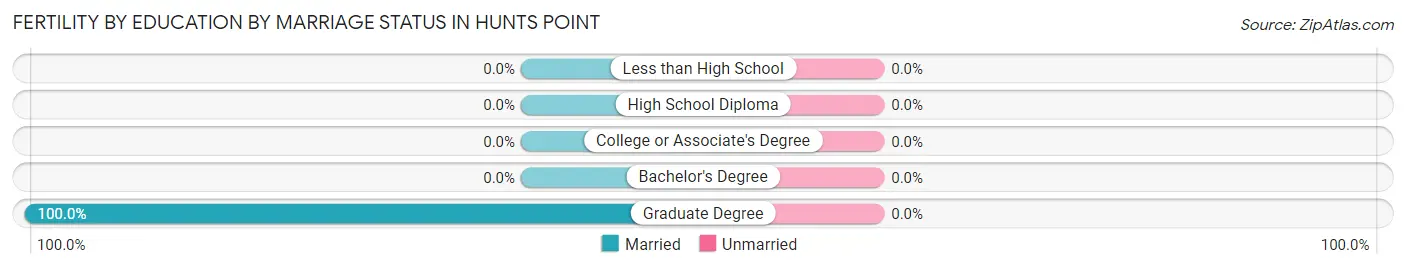
| Educational Attainment | Married | Unmarried |
| Less than High School | 0 (0.0%) | 0 (0.0%) |
| High School Diploma | 0 (0.0%) | 0 (0.0%) |
| College or Associate's Degree | 0 (0.0%) | 0 (0.0%) |
| Bachelor's Degree | 0 (0.0%) | 0 (0.0%) |
| Graduate Degree | 2 (100.0%) | 0 (0.0%) |
| Total | 2 (100.0%) | 0 (0.0%) |
Employment Characteristics in Hunts Point
Employment by Class of Employer in Hunts Point
Among the 123 employed individuals in Hunts Point, private company employees (78 | 63.4%), self-employed (incorporated) (18 | 14.6%), and self-employed (not incorporated) (13 | 10.6%) make up the most common classes of employment.
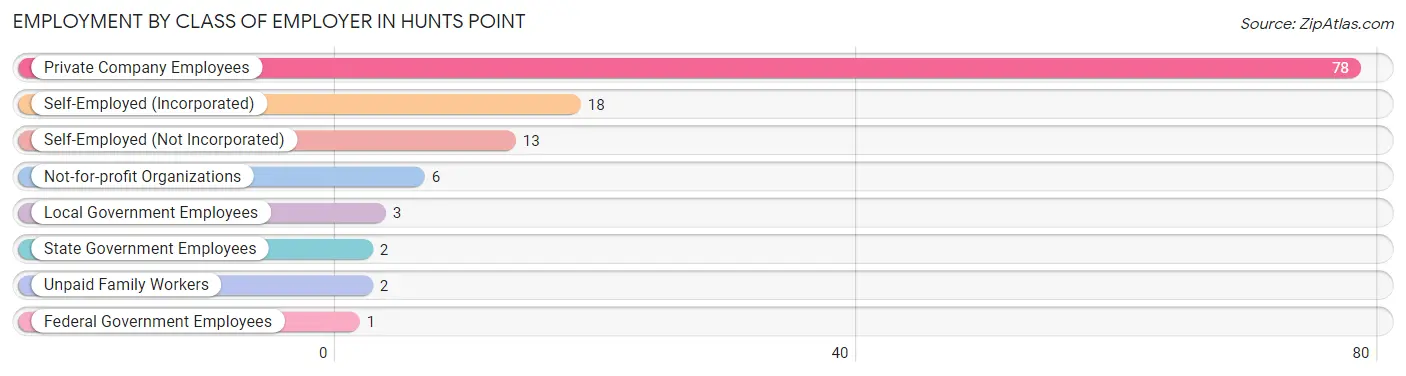
| Employer Class | # Employees | % Employees |
| Private Company Employees | 78 | 63.4% |
| Self-Employed (Incorporated) | 18 | 14.6% |
| Self-Employed (Not Incorporated) | 13 | 10.6% |
| Not-for-profit Organizations | 6 | 4.9% |
| Local Government Employees | 3 | 2.4% |
| State Government Employees | 2 | 1.6% |
| Federal Government Employees | 1 | 0.8% |
| Unpaid Family Workers | 2 | 1.6% |
| Total | 123 | 100.0% |
Employment Status by Age in Hunts Point
According to the labor force statistics for Hunts Point, out of the total population over 16 years of age (278), 44.6% or 124 individuals are in the labor force, with 0.8% or 1 of them unemployed. The age group with the highest labor force participation rate is 25 to 29 years, with 100.0% or 7 individuals in the labor force. Within the labor force, the 25 to 29 years age range has the highest percentage of unemployed individuals, with 16.7% or 1 of them being unemployed.
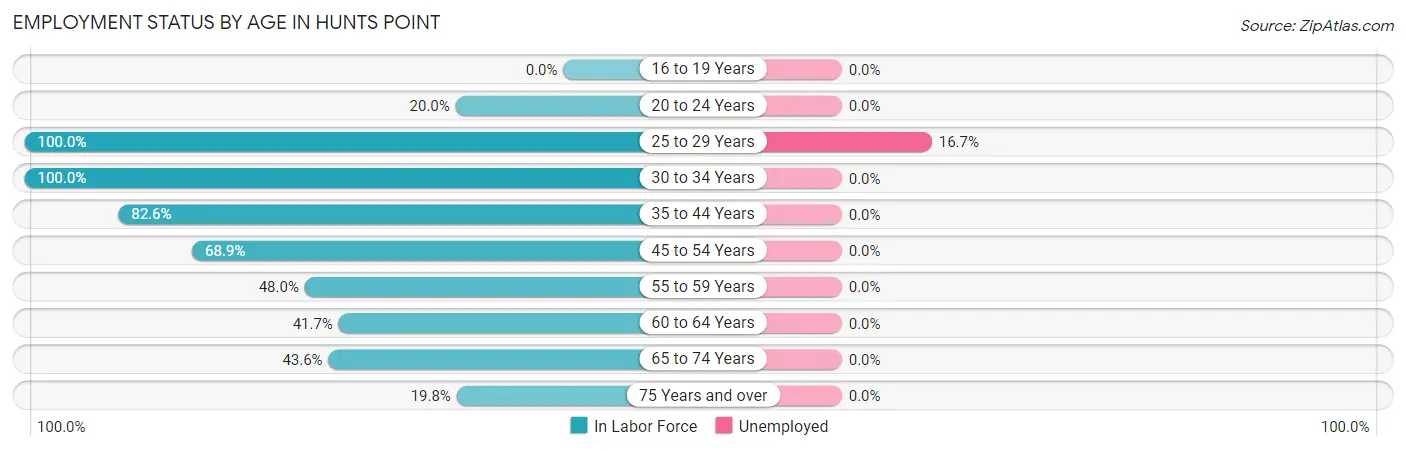
| Age Bracket | In Labor Force | Unemployed |
| 16 to 19 Years | 0 (0.0%) | 0 (0.0%) |
| 20 to 24 Years | 1 (20.0%) | 0 (0.0%) |
| 25 to 29 Years | 7 (100.0%) | 1 (16.7%) |
| 30 to 34 Years | 6 (100.0%) | 0 (0.0%) |
| 35 to 44 Years | 19 (82.6%) | 0 (0.0%) |
| 45 to 54 Years | 31 (68.9%) | 0 (0.0%) |
| 55 to 59 Years | 12 (48.0%) | 0 (0.0%) |
| 60 to 64 Years | 15 (41.7%) | 0 (0.0%) |
| 65 to 74 Years | 17 (43.6%) | 0 (0.0%) |
| 75 Years and over | 16 (19.8%) | 0 (0.0%) |
| Total | 124 (44.6%) | 1 (0.8%) |
Employment Status by Educational Attainment in Hunts Point
According to labor force statistics for Hunts Point, 63.4% of individuals (90) out of the total population between 25 and 64 years of age (142) are in the labor force, with 1.1% or 1 of them being unemployed. The group with the highest labor force participation rate are those with the educational attainment of bachelor's degree or higher, with 69.4% or 75 individuals in the labor force. Within the labor force, individuals with college / associate degree education have the highest percentage of unemployment, with 12.5% or 1 of them being unemployed.
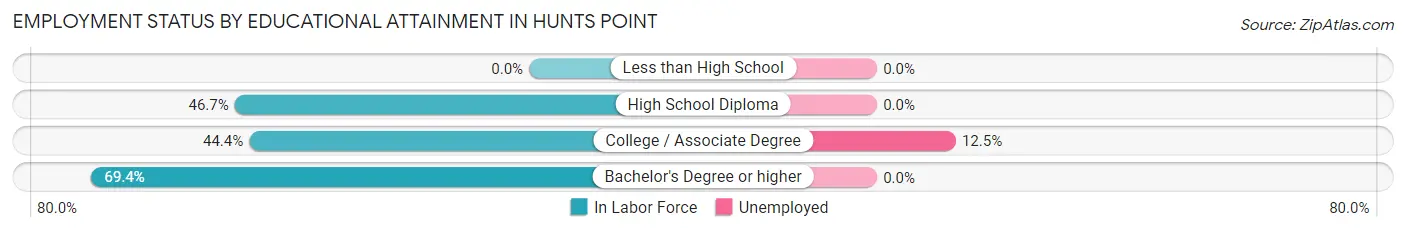
| Educational Attainment | In Labor Force | Unemployed |
| Less than High School | 0 (0.0%) | 0 (0.0%) |
| High School Diploma | 7 (46.7%) | 0 (0.0%) |
| College / Associate Degree | 8 (44.4%) | 2 (12.5%) |
| Bachelor's Degree or higher | 75 (69.4%) | 0 (0.0%) |
| Total | 90 (63.4%) | 2 (1.1%) |
Employment Occupations by Sex in Hunts Point
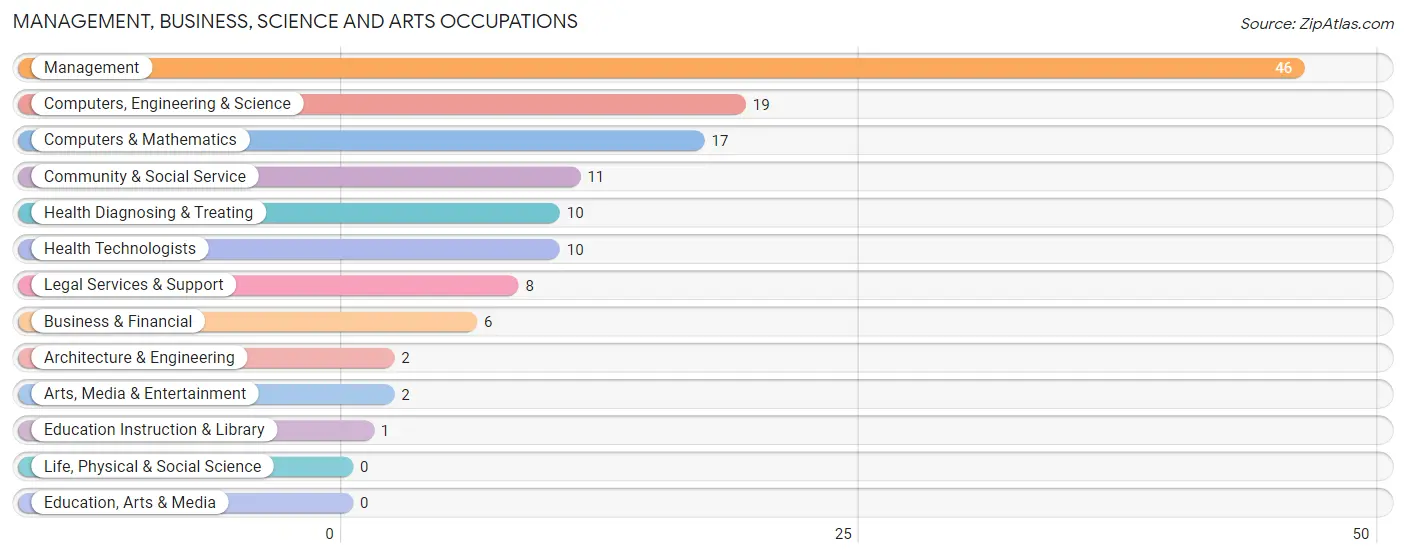
Management, Business, Science and Arts Occupations
The most common Management, Business, Science and Arts occupations in Hunts Point are Management (46 | 37.7%), Computers, Engineering & Science (19 | 15.6%), Computers & Mathematics (17 | 13.9%), Community & Social Service (11 | 9.0%), and Health Diagnosing & Treating (10 | 8.2%).
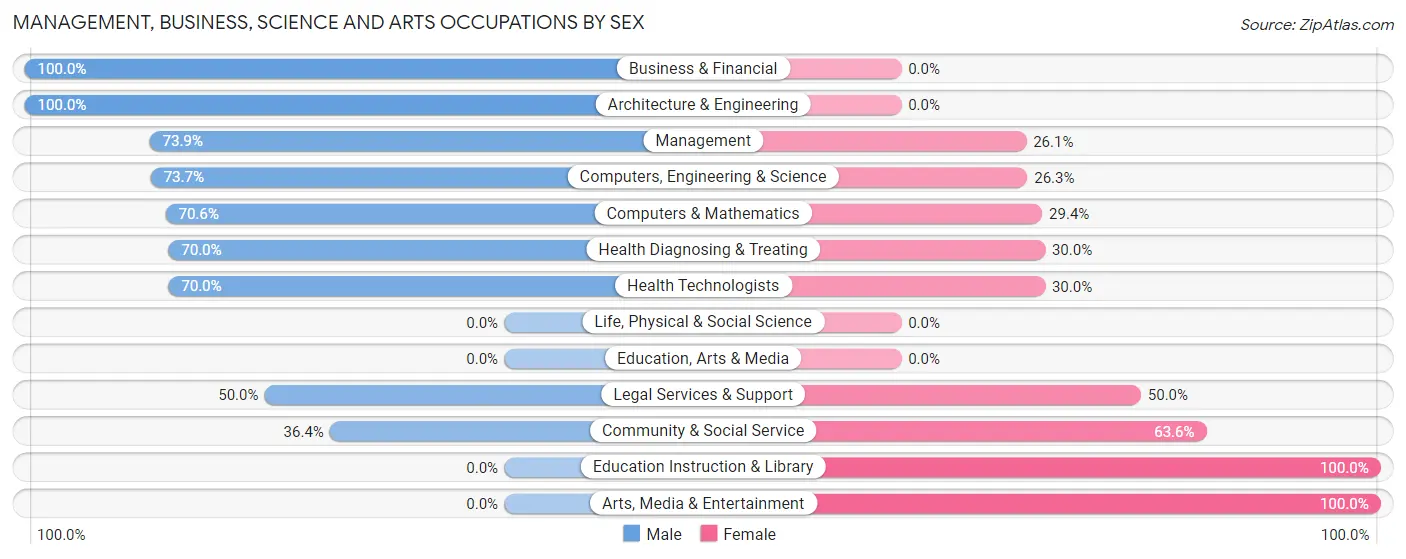
Management, Business, Science and Arts Occupations by Sex
Within the Management, Business, Science and Arts occupations in Hunts Point, the most male-oriented occupations are Business & Financial (100.0%), Architecture & Engineering (100.0%), and Management (73.9%), while the most female-oriented occupations are Education Instruction & Library (100.0%), Arts, Media & Entertainment (100.0%), and Community & Social Service (63.6%).
| Occupation | Male | Female |
| Management | 34 (73.9%) | 12 (26.1%) |
| Business & Financial | 6 (100.0%) | 0 (0.0%) |
| Computers, Engineering & Science | 14 (73.7%) | 5 (26.3%) |
| Computers & Mathematics | 12 (70.6%) | 5 (29.4%) |
| Architecture & Engineering | 2 (100.0%) | 0 (0.0%) |
| Life, Physical & Social Science | 0 (0.0%) | 0 (0.0%) |
| Community & Social Service | 4 (36.4%) | 7 (63.6%) |
| Education, Arts & Media | 0 (0.0%) | 0 (0.0%) |
| Legal Services & Support | 4 (50.0%) | 4 (50.0%) |
| Education Instruction & Library | 0 (0.0%) | 1 (100.0%) |
| Arts, Media & Entertainment | 0 (0.0%) | 2 (100.0%) |
| Health Diagnosing & Treating | 7 (70.0%) | 3 (30.0%) |
| Health Technologists | 7 (70.0%) | 3 (30.0%) |
| Total (Category) | 65 (70.7%) | 27 (29.3%) |
| Total (Overall) | 81 (66.4%) | 41 (33.6%) |
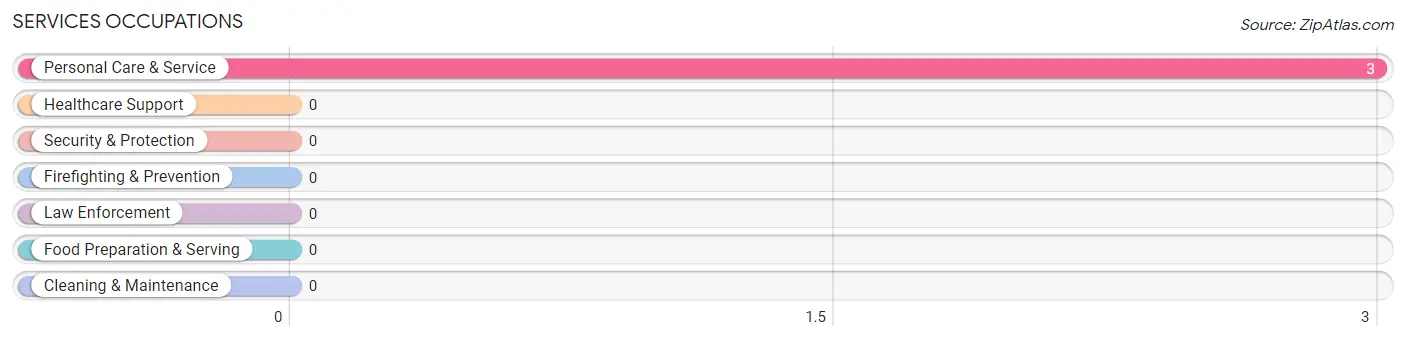
Services Occupations
The most common Services occupations in Hunts Point are , and Personal Care & Service (3 | 2.5%).
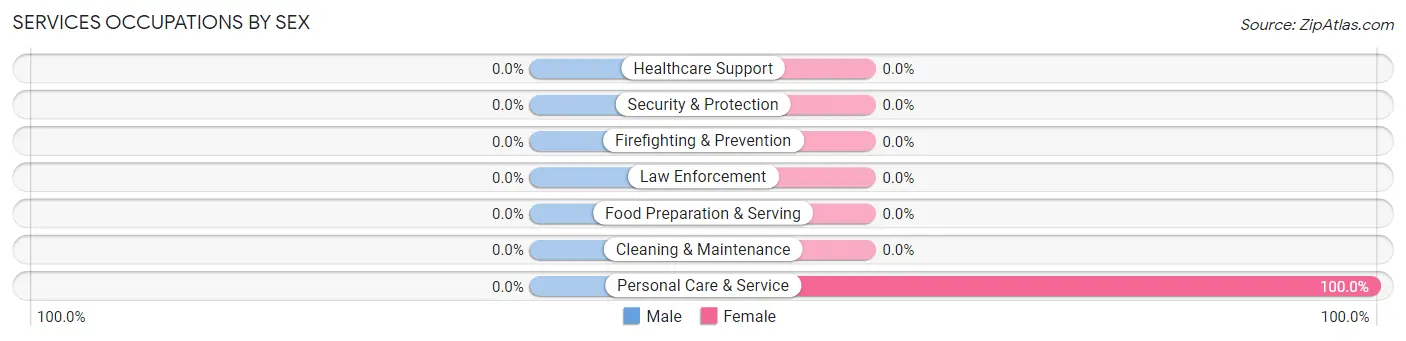
Services Occupations by Sex
| Occupation | Male | Female |
| Healthcare Support | 0 (0.0%) | 0 (0.0%) |
| Security & Protection | 0 (0.0%) | 0 (0.0%) |
| Firefighting & Prevention | 0 (0.0%) | 0 (0.0%) |
| Law Enforcement | 0 (0.0%) | 0 (0.0%) |
| Food Preparation & Serving | 0 (0.0%) | 0 (0.0%) |
| Cleaning & Maintenance | 0 (0.0%) | 0 (0.0%) |
| Personal Care & Service | 0 (0.0%) | 3 (100.0%) |
| Total (Category) | 0 (0.0%) | 3 (100.0%) |
| Total (Overall) | 81 (66.4%) | 41 (33.6%) |
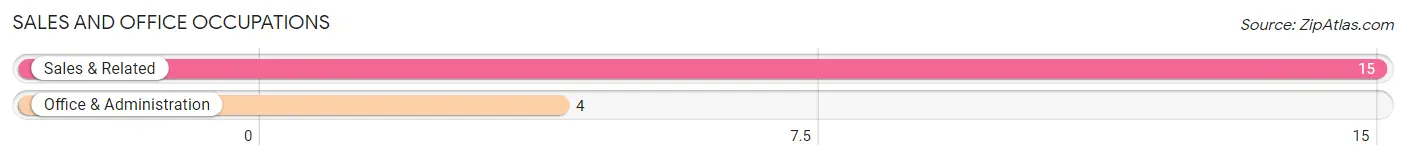
Sales and Office Occupations
The most common Sales and Office occupations in Hunts Point are Sales & Related (15 | 12.3%), and Office & Administration (4 | 3.3%).
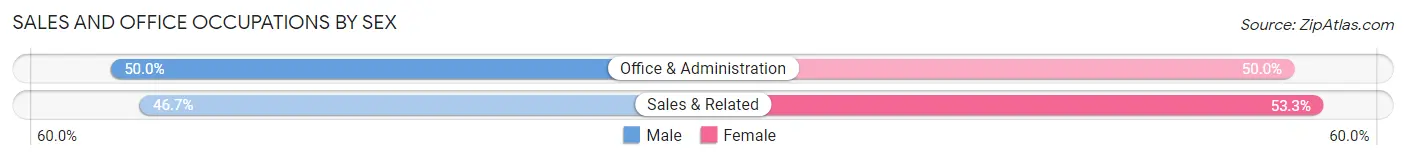
Sales and Office Occupations by Sex
| Occupation | Male | Female |
| Sales & Related | 7 (46.7%) | 8 (53.3%) |
| Office & Administration | 2 (50.0%) | 2 (50.0%) |
| Total (Category) | 9 (47.4%) | 10 (52.6%) |
| Total (Overall) | 81 (66.4%) | 41 (33.6%) |
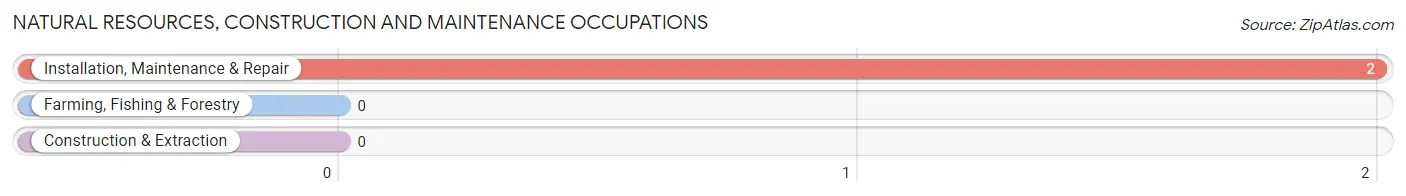
Natural Resources, Construction and Maintenance Occupations
The most common Natural Resources, Construction and Maintenance occupations in Hunts Point are , and Installation, Maintenance & Repair (2 | 1.6%).
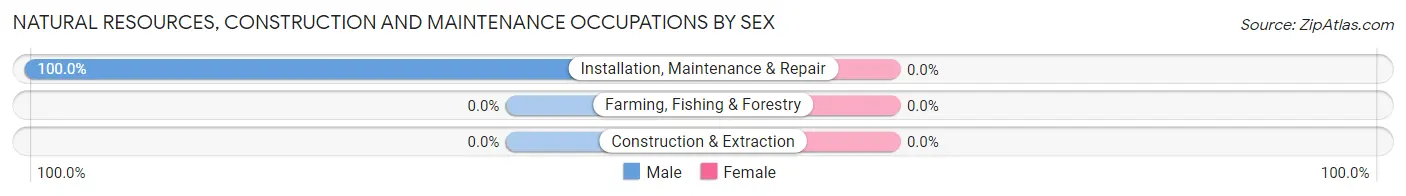
Natural Resources, Construction and Maintenance Occupations by Sex
| Occupation | Male | Female |
| Farming, Fishing & Forestry | 0 (0.0%) | 0 (0.0%) |
| Construction & Extraction | 0 (0.0%) | 0 (0.0%) |
| Installation, Maintenance & Repair | 2 (100.0%) | 0 (0.0%) |
| Total (Category) | 2 (100.0%) | 0 (0.0%) |
| Total (Overall) | 81 (66.4%) | 41 (33.6%) |
Production, Transportation and Moving Occupations
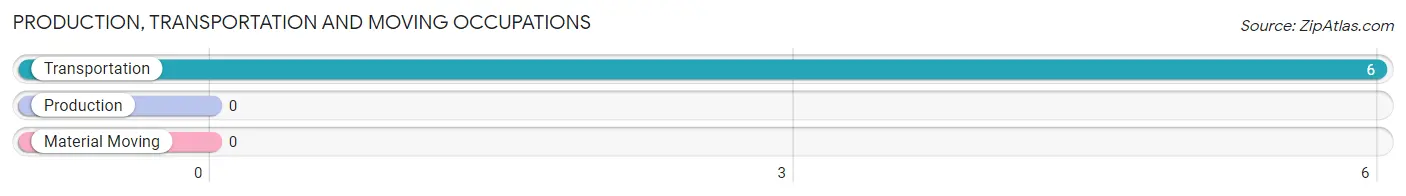
The most common Production, Transportation and Moving occupations in Hunts Point are , and Transportation (6 | 4.9%).
Production, Transportation and Moving Occupations by Sex
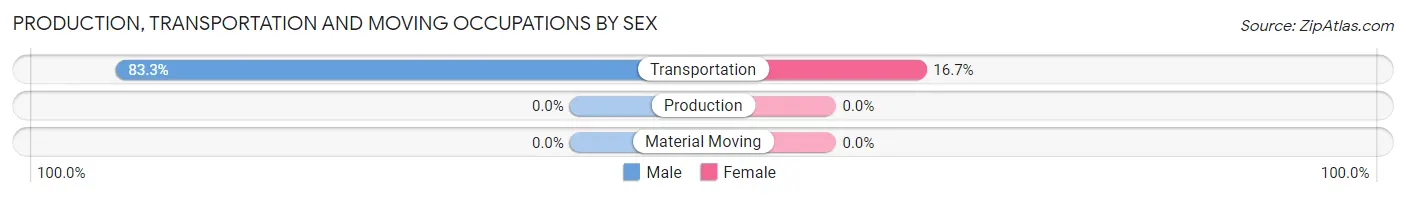
| Occupation | Male | Female |
| Production | 0 (0.0%) | 0 (0.0%) |
| Transportation | 5 (83.3%) | 1 (16.7%) |
| Material Moving | 0 (0.0%) | 0 (0.0%) |
| Total (Category) | 5 (83.3%) | 1 (16.7%) |
| Total (Overall) | 81 (66.4%) | 41 (33.6%) |
Employment Industries by Sex in Hunts Point
Employment Industries in Hunts Point
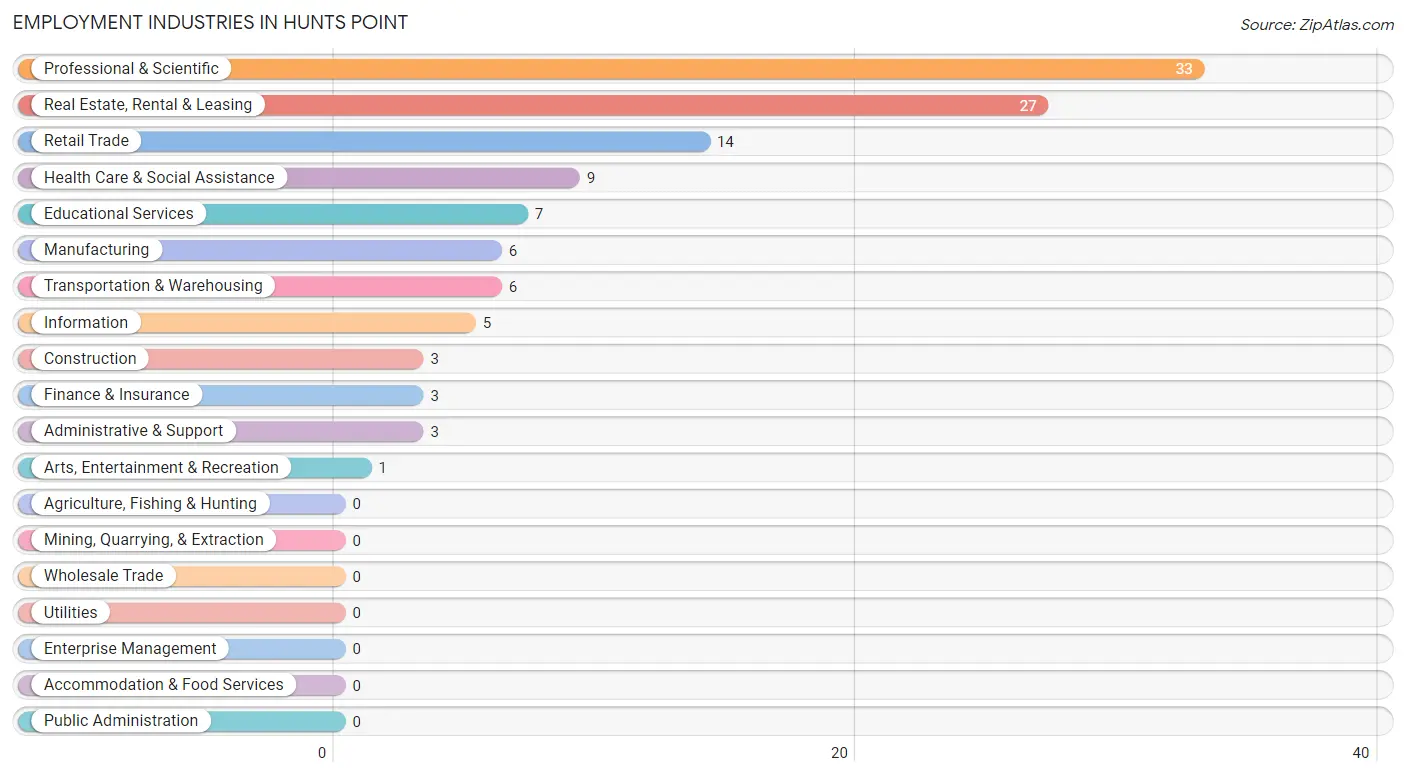
The major employment industries in Hunts Point include Professional & Scientific (33 | 27.1%), Real Estate, Rental & Leasing (27 | 22.1%), Retail Trade (14 | 11.5%), Health Care & Social Assistance (9 | 7.4%), and Educational Services (7 | 5.7%).
Employment Industries by Sex in Hunts Point
The Hunts Point industries that see more men than women are Construction (100.0%), Manufacturing (100.0%), and Information (100.0%), whereas the industries that tend to have a higher number of women are Administrative & Support (100.0%), Transportation & Warehousing (50.0%), and Professional & Scientific (45.5%).
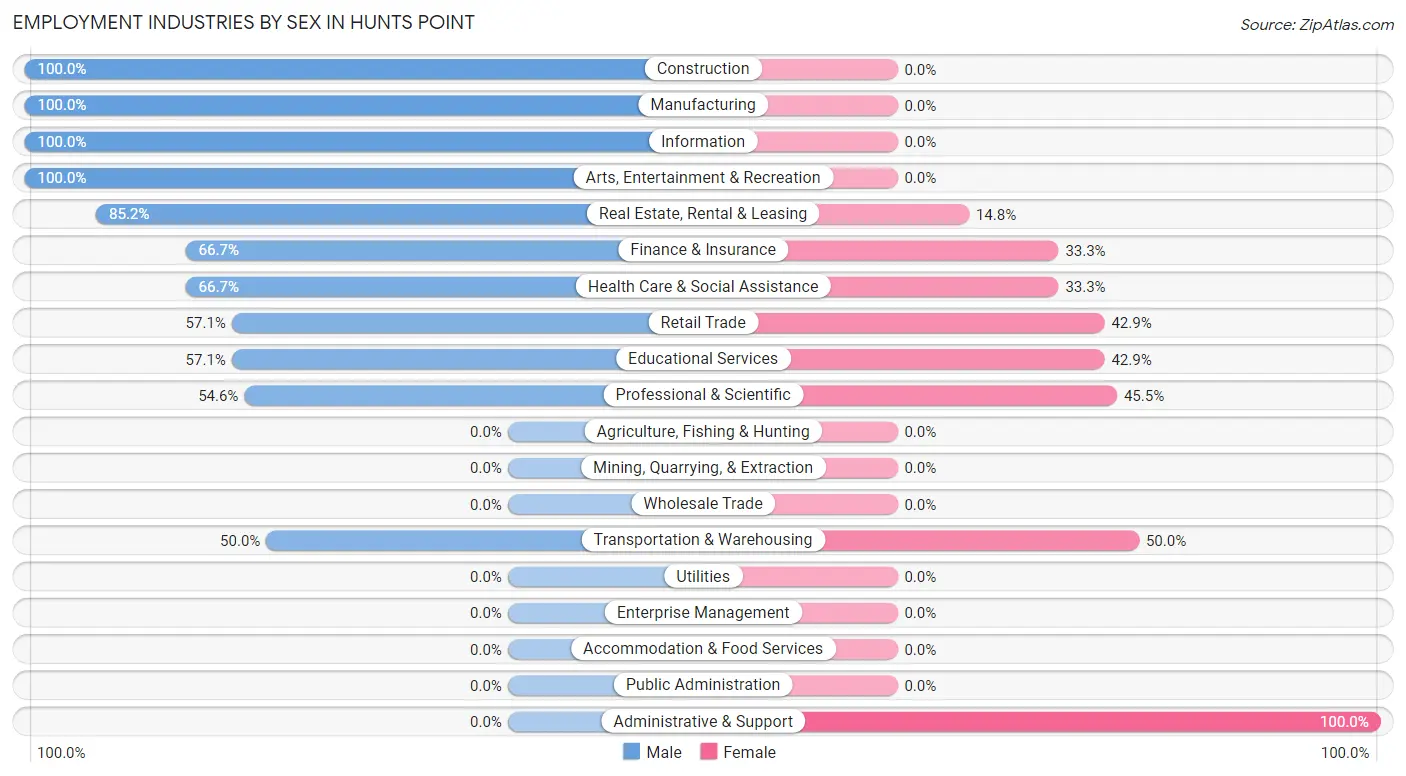
| Industry | Male | Female |
| Agriculture, Fishing & Hunting | 0 (0.0%) | 0 (0.0%) |
| Mining, Quarrying, & Extraction | 0 (0.0%) | 0 (0.0%) |
| Construction | 3 (100.0%) | 0 (0.0%) |
| Manufacturing | 6 (100.0%) | 0 (0.0%) |
| Wholesale Trade | 0 (0.0%) | 0 (0.0%) |
| Retail Trade | 8 (57.1%) | 6 (42.9%) |
| Transportation & Warehousing | 3 (50.0%) | 3 (50.0%) |
| Utilities | 0 (0.0%) | 0 (0.0%) |
| Information | 5 (100.0%) | 0 (0.0%) |
| Finance & Insurance | 2 (66.7%) | 1 (33.3%) |
| Real Estate, Rental & Leasing | 23 (85.2%) | 4 (14.8%) |
| Professional & Scientific | 18 (54.5%) | 15 (45.5%) |
| Enterprise Management | 0 (0.0%) | 0 (0.0%) |
| Administrative & Support | 0 (0.0%) | 3 (100.0%) |
| Educational Services | 4 (57.1%) | 3 (42.9%) |
| Health Care & Social Assistance | 6 (66.7%) | 3 (33.3%) |
| Arts, Entertainment & Recreation | 1 (100.0%) | 0 (0.0%) |
| Accommodation & Food Services | 0 (0.0%) | 0 (0.0%) |
| Public Administration | 0 (0.0%) | 0 (0.0%) |
| Total | 81 (66.4%) | 41 (33.6%) |
Education in Hunts Point
School Enrollment in Hunts Point
The most common levels of schooling among the 56 students in Hunts Point are high school (19 | 33.9%), middle school (11 | 19.6%), and elementary school (9 | 16.1%).
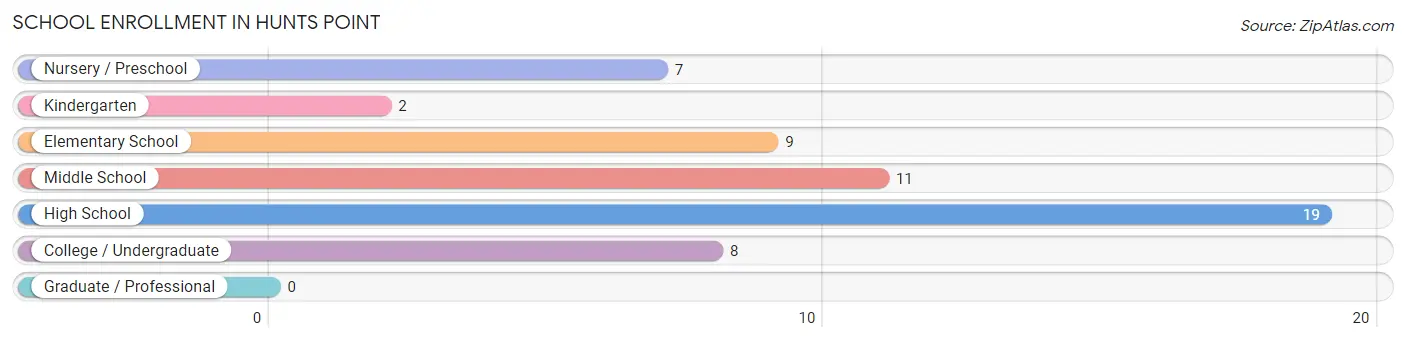
| School Level | # Students | % Students |
| Nursery / Preschool | 7 | 12.5% |
| Kindergarten | 2 | 3.6% |
| Elementary School | 9 | 16.1% |
| Middle School | 11 | 19.6% |
| High School | 19 | 33.9% |
| College / Undergraduate | 8 | 14.3% |
| Graduate / Professional | 0 | 0.0% |
| Total | 56 | 100.0% |
School Enrollment by Age by Funding Source in Hunts Point
Out of a total of 56 students who are enrolled in schools in Hunts Point, 19 (33.9%) attend a private institution, while the remaining 37 (66.1%) are enrolled in public schools. The age group of 20 to 24 year olds has the highest likelihood of being enrolled in private schools, with 3 (75.0% in the age bracket) enrolled. Conversely, the age group of 25 to 34 year olds has the lowest likelihood of being enrolled in a private school, with 1 (100.0% in the age bracket) attending a public institution.
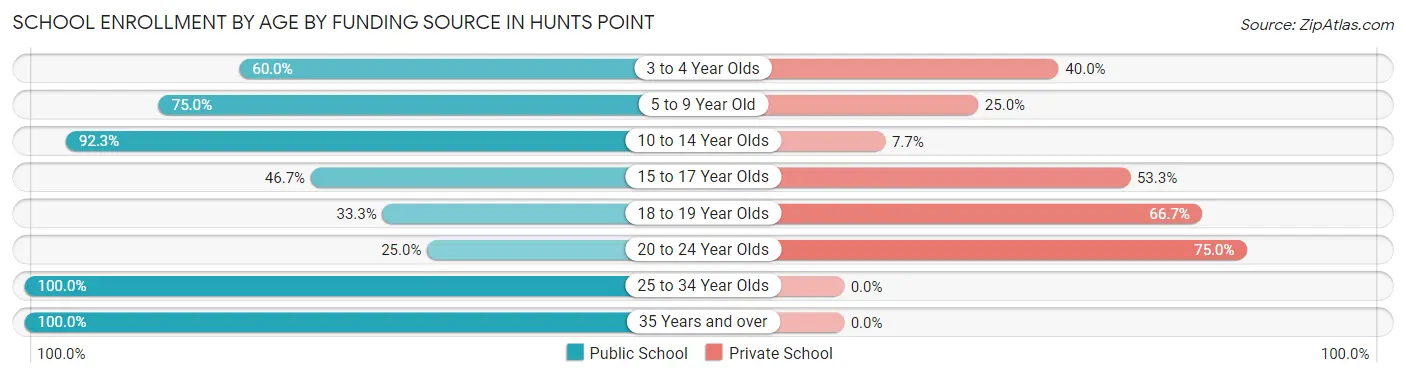
| Age Bracket | Public School | Private School |
| 3 to 4 Year Olds | 3 (60.0%) | 2 (40.0%) |
| 5 to 9 Year Old | 9 (75.0%) | 3 (25.0%) |
| 10 to 14 Year Olds | 12 (92.3%) | 1 (7.7%) |
| 15 to 17 Year Olds | 7 (46.7%) | 8 (53.3%) |
| 18 to 19 Year Olds | 1 (33.3%) | 2 (66.7%) |
| 20 to 24 Year Olds | 1 (25.0%) | 3 (75.0%) |
| 25 to 34 Year Olds | 1 (100.0%) | 0 (0.0%) |
| 35 Years and over | 3 (100.0%) | 0 (0.0%) |
| Total | 37 (66.1%) | 19 (33.9%) |
Educational Attainment by Field of Study in Hunts Point
Business (51 | 26.7%), engineering (22 | 11.5%), social sciences (20 | 10.5%), computers & mathematics (19 | 10.0%), and science & technology (17 | 8.9%) are the most common fields of study among 191 individuals in Hunts Point who have obtained a bachelor's degree or higher.
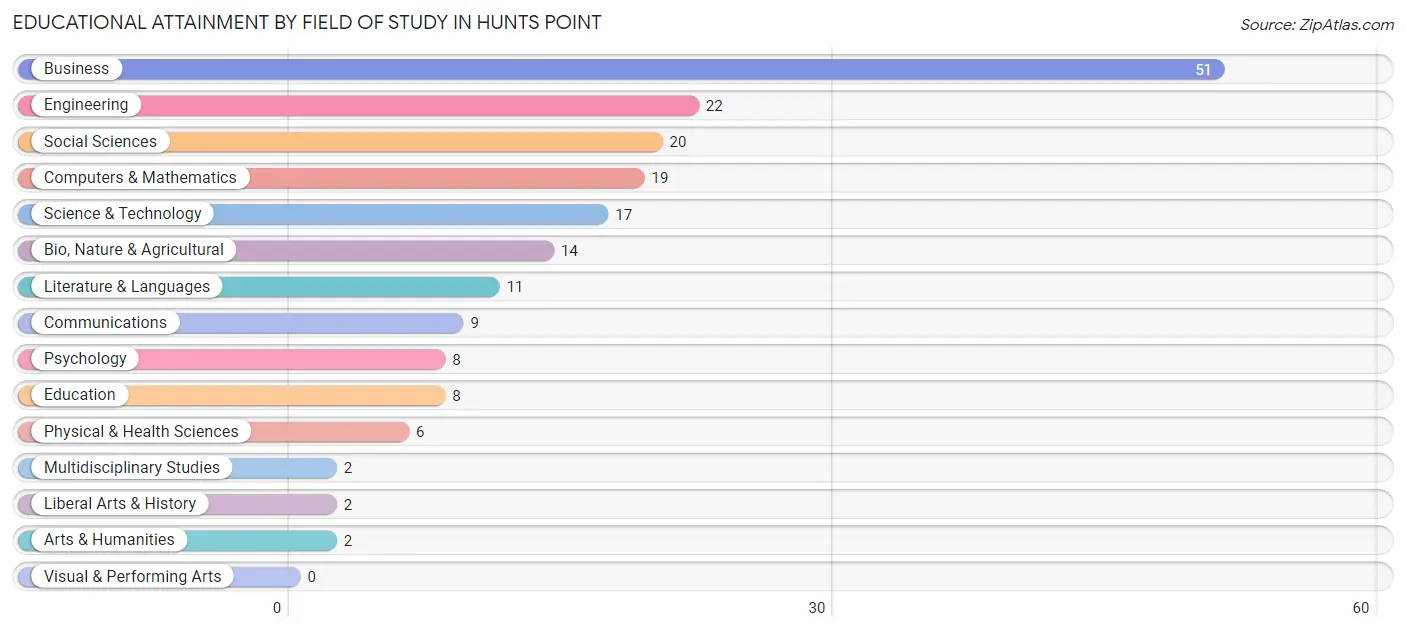
| Field of Study | # Graduates | % Graduates |
| Computers & Mathematics | 19 | 10.0% |
| Bio, Nature & Agricultural | 14 | 7.3% |
| Physical & Health Sciences | 6 | 3.1% |
| Psychology | 8 | 4.2% |
| Social Sciences | 20 | 10.5% |
| Engineering | 22 | 11.5% |
| Multidisciplinary Studies | 2 | 1.1% |
| Science & Technology | 17 | 8.9% |
| Business | 51 | 26.7% |
| Education | 8 | 4.2% |
| Literature & Languages | 11 | 5.8% |
| Liberal Arts & History | 2 | 1.1% |
| Visual & Performing Arts | 0 | 0.0% |
| Communications | 9 | 4.7% |
| Arts & Humanities | 2 | 1.1% |
| Total | 191 | 100.0% |
Transportation & Commute in Hunts Point
Vehicle Availability by Sex in Hunts Point
The most prevalent vehicle ownership categories in Hunts Point are males with 2 vehicles (46, accounting for 56.8%) and females with 2 vehicles (29, making up 109.5%).

| Vehicles Available | Male | Female |
| No Vehicle | 0 (0.0%) | 0 (0.0%) |
| 1 Vehicle | 0 (0.0%) | 3 (7.1%) |
| 2 Vehicles | 46 (56.8%) | 29 (69.1%) |
| 3 Vehicles | 18 (22.2%) | 3 (7.1%) |
| 4 Vehicles | 6 (7.4%) | 6 (14.3%) |
| 5 or more Vehicles | 11 (13.6%) | 1 (2.4%) |
| Total | 81 (100.0%) | 42 (100.0%) |
Commute Time in Hunts Point
The most frequently occuring commute durations in Hunts Point are 10 to 14 minutes (30 commuters, 29.7%), 15 to 19 minutes (20 commuters, 19.8%), and 20 to 24 minutes (19 commuters, 18.8%).
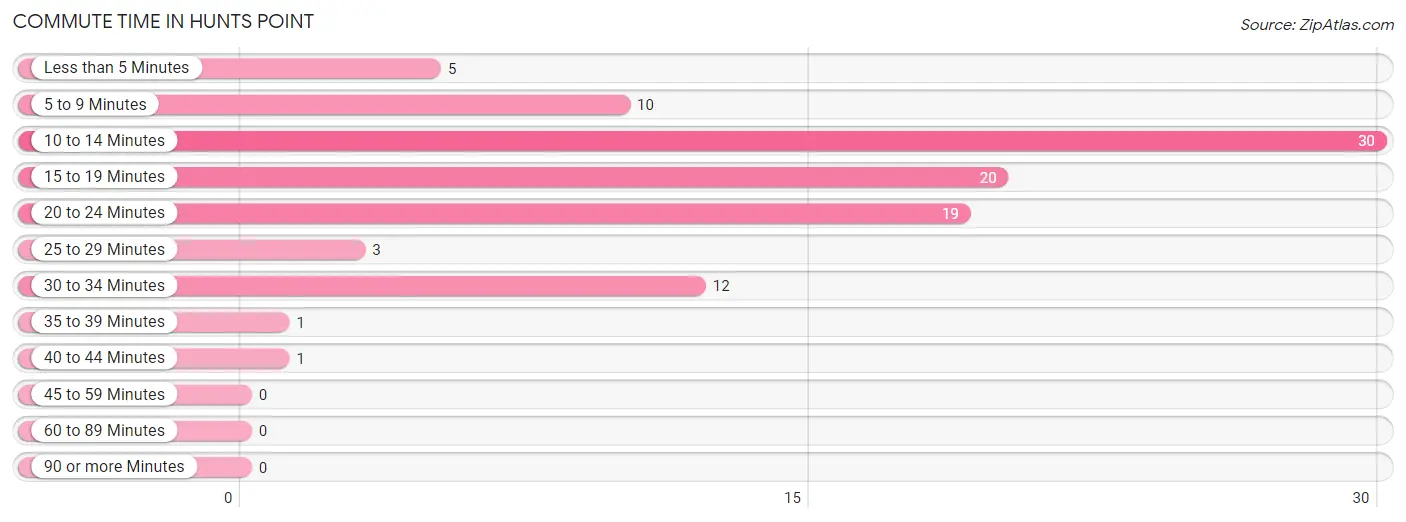
| Commute Time | # Commuters | % Commuters |
| Less than 5 Minutes | 5 | 5.0% |
| 5 to 9 Minutes | 10 | 9.9% |
| 10 to 14 Minutes | 30 | 29.7% |
| 15 to 19 Minutes | 20 | 19.8% |
| 20 to 24 Minutes | 19 | 18.8% |
| 25 to 29 Minutes | 3 | 3.0% |
| 30 to 34 Minutes | 12 | 11.9% |
| 35 to 39 Minutes | 1 | 1.0% |
| 40 to 44 Minutes | 1 | 1.0% |
| 45 to 59 Minutes | 0 | 0.0% |
| 60 to 89 Minutes | 0 | 0.0% |
| 90 or more Minutes | 0 | 0.0% |
Commute Time by Sex in Hunts Point
The most common commute times in Hunts Point are 10 to 14 minutes (19 commuters, 28.4%) for males and 10 to 14 minutes (11 commuters, 32.4%) for females.
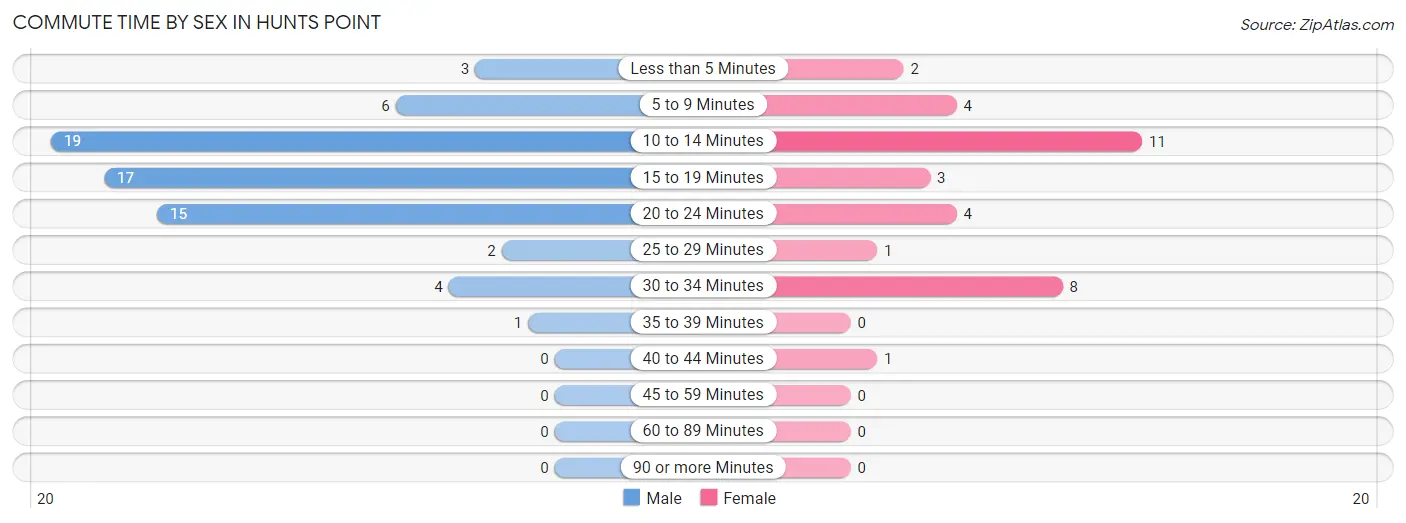
| Commute Time | Male | Female |
| Less than 5 Minutes | 3 (4.5%) | 2 (5.9%) |
| 5 to 9 Minutes | 6 (9.0%) | 4 (11.8%) |
| 10 to 14 Minutes | 19 (28.4%) | 11 (32.4%) |
| 15 to 19 Minutes | 17 (25.4%) | 3 (8.8%) |
| 20 to 24 Minutes | 15 (22.4%) | 4 (11.8%) |
| 25 to 29 Minutes | 2 (3.0%) | 1 (2.9%) |
| 30 to 34 Minutes | 4 (6.0%) | 8 (23.5%) |
| 35 to 39 Minutes | 1 (1.5%) | 0 (0.0%) |
| 40 to 44 Minutes | 0 (0.0%) | 1 (2.9%) |
| 45 to 59 Minutes | 0 (0.0%) | 0 (0.0%) |
| 60 to 89 Minutes | 0 (0.0%) | 0 (0.0%) |
| 90 or more Minutes | 0 (0.0%) | 0 (0.0%) |
Time of Departure to Work by Sex in Hunts Point
The most frequent times of departure to work in Hunts Point are 8:00 AM to 8:29 AM (19, 28.4%) for males and 9:00 AM to 9:59 AM (10, 29.4%) for females.
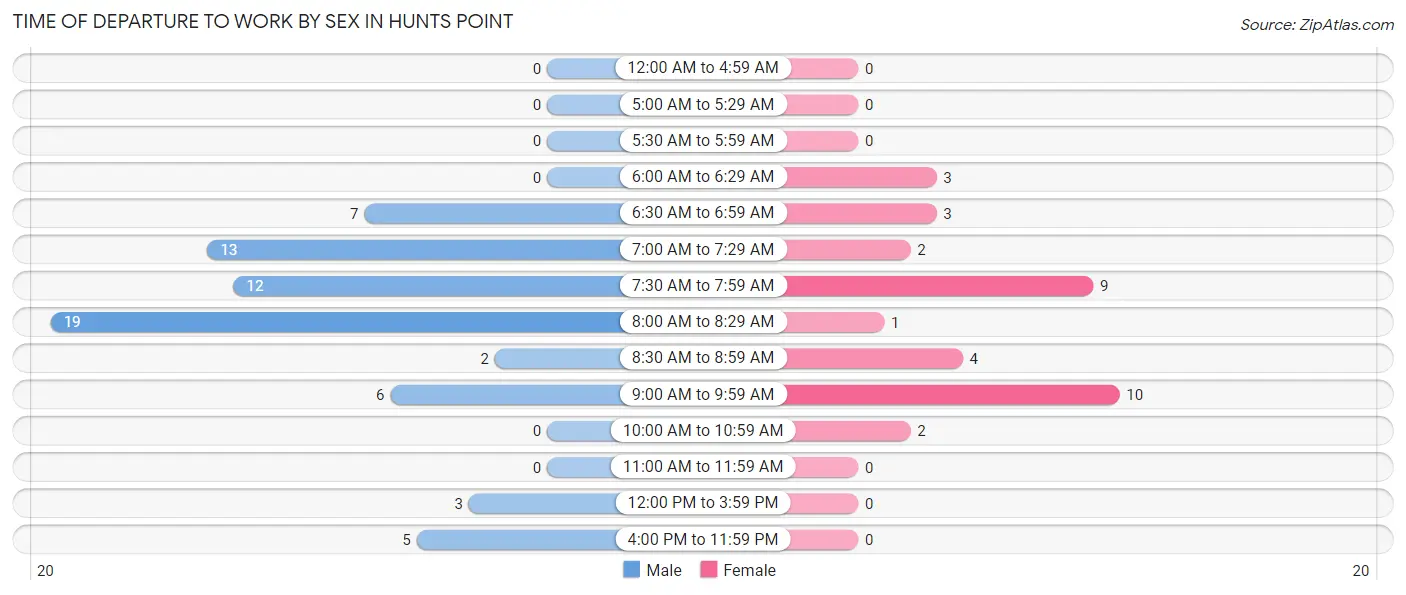
| Time of Departure | Male | Female |
| 12:00 AM to 4:59 AM | 0 (0.0%) | 0 (0.0%) |
| 5:00 AM to 5:29 AM | 0 (0.0%) | 0 (0.0%) |
| 5:30 AM to 5:59 AM | 0 (0.0%) | 0 (0.0%) |
| 6:00 AM to 6:29 AM | 0 (0.0%) | 3 (8.8%) |
| 6:30 AM to 6:59 AM | 7 (10.4%) | 3 (8.8%) |
| 7:00 AM to 7:29 AM | 13 (19.4%) | 2 (5.9%) |
| 7:30 AM to 7:59 AM | 12 (17.9%) | 9 (26.5%) |
| 8:00 AM to 8:29 AM | 19 (28.4%) | 1 (2.9%) |
| 8:30 AM to 8:59 AM | 2 (3.0%) | 4 (11.8%) |
| 9:00 AM to 9:59 AM | 6 (9.0%) | 10 (29.4%) |
| 10:00 AM to 10:59 AM | 0 (0.0%) | 2 (5.9%) |
| 11:00 AM to 11:59 AM | 0 (0.0%) | 0 (0.0%) |
| 12:00 PM to 3:59 PM | 3 (4.5%) | 0 (0.0%) |
| 4:00 PM to 11:59 PM | 5 (7.5%) | 0 (0.0%) |
| Total | 67 (100.0%) | 34 (100.0%) |
Housing Occupancy in Hunts Point
Occupancy by Ownership in Hunts Point
Of the total 136 dwellings in Hunts Point, owner-occupied units account for 122 (89.7%), while renter-occupied units make up 14 (10.3%).
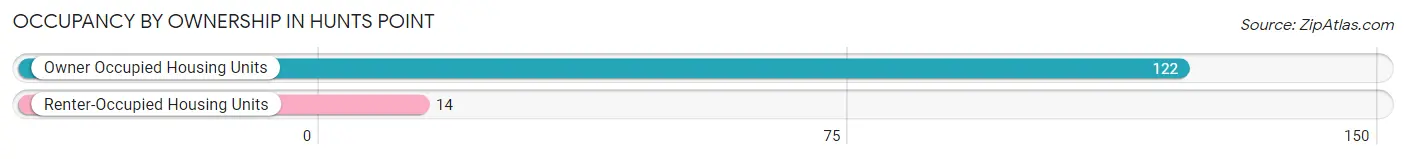
| Occupancy | # Housing Units | % Housing Units |
| Owner Occupied Housing Units | 122 | 89.7% |
| Renter-Occupied Housing Units | 14 | 10.3% |
| Total Occupied Housing Units | 136 | 100.0% |
Occupancy by Household Size in Hunts Point
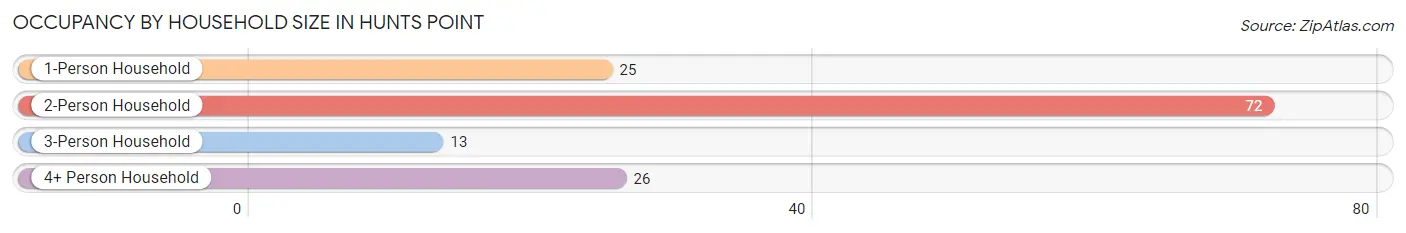
| Household Size | # Housing Units | % Housing Units |
| 1-Person Household | 25 | 18.4% |
| 2-Person Household | 72 | 52.9% |
| 3-Person Household | 13 | 9.6% |
| 4+ Person Household | 26 | 19.1% |
| Total Housing Units | 136 | 100.0% |
Occupancy by Ownership by Household Size in Hunts Point
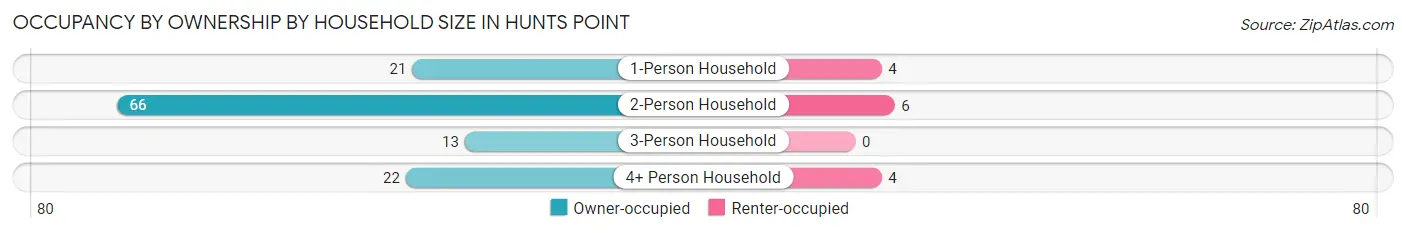
| Household Size | Owner-occupied | Renter-occupied |
| 1-Person Household | 21 (84.0%) | 4 (16.0%) |
| 2-Person Household | 66 (91.7%) | 6 (8.3%) |
| 3-Person Household | 13 (100.0%) | 0 (0.0%) |
| 4+ Person Household | 22 (84.6%) | 4 (15.4%) |
| Total Housing Units | 122 (89.7%) | 14 (10.3%) |
Occupancy by Educational Attainment in Hunts Point
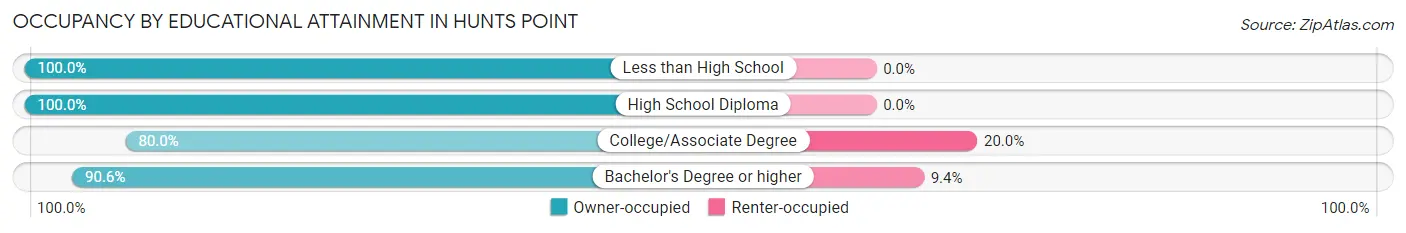
| Household Size | Owner-occupied | Renter-occupied |
| Less than High School | 2 (100.0%) | 0 (0.0%) |
| High School Diploma | 8 (100.0%) | 0 (0.0%) |
| College/Associate Degree | 16 (80.0%) | 4 (20.0%) |
| Bachelor's Degree or higher | 96 (90.6%) | 10 (9.4%) |
Occupancy by Age of Householder in Hunts Point
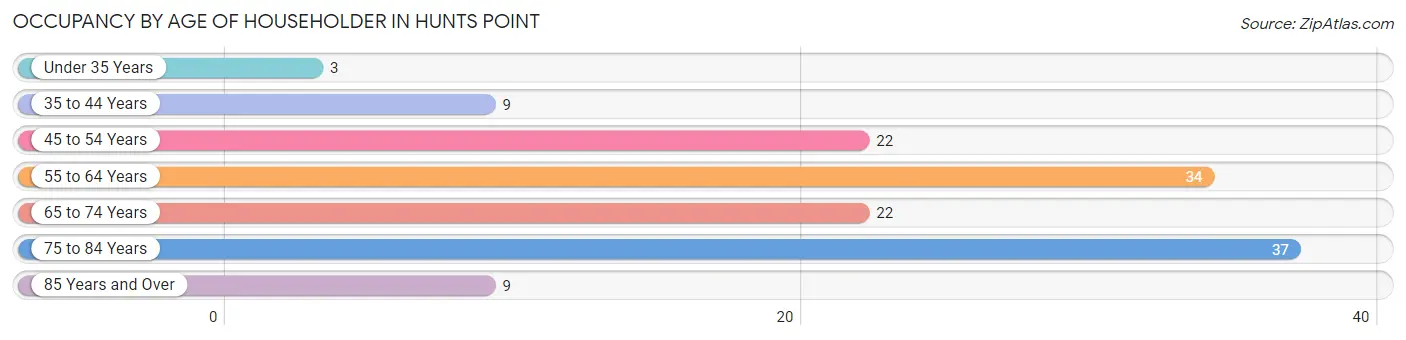
| Age Bracket | # Households | % Households |
| Under 35 Years | 3 | 2.2% |
| 35 to 44 Years | 9 | 6.6% |
| 45 to 54 Years | 22 | 16.2% |
| 55 to 64 Years | 34 | 25.0% |
| 65 to 74 Years | 22 | 16.2% |
| 75 to 84 Years | 37 | 27.2% |
| 85 Years and Over | 9 | 6.6% |
| Total | 136 | 100.0% |
Housing Finances in Hunts Point
Median Income by Occupancy in Hunts Point
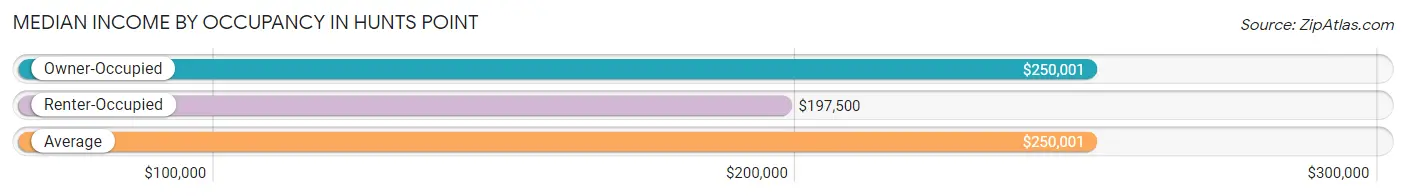
| Occupancy Type | # Households | Median Income |
| Owner-Occupied | 122 (89.7%) | $250,001 |
| Renter-Occupied | 14 (10.3%) | $197,500 |
| Average | 136 (100.0%) | $250,001 |
Occupancy by Householder Income Bracket in Hunts Point
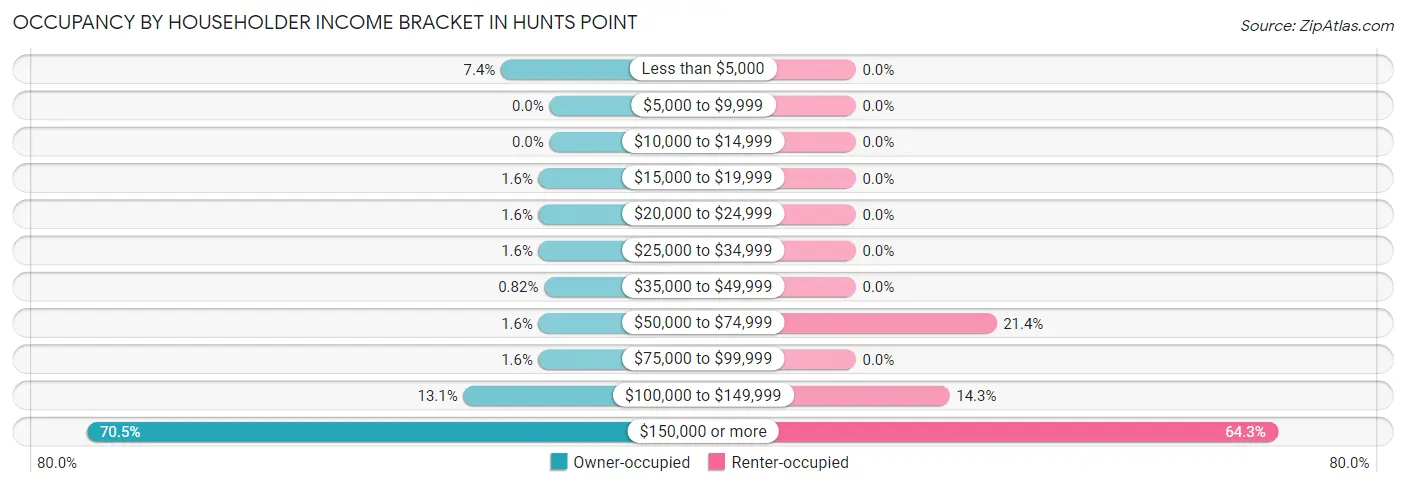
| Income Bracket | Owner-occupied | Renter-occupied |
| Less than $5,000 | 9 (7.4%) | 0 (0.0%) |
| $5,000 to $9,999 | 0 (0.0%) | 0 (0.0%) |
| $10,000 to $14,999 | 0 (0.0%) | 0 (0.0%) |
| $15,000 to $19,999 | 2 (1.6%) | 0 (0.0%) |
| $20,000 to $24,999 | 2 (1.6%) | 0 (0.0%) |
| $25,000 to $34,999 | 2 (1.6%) | 0 (0.0%) |
| $35,000 to $49,999 | 1 (0.8%) | 0 (0.0%) |
| $50,000 to $74,999 | 2 (1.6%) | 3 (21.4%) |
| $75,000 to $99,999 | 2 (1.6%) | 0 (0.0%) |
| $100,000 to $149,999 | 16 (13.1%) | 2 (14.3%) |
| $150,000 or more | 86 (70.5%) | 9 (64.3%) |
| Total | 122 (100.0%) | 14 (100.0%) |
Monthly Housing Cost Tiers in Hunts Point
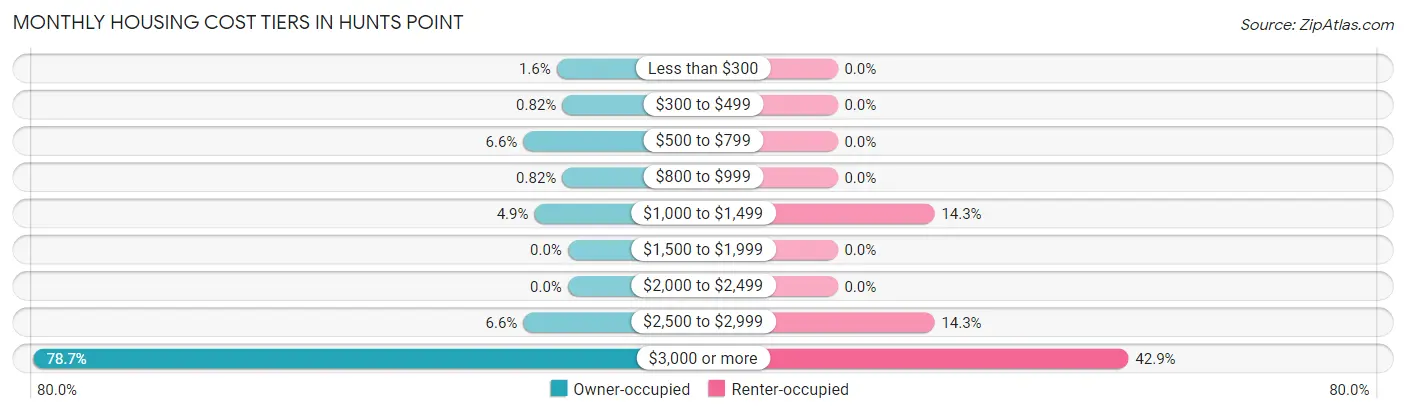
| Monthly Cost | Owner-occupied | Renter-occupied |
| Less than $300 | 2 (1.6%) | 0 (0.0%) |
| $300 to $499 | 1 (0.8%) | 0 (0.0%) |
| $500 to $799 | 8 (6.6%) | 0 (0.0%) |
| $800 to $999 | 1 (0.8%) | 0 (0.0%) |
| $1,000 to $1,499 | 6 (4.9%) | 2 (14.3%) |
| $1,500 to $1,999 | 0 (0.0%) | 0 (0.0%) |
| $2,000 to $2,499 | 0 (0.0%) | 0 (0.0%) |
| $2,500 to $2,999 | 8 (6.6%) | 2 (14.3%) |
| $3,000 or more | 96 (78.7%) | 6 (42.9%) |
| Total | 122 (100.0%) | 14 (100.0%) |
Physical Housing Characteristics in Hunts Point
Housing Structures in Hunts Point
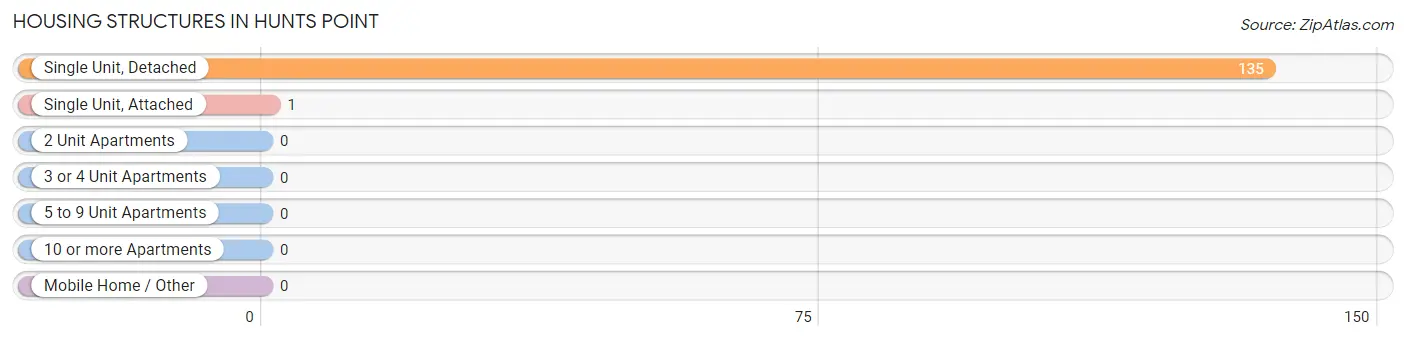
| Structure Type | # Housing Units | % Housing Units |
| Single Unit, Detached | 135 | 99.3% |
| Single Unit, Attached | 1 | 0.7% |
| 2 Unit Apartments | 0 | 0.0% |
| 3 or 4 Unit Apartments | 0 | 0.0% |
| 5 to 9 Unit Apartments | 0 | 0.0% |
| 10 or more Apartments | 0 | 0.0% |
| Mobile Home / Other | 0 | 0.0% |
| Total | 136 | 100.0% |
Housing Structures by Occupancy in Hunts Point
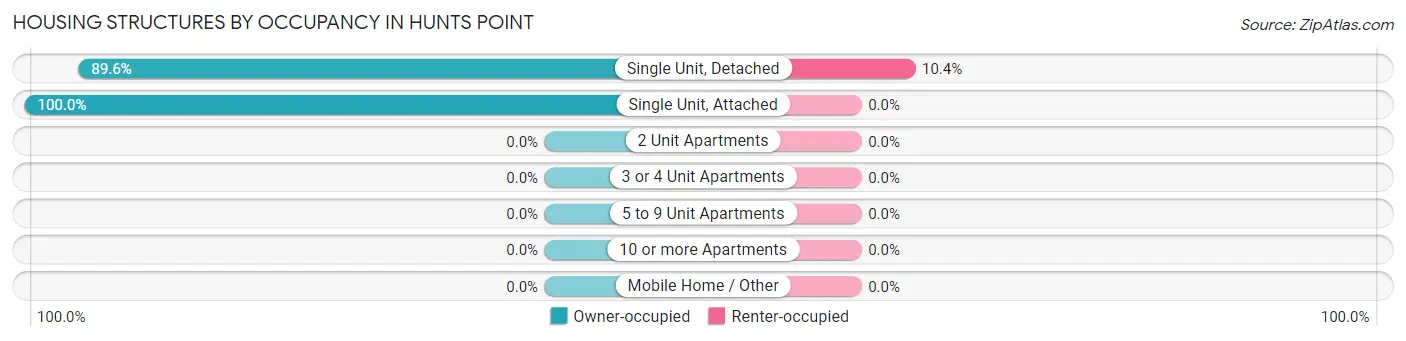
| Structure Type | Owner-occupied | Renter-occupied |
| Single Unit, Detached | 121 (89.6%) | 14 (10.4%) |
| Single Unit, Attached | 1 (100.0%) | 0 (0.0%) |
| 2 Unit Apartments | 0 (0.0%) | 0 (0.0%) |
| 3 or 4 Unit Apartments | 0 (0.0%) | 0 (0.0%) |
| 5 to 9 Unit Apartments | 0 (0.0%) | 0 (0.0%) |
| 10 or more Apartments | 0 (0.0%) | 0 (0.0%) |
| Mobile Home / Other | 0 (0.0%) | 0 (0.0%) |
| Total | 122 (89.7%) | 14 (10.3%) |
Housing Structures by Number of Rooms in Hunts Point
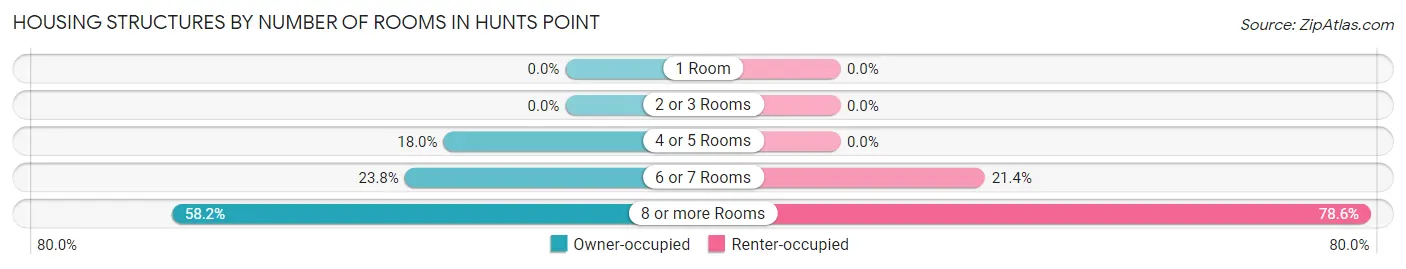
| Number of Rooms | Owner-occupied | Renter-occupied |
| 1 Room | 0 (0.0%) | 0 (0.0%) |
| 2 or 3 Rooms | 0 (0.0%) | 0 (0.0%) |
| 4 or 5 Rooms | 22 (18.0%) | 0 (0.0%) |
| 6 or 7 Rooms | 29 (23.8%) | 3 (21.4%) |
| 8 or more Rooms | 71 (58.2%) | 11 (78.6%) |
| Total | 122 (100.0%) | 14 (100.0%) |
Housing Structure by Heating Type in Hunts Point
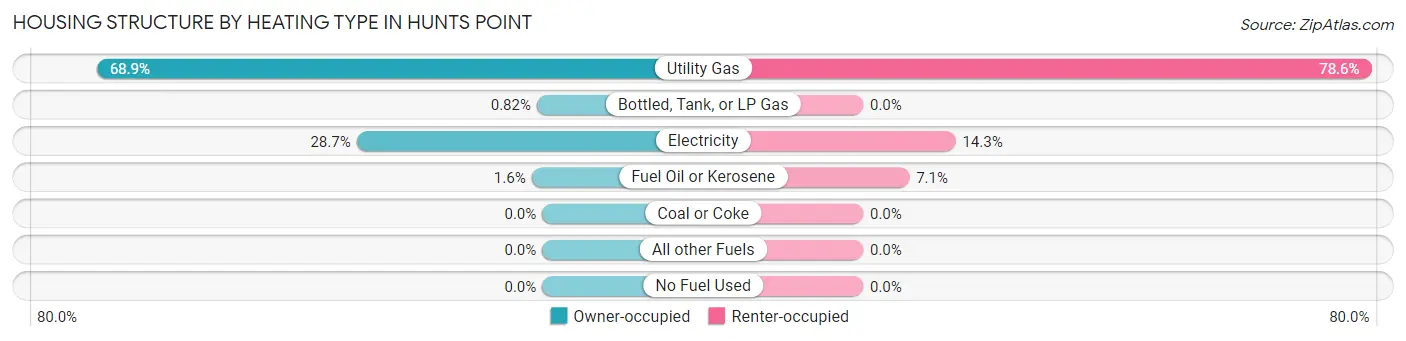
| Heating Type | Owner-occupied | Renter-occupied |
| Utility Gas | 84 (68.9%) | 11 (78.6%) |
| Bottled, Tank, or LP Gas | 1 (0.8%) | 0 (0.0%) |
| Electricity | 35 (28.7%) | 2 (14.3%) |
| Fuel Oil or Kerosene | 2 (1.6%) | 1 (7.1%) |
| Coal or Coke | 0 (0.0%) | 0 (0.0%) |
| All other Fuels | 0 (0.0%) | 0 (0.0%) |
| No Fuel Used | 0 (0.0%) | 0 (0.0%) |
| Total | 122 (100.0%) | 14 (100.0%) |
Household Vehicle Usage in Hunts Point
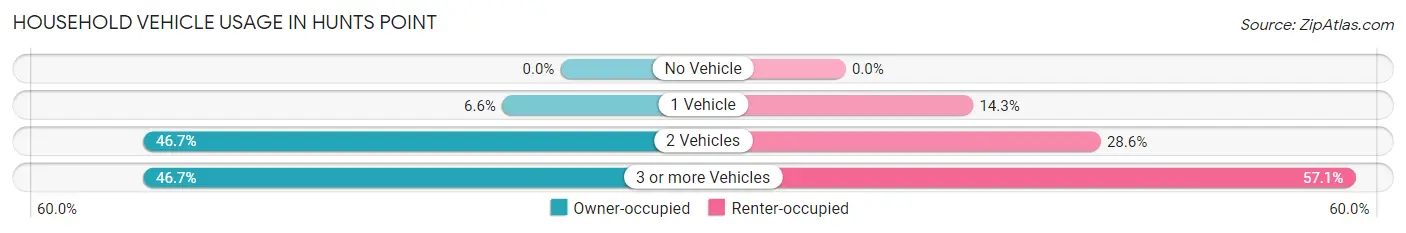
| Vehicles per Household | Owner-occupied | Renter-occupied |
| No Vehicle | 0 (0.0%) | 0 (0.0%) |
| 1 Vehicle | 8 (6.6%) | 2 (14.3%) |
| 2 Vehicles | 57 (46.7%) | 4 (28.6%) |
| 3 or more Vehicles | 57 (46.7%) | 8 (57.1%) |
| Total | 122 (100.0%) | 14 (100.0%) |
Real Estate & Mortgages in Hunts Point
Real Estate and Mortgage Overview in Hunts Point
| Characteristic | Without Mortgage | With Mortgage |
| Housing Units | 72 | 50 |
| Median Property Value | $2,000,001 | $2,000,001 |
| Median Household Income | $250,001 | $37 |
| Monthly Housing Costs | $1,501 | $50 |
| Real Estate Taxes | $10,001 | $0 |
Property Value by Mortgage Status in Hunts Point
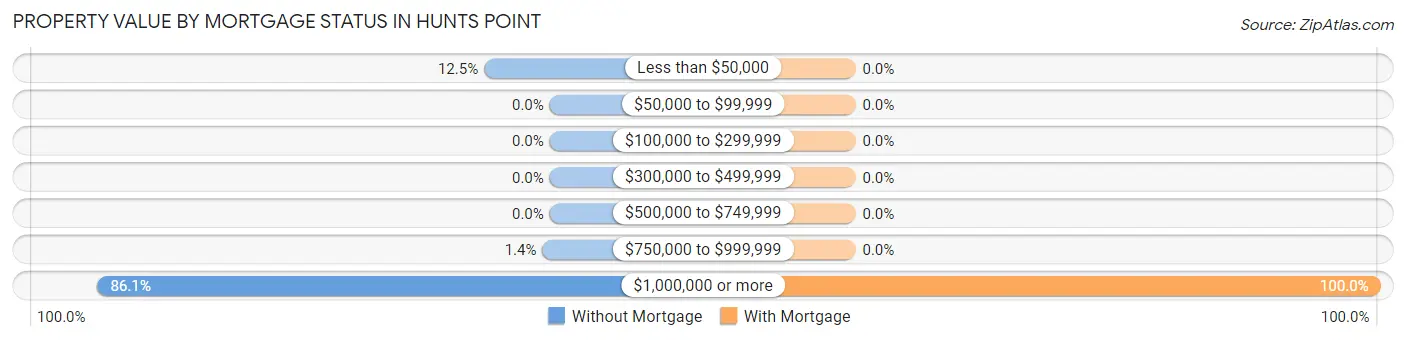
| Property Value | Without Mortgage | With Mortgage |
| Less than $50,000 | 9 (12.5%) | 0 (0.0%) |
| $50,000 to $99,999 | 0 (0.0%) | 0 (0.0%) |
| $100,000 to $299,999 | 0 (0.0%) | 0 (0.0%) |
| $300,000 to $499,999 | 0 (0.0%) | 0 (0.0%) |
| $500,000 to $749,999 | 0 (0.0%) | 0 (0.0%) |
| $750,000 to $999,999 | 1 (1.4%) | 0 (0.0%) |
| $1,000,000 or more | 62 (86.1%) | 50 (100.0%) |
| Total | 72 (100.0%) | 50 (100.0%) |
Household Income by Mortgage Status in Hunts Point
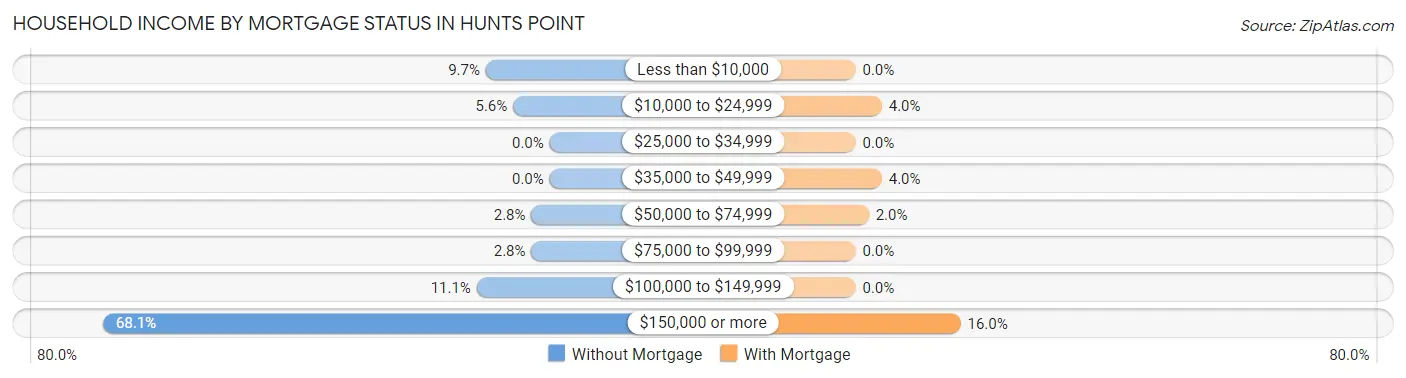
| Household Income | Without Mortgage | With Mortgage |
| Less than $10,000 | 7 (9.7%) | 0 (0.0%) |
| $10,000 to $24,999 | 4 (5.6%) | 2 (4.0%) |
| $25,000 to $34,999 | 0 (0.0%) | 0 (0.0%) |
| $35,000 to $49,999 | 0 (0.0%) | 2 (4.0%) |
| $50,000 to $74,999 | 2 (2.8%) | 1 (2.0%) |
| $75,000 to $99,999 | 2 (2.8%) | 0 (0.0%) |
| $100,000 to $149,999 | 8 (11.1%) | 0 (0.0%) |
| $150,000 or more | 49 (68.1%) | 8 (16.0%) |
| Total | 72 (100.0%) | 50 (100.0%) |
Property Value to Household Income Ratio in Hunts Point
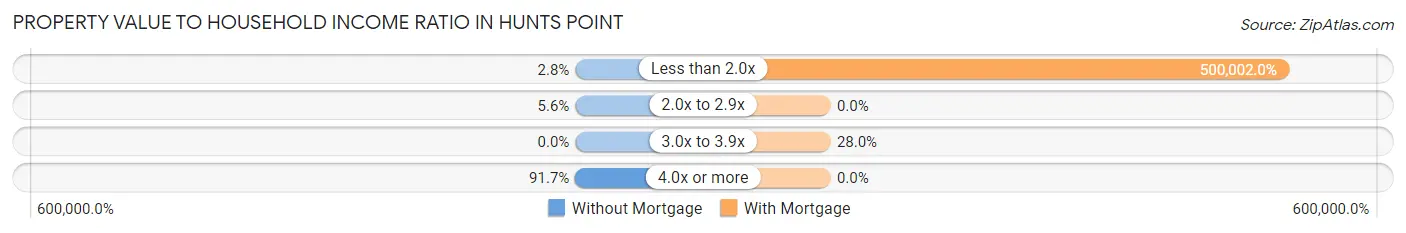
| Value-to-Income Ratio | Without Mortgage | With Mortgage |
| Less than 2.0x | 2 (2.8%) | 250,001 (500,002.0%) |
| 2.0x to 2.9x | 4 (5.6%) | 0 (0.0%) |
| 3.0x to 3.9x | 0 (0.0%) | 14 (28.0%) |
| 4.0x or more | 66 (91.7%) | 0 (0.0%) |
| Total | 72 (100.0%) | 50 (100.0%) |
Real Estate Taxes by Mortgage Status in Hunts Point
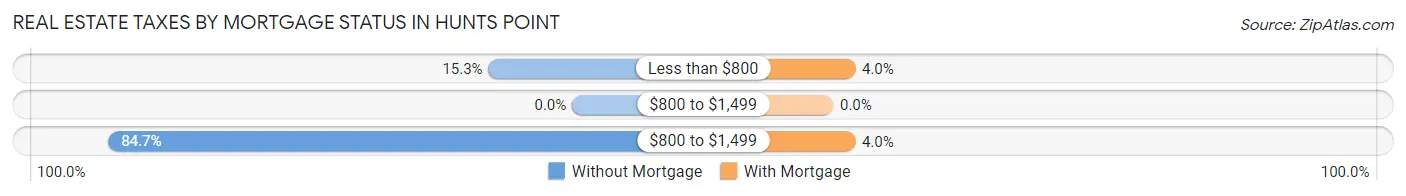
| Property Taxes | Without Mortgage | With Mortgage |
| Less than $800 | 11 (15.3%) | 2 (4.0%) |
| $800 to $1,499 | 0 (0.0%) | 0 (0.0%) |
| $800 to $1,499 | 61 (84.7%) | 2 (4.0%) |
| Total | 72 (100.0%) | 50 (100.0%) |
Health & Disability in Hunts Point
Health Insurance Coverage by Age in Hunts Point
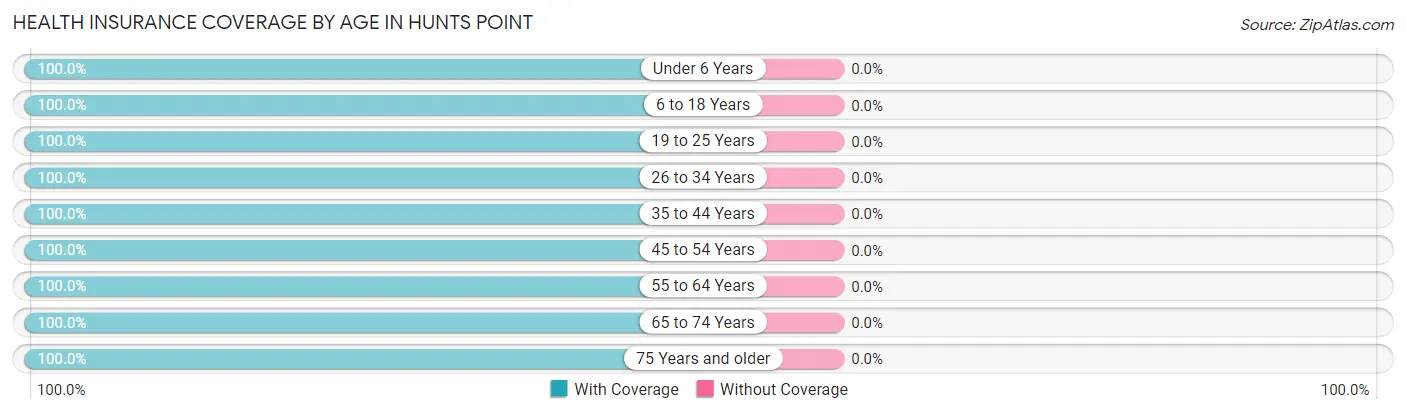
| Age Bracket | With Coverage | Without Coverage |
| Under 6 Years | 13 (100.0%) | 0 (0.0%) |
| 6 to 18 Years | 43 (100.0%) | 0 (0.0%) |
| 19 to 25 Years | 5 (100.0%) | 0 (0.0%) |
| 26 to 34 Years | 12 (100.0%) | 0 (0.0%) |
| 35 to 44 Years | 23 (100.0%) | 0 (0.0%) |
| 45 to 54 Years | 45 (100.0%) | 0 (0.0%) |
| 55 to 64 Years | 61 (100.0%) | 0 (0.0%) |
| 65 to 74 Years | 39 (100.0%) | 0 (0.0%) |
| 75 Years and older | 81 (100.0%) | 0 (0.0%) |
| Total | 322 (100.0%) | 0 (0.0%) |
Health Insurance Coverage by Citizenship Status in Hunts Point
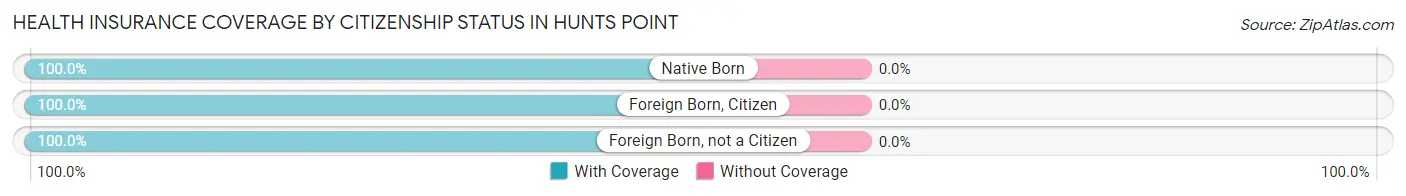
| Citizenship Status | With Coverage | Without Coverage |
| Native Born | 13 (100.0%) | 0 (0.0%) |
| Foreign Born, Citizen | 43 (100.0%) | 0 (0.0%) |
| Foreign Born, not a Citizen | 5 (100.0%) | 0 (0.0%) |
Health Insurance Coverage by Household Income in Hunts Point
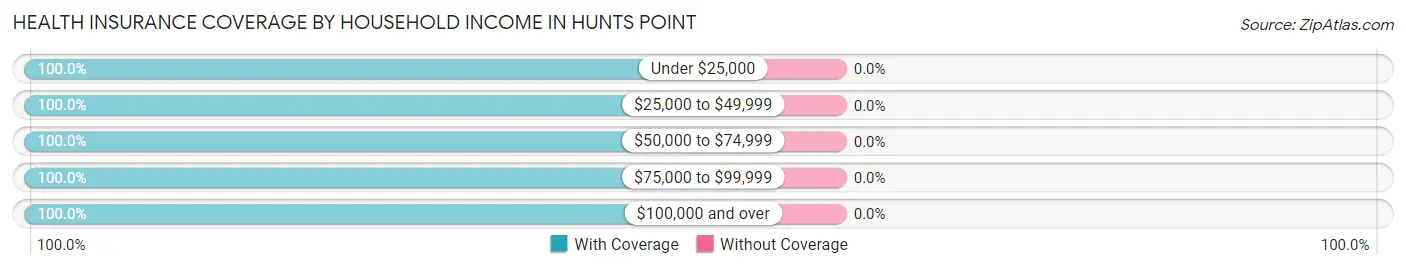
| Household Income | With Coverage | Without Coverage |
| Under $25,000 | 29 (100.0%) | 0 (0.0%) |
| $25,000 to $49,999 | 4 (100.0%) | 0 (0.0%) |
| $50,000 to $74,999 | 7 (100.0%) | 0 (0.0%) |
| $75,000 to $99,999 | 4 (100.0%) | 0 (0.0%) |
| $100,000 and over | 278 (100.0%) | 0 (0.0%) |
Public vs Private Health Insurance Coverage by Age in Hunts Point
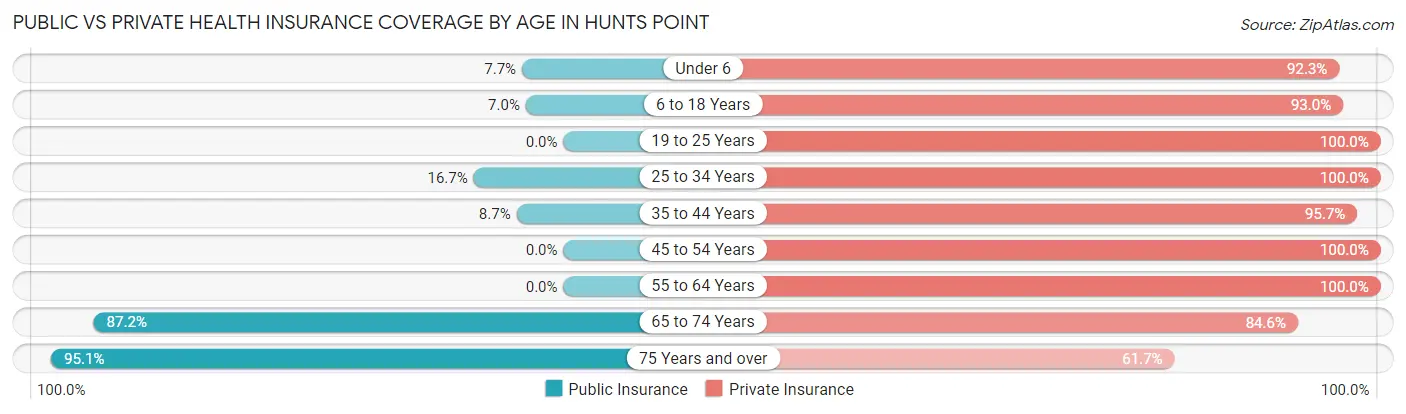
| Age Bracket | Public Insurance | Private Insurance |
| Under 6 | 1 (7.7%) | 12 (92.3%) |
| 6 to 18 Years | 3 (7.0%) | 40 (93.0%) |
| 19 to 25 Years | 0 (0.0%) | 5 (100.0%) |
| 25 to 34 Years | 2 (16.7%) | 12 (100.0%) |
| 35 to 44 Years | 2 (8.7%) | 22 (95.7%) |
| 45 to 54 Years | 0 (0.0%) | 45 (100.0%) |
| 55 to 64 Years | 0 (0.0%) | 61 (100.0%) |
| 65 to 74 Years | 34 (87.2%) | 33 (84.6%) |
| 75 Years and over | 77 (95.1%) | 50 (61.7%) |
| Total | 119 (37.0%) | 280 (87.0%) |
Disability Status by Sex by Age in Hunts Point
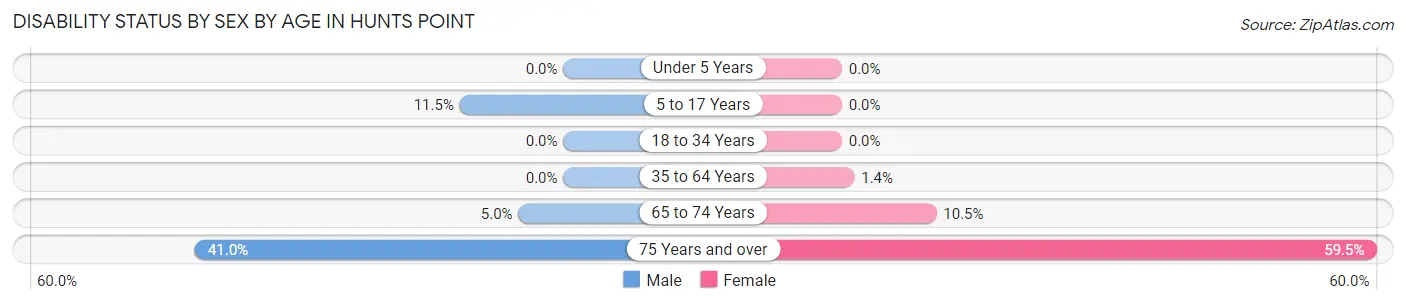
| Age Bracket | Male | Female |
| Under 5 Years | 0 (0.0%) | 0 (0.0%) |
| 5 to 17 Years | 3 (11.5%) | 0 (0.0%) |
| 18 to 34 Years | 0 (0.0%) | 0 (0.0%) |
| 35 to 64 Years | 0 (0.0%) | 1 (1.4%) |
| 65 to 74 Years | 1 (5.0%) | 2 (10.5%) |
| 75 Years and over | 16 (41.0%) | 25 (59.5%) |
Disability Class by Sex by Age in Hunts Point
Disability Class: Hearing Difficulty
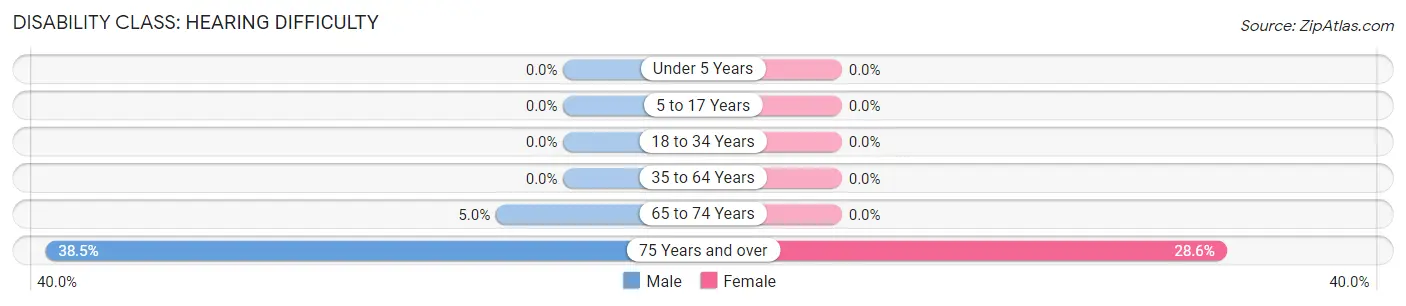
| Age Bracket | Male | Female |
| Under 5 Years | 0 (0.0%) | 0 (0.0%) |
| 5 to 17 Years | 0 (0.0%) | 0 (0.0%) |
| 18 to 34 Years | 0 (0.0%) | 0 (0.0%) |
| 35 to 64 Years | 0 (0.0%) | 0 (0.0%) |
| 65 to 74 Years | 1 (5.0%) | 0 (0.0%) |
| 75 Years and over | 15 (38.5%) | 12 (28.6%) |
Disability Class: Vision Difficulty
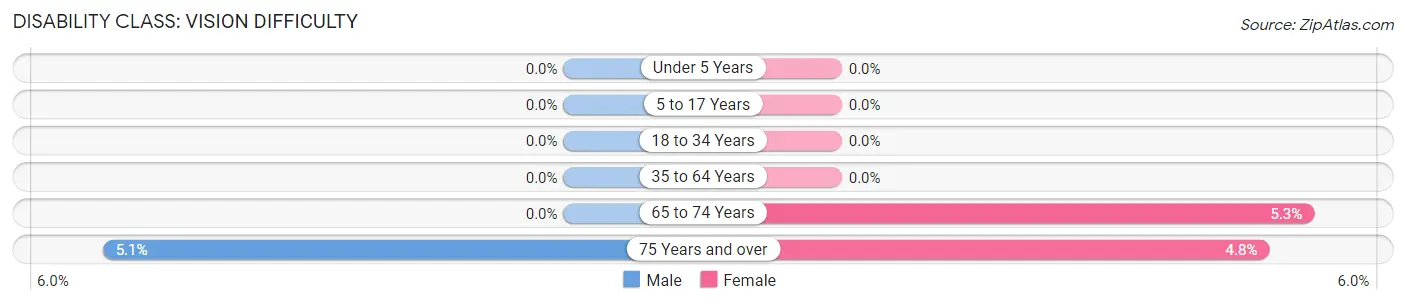
| Age Bracket | Male | Female |
| Under 5 Years | 0 (0.0%) | 0 (0.0%) |
| 5 to 17 Years | 0 (0.0%) | 0 (0.0%) |
| 18 to 34 Years | 0 (0.0%) | 0 (0.0%) |
| 35 to 64 Years | 0 (0.0%) | 0 (0.0%) |
| 65 to 74 Years | 0 (0.0%) | 1 (5.3%) |
| 75 Years and over | 2 (5.1%) | 2 (4.8%) |
Disability Class: Cognitive Difficulty
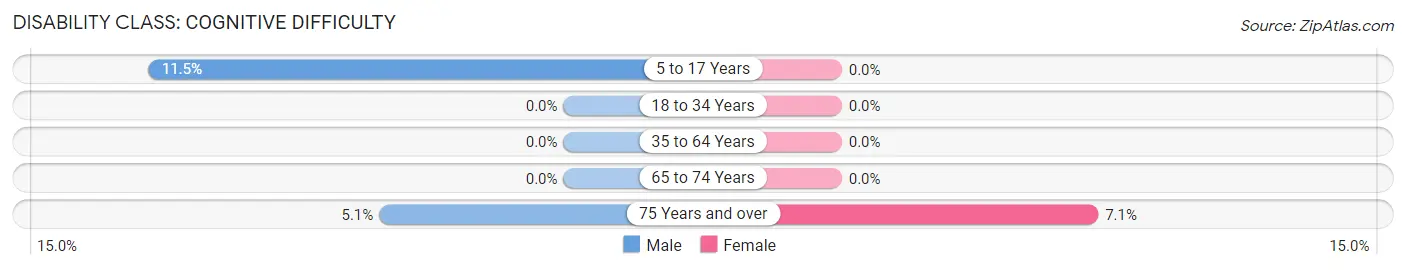
| Age Bracket | Male | Female |
| 5 to 17 Years | 3 (11.5%) | 0 (0.0%) |
| 18 to 34 Years | 0 (0.0%) | 0 (0.0%) |
| 35 to 64 Years | 0 (0.0%) | 0 (0.0%) |
| 65 to 74 Years | 0 (0.0%) | 0 (0.0%) |
| 75 Years and over | 2 (5.1%) | 3 (7.1%) |
Disability Class: Ambulatory Difficulty
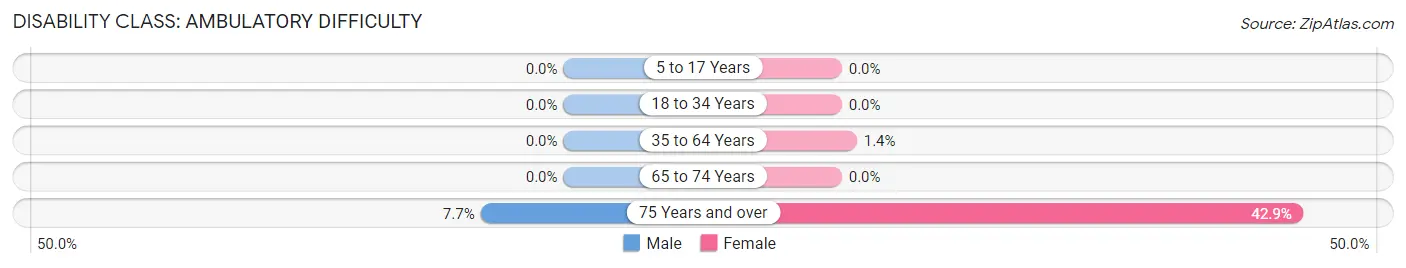
| Age Bracket | Male | Female |
| 5 to 17 Years | 0 (0.0%) | 0 (0.0%) |
| 18 to 34 Years | 0 (0.0%) | 0 (0.0%) |
| 35 to 64 Years | 0 (0.0%) | 1 (1.4%) |
| 65 to 74 Years | 0 (0.0%) | 0 (0.0%) |
| 75 Years and over | 3 (7.7%) | 18 (42.9%) |
Disability Class: Self-Care Difficulty
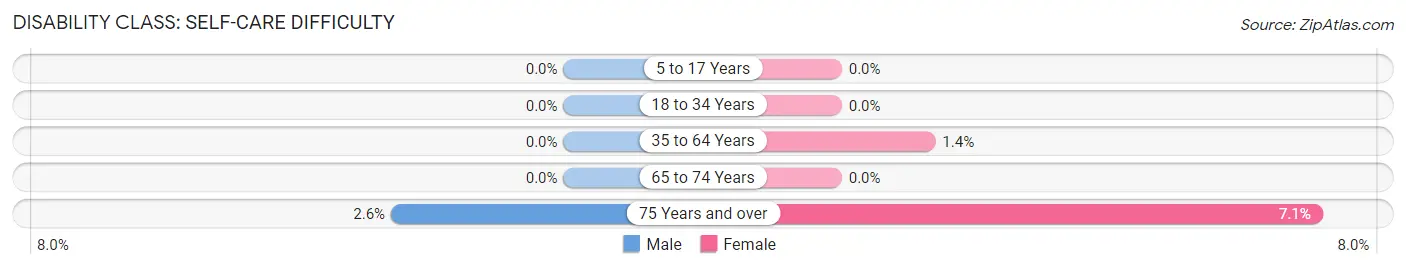
| Age Bracket | Male | Female |
| 5 to 17 Years | 0 (0.0%) | 0 (0.0%) |
| 18 to 34 Years | 0 (0.0%) | 0 (0.0%) |
| 35 to 64 Years | 0 (0.0%) | 1 (1.4%) |
| 65 to 74 Years | 0 (0.0%) | 0 (0.0%) |
| 75 Years and over | 1 (2.6%) | 3 (7.1%) |
Technology Access in Hunts Point
Computing Device Access in Hunts Point
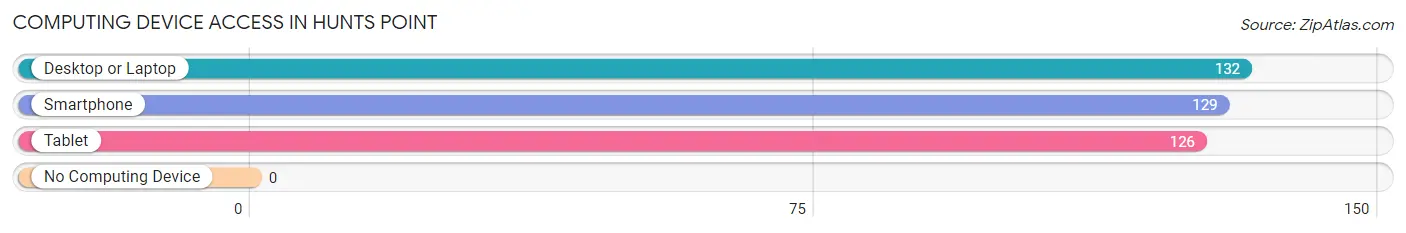
| Device Type | # Households | % Households |
| Desktop or Laptop | 132 | 97.1% |
| Smartphone | 129 | 94.9% |
| Tablet | 126 | 92.6% |
| No Computing Device | 0 | 0.0% |
| Total | 136 | 100.0% |
Internet Access in Hunts Point
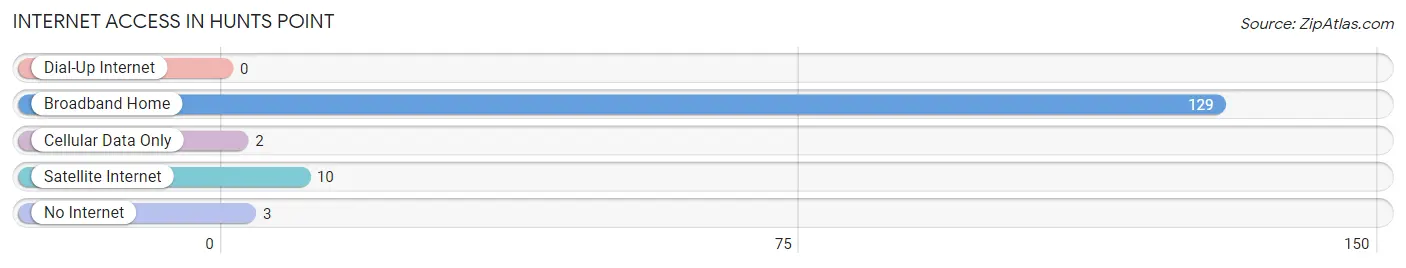
| Internet Type | # Households | % Households |
| Dial-Up Internet | 0 | 0.0% |
| Broadband Home | 129 | 94.9% |
| Cellular Data Only | 2 | 1.5% |
| Satellite Internet | 10 | 7.3% |
| No Internet | 3 | 2.2% |
| Total | 136 | 100.0% |
Hunts Point Summary
Hunts Point is a small town located in the state of Washington, United States. It is situated on the eastern shore of Lake Washington, just south of Seattle. The town has a population of approximately 1,000 people and is part of the Seattle metropolitan area.
History
Hunts Point was first settled in the late 1800s by a group of settlers from the Midwest. The town was named after the first settler, William Hunt, who arrived in the area in 1883. The town was originally a logging and fishing community, and the first post office was established in 1887.
In the early 1900s, the town began to grow and develop. The first school was built in 1906, and the first church was built in 1908. The town also had a general store, a blacksmith shop, and a sawmill.
In the 1920s, the town began to attract more people, and the population grew to over 500 people. The town was incorporated in 1925, and the first mayor was elected in 1926.
Geography
Hunts Point is located on the eastern shore of Lake Washington, just south of Seattle. The town is situated on a peninsula, and is surrounded by the lake on three sides. The town is bordered by the cities of Bellevue and Kirkland to the north, and Redmond to the south.
The town has a total area of 1.2 square miles, all of which is land. The town has a mild climate, with temperatures ranging from the mid-30s in the winter to the mid-70s in the summer.
Economy
The economy of Hunts Point is largely based on tourism and recreation. The town is home to several marinas, which attract visitors from all over the region. The town also has several restaurants, bars, and shops, which attract visitors from the surrounding area.
The town is also home to several small businesses, including a boat repair shop, a boat rental business, and a fishing charter business. The town also has a small airport, which is used for private planes and helicopters.
Demographics
As of the 2010 census, the population of Hunts Point was 1,000 people. The racial makeup of the town was 94.2% White, 0.7% African American, 0.7% Native American, 0.7% Asian, 0.7% from other races, and 2.7% from two or more races. Hispanic or Latino of any race were 2.7% of the population.
The median income for a household in the town was $60,000, and the median income for a family was $68,000. The per capita income for the town was $30,000. About 4.7% of families and 6.7% of the population were below the poverty line, including 8.7% of those under age 18 and none of those age 65 or over.
Common Questions
What is Per Capita Income in Hunts Point?
Per Capita income in Hunts Point is $258,149.
What is the Median Family Income in Hunts Point?
Median Family Income in Hunts Point is $250,001.
What is the Median Household income in Hunts Point?
Median Household Income in Hunts Point is $250,001.
What is Income or Wage Gap in Hunts Point?
Income or Wage Gap in Hunts Point is 51.1%.
Women in Hunts Point earn 48.9 cents for every dollar earned by a man.
What is Inequality or Gini Index in Hunts Point?
Inequality or Gini Index in Hunts Point is 0.53.
What is the Total Population of Hunts Point?
Total Population of Hunts Point is 323.
What is the Total Male Population of Hunts Point?
Total Male Population of Hunts Point is 161.
What is the Total Female Population of Hunts Point?
Total Female Population of Hunts Point is 162.
What is the Ratio of Males per 100 Females in Hunts Point?
There are 99.38 Males per 100 Females in Hunts Point.
What is the Ratio of Females per 100 Males in Hunts Point?
There are 100.62 Females per 100 Males in Hunts Point.
What is the Median Population Age in Hunts Point?
Median Population Age in Hunts Point is 58.6 Years.
What is the Average Family Size in Hunts Point
Average Family Size in Hunts Point is 2.7 People.
What is the Average Household Size in Hunts Point
Average Household Size in Hunts Point is 2.4 People.
How Large is the Labor Force in Hunts Point?
There are 124 People in the Labor Forcein in Hunts Point.
What is the Percentage of People in the Labor Force in Hunts Point?
44.6% of People are in the Labor Force in Hunts Point.
What is the Unemployment Rate in Hunts Point?
Unemployment Rate in Hunts Point is 0.8%.