Yarrow Point, WA Map & Demographics
Yarrow Point Map
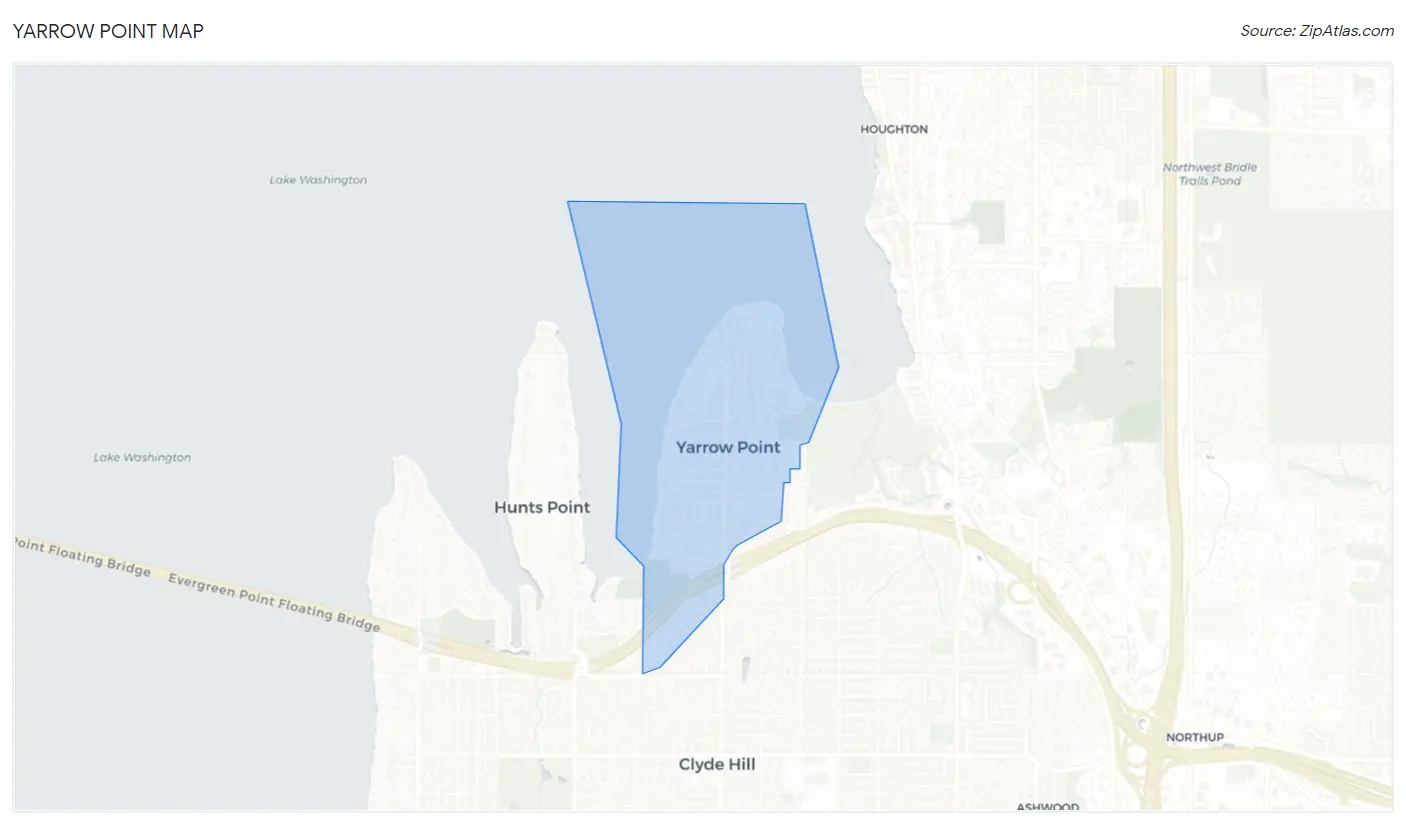
Yarrow Point Overview
$144,164
PER CAPITA INCOME
$250,001
AVG FAMILY INCOME
$250,001
AVG HOUSEHOLD INCOME
56.0%
WAGE / INCOME GAP [ % ]
44.0¢/ $1
WAGE / INCOME GAP [ $ ]
0.49
INEQUALITY / GINI INDEX
1,280
TOTAL POPULATION
642
MALE POPULATION
638
FEMALE POPULATION
100.63
MALES / 100 FEMALES
99.38
FEMALES / 100 MALES
47.9
MEDIAN AGE
3.1
AVG FAMILY SIZE
3.0
AVG HOUSEHOLD SIZE
622
LABOR FORCE [ PEOPLE ]
60.7%
PERCENT IN LABOR FORCE
2.1%
UNEMPLOYMENT RATE
Yarrow Point Area Codes
Income in Yarrow Point
Income Overview in Yarrow Point
Per Capita Income in Yarrow Point is $144,164, while median incomes of families and households are $250,001 and $250,001 respectively.
| Characteristic | Number | Measure |
| Per Capita Income | 1,280 | $144,164 |
| Median Family Income | 375 | $250,001 |
| Mean Family Income | 375 | $453,536 |
| Median Household Income | 433 | $250,001 |
| Mean Household Income | 433 | $421,181 |
| Income Deficit | 375 | $0 |
| Wage / Income Gap (%) | 1,280 | 56.01% |
| Wage / Income Gap ($) | 1,280 | 43.99¢ per $1 |
| Gini / Inequality Index | 1,280 | 0.49 |
Earnings by Sex in Yarrow Point
Average Earnings in Yarrow Point are $113,882, $158,063 for men and $69,531 for women, a difference of 56.0%.
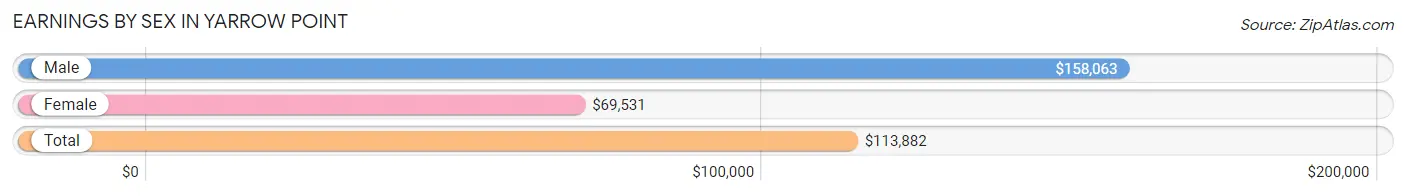
| Sex | Number | Average Earnings |
| Male | 387 (58.9%) | $158,063 |
| Female | 270 (41.1%) | $69,531 |
| Total | 657 (100.0%) | $113,882 |
Earnings by Sex by Income Bracket in Yarrow Point
The most common earnings brackets in Yarrow Point are $100,000+ for men (222 | 57.4%) and $100,000+ for women (119 | 44.1%).
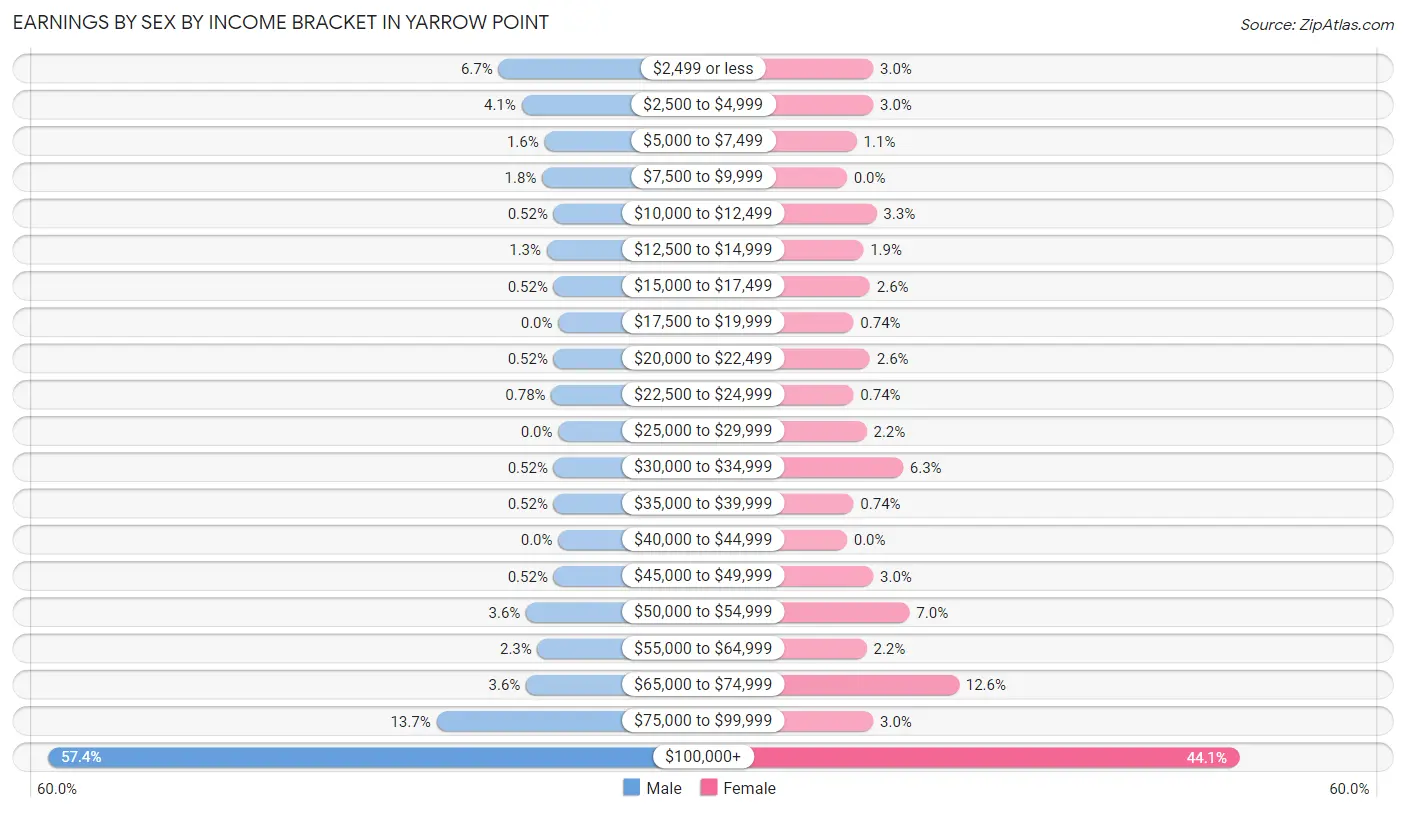
| Income | Male | Female |
| $2,499 or less | 26 (6.7%) | 8 (3.0%) |
| $2,500 to $4,999 | 16 (4.1%) | 8 (3.0%) |
| $5,000 to $7,499 | 6 (1.5%) | 3 (1.1%) |
| $7,500 to $9,999 | 7 (1.8%) | 0 (0.0%) |
| $10,000 to $12,499 | 2 (0.5%) | 9 (3.3%) |
| $12,500 to $14,999 | 5 (1.3%) | 5 (1.8%) |
| $15,000 to $17,499 | 2 (0.5%) | 7 (2.6%) |
| $17,500 to $19,999 | 0 (0.0%) | 2 (0.7%) |
| $20,000 to $22,499 | 2 (0.5%) | 7 (2.6%) |
| $22,500 to $24,999 | 3 (0.8%) | 2 (0.7%) |
| $25,000 to $29,999 | 0 (0.0%) | 6 (2.2%) |
| $30,000 to $34,999 | 2 (0.5%) | 17 (6.3%) |
| $35,000 to $39,999 | 2 (0.5%) | 2 (0.7%) |
| $40,000 to $44,999 | 0 (0.0%) | 0 (0.0%) |
| $45,000 to $49,999 | 2 (0.5%) | 8 (3.0%) |
| $50,000 to $54,999 | 14 (3.6%) | 19 (7.0%) |
| $55,000 to $64,999 | 9 (2.3%) | 6 (2.2%) |
| $65,000 to $74,999 | 14 (3.6%) | 34 (12.6%) |
| $75,000 to $99,999 | 53 (13.7%) | 8 (3.0%) |
| $100,000+ | 222 (57.4%) | 119 (44.1%) |
| Total | 387 (100.0%) | 270 (100.0%) |
Earnings by Sex by Educational Attainment in Yarrow Point
Average earnings in Yarrow Point are $161,429 for men and $73,750 for women, a difference of 54.3%. Men with an educational attainment of graduate degree enjoy the highest average annual earnings of $229,231, while those with bachelor's degree education earn the least with $139,750. Women with an educational attainment of bachelor's degree earn the most with the average annual earnings of $113,333, while those with graduate degree education have the smallest earnings of $69,412.
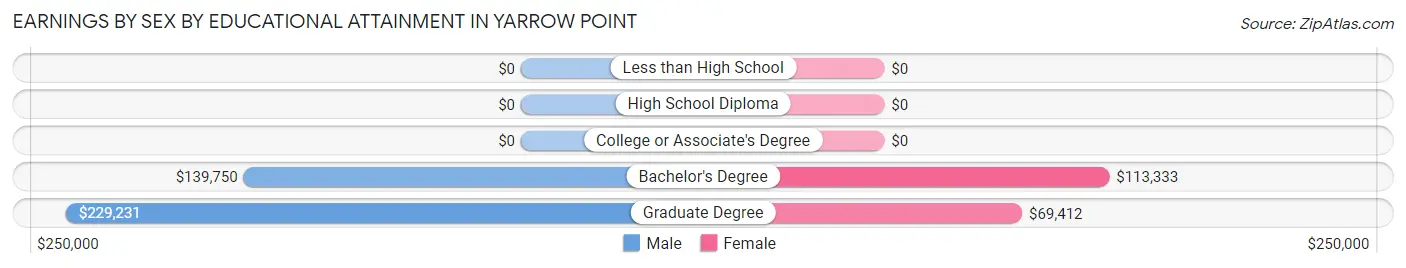
| Educational Attainment | Male Income | Female Income |
| Less than High School | - | - |
| High School Diploma | - | - |
| College or Associate's Degree | - | - |
| Bachelor's Degree | $139,750 | $113,333 |
| Graduate Degree | $229,231 | $69,412 |
| Total | $161,429 | $73,750 |
Family Income in Yarrow Point
Family Income Brackets in Yarrow Point
According to the Yarrow Point family income data, there are 246 families falling into the $200,000+ income range, which is the most common income bracket and makes up 65.6% of all families.
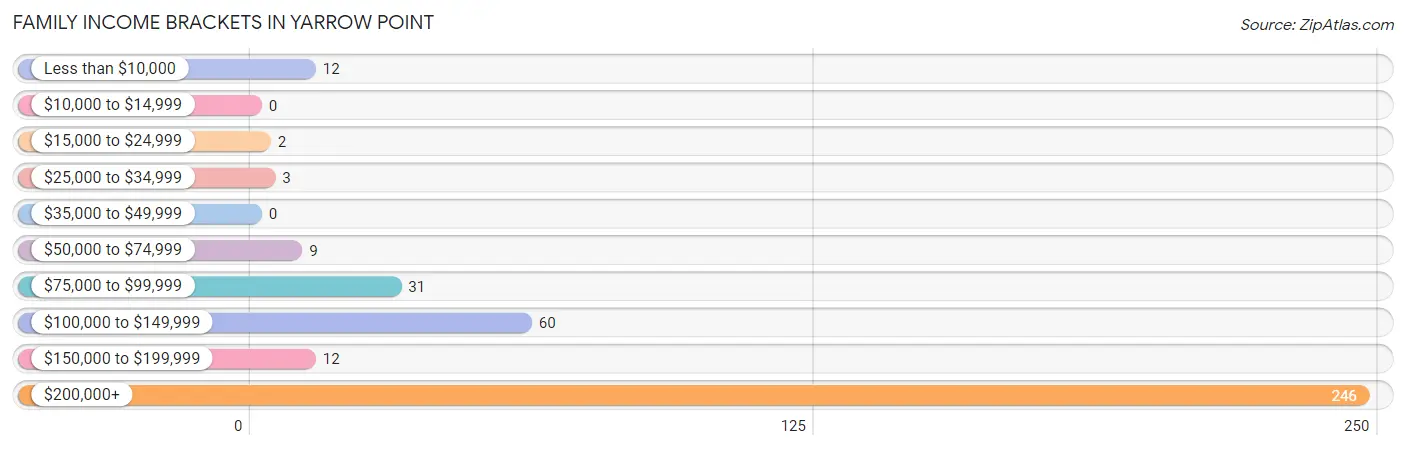
| Income Bracket | # Families | % Families |
| Less than $10,000 | 12 | 3.2% |
| $10,000 to $14,999 | 0 | 0.0% |
| $15,000 to $24,999 | 2 | 0.5% |
| $25,000 to $34,999 | 3 | 0.8% |
| $35,000 to $49,999 | 0 | 0.0% |
| $50,000 to $74,999 | 9 | 2.4% |
| $75,000 to $99,999 | 31 | 8.3% |
| $100,000 to $149,999 | 60 | 16.0% |
| $150,000 to $199,999 | 12 | 3.2% |
| $200,000+ | 246 | 65.6% |
Family Income by Famaliy Size in Yarrow Point
3-person families (104 | 27.7%) account for the highest median family income in Yarrow Point with $250,001 per family, while 3-person families (104 | 27.7%) have the highest median income of $83,334 per family member.
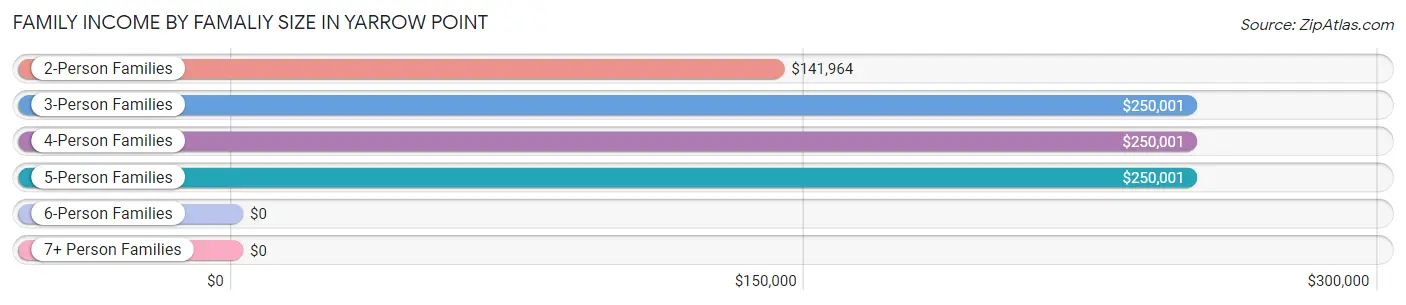
| Income Bracket | # Families | Median Income |
| 2-Person Families | 129 (34.4%) | $141,964 |
| 3-Person Families | 104 (27.7%) | $250,001 |
| 4-Person Families | 104 (27.7%) | $250,001 |
| 5-Person Families | 38 (10.1%) | $250,001 |
| 6-Person Families | 0 (0.0%) | $0 |
| 7+ Person Families | 0 (0.0%) | $0 |
| Total | 375 (100.0%) | $250,001 |
Family Income by Number of Earners in Yarrow Point
The median family income in Yarrow Point is $250,001, with families comprising 1 earner (103) having the highest median family income of $250,001, while families with no earners (67) have the lowest median family income of $115,417, accounting for 27.5% and 17.9% of families, respectively.
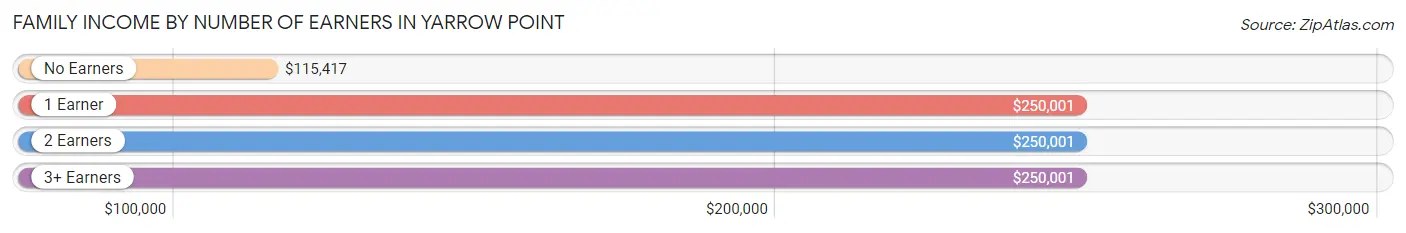
| Number of Earners | # Families | Median Income |
| No Earners | 67 (17.9%) | $115,417 |
| 1 Earner | 103 (27.5%) | $250,001 |
| 2 Earners | 174 (46.4%) | $250,001 |
| 3+ Earners | 31 (8.3%) | $250,001 |
| Total | 375 (100.0%) | $250,001 |
Household Income in Yarrow Point
Household Income Brackets in Yarrow Point
With 269 households falling in the category, the $200,000+ income range is the most frequent in Yarrow Point, accounting for 62.1% of all households.
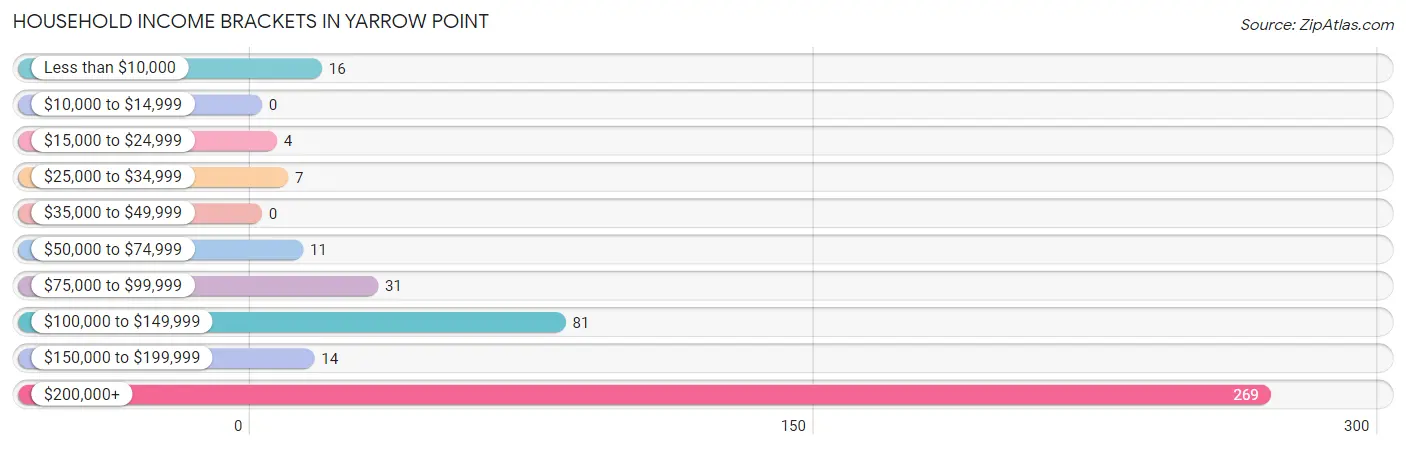
| Income Bracket | # Households | % Households |
| Less than $10,000 | 16 | 3.7% |
| $10,000 to $14,999 | 0 | 0.0% |
| $15,000 to $24,999 | 4 | 0.9% |
| $25,000 to $34,999 | 7 | 1.6% |
| $35,000 to $49,999 | 0 | 0.0% |
| $50,000 to $74,999 | 11 | 2.5% |
| $75,000 to $99,999 | 31 | 7.2% |
| $100,000 to $149,999 | 81 | 18.7% |
| $150,000 to $199,999 | 14 | 3.2% |
| $200,000+ | 269 | 62.1% |
Household Income by Householder Age in Yarrow Point
The median household income in Yarrow Point is $250,001, with the highest median household income of $250,001 found in the 25 to 44 years age bracket for the primary householder. A total of 79 households (18.2%) fall into this category.
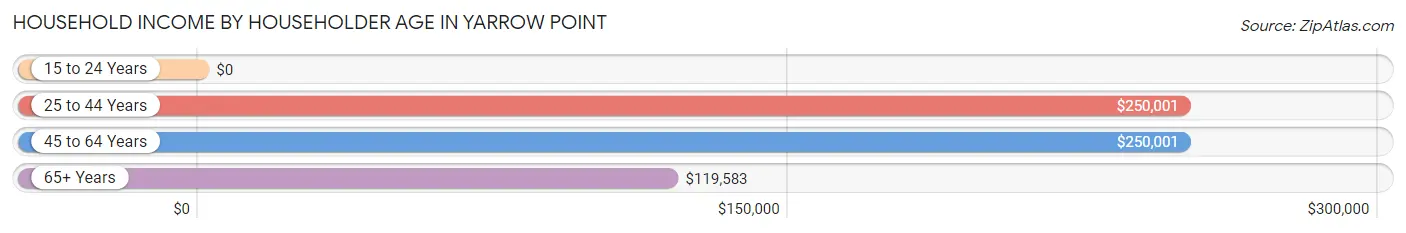
| Income Bracket | # Households | Median Income |
| 15 to 24 Years | 0 (0.0%) | $0 |
| 25 to 44 Years | 79 (18.2%) | $250,001 |
| 45 to 64 Years | 232 (53.6%) | $250,001 |
| 65+ Years | 122 (28.2%) | $119,583 |
| Total | 433 (100.0%) | $250,001 |
Poverty in Yarrow Point
Income Below Poverty by Sex and Age in Yarrow Point
With 3.9% poverty level for males and 5.5% for females among the residents of Yarrow Point, 18 to 24 year old males and 25 to 34 year old females are the most vulnerable to poverty, with 6 males (23.1%) and 9 females (22.5%) in their respective age groups living below the poverty level.
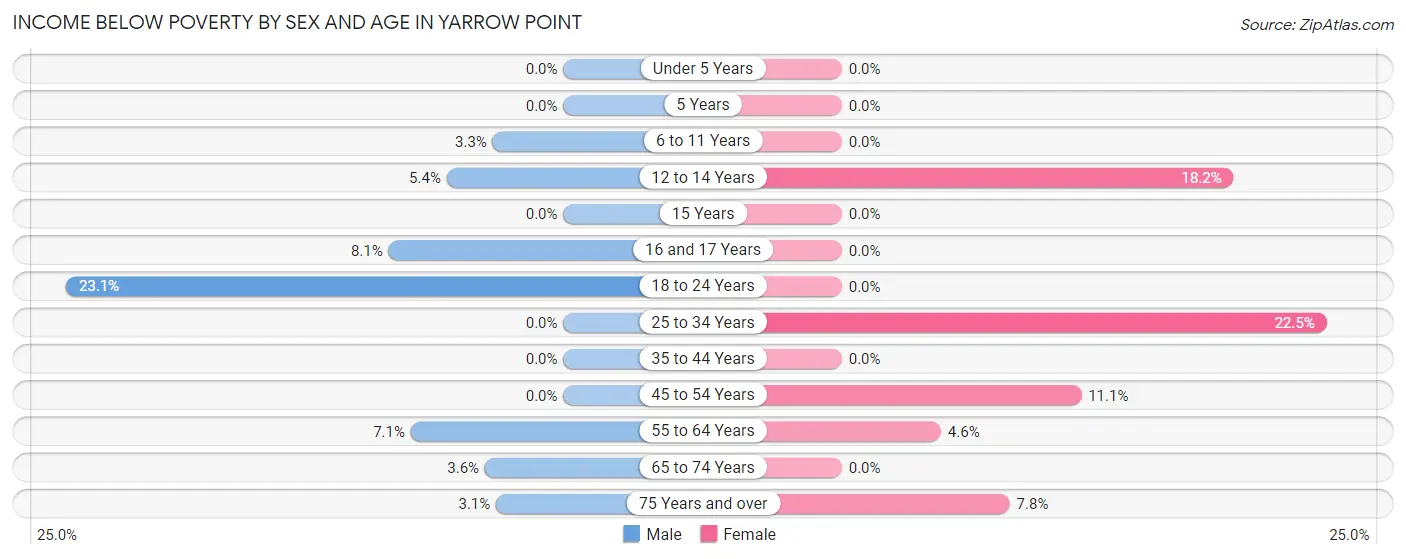
| Age Bracket | Male | Female |
| Under 5 Years | 0 (0.0%) | 0 (0.0%) |
| 5 Years | 0 (0.0%) | 0 (0.0%) |
| 6 to 11 Years | 2 (3.3%) | 0 (0.0%) |
| 12 to 14 Years | 2 (5.4%) | 2 (18.2%) |
| 15 Years | 0 (0.0%) | 0 (0.0%) |
| 16 and 17 Years | 3 (8.1%) | 0 (0.0%) |
| 18 to 24 Years | 6 (23.1%) | 0 (0.0%) |
| 25 to 34 Years | 0 (0.0%) | 9 (22.5%) |
| 35 to 44 Years | 0 (0.0%) | 0 (0.0%) |
| 45 to 54 Years | 0 (0.0%) | 14 (11.1%) |
| 55 to 64 Years | 8 (7.1%) | 4 (4.6%) |
| 65 to 74 Years | 2 (3.6%) | 0 (0.0%) |
| 75 Years and over | 2 (3.1%) | 6 (7.8%) |
| Total | 25 (3.9%) | 35 (5.5%) |
Income Above Poverty by Sex and Age in Yarrow Point
According to the poverty statistics in Yarrow Point, males aged under 5 years and females aged under 5 years are the age groups that are most secure financially, with 100.0% of males and 100.0% of females in these age groups living above the poverty line.
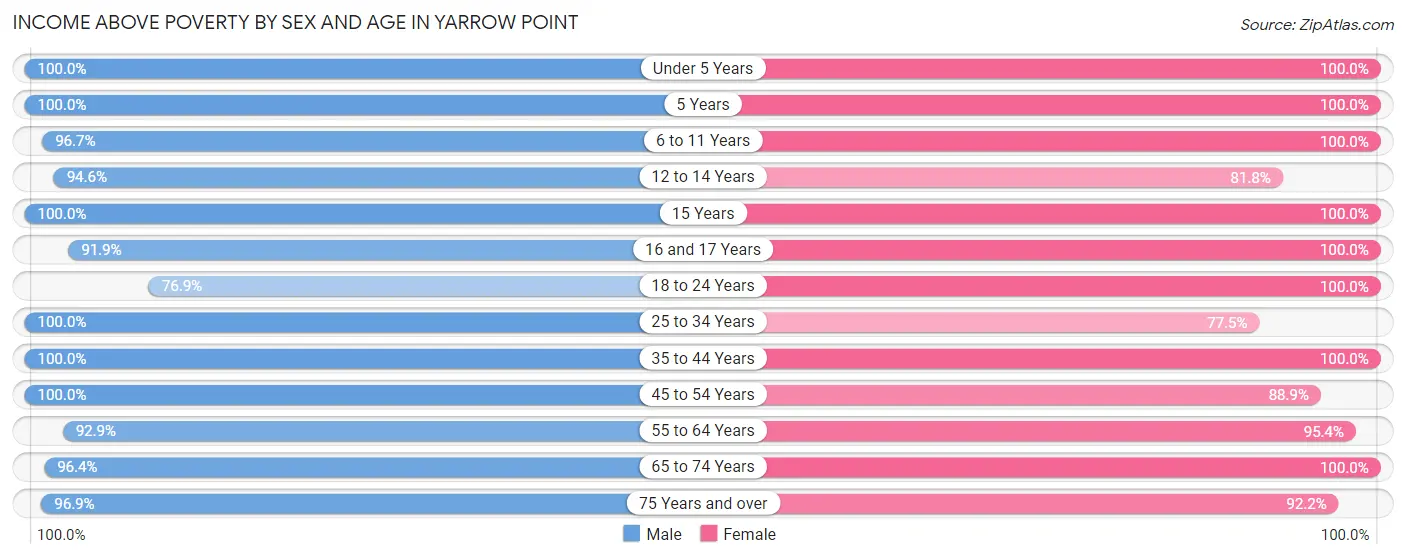
| Age Bracket | Male | Female |
| Under 5 Years | 25 (100.0%) | 10 (100.0%) |
| 5 Years | 2 (100.0%) | 12 (100.0%) |
| 6 to 11 Years | 59 (96.7%) | 72 (100.0%) |
| 12 to 14 Years | 35 (94.6%) | 9 (81.8%) |
| 15 Years | 7 (100.0%) | 19 (100.0%) |
| 16 and 17 Years | 34 (91.9%) | 29 (100.0%) |
| 18 to 24 Years | 20 (76.9%) | 13 (100.0%) |
| 25 to 34 Years | 50 (100.0%) | 31 (77.5%) |
| 35 to 44 Years | 59 (100.0%) | 99 (100.0%) |
| 45 to 54 Years | 106 (100.0%) | 112 (88.9%) |
| 55 to 64 Years | 105 (92.9%) | 83 (95.4%) |
| 65 to 74 Years | 53 (96.4%) | 43 (100.0%) |
| 75 Years and over | 62 (96.9%) | 71 (92.2%) |
| Total | 617 (96.1%) | 603 (94.5%) |
Income Below Poverty Among Married-Couple Families in Yarrow Point
The poverty statistics for married-couple families in Yarrow Point show that 2.9% or 10 of the total 351 families live below the poverty line. Families with no children have the highest poverty rate of 3.7%, comprising of 6 families. On the other hand, families with 3 or 4 children have the lowest poverty rate of 0.0%, which includes 0 families.
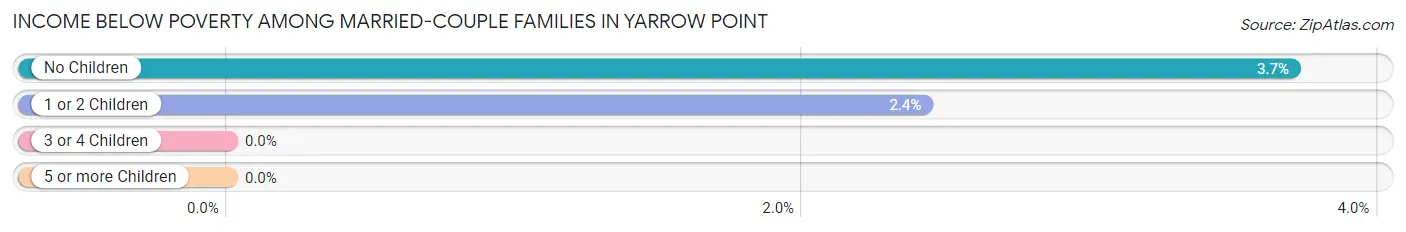
| Children | Above Poverty | Below Poverty |
| No Children | 156 (96.3%) | 6 (3.7%) |
| 1 or 2 Children | 161 (97.6%) | 4 (2.4%) |
| 3 or 4 Children | 24 (100.0%) | 0 (0.0%) |
| 5 or more Children | 0 (0.0%) | 0 (0.0%) |
| Total | 341 (97.2%) | 10 (2.9%) |
Income Below Poverty Among Single-Parent Households in Yarrow Point
According to the poverty data in Yarrow Point, 18.2% or 2 single-father households and 15.4% or 2 single-mother households are living below the poverty line. Among single-father households, those with 1 or 2 children have the highest poverty rate, with 2 households (18.2%) experiencing poverty. Likewise, among single-mother households, those with 1 or 2 children have the highest poverty rate, with 2 households (18.2%) falling below the poverty line.
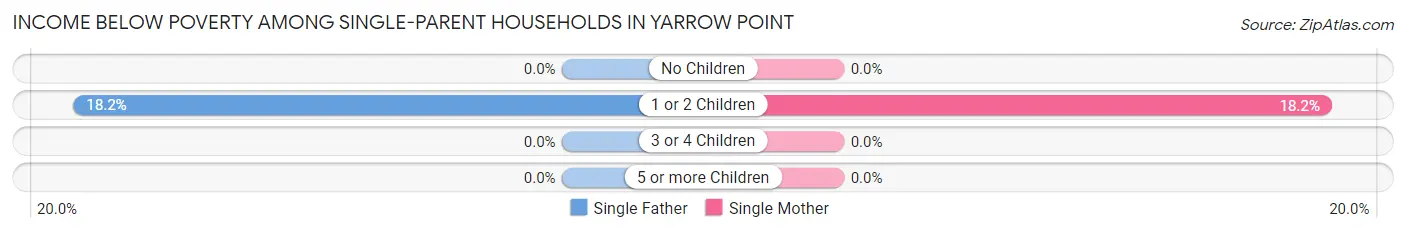
| Children | Single Father | Single Mother |
| No Children | 0 (0.0%) | 0 (0.0%) |
| 1 or 2 Children | 2 (18.2%) | 2 (18.2%) |
| 3 or 4 Children | 0 (0.0%) | 0 (0.0%) |
| 5 or more Children | 0 (0.0%) | 0 (0.0%) |
| Total | 2 (18.2%) | 2 (15.4%) |
Income Below Poverty Among Married-Couple vs Single-Parent Households in Yarrow Point
The poverty data for Yarrow Point shows that 10 of the married-couple family households (2.9%) and 4 of the single-parent households (16.7%) are living below the poverty level. Within the married-couple family households, those with no children have the highest poverty rate, with 6 households (3.7%) falling below the poverty line. Among the single-parent households, those with 1 or 2 children have the highest poverty rate, with 4 household (18.2%) living below poverty.
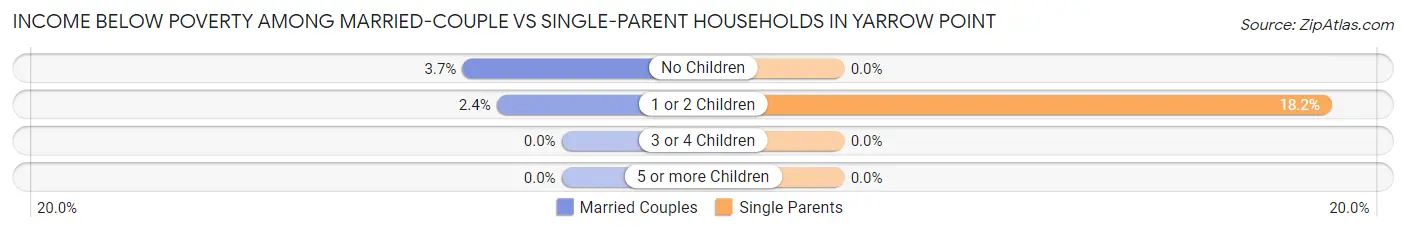
| Children | Married-Couple Families | Single-Parent Households |
| No Children | 6 (3.7%) | 0 (0.0%) |
| 1 or 2 Children | 4 (2.4%) | 4 (18.2%) |
| 3 or 4 Children | 0 (0.0%) | 0 (0.0%) |
| 5 or more Children | 0 (0.0%) | 0 (0.0%) |
| Total | 10 (2.9%) | 4 (16.7%) |
Race in Yarrow Point
The most populous races in Yarrow Point are White / Caucasian (795 | 62.1%), Asian (349 | 27.3%), and Two or more Races (120 | 9.4%).
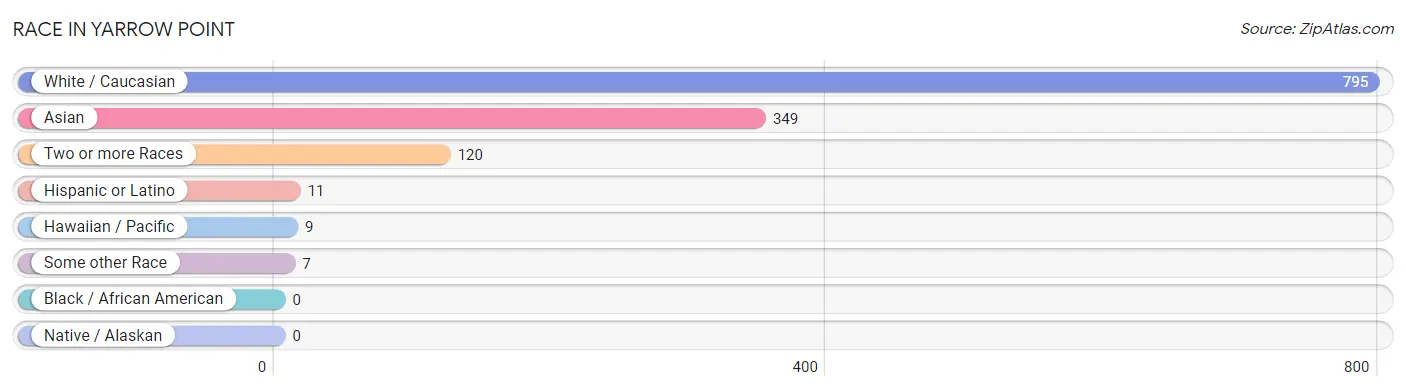
| Race | # Population | % Population |
| Asian | 349 | 27.3% |
| Black / African American | 0 | 0.0% |
| Hawaiian / Pacific | 9 | 0.7% |
| Hispanic or Latino | 11 | 0.9% |
| Native / Alaskan | 0 | 0.0% |
| White / Caucasian | 795 | 62.1% |
| Two or more Races | 120 | 9.4% |
| Some other Race | 7 | 0.5% |
| Total | 1,280 | 100.0% |
Ancestry in Yarrow Point
The most populous ancestries reported in Yarrow Point are Indian (Asian) (224 | 17.5%), German (151 | 11.8%), English (150 | 11.7%), Irish (93 | 7.3%), and Filipino (77 | 6.0%), together accounting for 54.3% of all Yarrow Point residents.
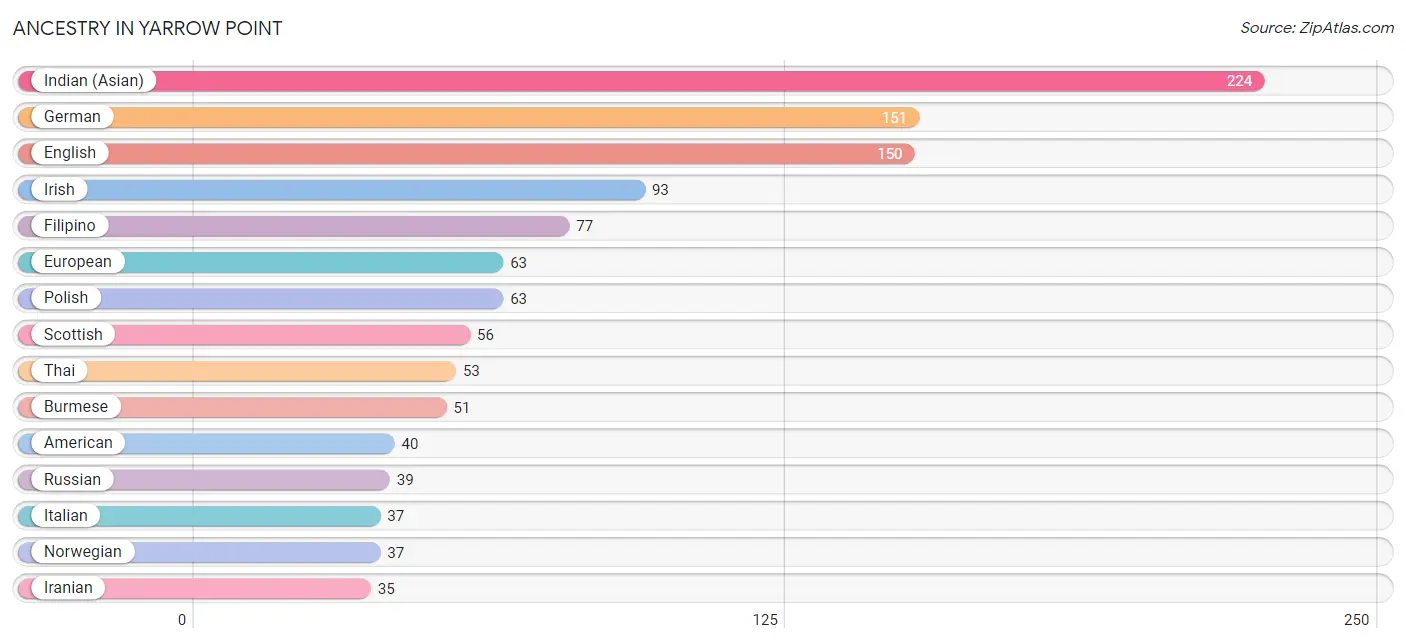
| Ancestry | # Population | % Population |
| Albanian | 6 | 0.5% |
| American | 40 | 3.1% |
| Arab | 15 | 1.2% |
| Armenian | 8 | 0.6% |
| Belgian | 13 | 1.0% |
| Brazilian | 9 | 0.7% |
| British | 6 | 0.5% |
| Burmese | 51 | 4.0% |
| Canadian | 2 | 0.2% |
| Chilean | 1 | 0.1% |
| Danish | 15 | 1.2% |
| Dutch | 22 | 1.7% |
| Eastern European | 10 | 0.8% |
| Egyptian | 8 | 0.6% |
| English | 150 | 11.7% |
| European | 63 | 4.9% |
| Filipino | 77 | 6.0% |
| Finnish | 5 | 0.4% |
| French | 34 | 2.7% |
| German | 151 | 11.8% |
| Greek | 6 | 0.5% |
| Guamanian / Chamorro | 4 | 0.3% |
| Hungarian | 3 | 0.2% |
| Indian (Asian) | 224 | 17.5% |
| Iranian | 35 | 2.7% |
| Irish | 93 | 7.3% |
| Italian | 37 | 2.9% |
| Korean | 17 | 1.3% |
| Latvian | 4 | 0.3% |
| Lebanese | 7 | 0.5% |
| Lithuanian | 3 | 0.2% |
| Native Hawaiian | 7 | 0.5% |
| Northern European | 28 | 2.2% |
| Norwegian | 37 | 2.9% |
| Peruvian | 2 | 0.2% |
| Polish | 63 | 4.9% |
| Russian | 39 | 3.0% |
| Scandinavian | 9 | 0.7% |
| Scotch-Irish | 18 | 1.4% |
| Scottish | 56 | 4.4% |
| Slovene | 4 | 0.3% |
| South American | 3 | 0.2% |
| Spaniard | 8 | 0.6% |
| Swedish | 17 | 1.3% |
| Swiss | 5 | 0.4% |
| Thai | 53 | 4.1% |
| Turkish | 3 | 0.2% |
| Ukrainian | 2 | 0.2% |
| Welsh | 7 | 0.5% | View All 49 Rows |
Immigrants in Yarrow Point
The most numerous immigrant groups reported in Yarrow Point came from Asia (261 | 20.4%), Eastern Asia (196 | 15.3%), China (191 | 14.9%), South Central Asia (59 | 4.6%), and Europe (43 | 3.4%), together accounting for 58.6% of all Yarrow Point residents.
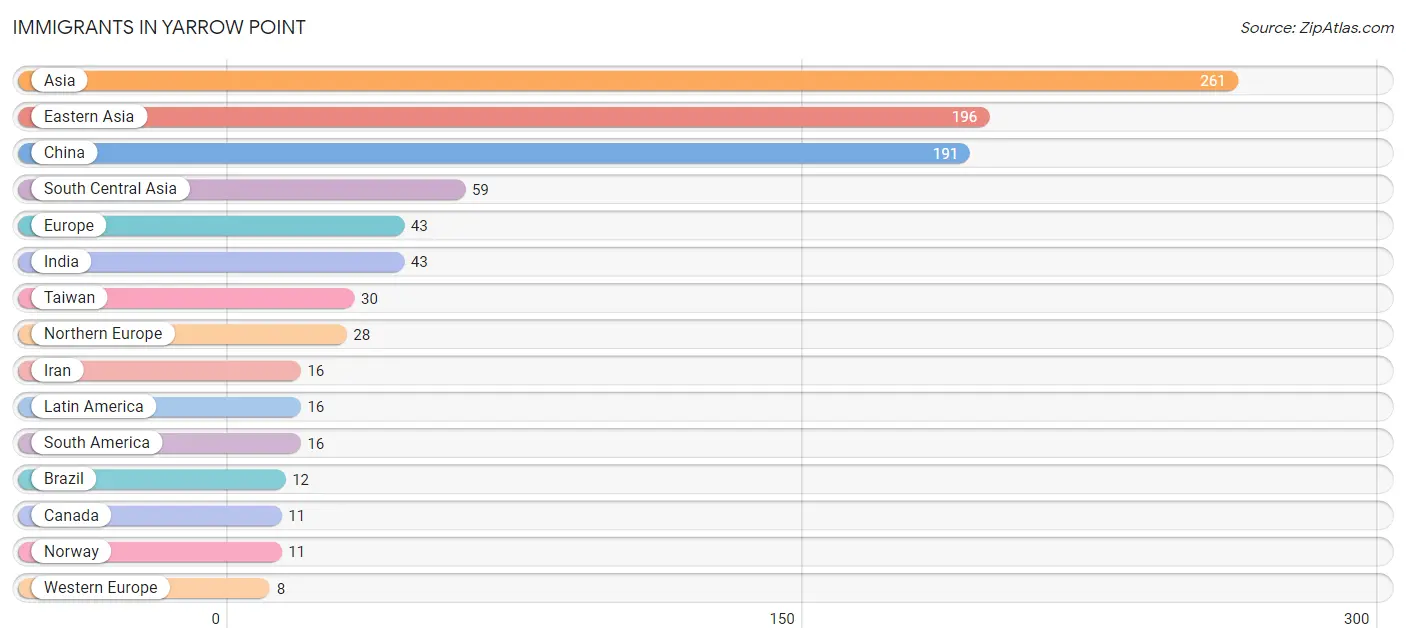
| Immigration Origin | # Population | % Population |
| Africa | 6 | 0.5% |
| Asia | 261 | 20.4% |
| Australia | 4 | 0.3% |
| Brazil | 12 | 0.9% |
| Canada | 11 | 0.9% |
| Chile | 2 | 0.2% |
| China | 191 | 14.9% |
| Eastern Asia | 196 | 15.3% |
| Eastern Europe | 3 | 0.2% |
| Egypt | 2 | 0.2% |
| England | 6 | 0.5% |
| Europe | 43 | 3.4% |
| Germany | 2 | 0.2% |
| Ghana | 4 | 0.3% |
| Greece | 2 | 0.2% |
| Hong Kong | 5 | 0.4% |
| India | 43 | 3.4% |
| Iran | 16 | 1.3% |
| Ireland | 4 | 0.3% |
| Japan | 2 | 0.2% |
| Korea | 3 | 0.2% |
| Latin America | 16 | 1.3% |
| Netherlands | 6 | 0.5% |
| Northern Africa | 2 | 0.2% |
| Northern Europe | 28 | 2.2% |
| Norway | 11 | 0.9% |
| Oceania | 4 | 0.3% |
| Peru | 2 | 0.2% |
| Philippines | 2 | 0.2% |
| Poland | 1 | 0.1% |
| South America | 16 | 1.3% |
| South Central Asia | 59 | 4.6% |
| South Eastern Asia | 2 | 0.2% |
| Southern Europe | 4 | 0.3% |
| Spain | 2 | 0.2% |
| Taiwan | 30 | 2.3% |
| Turkey | 2 | 0.2% |
| Ukraine | 2 | 0.2% |
| Western Africa | 4 | 0.3% |
| Western Asia | 4 | 0.3% |
| Western Europe | 8 | 0.6% | View All 41 Rows |
Sex and Age in Yarrow Point
Sex and Age in Yarrow Point
The most populous age groups in Yarrow Point are 55 to 59 Years (88 | 13.7%) for men and 50 to 54 Years (87 | 13.6%) for women.
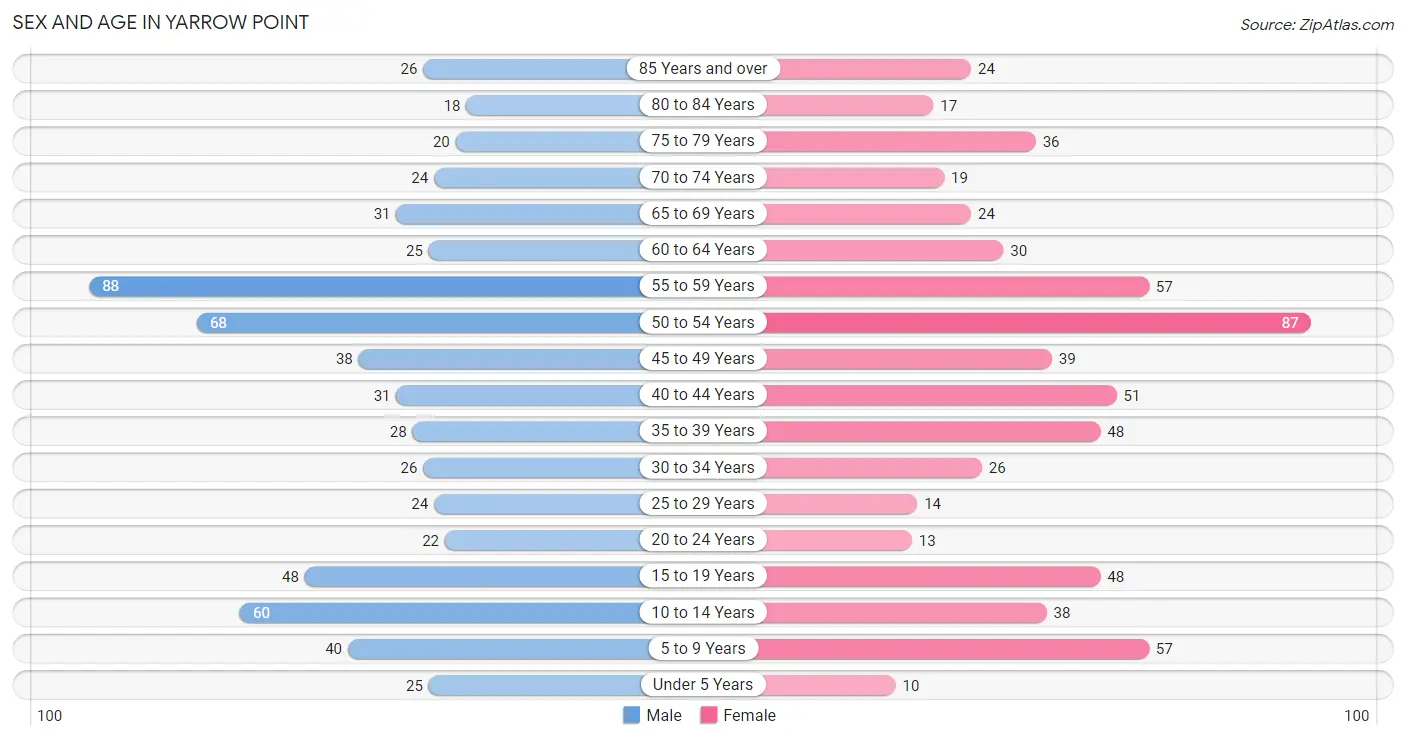
| Age Bracket | Male | Female |
| Under 5 Years | 25 (3.9%) | 10 (1.6%) |
| 5 to 9 Years | 40 (6.2%) | 57 (8.9%) |
| 10 to 14 Years | 60 (9.3%) | 38 (6.0%) |
| 15 to 19 Years | 48 (7.5%) | 48 (7.5%) |
| 20 to 24 Years | 22 (3.4%) | 13 (2.0%) |
| 25 to 29 Years | 24 (3.7%) | 14 (2.2%) |
| 30 to 34 Years | 26 (4.1%) | 26 (4.1%) |
| 35 to 39 Years | 28 (4.4%) | 48 (7.5%) |
| 40 to 44 Years | 31 (4.8%) | 51 (8.0%) |
| 45 to 49 Years | 38 (5.9%) | 39 (6.1%) |
| 50 to 54 Years | 68 (10.6%) | 87 (13.6%) |
| 55 to 59 Years | 88 (13.7%) | 57 (8.9%) |
| 60 to 64 Years | 25 (3.9%) | 30 (4.7%) |
| 65 to 69 Years | 31 (4.8%) | 24 (3.8%) |
| 70 to 74 Years | 24 (3.7%) | 19 (3.0%) |
| 75 to 79 Years | 20 (3.1%) | 36 (5.6%) |
| 80 to 84 Years | 18 (2.8%) | 17 (2.7%) |
| 85 Years and over | 26 (4.1%) | 24 (3.8%) |
| Total | 642 (100.0%) | 638 (100.0%) |
Families and Households in Yarrow Point
Median Family Size in Yarrow Point
The median family size in Yarrow Point is 3.08 persons per family, with married-couple families (351 | 93.6%) accounting for the largest median family size of 3.09 persons per family. On the other hand, single male/father families (11 | 2.9%) represent the smallest median family size with 2.82 persons per family.
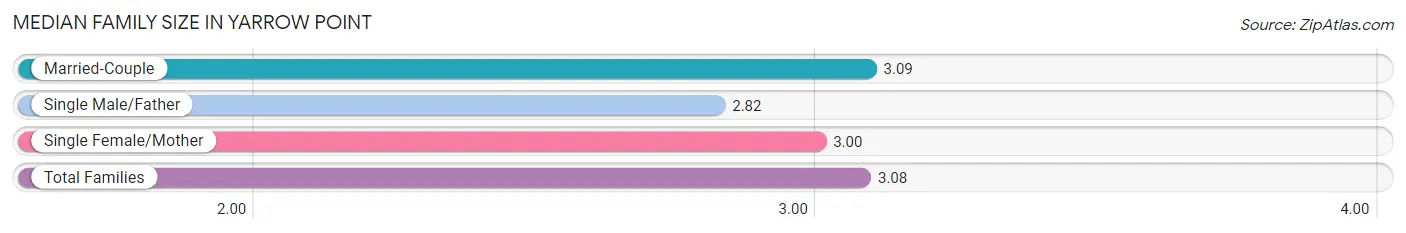
| Family Type | # Families | Family Size |
| Married-Couple | 351 (93.6%) | 3.09 |
| Single Male/Father | 11 (2.9%) | 2.82 |
| Single Female/Mother | 13 (3.5%) | 3.00 |
| Total Families | 375 (100.0%) | 3.08 |
Median Household Size in Yarrow Point
The median household size in Yarrow Point is 2.96 persons per household, with married-couple households (351 | 81.1%) accounting for the largest median household size of 3.22 persons per household. non-family households (58 | 13.4%) represent the smallest median household size with 1.40 persons per household.
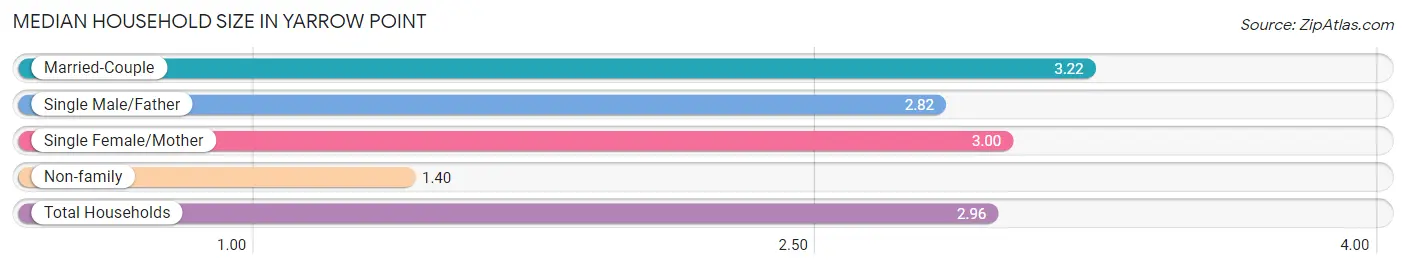
| Household Type | # Households | Household Size |
| Married-Couple | 351 (81.1%) | 3.22 |
| Single Male/Father | 11 (2.5%) | 2.82 |
| Single Female/Mother | 13 (3.0%) | 3.00 |
| Non-family | 58 (13.4%) | 1.40 |
| Total Households | 433 (100.0%) | 2.96 |
Household Size by Marriage Status in Yarrow Point
Out of a total of 433 households in Yarrow Point, 375 (86.6%) are family households, while 58 (13.4%) are nonfamily households. The most numerous type of family households are 2-person households, comprising 129, and the most common type of nonfamily households are 1-person households, comprising 42.
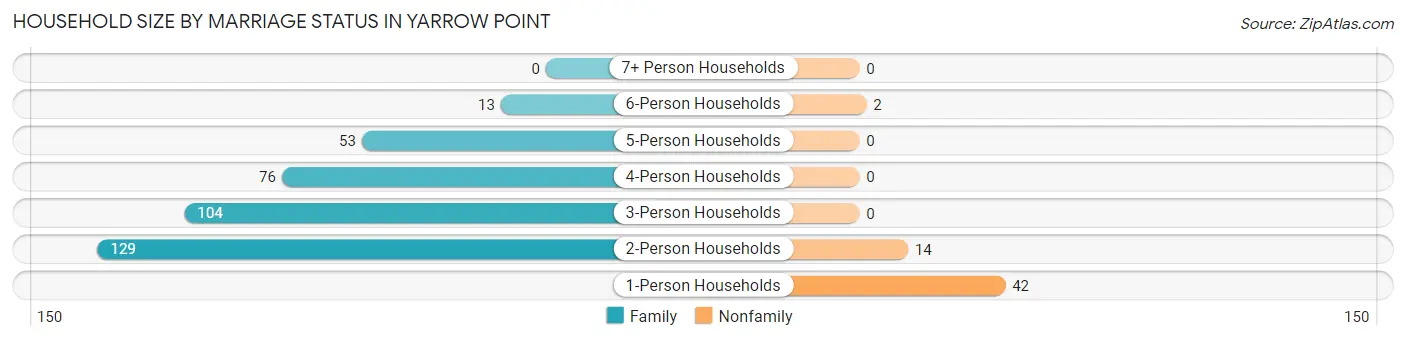
| Household Size | Family Households | Nonfamily Households |
| 1-Person Households | - | 42 (9.7%) |
| 2-Person Households | 129 (29.8%) | 14 (3.2%) |
| 3-Person Households | 104 (24.0%) | 0 (0.0%) |
| 4-Person Households | 76 (17.5%) | 0 (0.0%) |
| 5-Person Households | 53 (12.2%) | 0 (0.0%) |
| 6-Person Households | 13 (3.0%) | 2 (0.5%) |
| 7+ Person Households | 0 (0.0%) | 0 (0.0%) |
| Total | 375 (86.6%) | 58 (13.4%) |
Female Fertility in Yarrow Point
Fertility by Age in Yarrow Point
Average fertility rate in Yarrow Point is 8.0 births per 1,000 women. Women in the age bracket of 20 to 34 years have the highest fertility rate with 38.0 births per 1,000 women. Women in the age bracket of 20 to 34 years acount for 100.0% of all women with births.
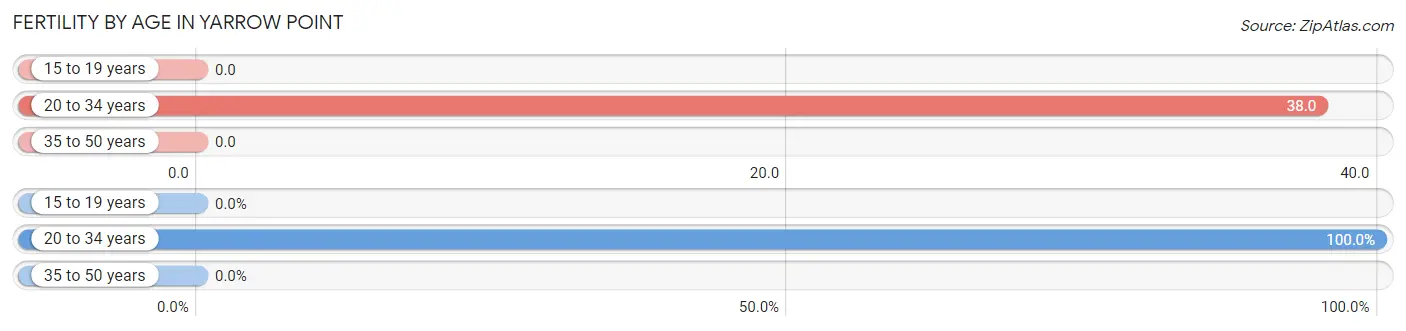
| Age Bracket | Women with Births | Births / 1,000 Women |
| 15 to 19 years | 0 (0.0%) | 0.0 |
| 20 to 34 years | 2 (100.0%) | 38.0 |
| 35 to 50 years | 0 (0.0%) | 0.0 |
| Total | 2 (100.0%) | 8.0 |
Fertility by Age by Marriage Status in Yarrow Point
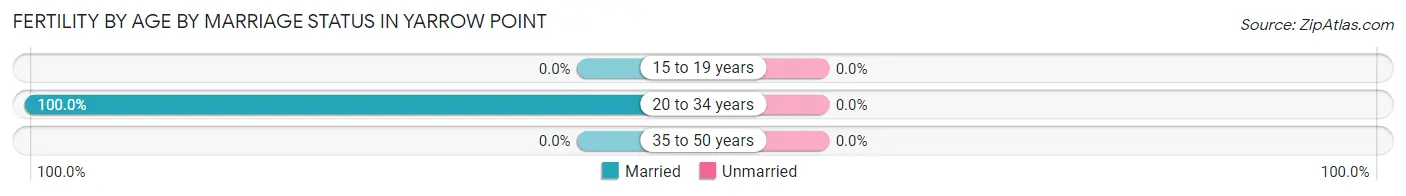
| Age Bracket | Married | Unmarried |
| 15 to 19 years | 0 (0.0%) | 0 (0.0%) |
| 20 to 34 years | 2 (100.0%) | 0 (0.0%) |
| 35 to 50 years | 0 (0.0%) | 0 (0.0%) |
| Total | 2 (100.0%) | 0 (0.0%) |
Fertility by Education in Yarrow Point
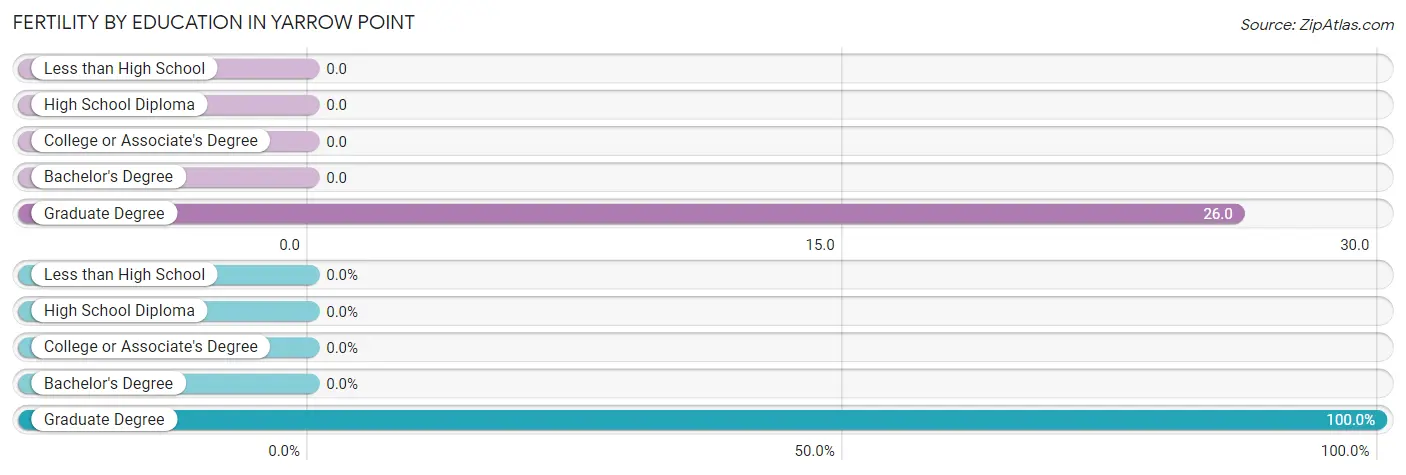
| Educational Attainment | Women with Births | Births / 1,000 Women |
| Less than High School | 0 (0.0%) | 0.0 |
| High School Diploma | 0 (0.0%) | 0.0 |
| College or Associate's Degree | 0 (0.0%) | 0.0 |
| Bachelor's Degree | 0 (0.0%) | 0.0 |
| Graduate Degree | 2 (100.0%) | 26.0 |
| Total | 2 (100.0%) | 8.0 |
Fertility by Education by Marriage Status in Yarrow Point
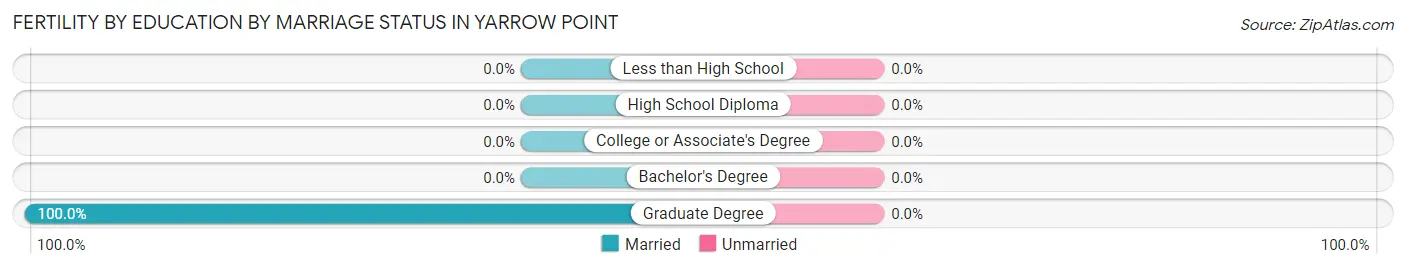
| Educational Attainment | Married | Unmarried |
| Less than High School | 0 (0.0%) | 0 (0.0%) |
| High School Diploma | 0 (0.0%) | 0 (0.0%) |
| College or Associate's Degree | 0 (0.0%) | 0 (0.0%) |
| Bachelor's Degree | 0 (0.0%) | 0 (0.0%) |
| Graduate Degree | 2 (100.0%) | 0 (0.0%) |
| Total | 2 (100.0%) | 0 (0.0%) |
Employment Characteristics in Yarrow Point
Employment by Class of Employer in Yarrow Point
Among the 601 employed individuals in Yarrow Point, private company employees (396 | 65.9%), self-employed (incorporated) (87 | 14.5%), and self-employed (not incorporated) (38 | 6.3%) make up the most common classes of employment.
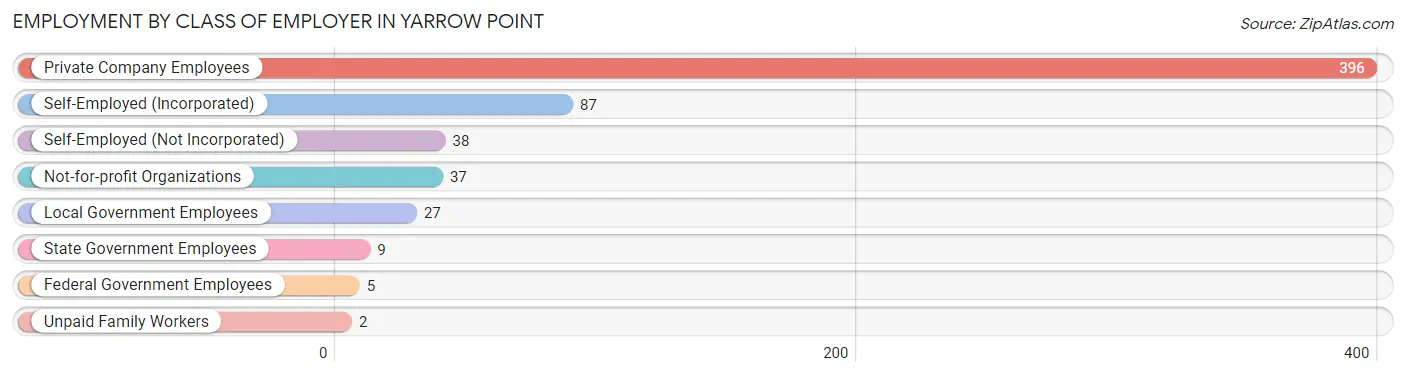
| Employer Class | # Employees | % Employees |
| Private Company Employees | 396 | 65.9% |
| Self-Employed (Incorporated) | 87 | 14.5% |
| Self-Employed (Not Incorporated) | 38 | 6.3% |
| Not-for-profit Organizations | 37 | 6.2% |
| Local Government Employees | 27 | 4.5% |
| State Government Employees | 9 | 1.5% |
| Federal Government Employees | 5 | 0.8% |
| Unpaid Family Workers | 2 | 0.3% |
| Total | 601 | 100.0% |
Employment Status by Age in Yarrow Point
According to the labor force statistics for Yarrow Point, out of the total population over 16 years of age (1,024), 60.7% or 622 individuals are in the labor force, with 2.1% or 13 of them unemployed. The age group with the highest labor force participation rate is 35 to 44 years, with 88.6% or 140 individuals in the labor force. Within the labor force, the 16 to 19 years age range has the highest percentage of unemployed individuals, with 27.3% or 6 of them being unemployed.
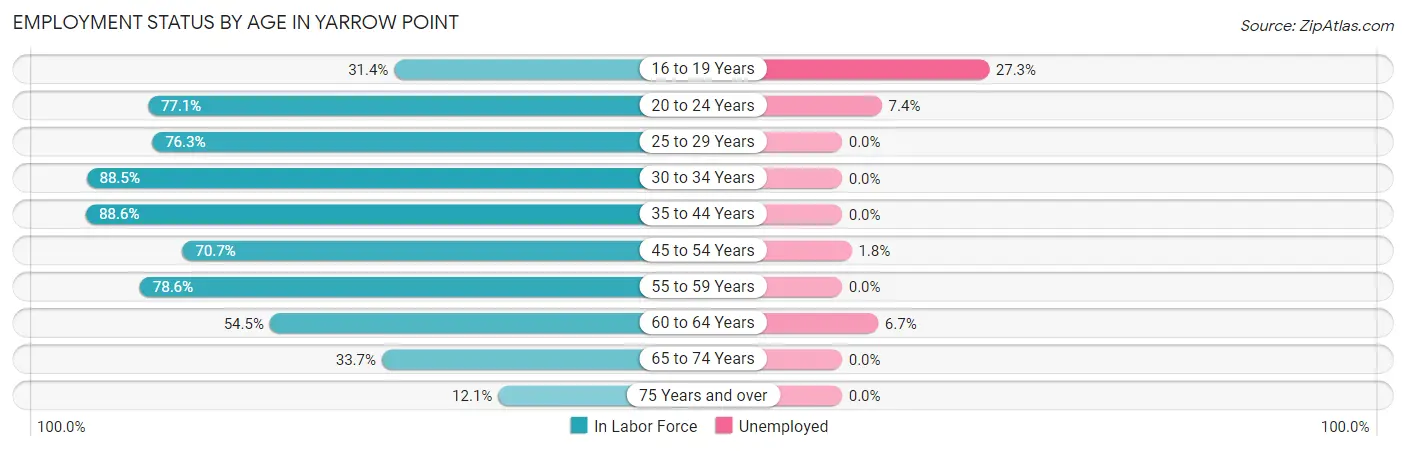
| Age Bracket | In Labor Force | Unemployed |
| 16 to 19 Years | 22 (31.4%) | 6 (27.3%) |
| 20 to 24 Years | 27 (77.1%) | 2 (7.4%) |
| 25 to 29 Years | 29 (76.3%) | 0 (0.0%) |
| 30 to 34 Years | 46 (88.5%) | 0 (0.0%) |
| 35 to 44 Years | 140 (88.6%) | 0 (0.0%) |
| 45 to 54 Years | 164 (70.7%) | 3 (1.8%) |
| 55 to 59 Years | 114 (78.6%) | 0 (0.0%) |
| 60 to 64 Years | 30 (54.5%) | 2 (6.7%) |
| 65 to 74 Years | 33 (33.7%) | 0 (0.0%) |
| 75 Years and over | 17 (12.1%) | 0 (0.0%) |
| Total | 622 (60.7%) | 13 (2.1%) |
Employment Status by Educational Attainment in Yarrow Point
According to labor force statistics for Yarrow Point, 76.9% of individuals (523) out of the total population between 25 and 64 years of age (680) are in the labor force, with 1.0% or 5 of them being unemployed. The group with the highest labor force participation rate are those with the educational attainment of bachelor's degree or higher, with 82.6% or 495 individuals in the labor force. Within the labor force, individuals with bachelor's degree or higher education have the highest percentage of unemployment, with 1.0% or 5 of them being unemployed.
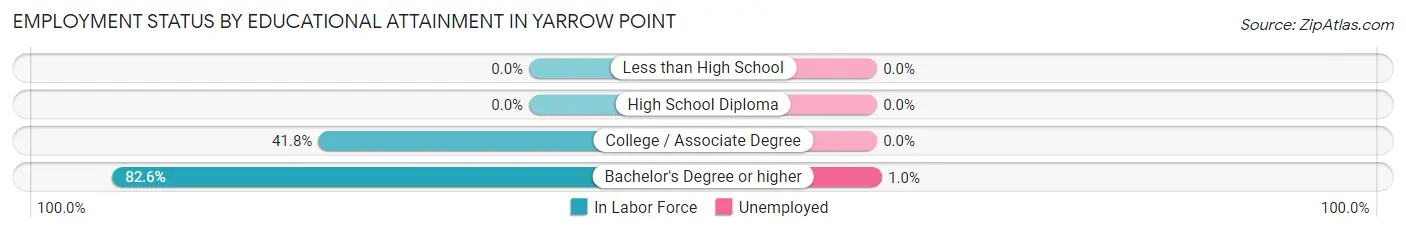
| Educational Attainment | In Labor Force | Unemployed |
| Less than High School | 0 (0.0%) | 0 (0.0%) |
| High School Diploma | 0 (0.0%) | 0 (0.0%) |
| College / Associate Degree | 28 (41.8%) | 0 (0.0%) |
| Bachelor's Degree or higher | 495 (82.6%) | 6 (1.0%) |
| Total | 523 (76.9%) | 7 (1.0%) |
Employment Occupations by Sex in Yarrow Point
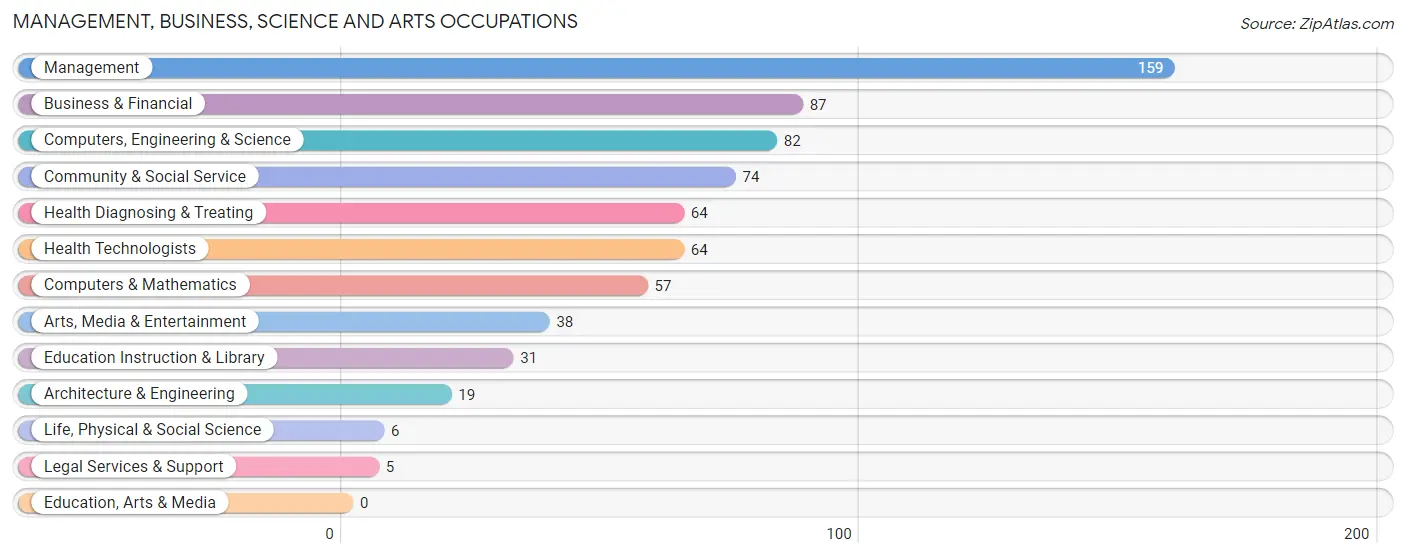
Management, Business, Science and Arts Occupations
The most common Management, Business, Science and Arts occupations in Yarrow Point are Management (159 | 26.1%), Business & Financial (87 | 14.3%), Computers, Engineering & Science (82 | 13.5%), Community & Social Service (74 | 12.1%), and Health Diagnosing & Treating (64 | 10.5%).
Management, Business, Science and Arts Occupations by Sex
Within the Management, Business, Science and Arts occupations in Yarrow Point, the most male-oriented occupations are Architecture & Engineering (100.0%), Life, Physical & Social Science (100.0%), and Management (72.3%), while the most female-oriented occupations are Education Instruction & Library (87.1%), Health Diagnosing & Treating (82.8%), and Health Technologists (82.8%).
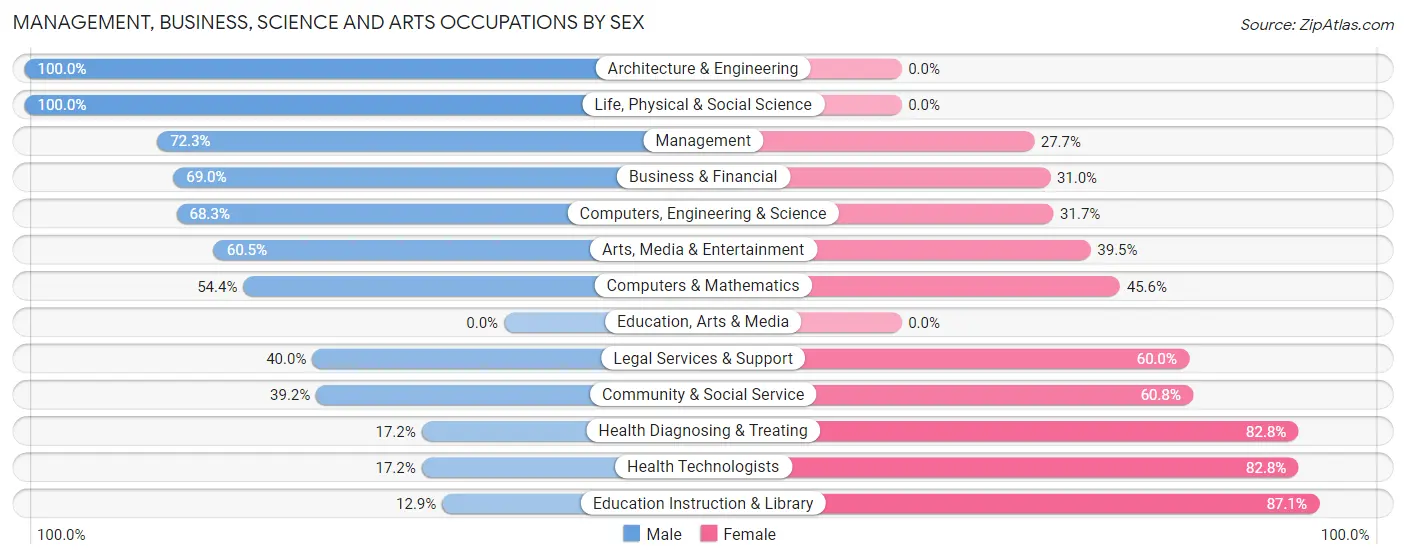
| Occupation | Male | Female |
| Management | 115 (72.3%) | 44 (27.7%) |
| Business & Financial | 60 (69.0%) | 27 (31.0%) |
| Computers, Engineering & Science | 56 (68.3%) | 26 (31.7%) |
| Computers & Mathematics | 31 (54.4%) | 26 (45.6%) |
| Architecture & Engineering | 19 (100.0%) | 0 (0.0%) |
| Life, Physical & Social Science | 6 (100.0%) | 0 (0.0%) |
| Community & Social Service | 29 (39.2%) | 45 (60.8%) |
| Education, Arts & Media | 0 (0.0%) | 0 (0.0%) |
| Legal Services & Support | 2 (40.0%) | 3 (60.0%) |
| Education Instruction & Library | 4 (12.9%) | 27 (87.1%) |
| Arts, Media & Entertainment | 23 (60.5%) | 15 (39.5%) |
| Health Diagnosing & Treating | 11 (17.2%) | 53 (82.8%) |
| Health Technologists | 11 (17.2%) | 53 (82.8%) |
| Total (Category) | 271 (58.2%) | 195 (41.8%) |
| Total (Overall) | 356 (58.5%) | 253 (41.5%) |
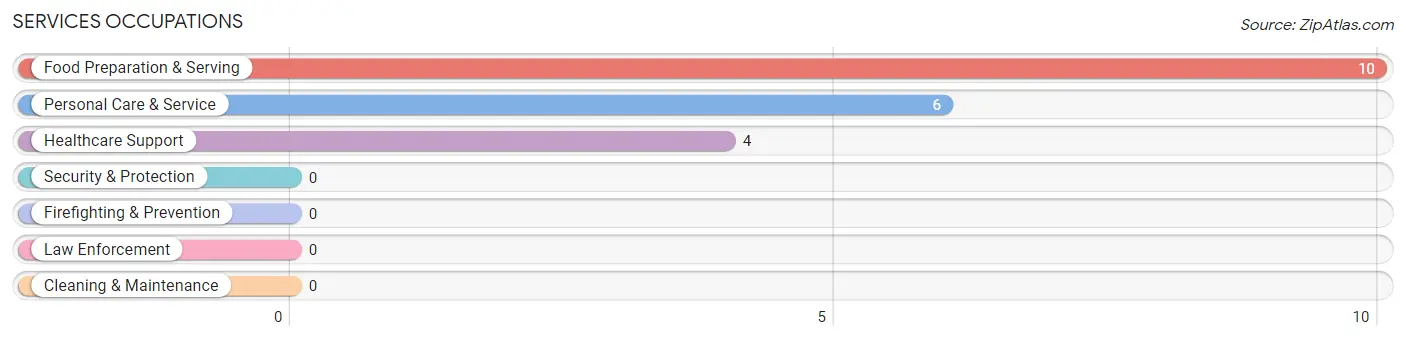
Services Occupations
The most common Services occupations in Yarrow Point are Food Preparation & Serving (10 | 1.6%), Personal Care & Service (6 | 1.0%), and Healthcare Support (4 | 0.7%).
Services Occupations by Sex
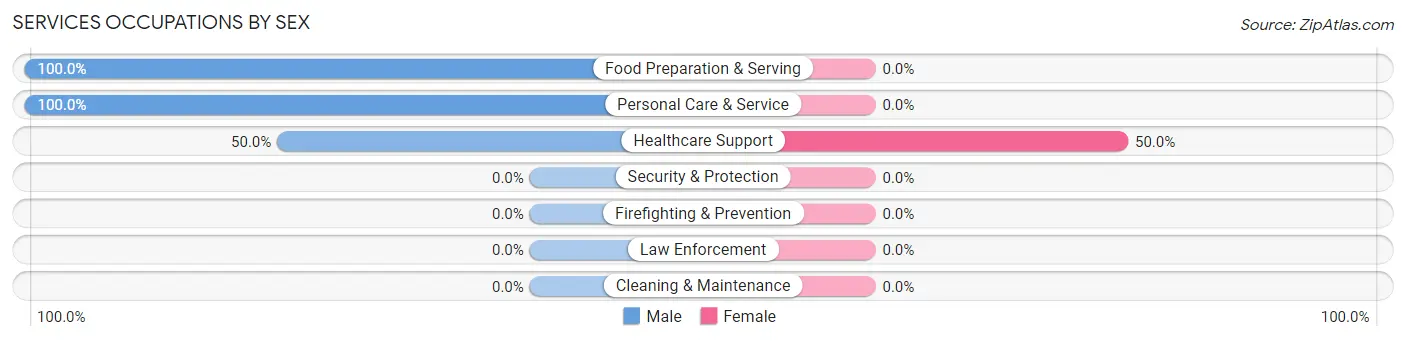
| Occupation | Male | Female |
| Healthcare Support | 2 (50.0%) | 2 (50.0%) |
| Security & Protection | 0 (0.0%) | 0 (0.0%) |
| Firefighting & Prevention | 0 (0.0%) | 0 (0.0%) |
| Law Enforcement | 0 (0.0%) | 0 (0.0%) |
| Food Preparation & Serving | 10 (100.0%) | 0 (0.0%) |
| Cleaning & Maintenance | 0 (0.0%) | 0 (0.0%) |
| Personal Care & Service | 6 (100.0%) | 0 (0.0%) |
| Total (Category) | 18 (90.0%) | 2 (10.0%) |
| Total (Overall) | 356 (58.5%) | 253 (41.5%) |
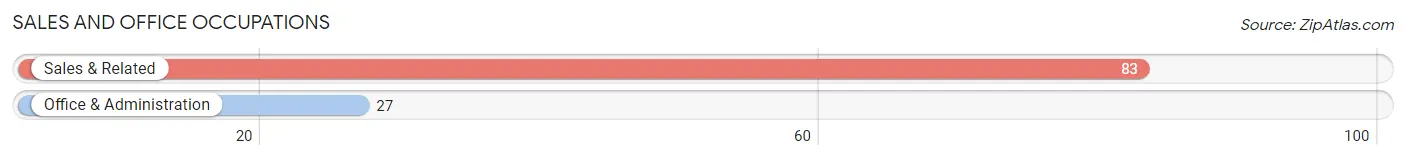
Sales and Office Occupations
The most common Sales and Office occupations in Yarrow Point are Sales & Related (83 | 13.6%), and Office & Administration (27 | 4.4%).
Sales and Office Occupations by Sex
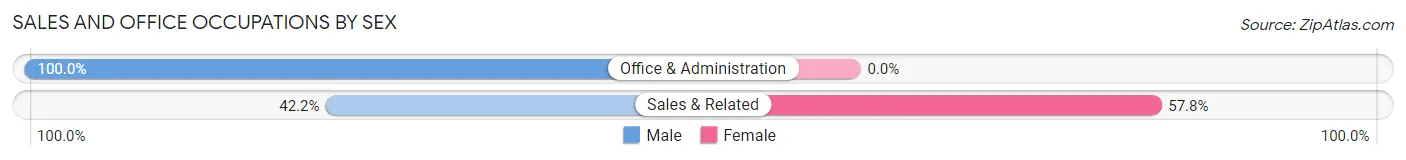
| Occupation | Male | Female |
| Sales & Related | 35 (42.2%) | 48 (57.8%) |
| Office & Administration | 27 (100.0%) | 0 (0.0%) |
| Total (Category) | 62 (56.4%) | 48 (43.6%) |
| Total (Overall) | 356 (58.5%) | 253 (41.5%) |
Natural Resources, Construction and Maintenance Occupations
Natural Resources, Construction and Maintenance Occupations by Sex
| Occupation | Male | Female |
| Farming, Fishing & Forestry | 0 (0.0%) | 0 (0.0%) |
| Construction & Extraction | 0 (0.0%) | 0 (0.0%) |
| Installation, Maintenance & Repair | 0 (0.0%) | 0 (0.0%) |
| Total (Category) | 0 (0.0%) | 0 (0.0%) |
| Total (Overall) | 356 (58.5%) | 253 (41.5%) |
Production, Transportation and Moving Occupations
The most common Production, Transportation and Moving occupations in Yarrow Point are Production (8 | 1.3%), and Transportation (5 | 0.8%).
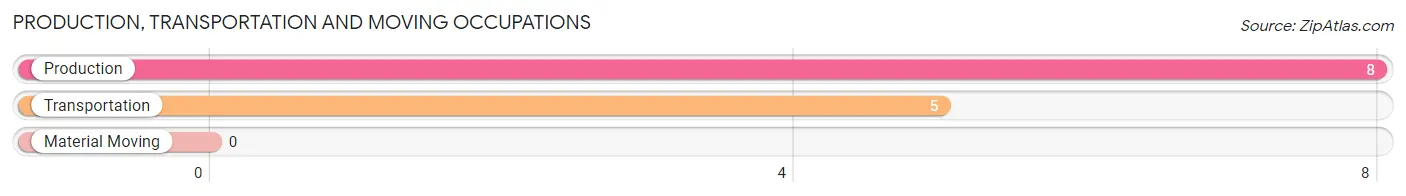
Production, Transportation and Moving Occupations by Sex
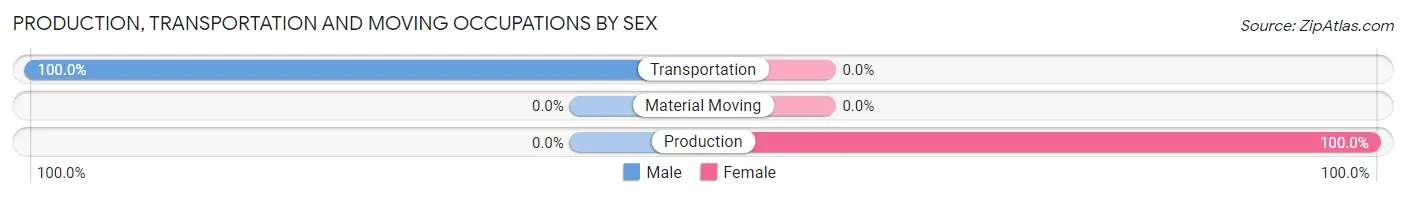
| Occupation | Male | Female |
| Production | 0 (0.0%) | 8 (100.0%) |
| Transportation | 5 (100.0%) | 0 (0.0%) |
| Material Moving | 0 (0.0%) | 0 (0.0%) |
| Total (Category) | 5 (38.5%) | 8 (61.5%) |
| Total (Overall) | 356 (58.5%) | 253 (41.5%) |
Employment Industries by Sex in Yarrow Point
Employment Industries in Yarrow Point
The major employment industries in Yarrow Point include Professional & Scientific (127 | 20.8%), Health Care & Social Assistance (82 | 13.5%), Finance & Insurance (76 | 12.5%), Retail Trade (67 | 11.0%), and Real Estate, Rental & Leasing (51 | 8.4%).
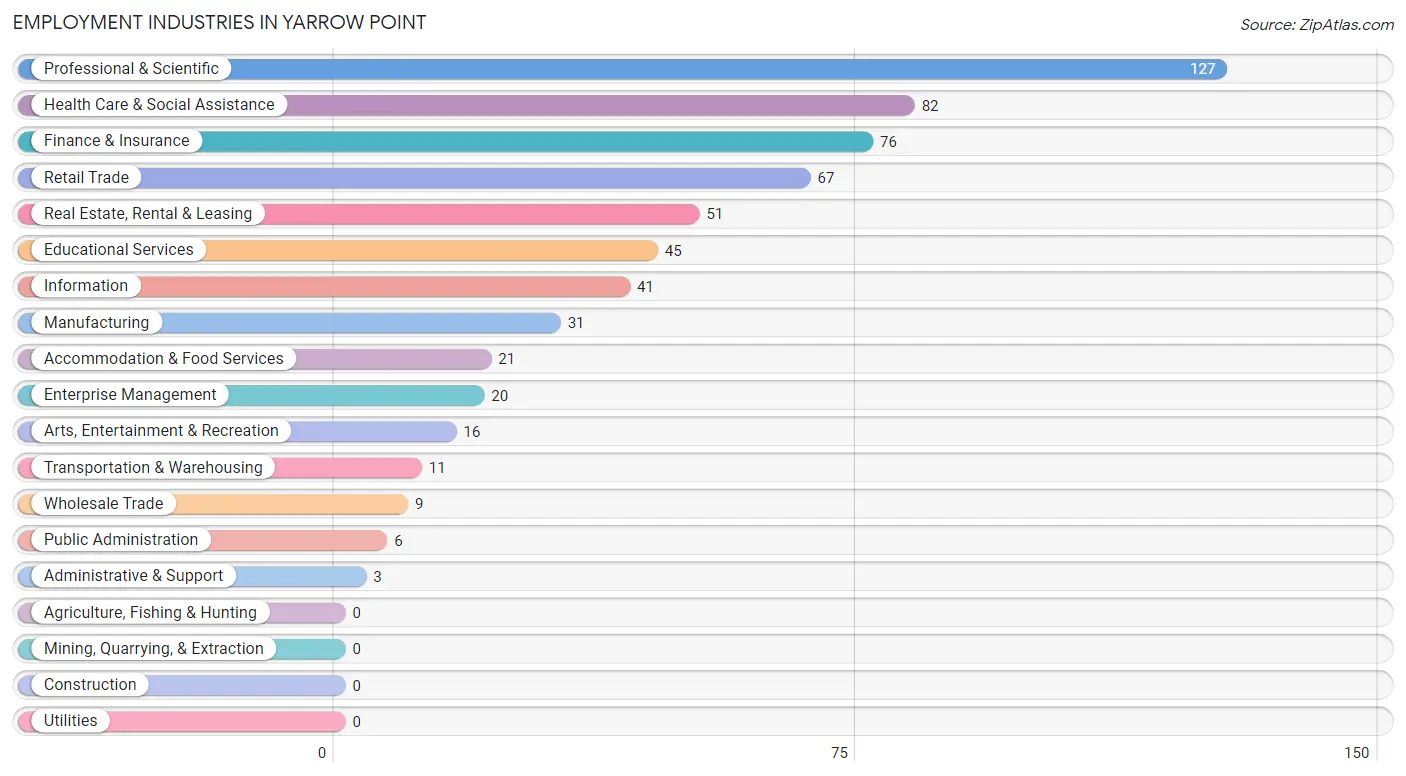
Employment Industries by Sex in Yarrow Point
The Yarrow Point industries that see more men than women are Enterprise Management (100.0%), Administrative & Support (100.0%), and Real Estate, Rental & Leasing (94.1%), whereas the industries that tend to have a higher number of women are Public Administration (100.0%), Educational Services (82.2%), and Health Care & Social Assistance (80.5%).
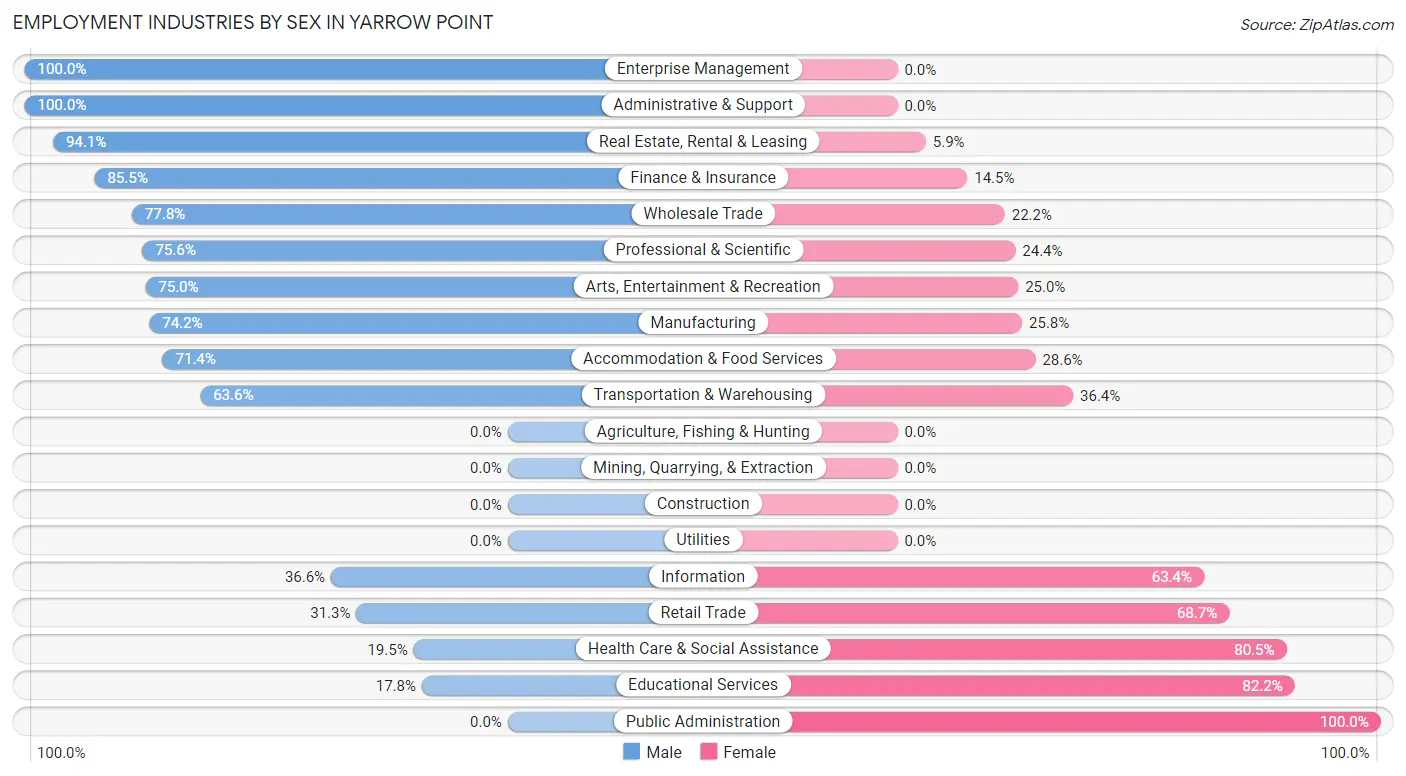
| Industry | Male | Female |
| Agriculture, Fishing & Hunting | 0 (0.0%) | 0 (0.0%) |
| Mining, Quarrying, & Extraction | 0 (0.0%) | 0 (0.0%) |
| Construction | 0 (0.0%) | 0 (0.0%) |
| Manufacturing | 23 (74.2%) | 8 (25.8%) |
| Wholesale Trade | 7 (77.8%) | 2 (22.2%) |
| Retail Trade | 21 (31.3%) | 46 (68.7%) |
| Transportation & Warehousing | 7 (63.6%) | 4 (36.4%) |
| Utilities | 0 (0.0%) | 0 (0.0%) |
| Information | 15 (36.6%) | 26 (63.4%) |
| Finance & Insurance | 65 (85.5%) | 11 (14.5%) |
| Real Estate, Rental & Leasing | 48 (94.1%) | 3 (5.9%) |
| Professional & Scientific | 96 (75.6%) | 31 (24.4%) |
| Enterprise Management | 20 (100.0%) | 0 (0.0%) |
| Administrative & Support | 3 (100.0%) | 0 (0.0%) |
| Educational Services | 8 (17.8%) | 37 (82.2%) |
| Health Care & Social Assistance | 16 (19.5%) | 66 (80.5%) |
| Arts, Entertainment & Recreation | 12 (75.0%) | 4 (25.0%) |
| Accommodation & Food Services | 15 (71.4%) | 6 (28.6%) |
| Public Administration | 0 (0.0%) | 6 (100.0%) |
| Total | 356 (58.5%) | 253 (41.5%) |
Education in Yarrow Point
School Enrollment in Yarrow Point
The most common levels of schooling among the 331 students in Yarrow Point are high school (104 | 31.4%), elementary school (81 | 24.5%), and middle school (71 | 21.4%).
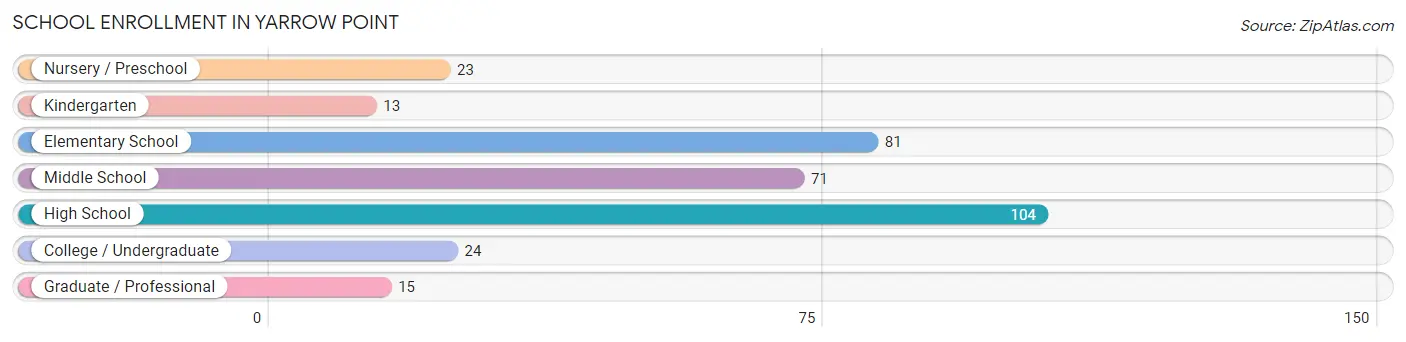
| School Level | # Students | % Students |
| Nursery / Preschool | 23 | 7.0% |
| Kindergarten | 13 | 3.9% |
| Elementary School | 81 | 24.5% |
| Middle School | 71 | 21.4% |
| High School | 104 | 31.4% |
| College / Undergraduate | 24 | 7.2% |
| Graduate / Professional | 15 | 4.5% |
| Total | 331 | 100.0% |
School Enrollment by Age by Funding Source in Yarrow Point
Out of a total of 331 students who are enrolled in schools in Yarrow Point, 134 (40.5%) attend a private institution, while the remaining 197 (59.5%) are enrolled in public schools. The age group of 3 to 4 year olds has the highest likelihood of being enrolled in private schools, with 15 (78.9% in the age bracket) enrolled. Conversely, the age group of 18 to 19 year olds has the lowest likelihood of being enrolled in a private school, with 4 (100.0% in the age bracket) attending a public institution.
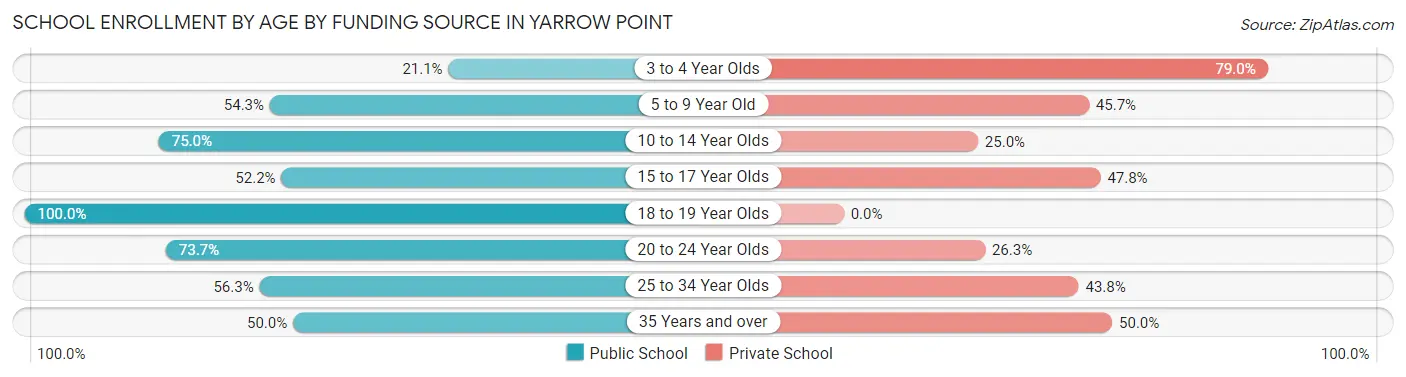
| Age Bracket | Public School | Private School |
| 3 to 4 Year Olds | 4 (21.0%) | 15 (78.9%) |
| 5 to 9 Year Old | 44 (54.3%) | 37 (45.7%) |
| 10 to 14 Year Olds | 72 (75.0%) | 24 (25.0%) |
| 15 to 17 Year Olds | 48 (52.2%) | 44 (47.8%) |
| 18 to 19 Year Olds | 4 (100.0%) | 0 (0.0%) |
| 20 to 24 Year Olds | 14 (73.7%) | 5 (26.3%) |
| 25 to 34 Year Olds | 9 (56.2%) | 7 (43.8%) |
| 35 Years and over | 2 (50.0%) | 2 (50.0%) |
| Total | 197 (59.5%) | 134 (40.5%) |
Educational Attainment by Field of Study in Yarrow Point
Business (154 | 18.0%), engineering (134 | 15.7%), computers & mathematics (118 | 13.8%), social sciences (85 | 9.9%), and bio, nature & agricultural (55 | 6.4%) are the most common fields of study among 856 individuals in Yarrow Point who have obtained a bachelor's degree or higher.
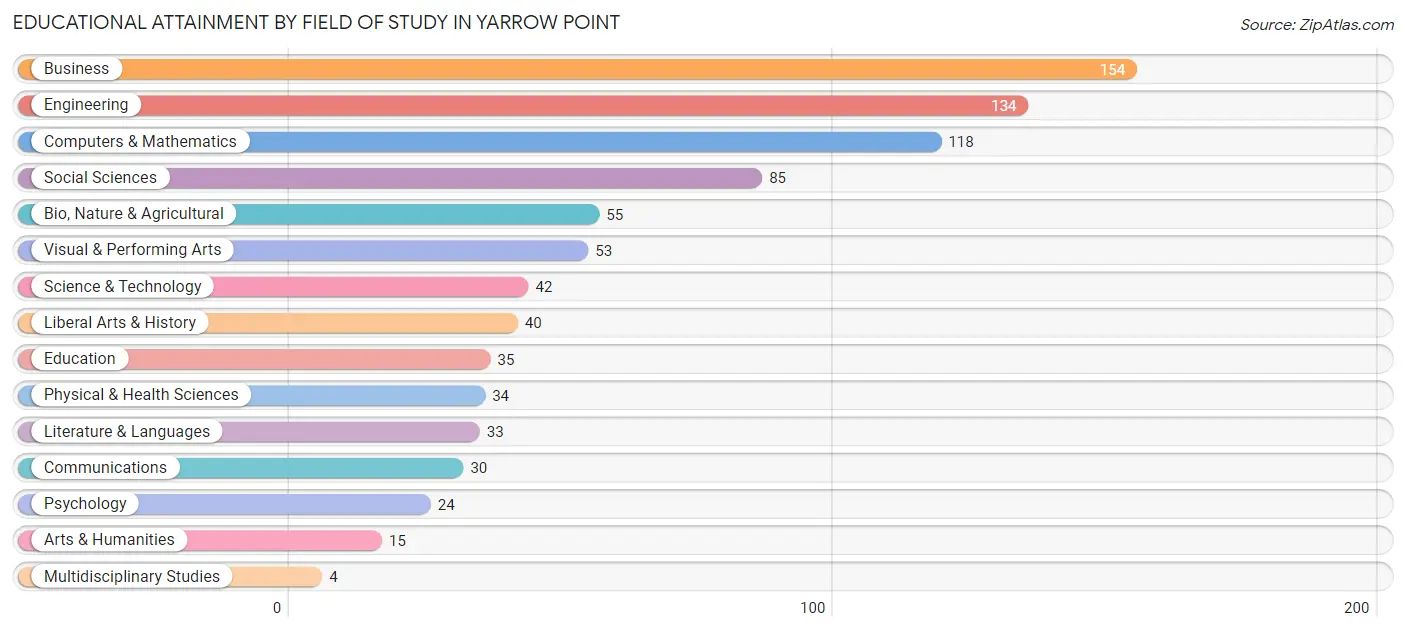
| Field of Study | # Graduates | % Graduates |
| Computers & Mathematics | 118 | 13.8% |
| Bio, Nature & Agricultural | 55 | 6.4% |
| Physical & Health Sciences | 34 | 4.0% |
| Psychology | 24 | 2.8% |
| Social Sciences | 85 | 9.9% |
| Engineering | 134 | 15.7% |
| Multidisciplinary Studies | 4 | 0.5% |
| Science & Technology | 42 | 4.9% |
| Business | 154 | 18.0% |
| Education | 35 | 4.1% |
| Literature & Languages | 33 | 3.9% |
| Liberal Arts & History | 40 | 4.7% |
| Visual & Performing Arts | 53 | 6.2% |
| Communications | 30 | 3.5% |
| Arts & Humanities | 15 | 1.8% |
| Total | 856 | 100.0% |
Transportation & Commute in Yarrow Point
Vehicle Availability by Sex in Yarrow Point
The most prevalent vehicle ownership categories in Yarrow Point are males with 2 vehicles (159, accounting for 44.9%) and females with 2 vehicles (94, making up 64.4%).
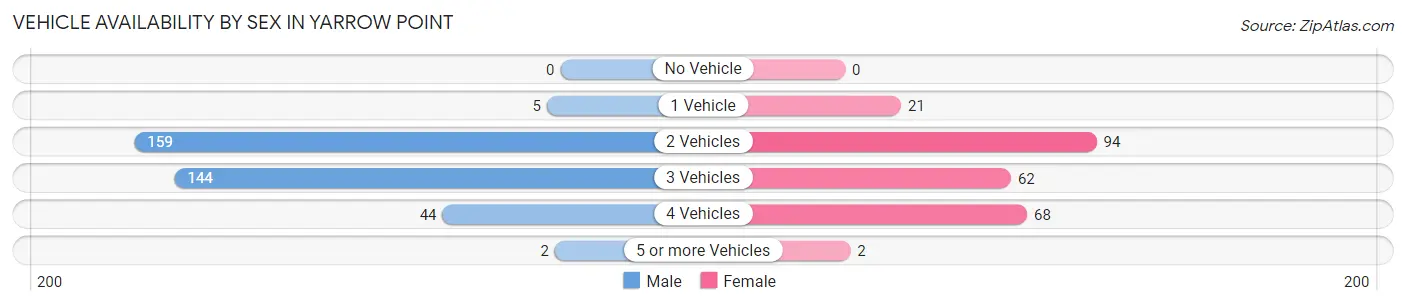
| Vehicles Available | Male | Female |
| No Vehicle | 0 (0.0%) | 0 (0.0%) |
| 1 Vehicle | 5 (1.4%) | 21 (8.5%) |
| 2 Vehicles | 159 (44.9%) | 94 (38.1%) |
| 3 Vehicles | 144 (40.7%) | 62 (25.1%) |
| 4 Vehicles | 44 (12.4%) | 68 (27.5%) |
| 5 or more Vehicles | 2 (0.6%) | 2 (0.8%) |
| Total | 354 (100.0%) | 247 (100.0%) |
Commute Time in Yarrow Point
The most frequently occuring commute durations in Yarrow Point are 15 to 19 minutes (146 commuters, 35.9%), 20 to 24 minutes (53 commuters, 13.0%), and 5 to 9 minutes (48 commuters, 11.8%).
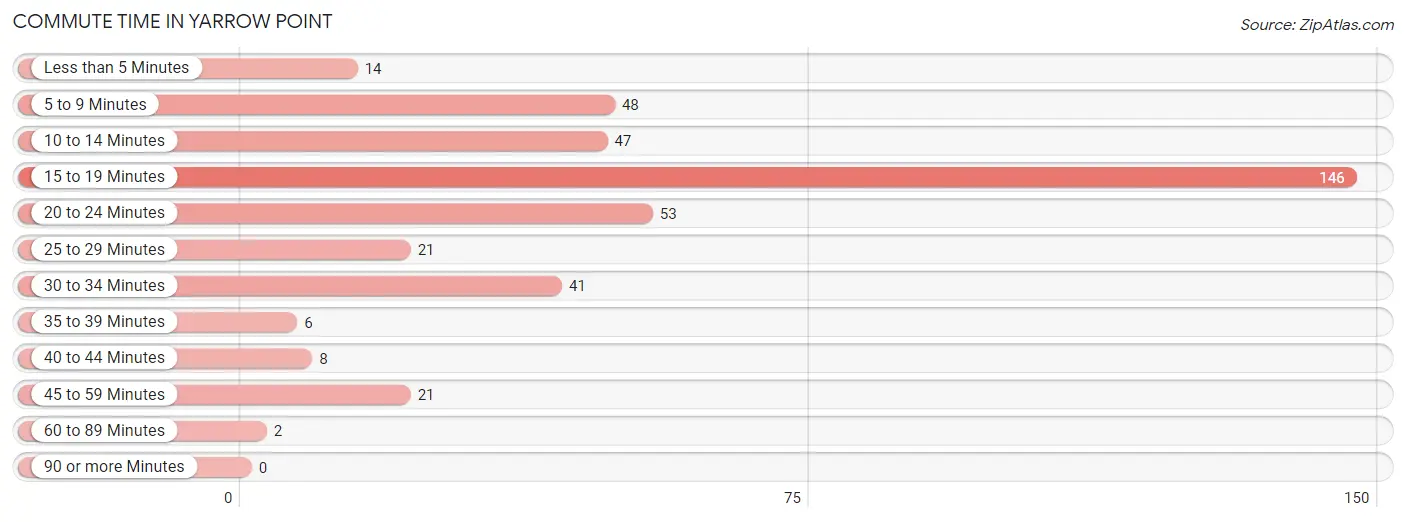
| Commute Time | # Commuters | % Commuters |
| Less than 5 Minutes | 14 | 3.4% |
| 5 to 9 Minutes | 48 | 11.8% |
| 10 to 14 Minutes | 47 | 11.6% |
| 15 to 19 Minutes | 146 | 35.9% |
| 20 to 24 Minutes | 53 | 13.0% |
| 25 to 29 Minutes | 21 | 5.2% |
| 30 to 34 Minutes | 41 | 10.1% |
| 35 to 39 Minutes | 6 | 1.5% |
| 40 to 44 Minutes | 8 | 2.0% |
| 45 to 59 Minutes | 21 | 5.2% |
| 60 to 89 Minutes | 2 | 0.5% |
| 90 or more Minutes | 0 | 0.0% |
Commute Time by Sex in Yarrow Point
The most common commute times in Yarrow Point are 15 to 19 minutes (96 commuters, 36.8%) for males and 15 to 19 minutes (50 commuters, 34.3%) for females.
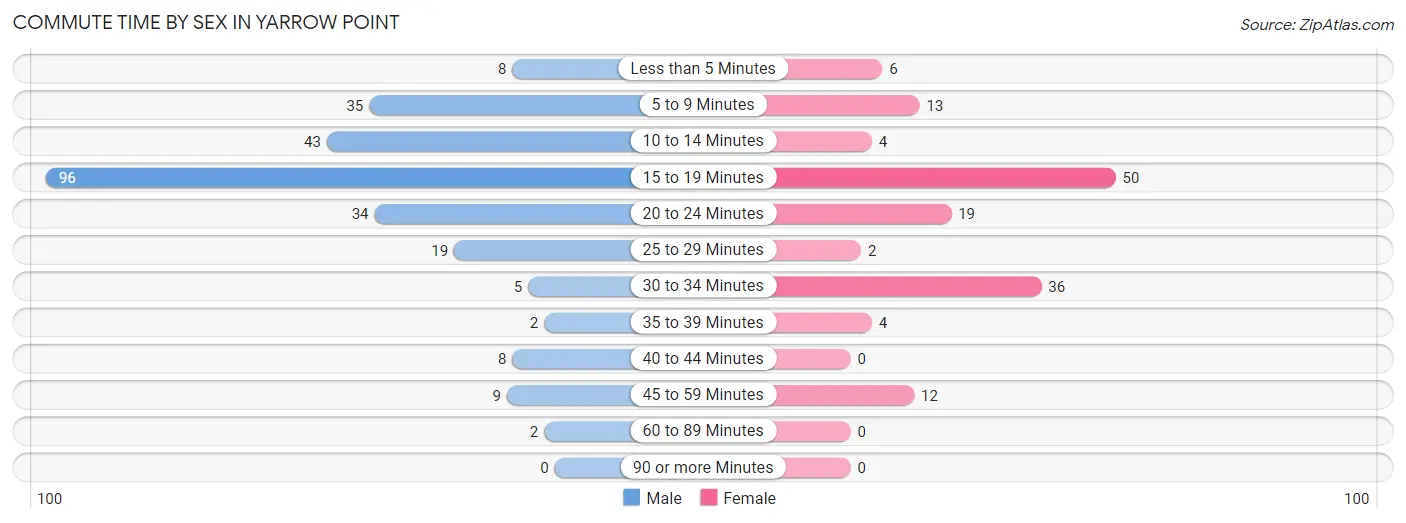
| Commute Time | Male | Female |
| Less than 5 Minutes | 8 (3.1%) | 6 (4.1%) |
| 5 to 9 Minutes | 35 (13.4%) | 13 (8.9%) |
| 10 to 14 Minutes | 43 (16.5%) | 4 (2.7%) |
| 15 to 19 Minutes | 96 (36.8%) | 50 (34.3%) |
| 20 to 24 Minutes | 34 (13.0%) | 19 (13.0%) |
| 25 to 29 Minutes | 19 (7.3%) | 2 (1.4%) |
| 30 to 34 Minutes | 5 (1.9%) | 36 (24.7%) |
| 35 to 39 Minutes | 2 (0.8%) | 4 (2.7%) |
| 40 to 44 Minutes | 8 (3.1%) | 0 (0.0%) |
| 45 to 59 Minutes | 9 (3.5%) | 12 (8.2%) |
| 60 to 89 Minutes | 2 (0.8%) | 0 (0.0%) |
| 90 or more Minutes | 0 (0.0%) | 0 (0.0%) |
Time of Departure to Work by Sex in Yarrow Point
The most frequent times of departure to work in Yarrow Point are 8:00 AM to 8:29 AM (66, 25.3%) for males and 9:00 AM to 9:59 AM (38, 26.0%) for females.
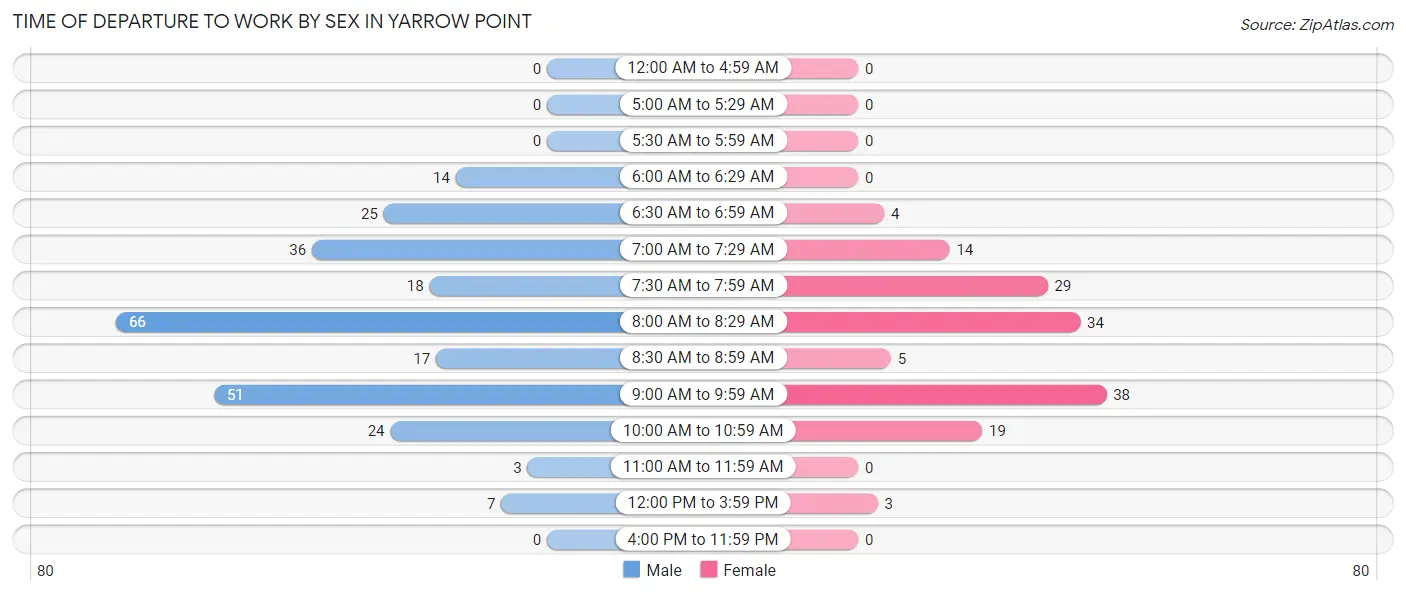
| Time of Departure | Male | Female |
| 12:00 AM to 4:59 AM | 0 (0.0%) | 0 (0.0%) |
| 5:00 AM to 5:29 AM | 0 (0.0%) | 0 (0.0%) |
| 5:30 AM to 5:59 AM | 0 (0.0%) | 0 (0.0%) |
| 6:00 AM to 6:29 AM | 14 (5.4%) | 0 (0.0%) |
| 6:30 AM to 6:59 AM | 25 (9.6%) | 4 (2.7%) |
| 7:00 AM to 7:29 AM | 36 (13.8%) | 14 (9.6%) |
| 7:30 AM to 7:59 AM | 18 (6.9%) | 29 (19.9%) |
| 8:00 AM to 8:29 AM | 66 (25.3%) | 34 (23.3%) |
| 8:30 AM to 8:59 AM | 17 (6.5%) | 5 (3.4%) |
| 9:00 AM to 9:59 AM | 51 (19.5%) | 38 (26.0%) |
| 10:00 AM to 10:59 AM | 24 (9.2%) | 19 (13.0%) |
| 11:00 AM to 11:59 AM | 3 (1.1%) | 0 (0.0%) |
| 12:00 PM to 3:59 PM | 7 (2.7%) | 3 (2.1%) |
| 4:00 PM to 11:59 PM | 0 (0.0%) | 0 (0.0%) |
| Total | 261 (100.0%) | 146 (100.0%) |
Housing Occupancy in Yarrow Point
Occupancy by Ownership in Yarrow Point
Of the total 433 dwellings in Yarrow Point, owner-occupied units account for 397 (91.7%), while renter-occupied units make up 36 (8.3%).
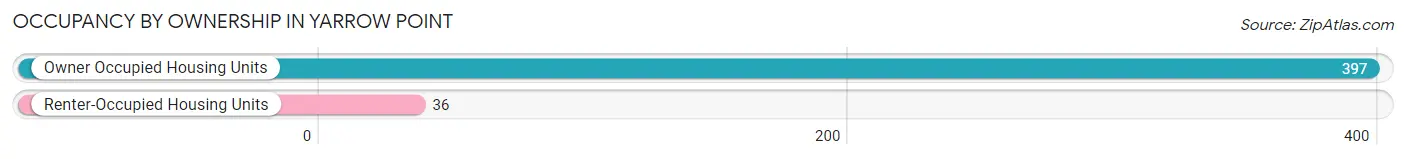
| Occupancy | # Housing Units | % Housing Units |
| Owner Occupied Housing Units | 397 | 91.7% |
| Renter-Occupied Housing Units | 36 | 8.3% |
| Total Occupied Housing Units | 433 | 100.0% |
Occupancy by Household Size in Yarrow Point
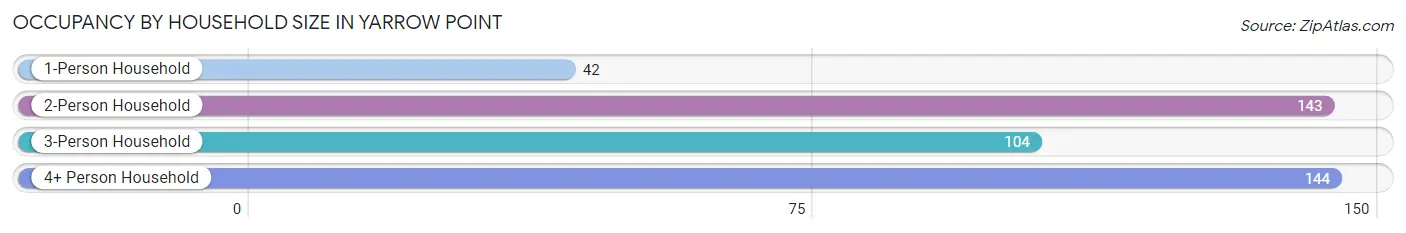
| Household Size | # Housing Units | % Housing Units |
| 1-Person Household | 42 | 9.7% |
| 2-Person Household | 143 | 33.0% |
| 3-Person Household | 104 | 24.0% |
| 4+ Person Household | 144 | 33.3% |
| Total Housing Units | 433 | 100.0% |
Occupancy by Ownership by Household Size in Yarrow Point
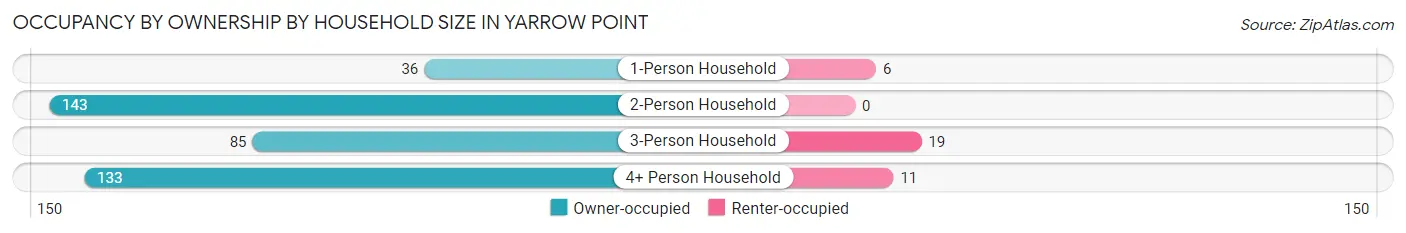
| Household Size | Owner-occupied | Renter-occupied |
| 1-Person Household | 36 (85.7%) | 6 (14.3%) |
| 2-Person Household | 143 (100.0%) | 0 (0.0%) |
| 3-Person Household | 85 (81.7%) | 19 (18.3%) |
| 4+ Person Household | 133 (92.4%) | 11 (7.6%) |
| Total Housing Units | 397 (91.7%) | 36 (8.3%) |
Occupancy by Educational Attainment in Yarrow Point
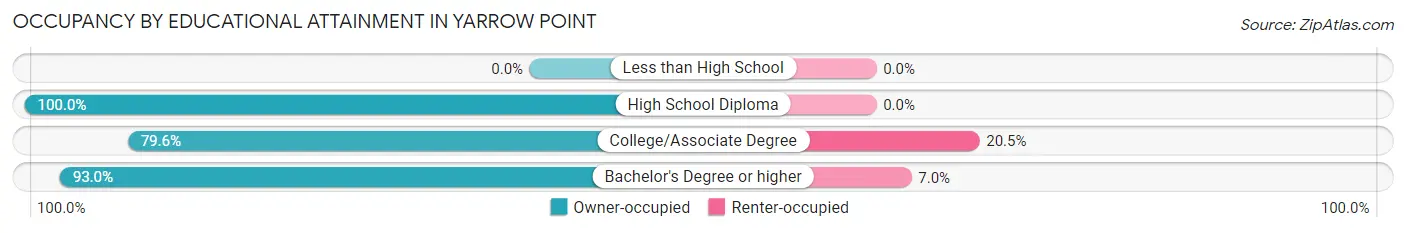
| Household Size | Owner-occupied | Renter-occupied |
| Less than High School | 0 (0.0%) | 0 (0.0%) |
| High School Diploma | 2 (100.0%) | 0 (0.0%) |
| College/Associate Degree | 35 (79.5%) | 9 (20.4%) |
| Bachelor's Degree or higher | 360 (93.0%) | 27 (7.0%) |
Occupancy by Age of Householder in Yarrow Point
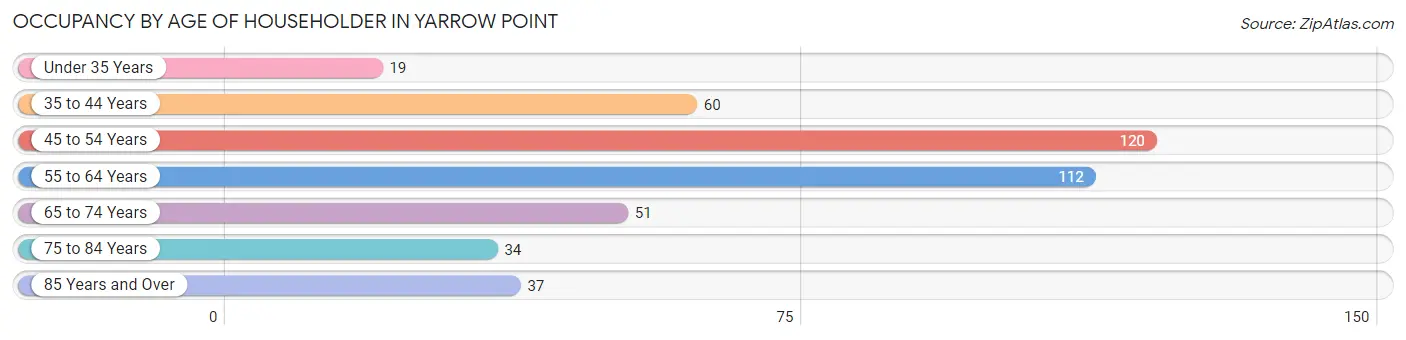
| Age Bracket | # Households | % Households |
| Under 35 Years | 19 | 4.4% |
| 35 to 44 Years | 60 | 13.9% |
| 45 to 54 Years | 120 | 27.7% |
| 55 to 64 Years | 112 | 25.9% |
| 65 to 74 Years | 51 | 11.8% |
| 75 to 84 Years | 34 | 7.9% |
| 85 Years and Over | 37 | 8.6% |
| Total | 433 | 100.0% |
Housing Finances in Yarrow Point
Median Income by Occupancy in Yarrow Point
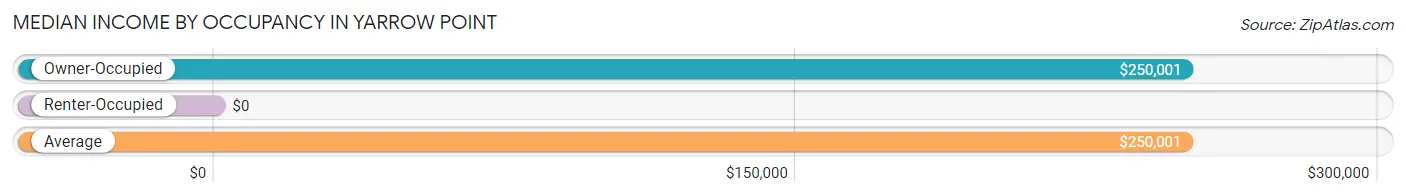
| Occupancy Type | # Households | Median Income |
| Owner-Occupied | 397 (91.7%) | $250,001 |
| Renter-Occupied | 36 (8.3%) | $0 |
| Average | 433 (100.0%) | $250,001 |
Occupancy by Householder Income Bracket in Yarrow Point
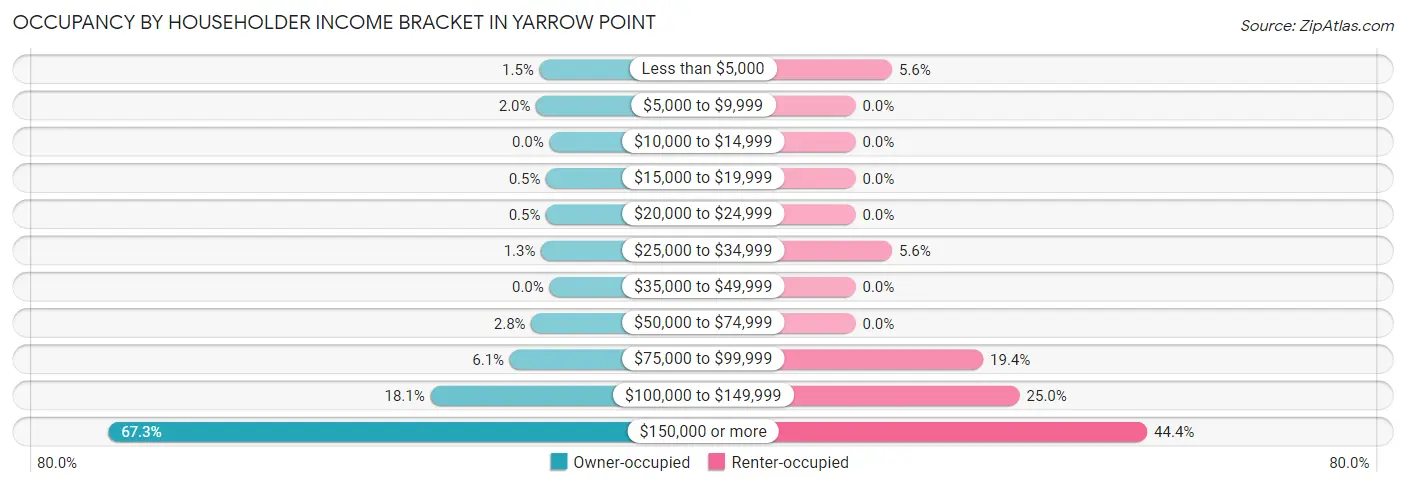
| Income Bracket | Owner-occupied | Renter-occupied |
| Less than $5,000 | 6 (1.5%) | 2 (5.6%) |
| $5,000 to $9,999 | 8 (2.0%) | 0 (0.0%) |
| $10,000 to $14,999 | 0 (0.0%) | 0 (0.0%) |
| $15,000 to $19,999 | 2 (0.5%) | 0 (0.0%) |
| $20,000 to $24,999 | 2 (0.5%) | 0 (0.0%) |
| $25,000 to $34,999 | 5 (1.3%) | 2 (5.6%) |
| $35,000 to $49,999 | 0 (0.0%) | 0 (0.0%) |
| $50,000 to $74,999 | 11 (2.8%) | 0 (0.0%) |
| $75,000 to $99,999 | 24 (6.0%) | 7 (19.4%) |
| $100,000 to $149,999 | 72 (18.1%) | 9 (25.0%) |
| $150,000 or more | 267 (67.2%) | 16 (44.4%) |
| Total | 397 (100.0%) | 36 (100.0%) |
Monthly Housing Cost Tiers in Yarrow Point
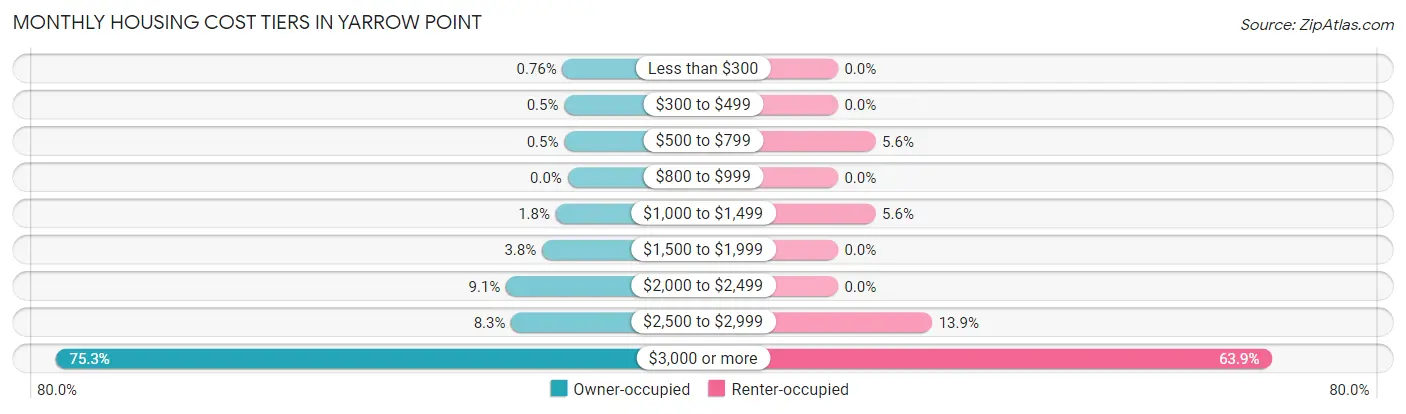
| Monthly Cost | Owner-occupied | Renter-occupied |
| Less than $300 | 3 (0.8%) | 0 (0.0%) |
| $300 to $499 | 2 (0.5%) | 0 (0.0%) |
| $500 to $799 | 2 (0.5%) | 2 (5.6%) |
| $800 to $999 | 0 (0.0%) | 0 (0.0%) |
| $1,000 to $1,499 | 7 (1.8%) | 2 (5.6%) |
| $1,500 to $1,999 | 15 (3.8%) | 0 (0.0%) |
| $2,000 to $2,499 | 36 (9.1%) | 0 (0.0%) |
| $2,500 to $2,999 | 33 (8.3%) | 5 (13.9%) |
| $3,000 or more | 299 (75.3%) | 23 (63.9%) |
| Total | 397 (100.0%) | 36 (100.0%) |
Physical Housing Characteristics in Yarrow Point
Housing Structures in Yarrow Point
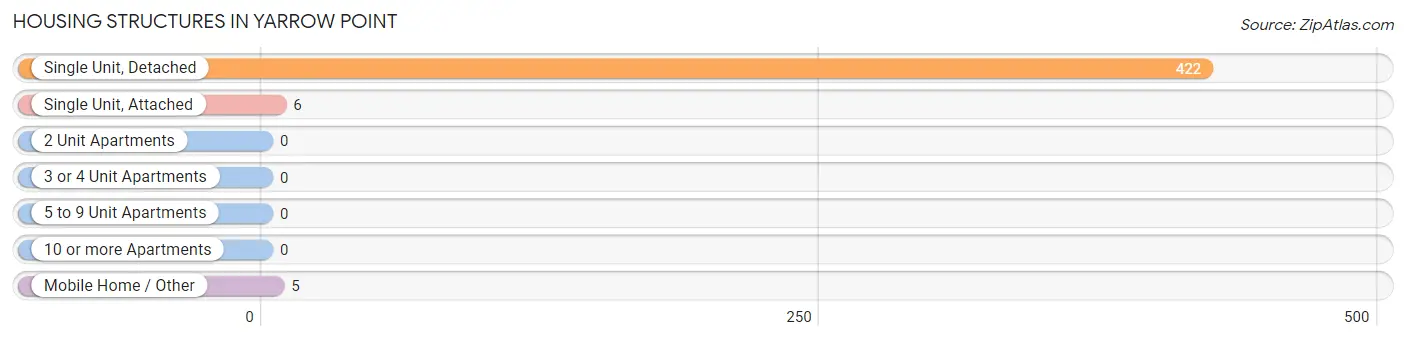
| Structure Type | # Housing Units | % Housing Units |
| Single Unit, Detached | 422 | 97.5% |
| Single Unit, Attached | 6 | 1.4% |
| 2 Unit Apartments | 0 | 0.0% |
| 3 or 4 Unit Apartments | 0 | 0.0% |
| 5 to 9 Unit Apartments | 0 | 0.0% |
| 10 or more Apartments | 0 | 0.0% |
| Mobile Home / Other | 5 | 1.1% |
| Total | 433 | 100.0% |
Housing Structures by Occupancy in Yarrow Point
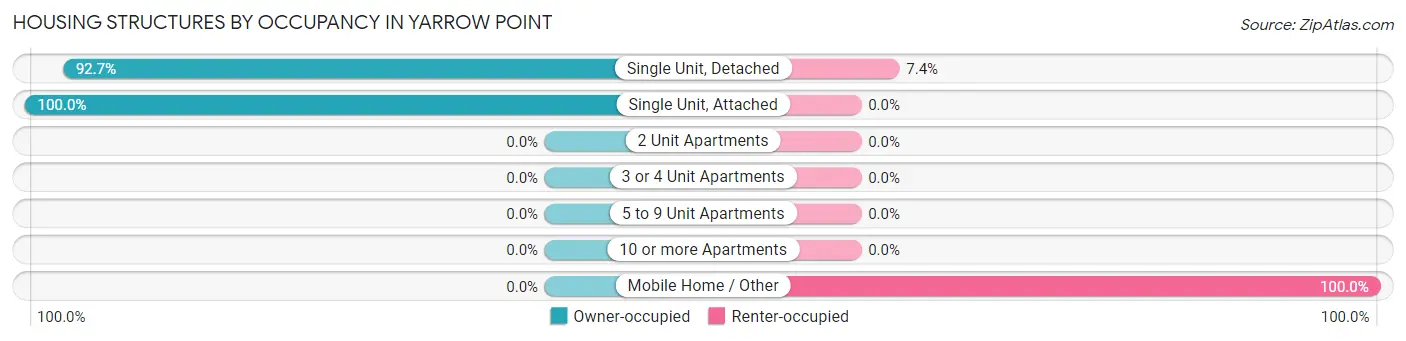
| Structure Type | Owner-occupied | Renter-occupied |
| Single Unit, Detached | 391 (92.6%) | 31 (7.3%) |
| Single Unit, Attached | 6 (100.0%) | 0 (0.0%) |
| 2 Unit Apartments | 0 (0.0%) | 0 (0.0%) |
| 3 or 4 Unit Apartments | 0 (0.0%) | 0 (0.0%) |
| 5 to 9 Unit Apartments | 0 (0.0%) | 0 (0.0%) |
| 10 or more Apartments | 0 (0.0%) | 0 (0.0%) |
| Mobile Home / Other | 0 (0.0%) | 5 (100.0%) |
| Total | 397 (91.7%) | 36 (8.3%) |
Housing Structures by Number of Rooms in Yarrow Point
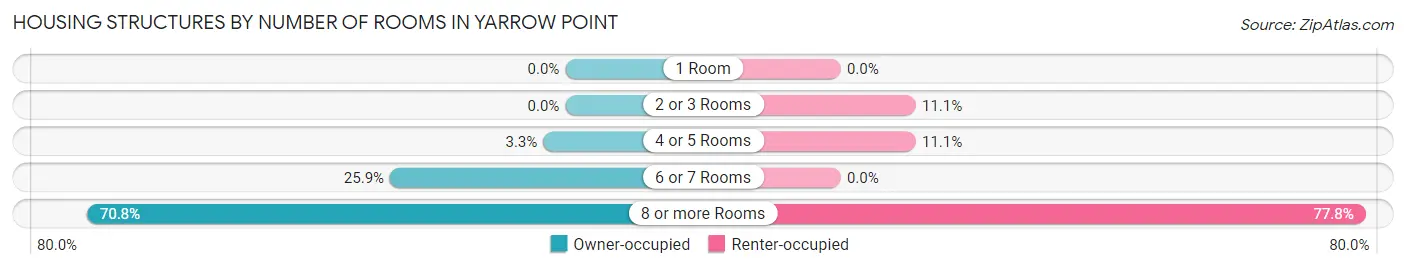
| Number of Rooms | Owner-occupied | Renter-occupied |
| 1 Room | 0 (0.0%) | 0 (0.0%) |
| 2 or 3 Rooms | 0 (0.0%) | 4 (11.1%) |
| 4 or 5 Rooms | 13 (3.3%) | 4 (11.1%) |
| 6 or 7 Rooms | 103 (25.9%) | 0 (0.0%) |
| 8 or more Rooms | 281 (70.8%) | 28 (77.8%) |
| Total | 397 (100.0%) | 36 (100.0%) |
Housing Structure by Heating Type in Yarrow Point
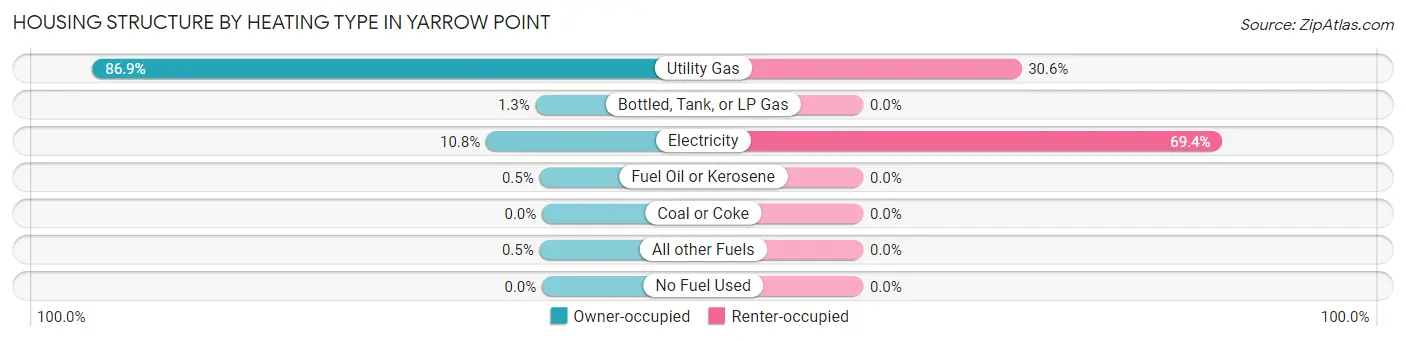
| Heating Type | Owner-occupied | Renter-occupied |
| Utility Gas | 345 (86.9%) | 11 (30.6%) |
| Bottled, Tank, or LP Gas | 5 (1.3%) | 0 (0.0%) |
| Electricity | 43 (10.8%) | 25 (69.4%) |
| Fuel Oil or Kerosene | 2 (0.5%) | 0 (0.0%) |
| Coal or Coke | 0 (0.0%) | 0 (0.0%) |
| All other Fuels | 2 (0.5%) | 0 (0.0%) |
| No Fuel Used | 0 (0.0%) | 0 (0.0%) |
| Total | 397 (100.0%) | 36 (100.0%) |
Household Vehicle Usage in Yarrow Point
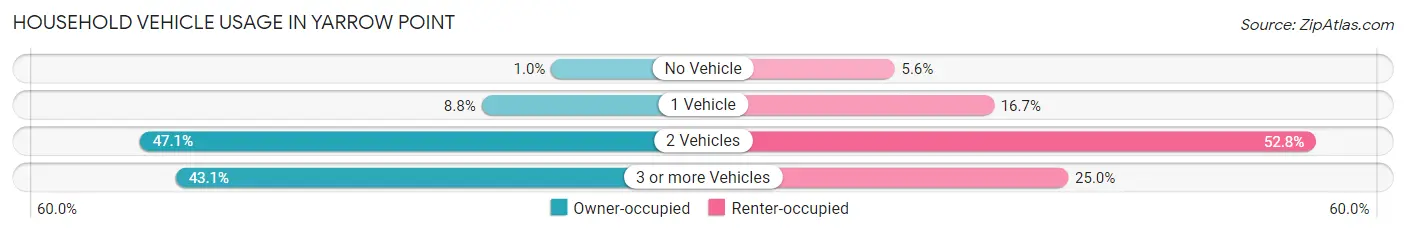
| Vehicles per Household | Owner-occupied | Renter-occupied |
| No Vehicle | 4 (1.0%) | 2 (5.6%) |
| 1 Vehicle | 35 (8.8%) | 6 (16.7%) |
| 2 Vehicles | 187 (47.1%) | 19 (52.8%) |
| 3 or more Vehicles | 171 (43.1%) | 9 (25.0%) |
| Total | 397 (100.0%) | 36 (100.0%) |
Real Estate & Mortgages in Yarrow Point
Real Estate and Mortgage Overview in Yarrow Point
| Characteristic | Without Mortgage | With Mortgage |
| Housing Units | 164 | 233 |
| Median Property Value | $2,000,001 | $2,000,001 |
| Median Household Income | $250,001 | $179 |
| Monthly Housing Costs | $1,501 | $225 |
| Real Estate Taxes | $10,001 | $0 |
Property Value by Mortgage Status in Yarrow Point
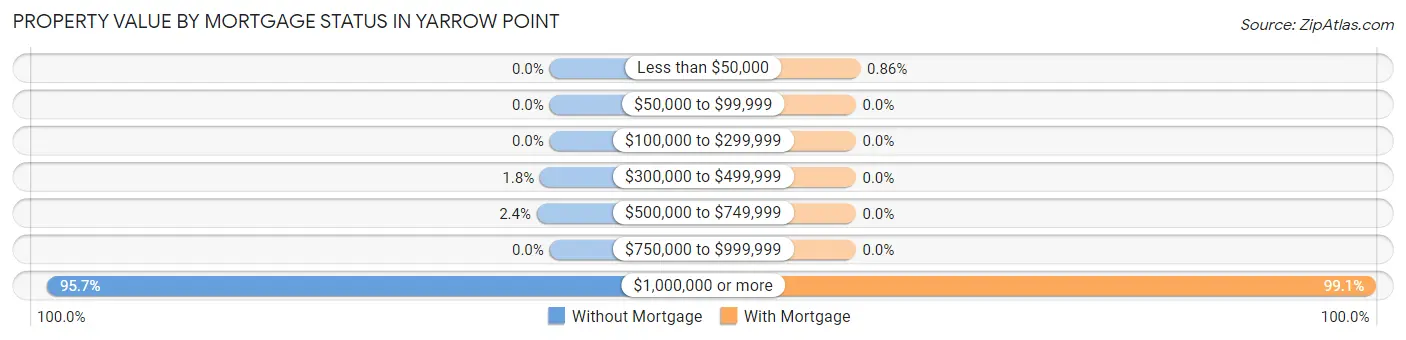
| Property Value | Without Mortgage | With Mortgage |
| Less than $50,000 | 0 (0.0%) | 2 (0.9%) |
| $50,000 to $99,999 | 0 (0.0%) | 0 (0.0%) |
| $100,000 to $299,999 | 0 (0.0%) | 0 (0.0%) |
| $300,000 to $499,999 | 3 (1.8%) | 0 (0.0%) |
| $500,000 to $749,999 | 4 (2.4%) | 0 (0.0%) |
| $750,000 to $999,999 | 0 (0.0%) | 0 (0.0%) |
| $1,000,000 or more | 157 (95.7%) | 231 (99.1%) |
| Total | 164 (100.0%) | 233 (100.0%) |
Household Income by Mortgage Status in Yarrow Point
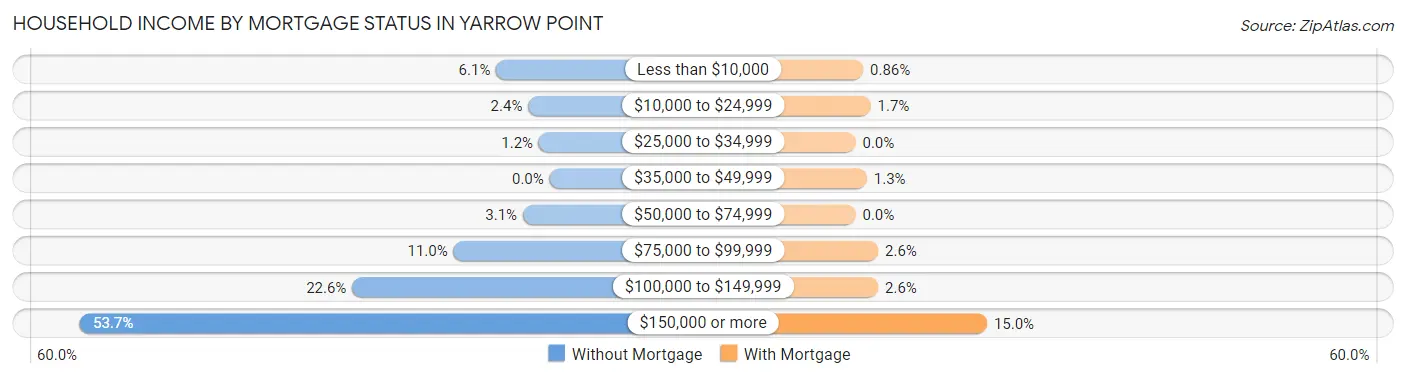
| Household Income | Without Mortgage | With Mortgage |
| Less than $10,000 | 10 (6.1%) | 2 (0.9%) |
| $10,000 to $24,999 | 4 (2.4%) | 4 (1.7%) |
| $25,000 to $34,999 | 2 (1.2%) | 0 (0.0%) |
| $35,000 to $49,999 | 0 (0.0%) | 3 (1.3%) |
| $50,000 to $74,999 | 5 (3.0%) | 0 (0.0%) |
| $75,000 to $99,999 | 18 (11.0%) | 6 (2.6%) |
| $100,000 to $149,999 | 37 (22.6%) | 6 (2.6%) |
| $150,000 or more | 88 (53.7%) | 35 (15.0%) |
| Total | 164 (100.0%) | 233 (100.0%) |
Property Value to Household Income Ratio in Yarrow Point
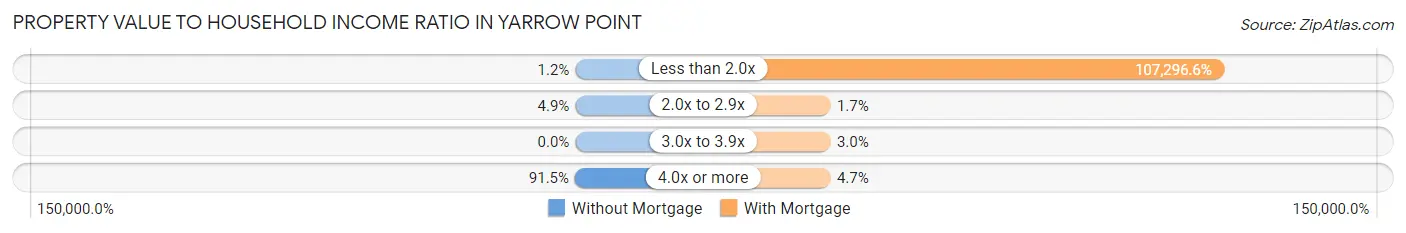
| Value-to-Income Ratio | Without Mortgage | With Mortgage |
| Less than 2.0x | 2 (1.2%) | 250,001 (107,296.6%) |
| 2.0x to 2.9x | 8 (4.9%) | 4 (1.7%) |
| 3.0x to 3.9x | 0 (0.0%) | 7 (3.0%) |
| 4.0x or more | 150 (91.5%) | 11 (4.7%) |
| Total | 164 (100.0%) | 233 (100.0%) |
Real Estate Taxes by Mortgage Status in Yarrow Point
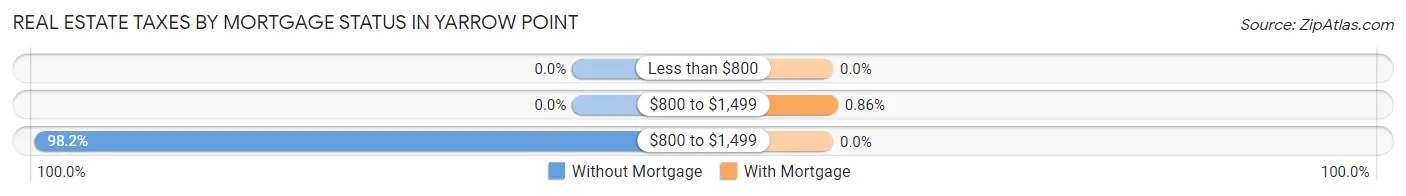
| Property Taxes | Without Mortgage | With Mortgage |
| Less than $800 | 0 (0.0%) | 0 (0.0%) |
| $800 to $1,499 | 0 (0.0%) | 2 (0.9%) |
| $800 to $1,499 | 161 (98.2%) | 0 (0.0%) |
| Total | 164 (100.0%) | 233 (100.0%) |
Health & Disability in Yarrow Point
Health Insurance Coverage by Age in Yarrow Point
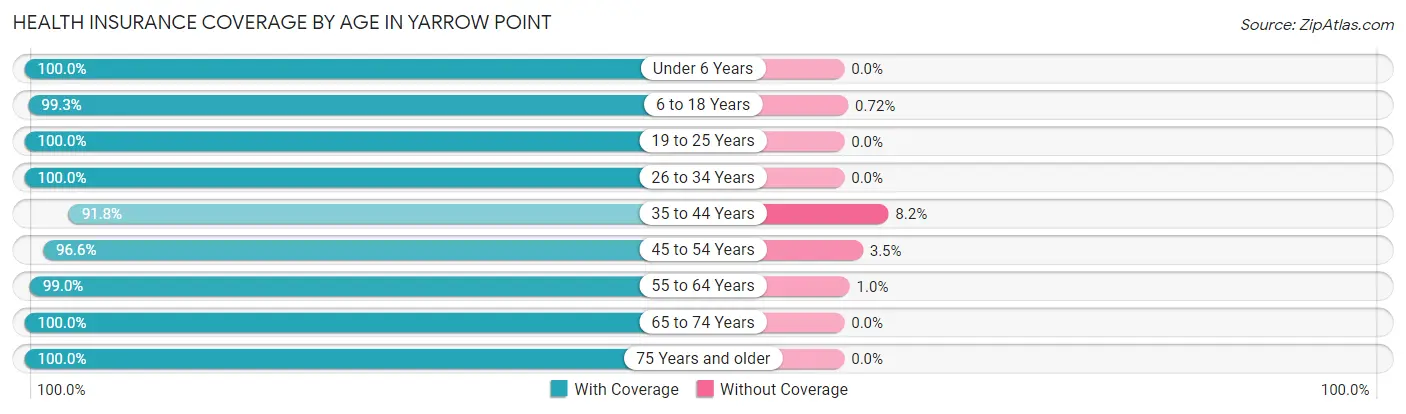
| Age Bracket | With Coverage | Without Coverage |
| Under 6 Years | 49 (100.0%) | 0 (0.0%) |
| 6 to 18 Years | 275 (99.3%) | 2 (0.7%) |
| 19 to 25 Years | 51 (100.0%) | 0 (0.0%) |
| 26 to 34 Years | 74 (100.0%) | 0 (0.0%) |
| 35 to 44 Years | 145 (91.8%) | 13 (8.2%) |
| 45 to 54 Years | 224 (96.6%) | 8 (3.5%) |
| 55 to 64 Years | 198 (99.0%) | 2 (1.0%) |
| 65 to 74 Years | 98 (100.0%) | 0 (0.0%) |
| 75 Years and older | 141 (100.0%) | 0 (0.0%) |
| Total | 1,255 (98.1%) | 25 (1.9%) |
Health Insurance Coverage by Citizenship Status in Yarrow Point
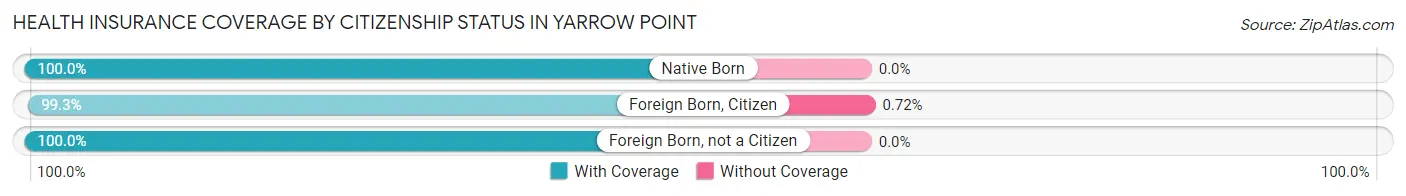
| Citizenship Status | With Coverage | Without Coverage |
| Native Born | 49 (100.0%) | 0 (0.0%) |
| Foreign Born, Citizen | 275 (99.3%) | 2 (0.7%) |
| Foreign Born, not a Citizen | 51 (100.0%) | 0 (0.0%) |
Health Insurance Coverage by Household Income in Yarrow Point
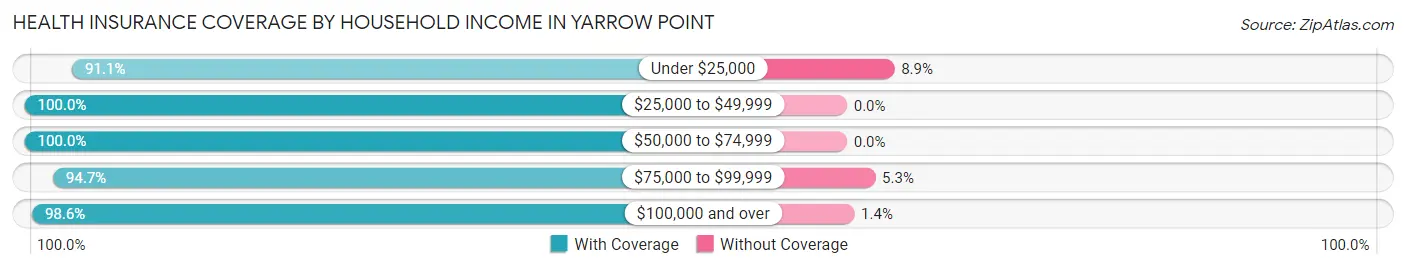
| Household Income | With Coverage | Without Coverage |
| Under $25,000 | 41 (91.1%) | 4 (8.9%) |
| $25,000 to $49,999 | 10 (100.0%) | 0 (0.0%) |
| $50,000 to $74,999 | 22 (100.0%) | 0 (0.0%) |
| $75,000 to $99,999 | 107 (94.7%) | 6 (5.3%) |
| $100,000 and over | 1,075 (98.6%) | 15 (1.4%) |
Public vs Private Health Insurance Coverage by Age in Yarrow Point
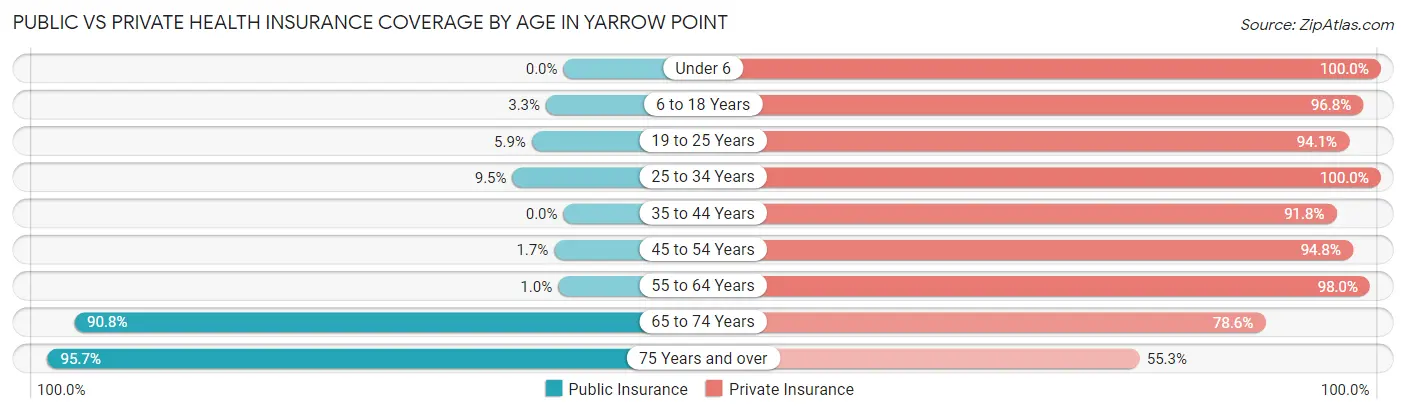
| Age Bracket | Public Insurance | Private Insurance |
| Under 6 | 0 (0.0%) | 49 (100.0%) |
| 6 to 18 Years | 9 (3.3%) | 268 (96.8%) |
| 19 to 25 Years | 3 (5.9%) | 48 (94.1%) |
| 25 to 34 Years | 7 (9.5%) | 74 (100.0%) |
| 35 to 44 Years | 0 (0.0%) | 145 (91.8%) |
| 45 to 54 Years | 4 (1.7%) | 220 (94.8%) |
| 55 to 64 Years | 2 (1.0%) | 196 (98.0%) |
| 65 to 74 Years | 89 (90.8%) | 77 (78.6%) |
| 75 Years and over | 135 (95.7%) | 78 (55.3%) |
| Total | 249 (19.5%) | 1,155 (90.2%) |
Disability Status by Sex by Age in Yarrow Point
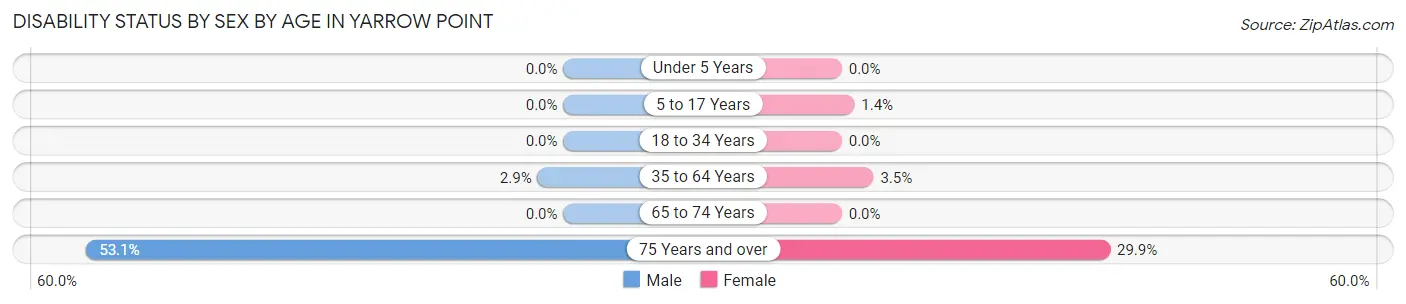
| Age Bracket | Male | Female |
| Under 5 Years | 0 (0.0%) | 0 (0.0%) |
| 5 to 17 Years | 0 (0.0%) | 2 (1.4%) |
| 18 to 34 Years | 0 (0.0%) | 0 (0.0%) |
| 35 to 64 Years | 8 (2.9%) | 11 (3.5%) |
| 65 to 74 Years | 0 (0.0%) | 0 (0.0%) |
| 75 Years and over | 34 (53.1%) | 23 (29.9%) |
Disability Class by Sex by Age in Yarrow Point
Disability Class: Hearing Difficulty
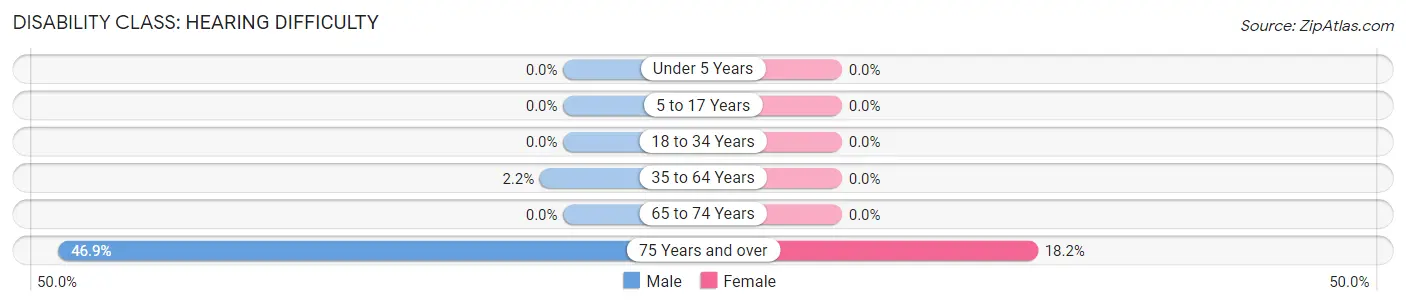
| Age Bracket | Male | Female |
| Under 5 Years | 0 (0.0%) | 0 (0.0%) |
| 5 to 17 Years | 0 (0.0%) | 0 (0.0%) |
| 18 to 34 Years | 0 (0.0%) | 0 (0.0%) |
| 35 to 64 Years | 6 (2.2%) | 0 (0.0%) |
| 65 to 74 Years | 0 (0.0%) | 0 (0.0%) |
| 75 Years and over | 30 (46.9%) | 14 (18.2%) |
Disability Class: Vision Difficulty
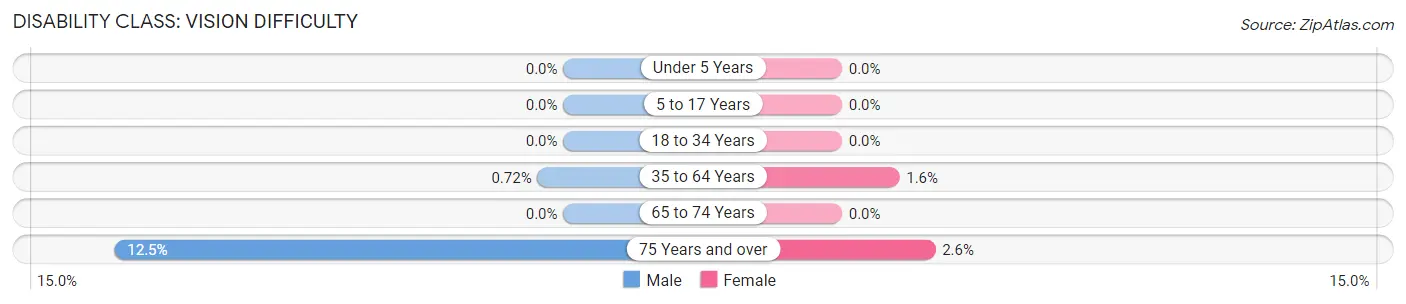
| Age Bracket | Male | Female |
| Under 5 Years | 0 (0.0%) | 0 (0.0%) |
| 5 to 17 Years | 0 (0.0%) | 0 (0.0%) |
| 18 to 34 Years | 0 (0.0%) | 0 (0.0%) |
| 35 to 64 Years | 2 (0.7%) | 5 (1.6%) |
| 65 to 74 Years | 0 (0.0%) | 0 (0.0%) |
| 75 Years and over | 8 (12.5%) | 2 (2.6%) |
Disability Class: Cognitive Difficulty
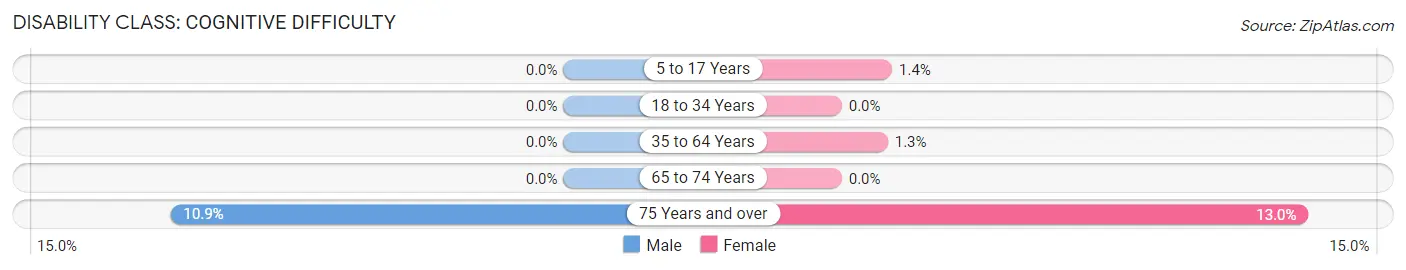
| Age Bracket | Male | Female |
| 5 to 17 Years | 0 (0.0%) | 2 (1.4%) |
| 18 to 34 Years | 0 (0.0%) | 0 (0.0%) |
| 35 to 64 Years | 0 (0.0%) | 4 (1.3%) |
| 65 to 74 Years | 0 (0.0%) | 0 (0.0%) |
| 75 Years and over | 7 (10.9%) | 10 (13.0%) |
Disability Class: Ambulatory Difficulty
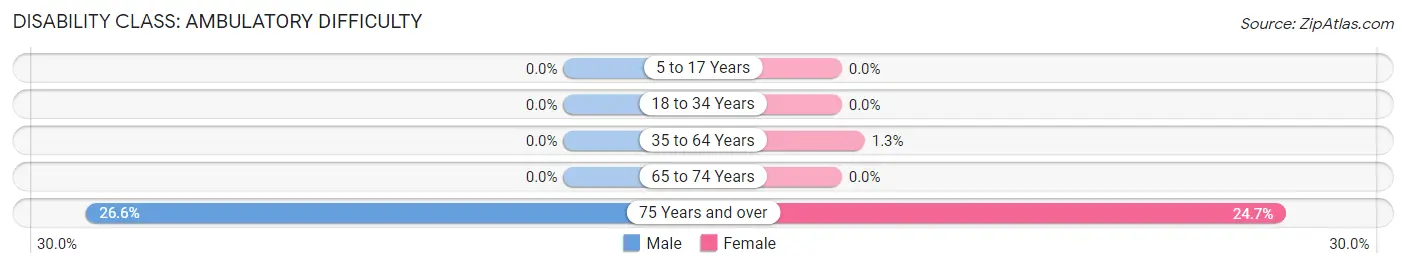
| Age Bracket | Male | Female |
| 5 to 17 Years | 0 (0.0%) | 0 (0.0%) |
| 18 to 34 Years | 0 (0.0%) | 0 (0.0%) |
| 35 to 64 Years | 0 (0.0%) | 4 (1.3%) |
| 65 to 74 Years | 0 (0.0%) | 0 (0.0%) |
| 75 Years and over | 17 (26.6%) | 19 (24.7%) |
Disability Class: Self-Care Difficulty
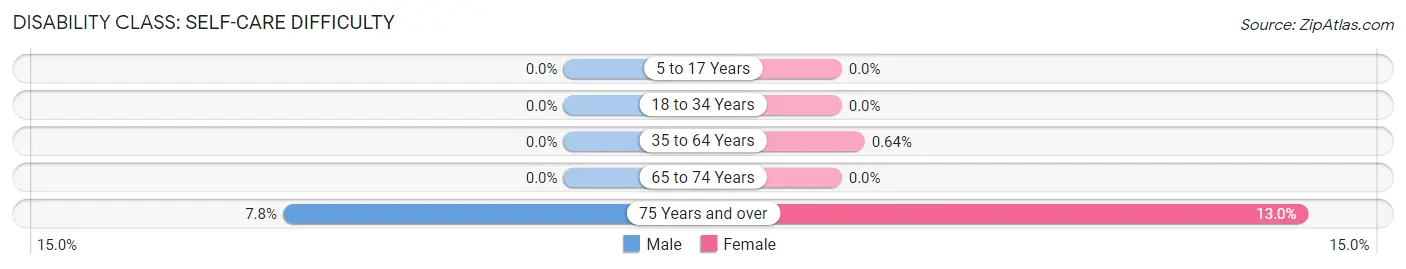
| Age Bracket | Male | Female |
| 5 to 17 Years | 0 (0.0%) | 0 (0.0%) |
| 18 to 34 Years | 0 (0.0%) | 0 (0.0%) |
| 35 to 64 Years | 0 (0.0%) | 2 (0.6%) |
| 65 to 74 Years | 0 (0.0%) | 0 (0.0%) |
| 75 Years and over | 5 (7.8%) | 10 (13.0%) |
Technology Access in Yarrow Point
Computing Device Access in Yarrow Point
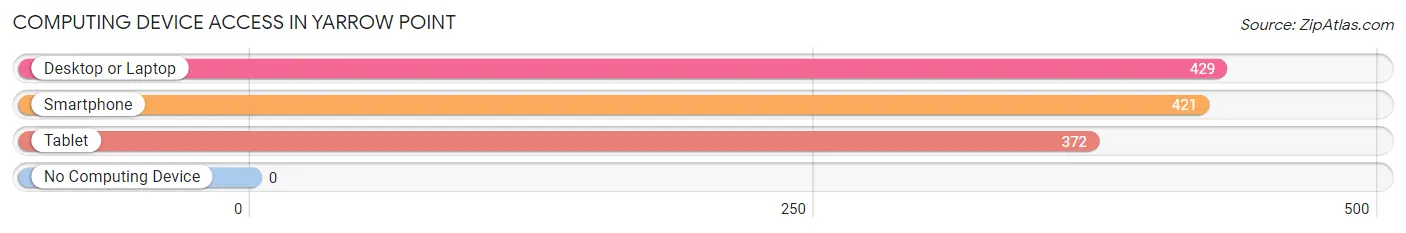
| Device Type | # Households | % Households |
| Desktop or Laptop | 429 | 99.1% |
| Smartphone | 421 | 97.2% |
| Tablet | 372 | 85.9% |
| No Computing Device | 0 | 0.0% |
| Total | 433 | 100.0% |
Internet Access in Yarrow Point
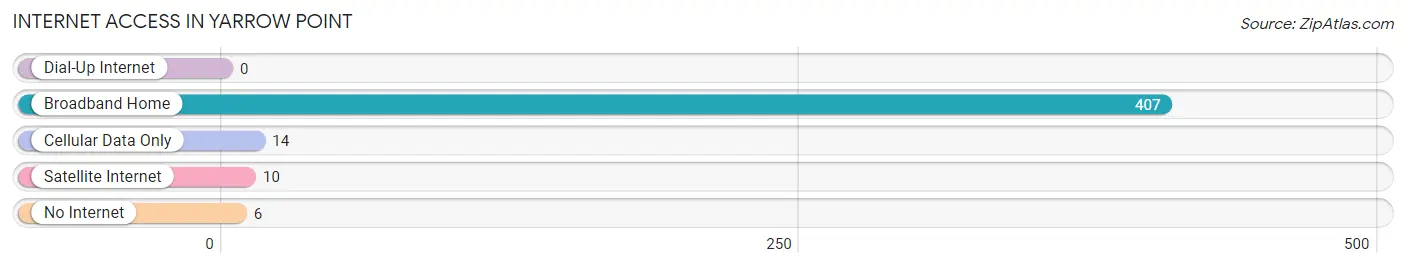
| Internet Type | # Households | % Households |
| Dial-Up Internet | 0 | 0.0% |
| Broadband Home | 407 | 94.0% |
| Cellular Data Only | 14 | 3.2% |
| Satellite Internet | 10 | 2.3% |
| No Internet | 6 | 1.4% |
| Total | 433 | 100.0% |
Yarrow Point Summary
Yarrow Point is a small town located in King County, Washington, United States. It is situated on the eastern shore of Lake Washington, just north of Bellevue and south of Kirkland. The population was 1,269 at the 2010 census.
History
Yarrow Point was first settled in the late 1800s by a group of Scandinavian immigrants. The town was named after the Yarrow family, who were among the first settlers. The Yarrows were farmers and loggers, and the town was originally known as Yarrow Point Farm.
In the early 1900s, the town began to grow as more people moved to the area. The town was incorporated in 1951 and the population grew steadily over the next few decades.
Geography
Yarrow Point is located at 47°37′17″N 122°11′17″W (47.6214, -122.1881). It is situated on the eastern shore of Lake Washington, just north of Bellevue and south of Kirkland. The town has a total area of 0.7 square miles, all of which is land.
Economy
Yarrow Point is primarily a residential community, with most of its residents employed in the nearby cities of Bellevue and Seattle. The town does have a few small businesses, including a grocery store, a gas station, and a few restaurants.
Demographics
As of the 2010 census, there were 1,269 people, 545 households, and 393 families residing in Yarrow Point. The population density was 1,845.3 people per square mile. The racial makeup of the town was 87.3% White, 4.2% Asian, 0.8% African American, 0.2% Native American, 0.1% Pacific Islander, and 6.4% from other races. Hispanic or Latino of any race were 4.2% of the population.
The median income for a household in Yarrow Point was $125,000, and the median income for a family was $150,000. The per capita income for the town was $75,000. About 2.2% of families and 3.2% of the population were below the poverty line, including 3.3% of those under age 18 and none of those age 65 or over.
Conclusion
Yarrow Point is a small town located in King County, Washington, United States. It is situated on the eastern shore of Lake Washington, just north of Bellevue and south of Kirkland. The population was 1,269 at the 2010 census. The town has a long history, dating back to the late 1800s when it was first settled by Scandinavian immigrants. Today, Yarrow Point is primarily a residential community, with most of its residents employed in the nearby cities of Bellevue and Seattle. The town has a median household income of $125,000 and a per capita income of $75,000.
Common Questions
What is Per Capita Income in Yarrow Point?
Per Capita income in Yarrow Point is $144,164.
What is the Median Family Income in Yarrow Point?
Median Family Income in Yarrow Point is $250,001.
What is the Median Household income in Yarrow Point?
Median Household Income in Yarrow Point is $250,001.
What is Income or Wage Gap in Yarrow Point?
Income or Wage Gap in Yarrow Point is 56.0%.
Women in Yarrow Point earn 44.0 cents for every dollar earned by a man.
What is Inequality or Gini Index in Yarrow Point?
Inequality or Gini Index in Yarrow Point is 0.49.
What is the Total Population of Yarrow Point?
Total Population of Yarrow Point is 1,280.
What is the Total Male Population of Yarrow Point?
Total Male Population of Yarrow Point is 642.
What is the Total Female Population of Yarrow Point?
Total Female Population of Yarrow Point is 638.
What is the Ratio of Males per 100 Females in Yarrow Point?
There are 100.63 Males per 100 Females in Yarrow Point.
What is the Ratio of Females per 100 Males in Yarrow Point?
There are 99.38 Females per 100 Males in Yarrow Point.
What is the Median Population Age in Yarrow Point?
Median Population Age in Yarrow Point is 47.9 Years.
What is the Average Family Size in Yarrow Point
Average Family Size in Yarrow Point is 3.1 People.
What is the Average Household Size in Yarrow Point
Average Household Size in Yarrow Point is 3.0 People.
How Large is the Labor Force in Yarrow Point?
There are 622 People in the Labor Forcein in Yarrow Point.
What is the Percentage of People in the Labor Force in Yarrow Point?
60.7% of People are in the Labor Force in Yarrow Point.
What is the Unemployment Rate in Yarrow Point?
Unemployment Rate in Yarrow Point is 2.1%.