Bainbridge Island, WA Map & Demographics
Bainbridge Island Map
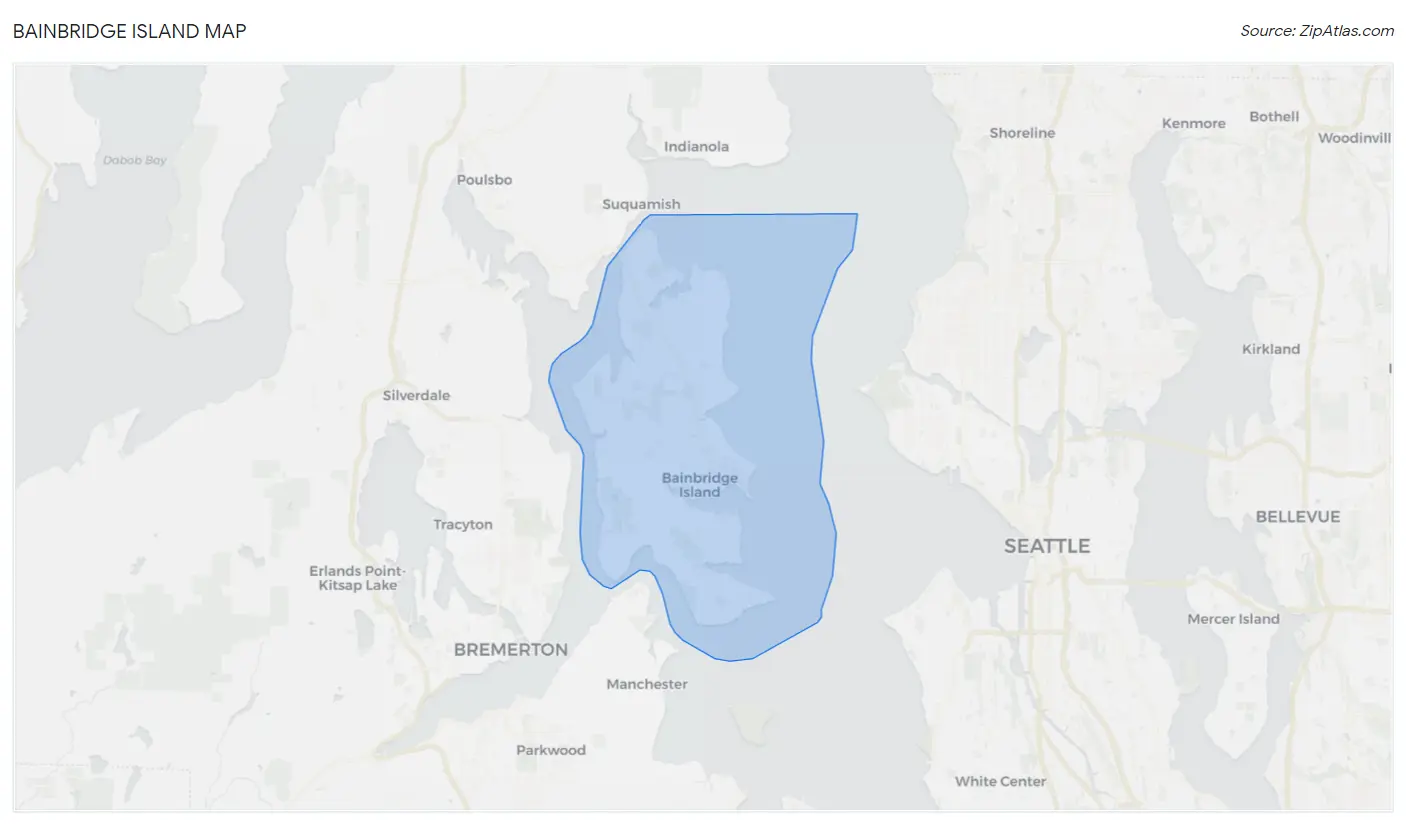
Bainbridge Island Overview
$86,747
PER CAPITA INCOME
$180,240
AVG FAMILY INCOME
$151,290
AVG HOUSEHOLD INCOME
51.4%
WAGE / INCOME GAP [ % ]
48.6¢/ $1
WAGE / INCOME GAP [ $ ]
0.47
INEQUALITY / GINI INDEX
24,681
TOTAL POPULATION
12,195
MALE POPULATION
12,486
FEMALE POPULATION
97.67
MALES / 100 FEMALES
102.39
FEMALES / 100 MALES
49.5
MEDIAN AGE
2.8
AVG FAMILY SIZE
2.5
AVG HOUSEHOLD SIZE
11,776
LABOR FORCE [ PEOPLE ]
57.8%
PERCENT IN LABOR FORCE
2.9%
UNEMPLOYMENT RATE
Bainbridge Island Zip Codes
Bainbridge Island Area Codes
Income in Bainbridge Island
Income Overview in Bainbridge Island
Per Capita Income in Bainbridge Island is $86,747, while median incomes of families and households are $180,240 and $151,290 respectively.
| Characteristic | Number | Measure |
| Per Capita Income | 24,681 | $86,747 |
| Median Family Income | 7,393 | $180,240 |
| Mean Family Income | 7,393 | $244,345 |
| Median Household Income | 9,850 | $151,290 |
| Mean Household Income | 9,850 | $214,501 |
| Income Deficit | 7,393 | $0 |
| Wage / Income Gap (%) | 24,681 | 51.39% |
| Wage / Income Gap ($) | 24,681 | 48.61¢ per $1 |
| Gini / Inequality Index | 24,681 | 0.47 |
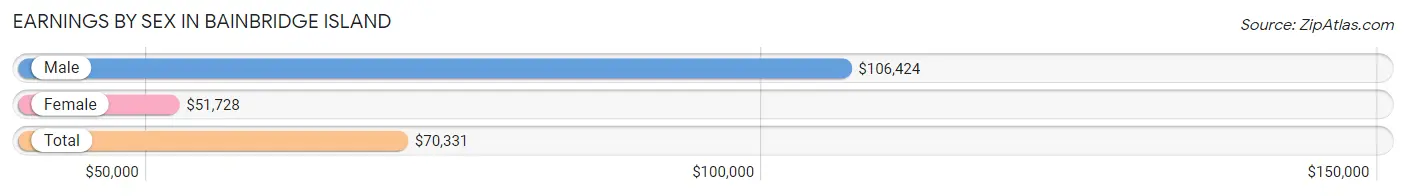
Earnings by Sex in Bainbridge Island
Average Earnings in Bainbridge Island are $70,331, $106,424 for men and $51,728 for women, a difference of 51.4%.
| Sex | Number | Average Earnings |
| Male | 6,841 (52.2%) | $106,424 |
| Female | 6,266 (47.8%) | $51,728 |
| Total | 13,107 (100.0%) | $70,331 |
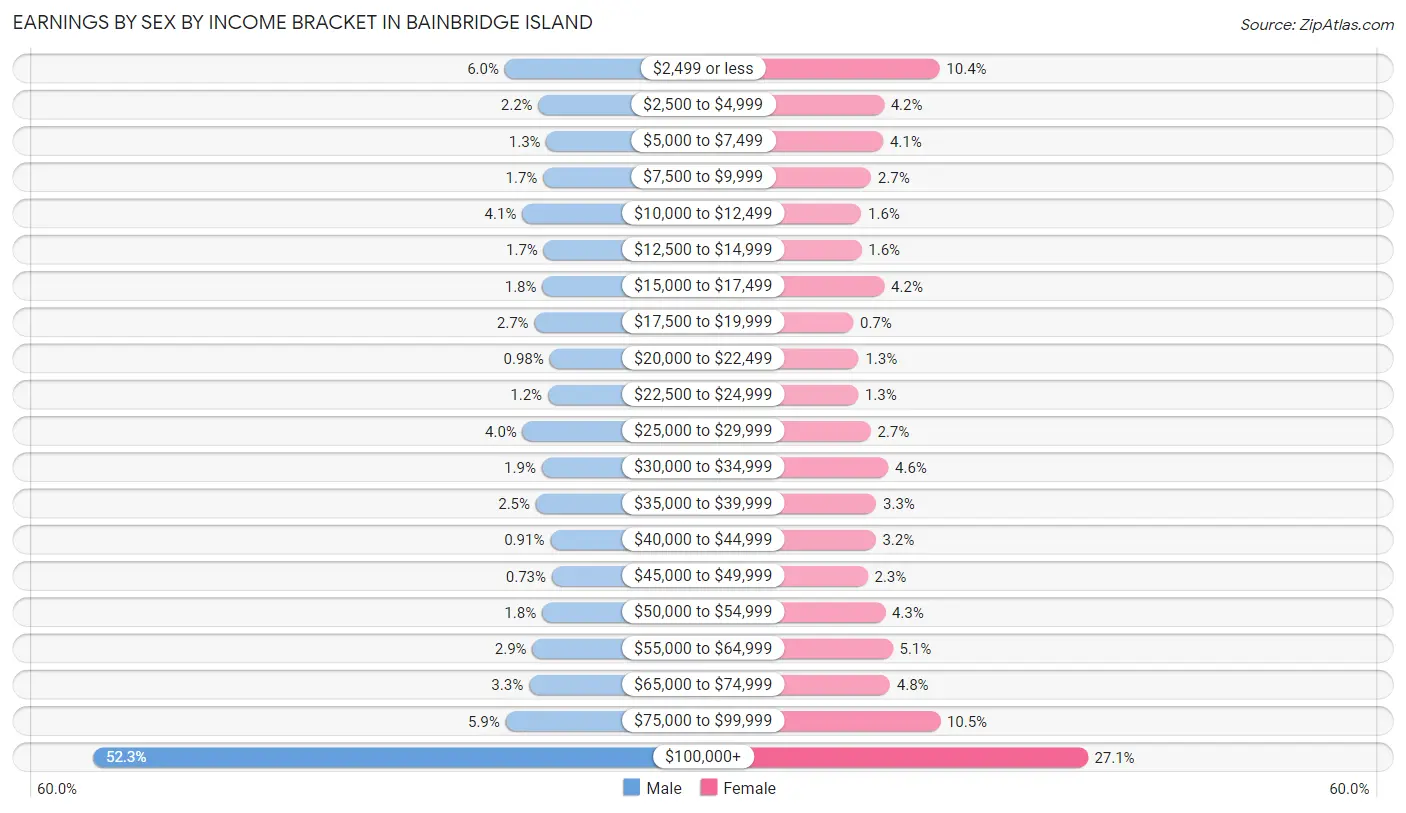
Earnings by Sex by Income Bracket in Bainbridge Island
The most common earnings brackets in Bainbridge Island are $100,000+ for men (3,578 | 52.3%) and $100,000+ for women (1,695 | 27.1%).
| Income | Male | Female |
| $2,499 or less | 412 (6.0%) | 652 (10.4%) |
| $2,500 to $4,999 | 153 (2.2%) | 260 (4.2%) |
| $5,000 to $7,499 | 92 (1.3%) | 255 (4.1%) |
| $7,500 to $9,999 | 117 (1.7%) | 170 (2.7%) |
| $10,000 to $12,499 | 278 (4.1%) | 101 (1.6%) |
| $12,500 to $14,999 | 113 (1.7%) | 103 (1.6%) |
| $15,000 to $17,499 | 123 (1.8%) | 263 (4.2%) |
| $17,500 to $19,999 | 184 (2.7%) | 44 (0.7%) |
| $20,000 to $22,499 | 67 (1.0%) | 82 (1.3%) |
| $22,500 to $24,999 | 80 (1.2%) | 79 (1.3%) |
| $25,000 to $29,999 | 274 (4.0%) | 167 (2.7%) |
| $30,000 to $34,999 | 128 (1.9%) | 291 (4.6%) |
| $35,000 to $39,999 | 173 (2.5%) | 206 (3.3%) |
| $40,000 to $44,999 | 62 (0.9%) | 202 (3.2%) |
| $45,000 to $49,999 | 50 (0.7%) | 146 (2.3%) |
| $50,000 to $54,999 | 126 (1.8%) | 269 (4.3%) |
| $55,000 to $64,999 | 199 (2.9%) | 322 (5.1%) |
| $65,000 to $74,999 | 226 (3.3%) | 303 (4.8%) |
| $75,000 to $99,999 | 406 (5.9%) | 656 (10.5%) |
| $100,000+ | 3,578 (52.3%) | 1,695 (27.1%) |
| Total | 6,841 (100.0%) | 6,266 (100.0%) |
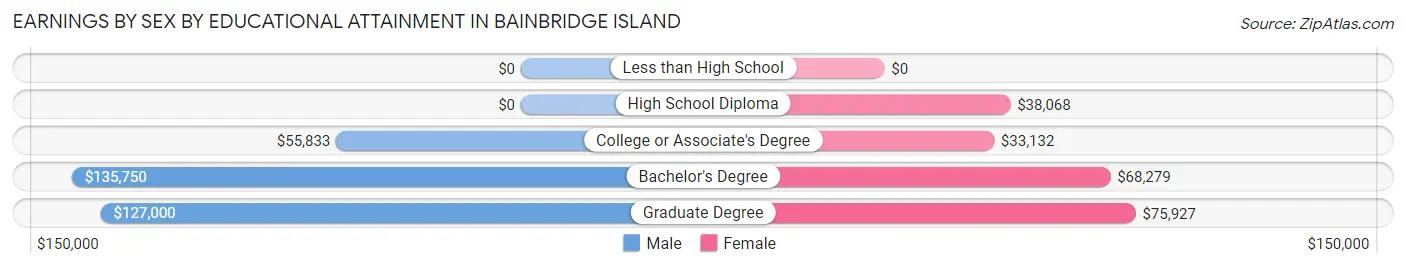
Earnings by Sex by Educational Attainment in Bainbridge Island
Average earnings in Bainbridge Island are $120,142 for men and $55,858 for women, a difference of 53.5%. Men with an educational attainment of bachelor's degree enjoy the highest average annual earnings of $135,750, while those with college or associate's degree education earn the least with $55,833. Women with an educational attainment of graduate degree earn the most with the average annual earnings of $75,927, while those with college or associate's degree education have the smallest earnings of $33,132.
| Educational Attainment | Male Income | Female Income |
| Less than High School | - | - |
| High School Diploma | - | - |
| College or Associate's Degree | $55,833 | $33,132 |
| Bachelor's Degree | $135,750 | $68,279 |
| Graduate Degree | $127,000 | $75,927 |
| Total | $120,142 | $55,858 |
Family Income in Bainbridge Island
Family Income Brackets in Bainbridge Island
According to the Bainbridge Island family income data, there are 3,275 families falling into the $200,000+ income range, which is the most common income bracket and makes up 44.3% of all families. Conversely, the $10,000 to $14,999 income bracket is the least frequent group with only 7 families (0.1%) belonging to this category.
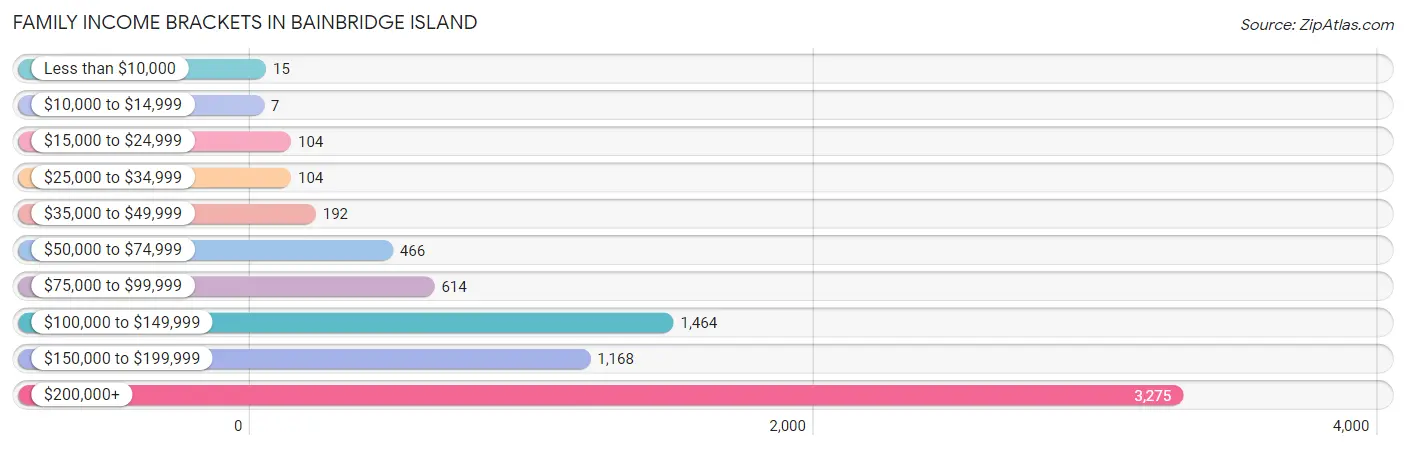
| Income Bracket | # Families | % Families |
| Less than $10,000 | 15 | 0.2% |
| $10,000 to $14,999 | 7 | 0.1% |
| $15,000 to $24,999 | 104 | 1.4% |
| $25,000 to $34,999 | 104 | 1.4% |
| $35,000 to $49,999 | 192 | 2.6% |
| $50,000 to $74,999 | 466 | 6.3% |
| $75,000 to $99,999 | 614 | 8.3% |
| $100,000 to $149,999 | 1,464 | 19.8% |
| $150,000 to $199,999 | 1,168 | 15.8% |
| $200,000+ | 3,275 | 44.3% |
Family Income by Famaliy Size in Bainbridge Island
5-person families (424 | 5.7%) account for the highest median family income in Bainbridge Island with $250,001 per family, while 2-person families (4,023 | 54.4%) have the highest median income of $75,446 per family member.
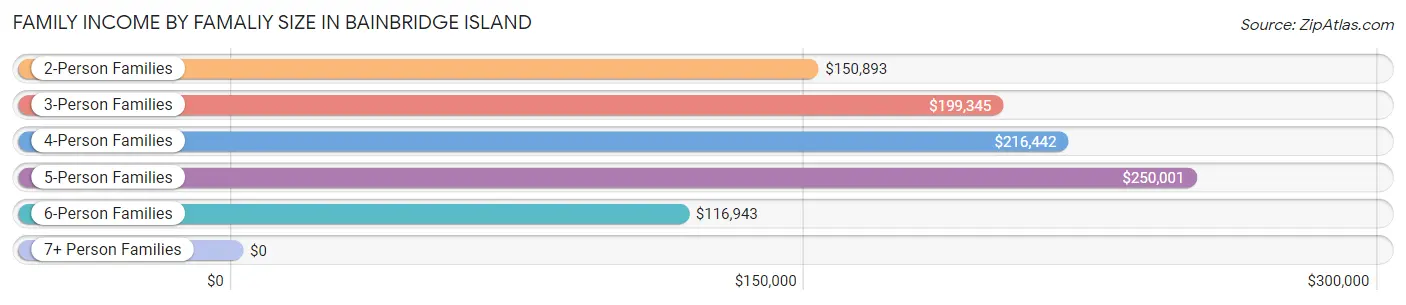
| Income Bracket | # Families | Median Income |
| 2-Person Families | 4,023 (54.4%) | $150,893 |
| 3-Person Families | 1,421 (19.2%) | $199,345 |
| 4-Person Families | 1,361 (18.4%) | $216,442 |
| 5-Person Families | 424 (5.7%) | $250,001 |
| 6-Person Families | 129 (1.7%) | $116,943 |
| 7+ Person Families | 35 (0.5%) | $0 |
| Total | 7,393 (100.0%) | $180,240 |
Family Income by Number of Earners in Bainbridge Island
The median family income in Bainbridge Island is $180,240, with families comprising 3+ earners (677) having the highest median family income of $250,001, while families with no earners (1,240) have the lowest median family income of $115,795, accounting for 9.2% and 16.8% of families, respectively.
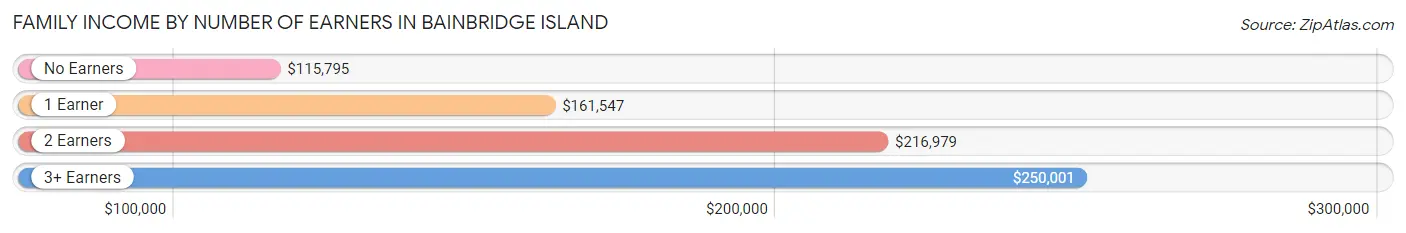
| Number of Earners | # Families | Median Income |
| No Earners | 1,240 (16.8%) | $115,795 |
| 1 Earner | 2,391 (32.3%) | $161,547 |
| 2 Earners | 3,085 (41.7%) | $216,979 |
| 3+ Earners | 677 (9.2%) | $250,001 |
| Total | 7,393 (100.0%) | $180,240 |
Household Income in Bainbridge Island
Household Income Brackets in Bainbridge Island
With 3,566 households falling in the category, the $200,000+ income range is the most frequent in Bainbridge Island, accounting for 36.2% of all households. In contrast, only 128 households (1.3%) fall into the $10,000 to $14,999 income bracket, making it the least populous group.
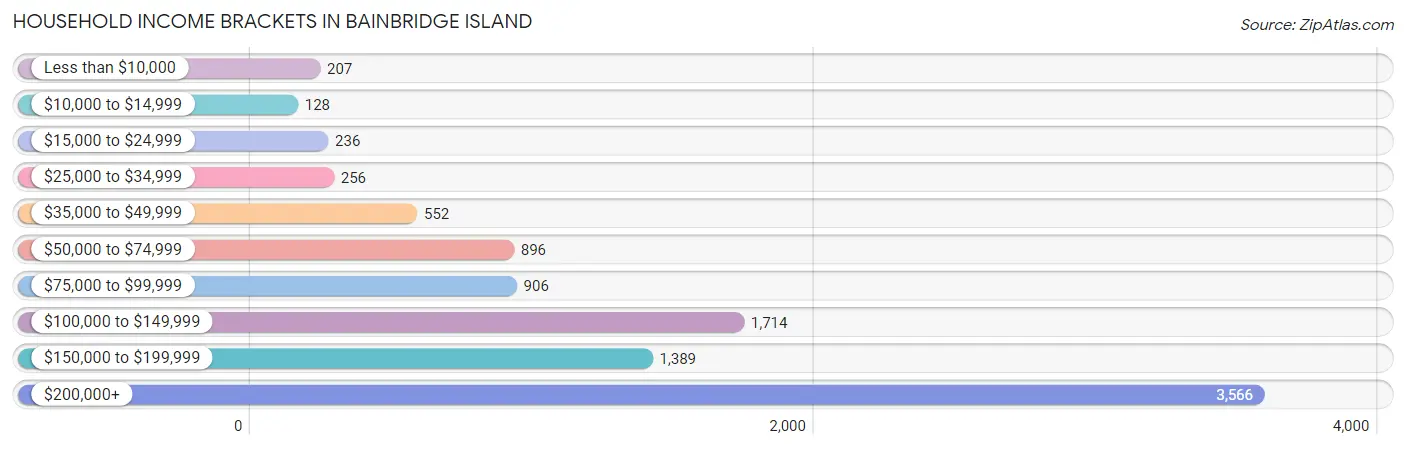
| Income Bracket | # Households | % Households |
| Less than $10,000 | 207 | 2.1% |
| $10,000 to $14,999 | 128 | 1.3% |
| $15,000 to $24,999 | 236 | 2.4% |
| $25,000 to $34,999 | 256 | 2.6% |
| $35,000 to $49,999 | 552 | 5.6% |
| $50,000 to $74,999 | 896 | 9.1% |
| $75,000 to $99,999 | 906 | 9.2% |
| $100,000 to $149,999 | 1,714 | 17.4% |
| $150,000 to $199,999 | 1,389 | 14.1% |
| $200,000+ | 3,566 | 36.2% |
Household Income by Householder Age in Bainbridge Island
The median household income in Bainbridge Island is $151,290, with the highest median household income of $194,808 found in the 45 to 64 years age bracket for the primary householder. A total of 3,880 households (39.4%) fall into this category.
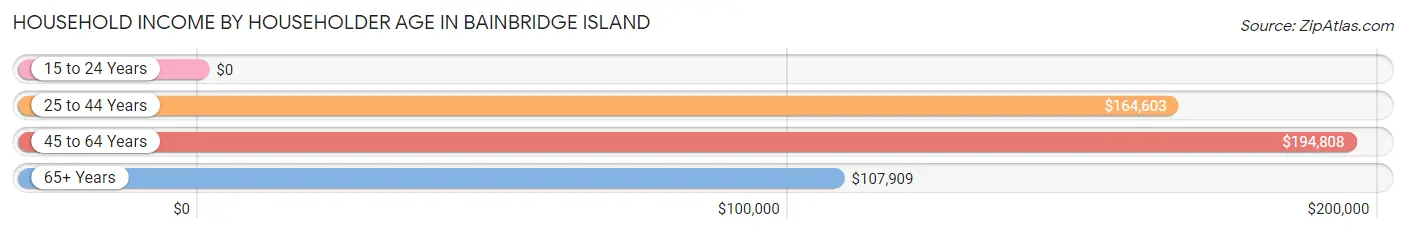
| Income Bracket | # Households | Median Income |
| 15 to 24 Years | 0 (0.0%) | $0 |
| 25 to 44 Years | 2,105 (21.4%) | $164,603 |
| 45 to 64 Years | 3,880 (39.4%) | $194,808 |
| 65+ Years | 3,865 (39.2%) | $107,909 |
| Total | 9,850 (100.0%) | $151,290 |
Poverty in Bainbridge Island
Income Below Poverty by Sex and Age in Bainbridge Island
With 2.3% poverty level for males and 3.6% for females among the residents of Bainbridge Island, 45 to 54 year old males and 25 to 34 year old females are the most vulnerable to poverty, with 79 males (5.6%) and 126 females (15.5%) in their respective age groups living below the poverty level.
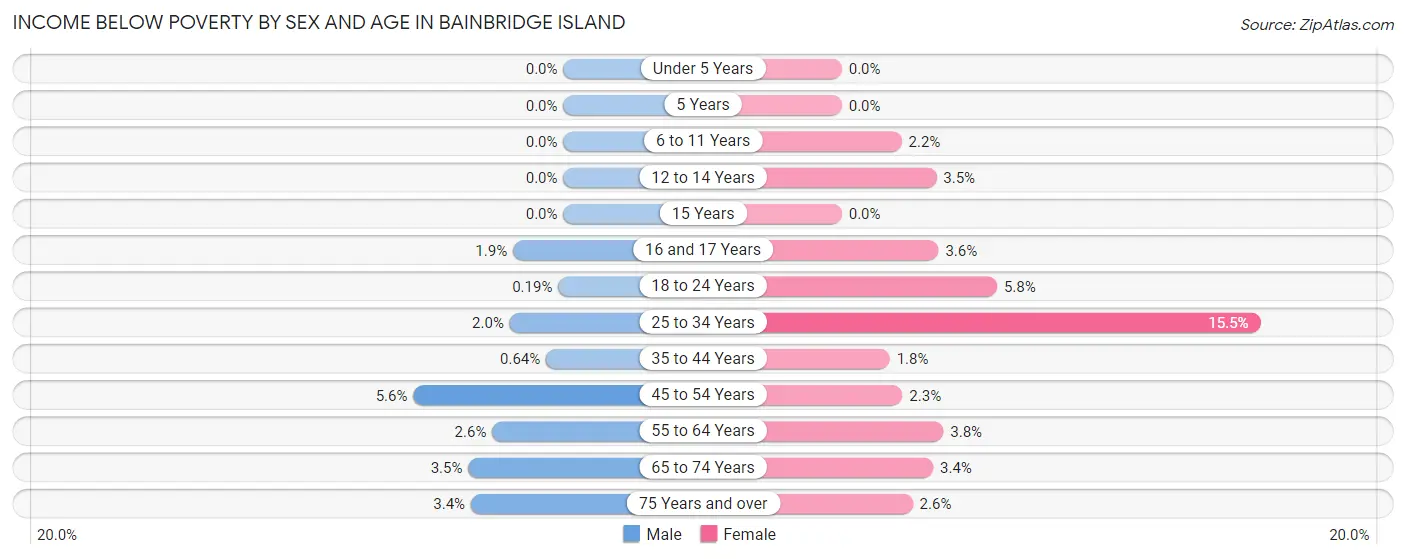
| Age Bracket | Male | Female |
| Under 5 Years | 0 (0.0%) | 0 (0.0%) |
| 5 Years | 0 (0.0%) | 0 (0.0%) |
| 6 to 11 Years | 0 (0.0%) | 17 (2.2%) |
| 12 to 14 Years | 0 (0.0%) | 14 (3.5%) |
| 15 Years | 0 (0.0%) | 0 (0.0%) |
| 16 and 17 Years | 8 (1.9%) | 14 (3.6%) |
| 18 to 24 Years | 1 (0.2%) | 26 (5.8%) |
| 25 to 34 Years | 11 (2.0%) | 126 (15.5%) |
| 35 to 44 Years | 11 (0.6%) | 28 (1.8%) |
| 45 to 54 Years | 79 (5.6%) | 42 (2.2%) |
| 55 to 64 Years | 51 (2.6%) | 73 (3.8%) |
| 65 to 74 Years | 73 (3.5%) | 80 (3.4%) |
| 75 Years and over | 41 (3.4%) | 26 (2.6%) |
| Total | 275 (2.3%) | 446 (3.6%) |
Income Above Poverty by Sex and Age in Bainbridge Island
According to the poverty statistics in Bainbridge Island, males aged under 5 years and females aged under 5 years are the age groups that are most secure financially, with 100.0% of males and 100.0% of females in these age groups living above the poverty line.
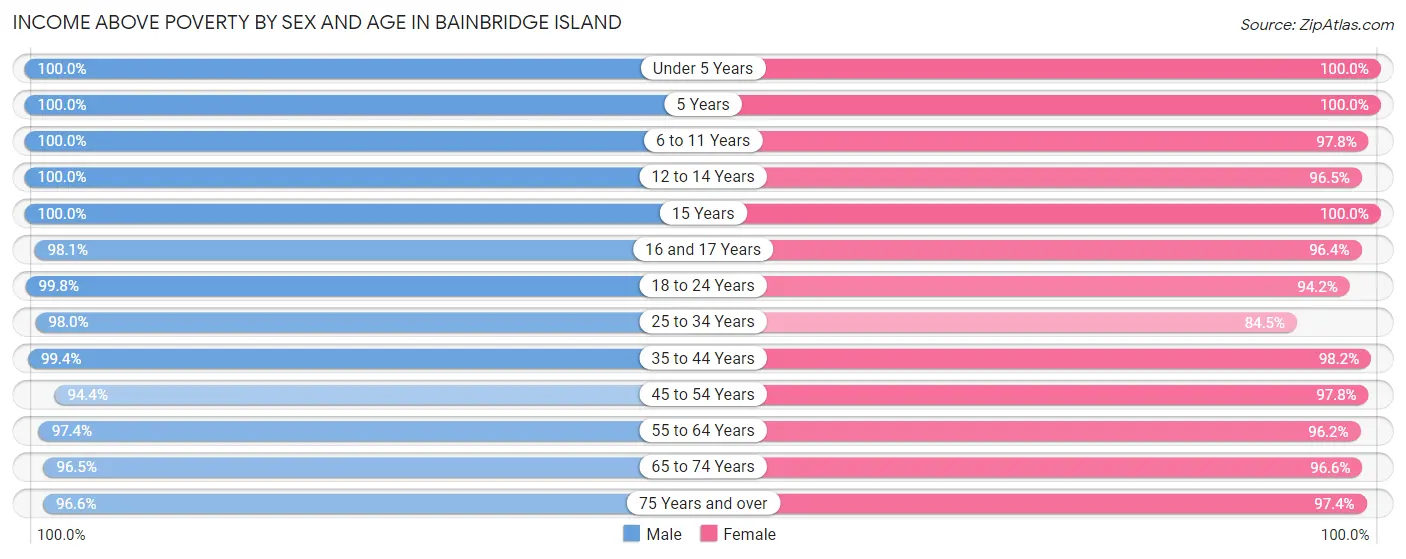
| Age Bracket | Male | Female |
| Under 5 Years | 525 (100.0%) | 542 (100.0%) |
| 5 Years | 92 (100.0%) | 136 (100.0%) |
| 6 to 11 Years | 850 (100.0%) | 748 (97.8%) |
| 12 to 14 Years | 570 (100.0%) | 385 (96.5%) |
| 15 Years | 200 (100.0%) | 184 (100.0%) |
| 16 and 17 Years | 419 (98.1%) | 376 (96.4%) |
| 18 to 24 Years | 538 (99.8%) | 425 (94.2%) |
| 25 to 34 Years | 542 (98.0%) | 685 (84.5%) |
| 35 to 44 Years | 1,701 (99.4%) | 1,542 (98.2%) |
| 45 to 54 Years | 1,339 (94.4%) | 1,828 (97.8%) |
| 55 to 64 Years | 1,883 (97.4%) | 1,861 (96.2%) |
| 65 to 74 Years | 1,996 (96.5%) | 2,277 (96.6%) |
| 75 Years and over | 1,155 (96.6%) | 961 (97.4%) |
| Total | 11,810 (97.7%) | 11,950 (96.4%) |
Income Below Poverty Among Married-Couple Families in Bainbridge Island
The poverty statistics for married-couple families in Bainbridge Island show that 0.3% or 22 of the total 6,451 families live below the poverty line. Families with no children have the highest poverty rate of 0.5%, comprising of 22 families. On the other hand, families with 1 or 2 children have the lowest poverty rate of 0.0%, which includes 0 families.
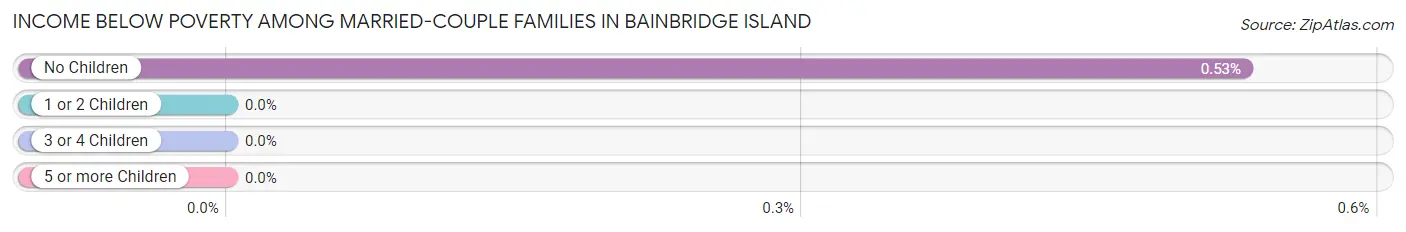
| Children | Above Poverty | Below Poverty |
| No Children | 4,104 (99.5%) | 22 (0.5%) |
| 1 or 2 Children | 1,868 (100.0%) | 0 (0.0%) |
| 3 or 4 Children | 457 (100.0%) | 0 (0.0%) |
| 5 or more Children | 0 (0.0%) | 0 (0.0%) |
| Total | 6,429 (99.7%) | 22 (0.3%) |
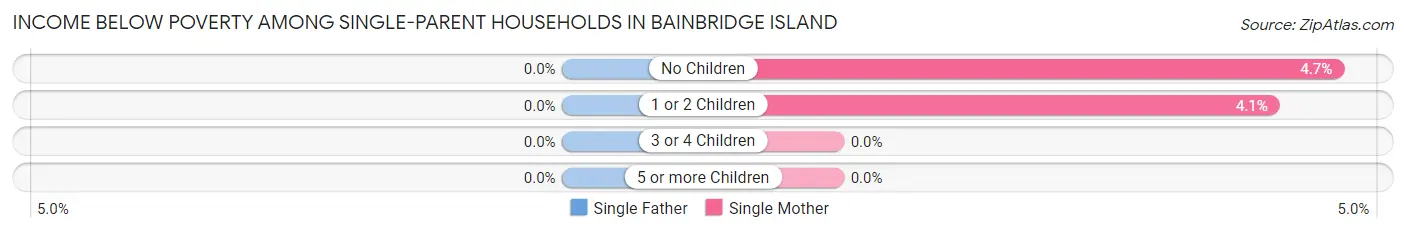
Income Below Poverty Among Single-Parent Households in Bainbridge Island
| Children | Single Father | Single Mother |
| No Children | 0 (0.0%) | 9 (4.7%) |
| 1 or 2 Children | 0 (0.0%) | 14 (4.1%) |
| 3 or 4 Children | 0 (0.0%) | 0 (0.0%) |
| 5 or more Children | 0 (0.0%) | 0 (0.0%) |
| Total | 0 (0.0%) | 23 (3.9%) |
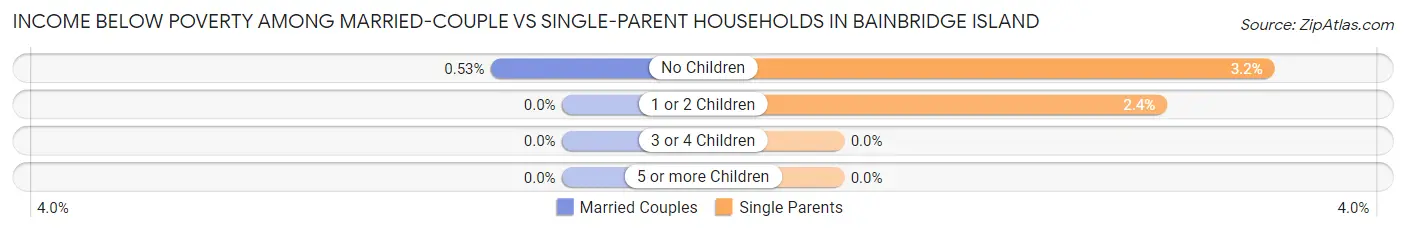
Income Below Poverty Among Married-Couple vs Single-Parent Households in Bainbridge Island
The poverty data for Bainbridge Island shows that 22 of the married-couple family households (0.3%) and 23 of the single-parent households (2.4%) are living below the poverty level. Within the married-couple family households, those with no children have the highest poverty rate, with 22 households (0.5%) falling below the poverty line. Among the single-parent households, those with no children have the highest poverty rate, with 9 household (3.2%) living below poverty.
| Children | Married-Couple Families | Single-Parent Households |
| No Children | 22 (0.5%) | 9 (3.2%) |
| 1 or 2 Children | 0 (0.0%) | 14 (2.4%) |
| 3 or 4 Children | 0 (0.0%) | 0 (0.0%) |
| 5 or more Children | 0 (0.0%) | 0 (0.0%) |
| Total | 22 (0.3%) | 23 (2.4%) |
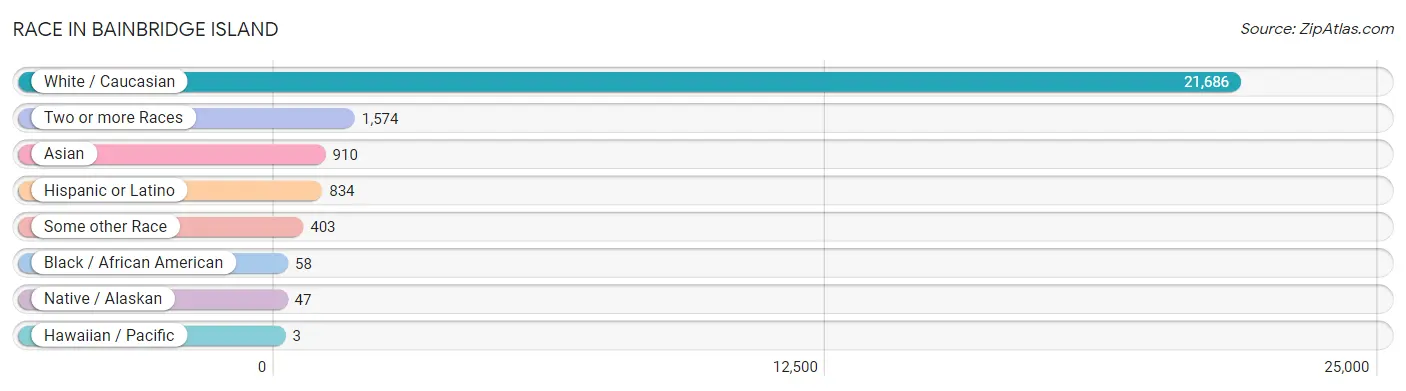
Race in Bainbridge Island
The most populous races in Bainbridge Island are White / Caucasian (21,686 | 87.9%), Two or more Races (1,574 | 6.4%), and Asian (910 | 3.7%).
| Race | # Population | % Population |
| Asian | 910 | 3.7% |
| Black / African American | 58 | 0.2% |
| Hawaiian / Pacific | 3 | 0.0% |
| Hispanic or Latino | 834 | 3.4% |
| Native / Alaskan | 47 | 0.2% |
| White / Caucasian | 21,686 | 87.9% |
| Two or more Races | 1,574 | 6.4% |
| Some other Race | 403 | 1.6% |
| Total | 24,681 | 100.0% |
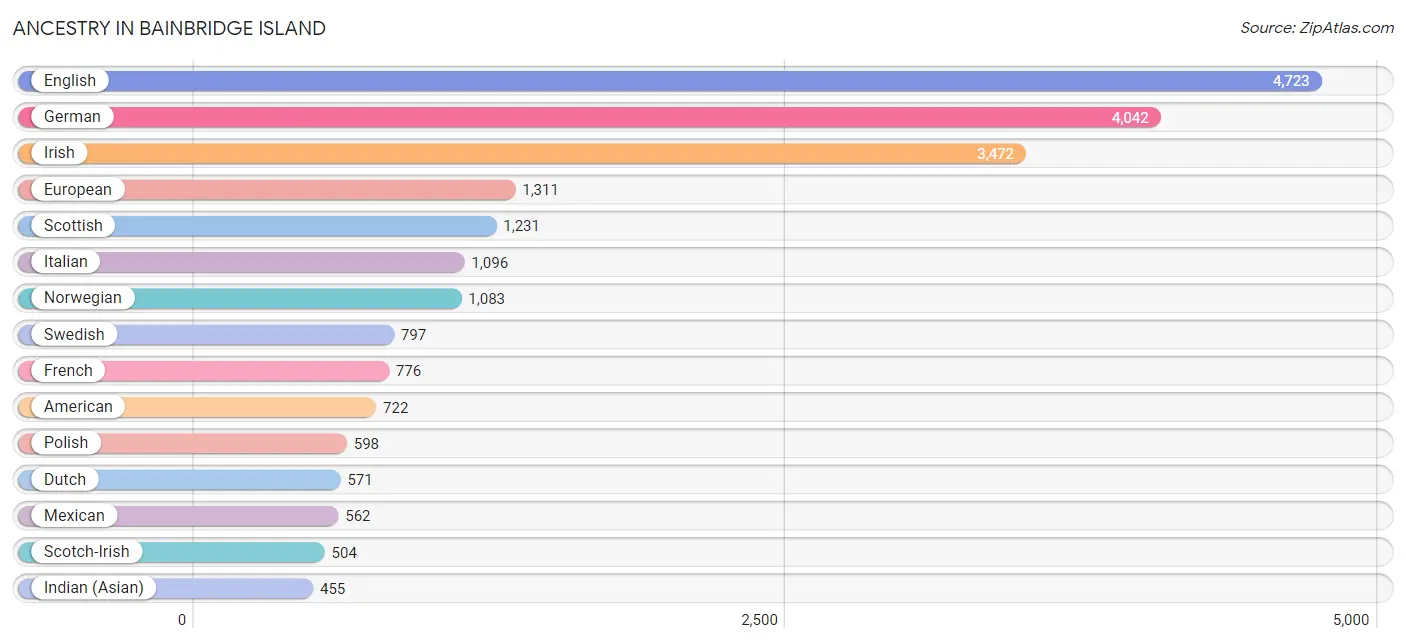
Ancestry in Bainbridge Island
The most populous ancestries reported in Bainbridge Island are English (4,723 | 19.1%), German (4,042 | 16.4%), Irish (3,472 | 14.1%), European (1,311 | 5.3%), and Scottish (1,231 | 5.0%), together accounting for 59.9% of all Bainbridge Island residents.
| Ancestry | # Population | % Population |
| African | 49 | 0.2% |
| Alaska Native | 15 | 0.1% |
| Alaskan Athabascan | 8 | 0.0% |
| Alsatian | 10 | 0.0% |
| American | 722 | 2.9% |
| Arab | 80 | 0.3% |
| Argentinean | 15 | 0.1% |
| Australian | 23 | 0.1% |
| Austrian | 39 | 0.2% |
| Basque | 14 | 0.1% |
| Belgian | 16 | 0.1% |
| Bhutanese | 145 | 0.6% |
| Blackfeet | 9 | 0.0% |
| British | 384 | 1.6% |
| British West Indian | 7 | 0.0% |
| Burmese | 138 | 0.6% |
| Canadian | 107 | 0.4% |
| Celtic | 18 | 0.1% |
| Central American | 71 | 0.3% |
| Cherokee | 42 | 0.2% |
| Chickasaw | 33 | 0.1% |
| Chilean | 13 | 0.1% |
| Colombian | 27 | 0.1% |
| Croatian | 98 | 0.4% |
| Cuban | 12 | 0.1% |
| Czech | 146 | 0.6% |
| Czechoslovakian | 9 | 0.0% |
| Danish | 345 | 1.4% |
| Dutch | 571 | 2.3% |
| Eastern European | 59 | 0.2% |
| English | 4,723 | 19.1% |
| Estonian | 11 | 0.0% |
| European | 1,311 | 5.3% |
| Filipino | 29 | 0.1% |
| Finnish | 239 | 1.0% |
| French | 776 | 3.1% |
| French Canadian | 136 | 0.5% |
| German | 4,042 | 16.4% |
| German Russian | 11 | 0.0% |
| Greek | 69 | 0.3% |
| Guamanian / Chamorro | 19 | 0.1% |
| Guyanese | 59 | 0.2% |
| Hungarian | 125 | 0.5% |
| Icelander | 39 | 0.2% |
| Indian (Asian) | 455 | 1.8% |
| Iranian | 9 | 0.0% |
| Irish | 3,472 | 14.1% |
| Israeli | 10 | 0.0% |
| Italian | 1,096 | 4.4% |
| Korean | 334 | 1.3% |
| Latvian | 30 | 0.1% |
| Lebanese | 5 | 0.0% |
| Lithuanian | 158 | 0.6% |
| Luxembourger | 17 | 0.1% |
| Mexican | 562 | 2.3% |
| Native Hawaiian | 7 | 0.0% |
| Northern European | 320 | 1.3% |
| Norwegian | 1,083 | 4.4% |
| Pakistani | 53 | 0.2% |
| Palestinian | 62 | 0.3% |
| Panamanian | 71 | 0.3% |
| Pennsylvania German | 9 | 0.0% |
| Polish | 598 | 2.4% |
| Portuguese | 295 | 1.2% |
| Puerto Rican | 51 | 0.2% |
| Puget Sound Salish | 29 | 0.1% |
| Romanian | 13 | 0.1% |
| Russian | 319 | 1.3% |
| Samoan | 23 | 0.1% |
| Scandinavian | 415 | 1.7% |
| Scotch-Irish | 504 | 2.0% |
| Scottish | 1,231 | 5.0% |
| Seminole | 12 | 0.1% |
| Slavic | 12 | 0.1% |
| Slovak | 41 | 0.2% |
| Slovene | 19 | 0.1% |
| South African | 71 | 0.3% |
| South American | 66 | 0.3% |
| Spaniard | 37 | 0.2% |
| Sri Lankan | 47 | 0.2% |
| Subsaharan African | 120 | 0.5% |
| Swedish | 797 | 3.2% |
| Swiss | 266 | 1.1% |
| Thai | 418 | 1.7% |
| Ukrainian | 129 | 0.5% |
| Venezuelan | 11 | 0.0% |
| Welsh | 175 | 0.7% |
| Yugoslavian | 105 | 0.4% | View All 88 Rows |
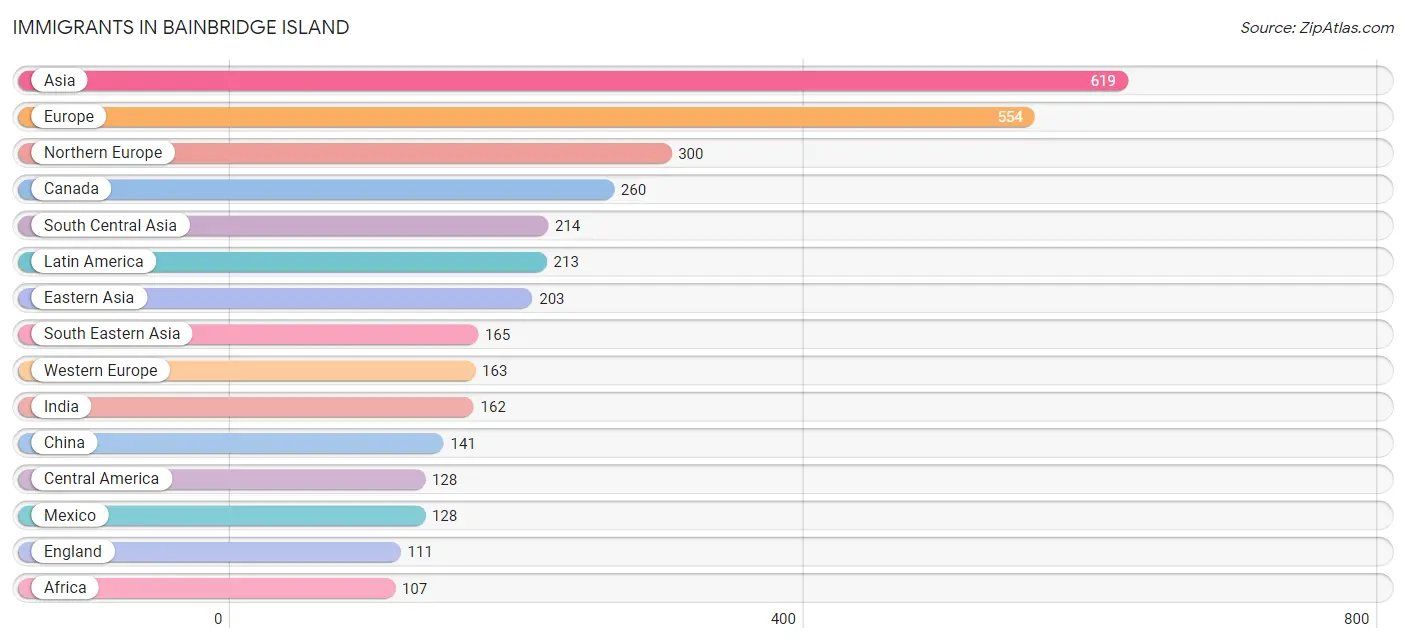
Immigrants in Bainbridge Island
The most numerous immigrant groups reported in Bainbridge Island came from Asia (619 | 2.5%), Europe (554 | 2.2%), Northern Europe (300 | 1.2%), Canada (260 | 1.1%), and South Central Asia (214 | 0.9%), together accounting for 7.9% of all Bainbridge Island residents.
| Immigration Origin | # Population | % Population |
| Africa | 107 | 0.4% |
| Argentina | 31 | 0.1% |
| Asia | 619 | 2.5% |
| Australia | 43 | 0.2% |
| Austria | 15 | 0.1% |
| Canada | 260 | 1.1% |
| Central America | 128 | 0.5% |
| Chile | 13 | 0.1% |
| China | 141 | 0.6% |
| Colombia | 22 | 0.1% |
| Czechoslovakia | 22 | 0.1% |
| Eastern Asia | 203 | 0.8% |
| Eastern Europe | 54 | 0.2% |
| Egypt | 9 | 0.0% |
| England | 111 | 0.4% |
| Europe | 554 | 2.2% |
| France | 58 | 0.2% |
| Germany | 78 | 0.3% |
| Guyana | 8 | 0.0% |
| Hong Kong | 18 | 0.1% |
| India | 162 | 0.7% |
| Indonesia | 18 | 0.1% |
| Iraq | 13 | 0.1% |
| Israel | 8 | 0.0% |
| Italy | 37 | 0.2% |
| Japan | 25 | 0.1% |
| Jordan | 16 | 0.1% |
| Korea | 37 | 0.2% |
| Laos | 12 | 0.1% |
| Latin America | 213 | 0.9% |
| Latvia | 5 | 0.0% |
| Mexico | 128 | 0.5% |
| Netherlands | 12 | 0.1% |
| Northern Africa | 9 | 0.0% |
| Northern Europe | 300 | 1.2% |
| Oceania | 60 | 0.2% |
| Pakistan | 52 | 0.2% |
| Philippines | 96 | 0.4% |
| Poland | 14 | 0.1% |
| Russia | 13 | 0.1% |
| Scotland | 13 | 0.1% |
| South Africa | 98 | 0.4% |
| South America | 85 | 0.3% |
| South Central Asia | 214 | 0.9% |
| South Eastern Asia | 165 | 0.7% |
| Southern Europe | 37 | 0.2% |
| Sweden | 29 | 0.1% |
| Taiwan | 47 | 0.2% |
| Thailand | 9 | 0.0% |
| Venezuela | 11 | 0.0% |
| Vietnam | 30 | 0.1% |
| Western Asia | 37 | 0.2% |
| Western Europe | 163 | 0.7% | View All 53 Rows |
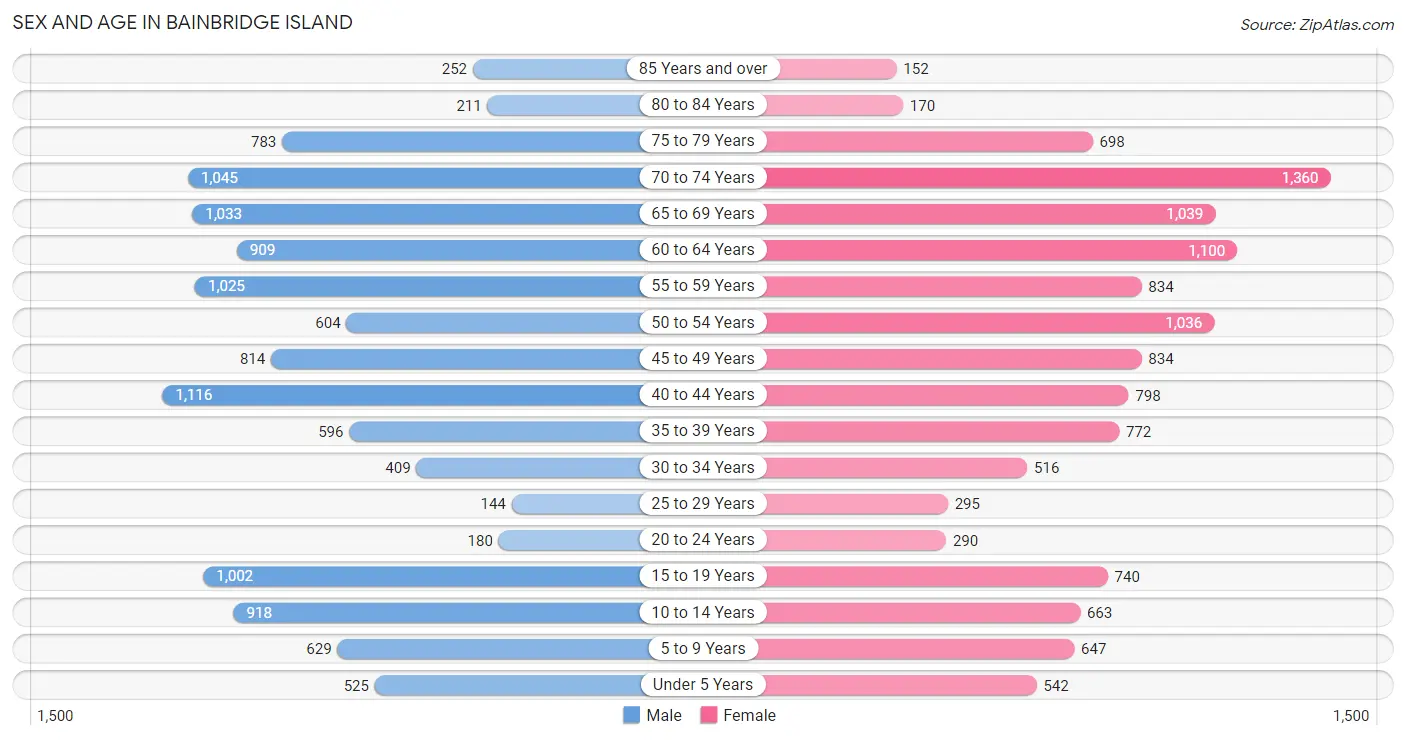
Sex and Age in Bainbridge Island
Sex and Age in Bainbridge Island
The most populous age groups in Bainbridge Island are 40 to 44 Years (1,116 | 9.1%) for men and 70 to 74 Years (1,360 | 10.9%) for women.
| Age Bracket | Male | Female |
| Under 5 Years | 525 (4.3%) | 542 (4.3%) |
| 5 to 9 Years | 629 (5.2%) | 647 (5.2%) |
| 10 to 14 Years | 918 (7.5%) | 663 (5.3%) |
| 15 to 19 Years | 1,002 (8.2%) | 740 (5.9%) |
| 20 to 24 Years | 180 (1.5%) | 290 (2.3%) |
| 25 to 29 Years | 144 (1.2%) | 295 (2.4%) |
| 30 to 34 Years | 409 (3.4%) | 516 (4.1%) |
| 35 to 39 Years | 596 (4.9%) | 772 (6.2%) |
| 40 to 44 Years | 1,116 (9.1%) | 798 (6.4%) |
| 45 to 49 Years | 814 (6.7%) | 834 (6.7%) |
| 50 to 54 Years | 604 (5.0%) | 1,036 (8.3%) |
| 55 to 59 Years | 1,025 (8.4%) | 834 (6.7%) |
| 60 to 64 Years | 909 (7.4%) | 1,100 (8.8%) |
| 65 to 69 Years | 1,033 (8.5%) | 1,039 (8.3%) |
| 70 to 74 Years | 1,045 (8.6%) | 1,360 (10.9%) |
| 75 to 79 Years | 783 (6.4%) | 698 (5.6%) |
| 80 to 84 Years | 211 (1.7%) | 170 (1.4%) |
| 85 Years and over | 252 (2.1%) | 152 (1.2%) |
| Total | 12,195 (100.0%) | 12,486 (100.0%) |
Families and Households in Bainbridge Island
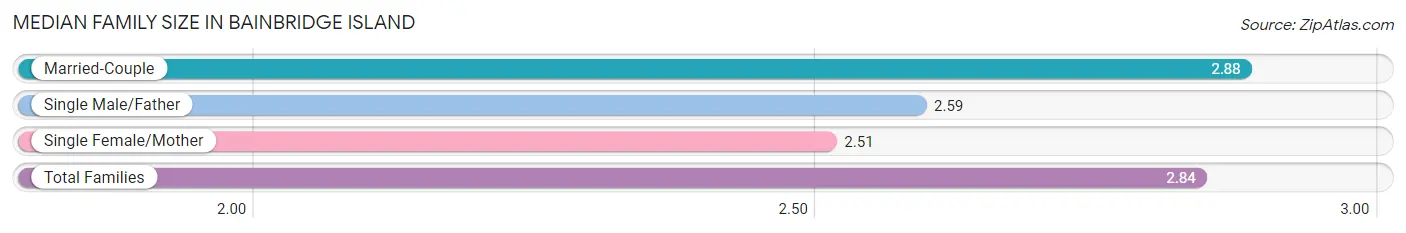
Median Family Size in Bainbridge Island
The median family size in Bainbridge Island is 2.84 persons per family, with married-couple families (6,451 | 87.3%) accounting for the largest median family size of 2.88 persons per family. On the other hand, single female/mother families (594 | 8.0%) represent the smallest median family size with 2.51 persons per family.
| Family Type | # Families | Family Size |
| Married-Couple | 6,451 (87.3%) | 2.88 |
| Single Male/Father | 348 (4.7%) | 2.59 |
| Single Female/Mother | 594 (8.0%) | 2.51 |
| Total Families | 7,393 (100.0%) | 2.84 |
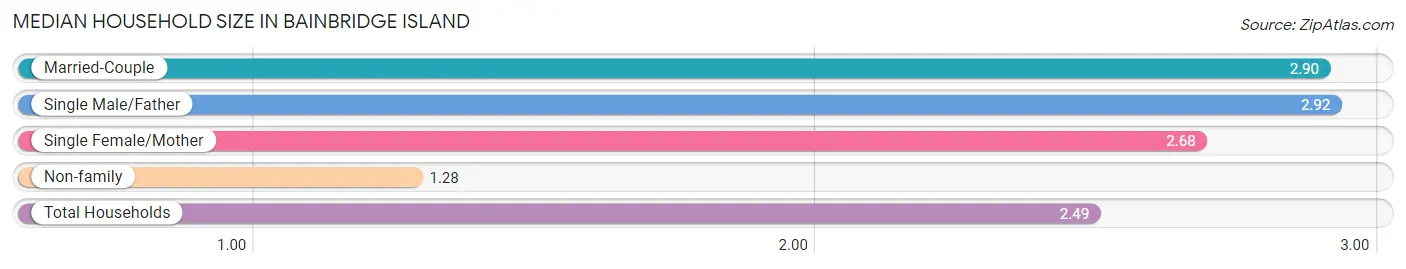
Median Household Size in Bainbridge Island
The median household size in Bainbridge Island is 2.49 persons per household, with single male/father households (348 | 3.5%) accounting for the largest median household size of 2.92 persons per household. non-family households (2,457 | 24.9%) represent the smallest median household size with 1.28 persons per household.
| Household Type | # Households | Household Size |
| Married-Couple | 6,451 (65.5%) | 2.90 |
| Single Male/Father | 348 (3.5%) | 2.92 |
| Single Female/Mother | 594 (6.0%) | 2.68 |
| Non-family | 2,457 (24.9%) | 1.28 |
| Total Households | 9,850 (100.0%) | 2.49 |
Household Size by Marriage Status in Bainbridge Island
Out of a total of 9,850 households in Bainbridge Island, 7,393 (75.1%) are family households, while 2,457 (24.9%) are nonfamily households. The most numerous type of family households are 2-person households, comprising 3,901, and the most common type of nonfamily households are 1-person households, comprising 1,953.
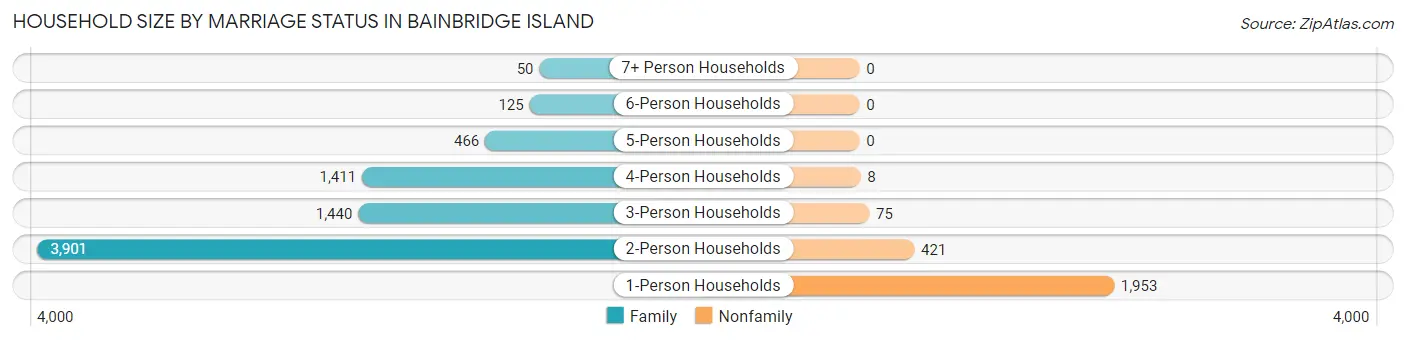
| Household Size | Family Households | Nonfamily Households |
| 1-Person Households | - | 1,953 (19.8%) |
| 2-Person Households | 3,901 (39.6%) | 421 (4.3%) |
| 3-Person Households | 1,440 (14.6%) | 75 (0.8%) |
| 4-Person Households | 1,411 (14.3%) | 8 (0.1%) |
| 5-Person Households | 466 (4.7%) | 0 (0.0%) |
| 6-Person Households | 125 (1.3%) | 0 (0.0%) |
| 7+ Person Households | 50 (0.5%) | 0 (0.0%) |
| Total | 7,393 (75.1%) | 2,457 (24.9%) |
Female Fertility in Bainbridge Island
Fertility by Age in Bainbridge Island
Average fertility rate in Bainbridge Island is 63.0 births per 1,000 women. Women in the age bracket of 20 to 34 years have the highest fertility rate with 142.0 births per 1,000 women. Women in the age bracket of 20 to 34 years acount for 55.1% of all women with births.
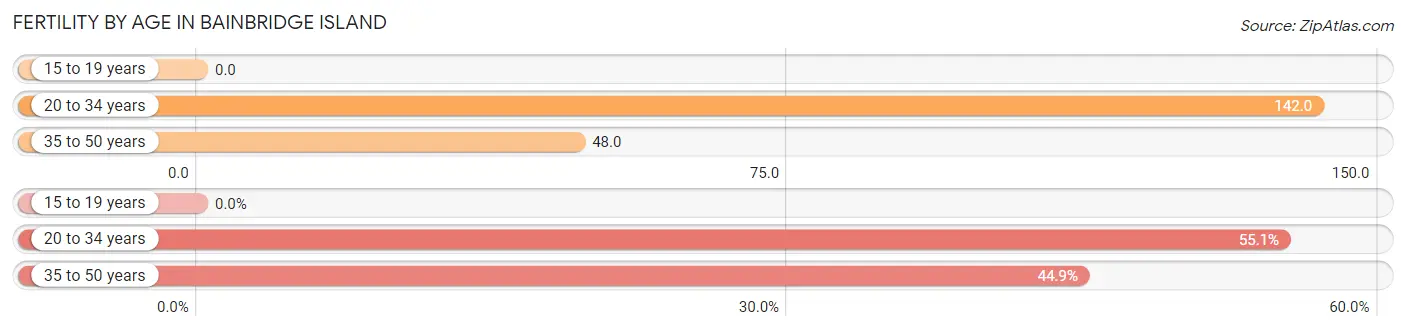
| Age Bracket | Women with Births | Births / 1,000 Women |
| 15 to 19 years | 0 (0.0%) | 0.0 |
| 20 to 34 years | 156 (55.1%) | 142.0 |
| 35 to 50 years | 127 (44.9%) | 48.0 |
| Total | 283 (100.0%) | 63.0 |
Fertility by Age by Marriage Status in Bainbridge Island
83.0% of women with births (283) in Bainbridge Island are married. The highest percentage of unmarried women with births falls into 35 to 50 years age bracket with 37.8% of them unmarried at the time of birth, while the lowest percentage of unmarried women with births belong to 20 to 34 years age bracket with 0.0% of them unmarried.
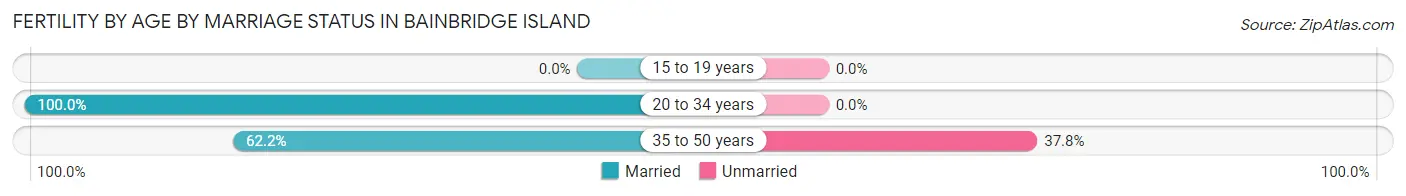
| Age Bracket | Married | Unmarried |
| 15 to 19 years | 0 (0.0%) | 0 (0.0%) |
| 20 to 34 years | 156 (100.0%) | 0 (0.0%) |
| 35 to 50 years | 79 (62.2%) | 48 (37.8%) |
| Total | 235 (83.0%) | 48 (17.0%) |
Fertility by Education in Bainbridge Island
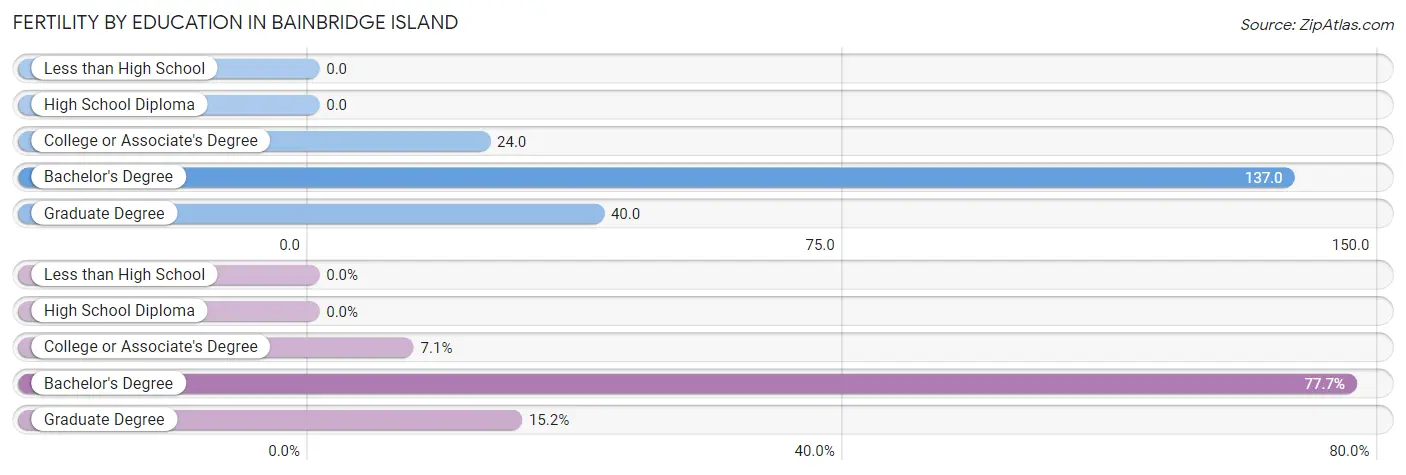
| Educational Attainment | Women with Births | Births / 1,000 Women |
| Less than High School | 0 (0.0%) | 0.0 |
| High School Diploma | 0 (0.0%) | 0.0 |
| College or Associate's Degree | 20 (7.1%) | 24.0 |
| Bachelor's Degree | 220 (77.7%) | 137.0 |
| Graduate Degree | 43 (15.2%) | 40.0 |
| Total | 283 (100.0%) | 63.0 |
Fertility by Education by Marriage Status in Bainbridge Island
17.0% of women with births in Bainbridge Island are unmarried. Women with the educational attainment of college or associate's degree are most likely to be married with 100.0% of them married at childbirth, while women with the educational attainment of bachelor's degree are least likely to be married with 21.8% of them unmarried at childbirth.
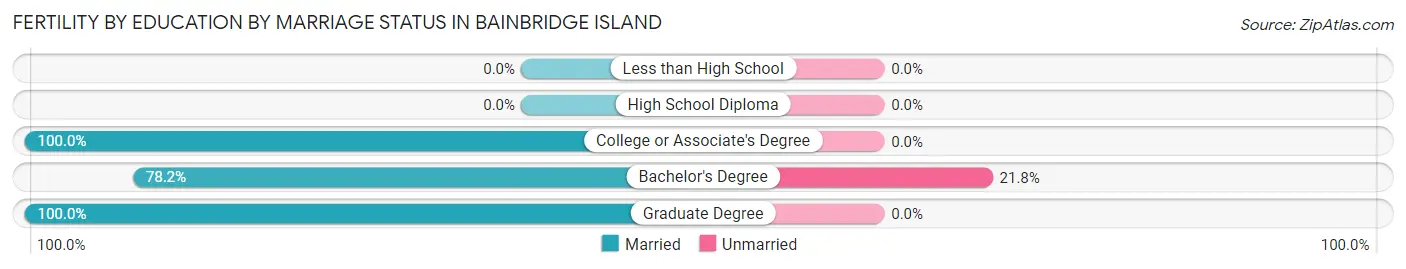
| Educational Attainment | Married | Unmarried |
| Less than High School | 0 (0.0%) | 0 (0.0%) |
| High School Diploma | 0 (0.0%) | 0 (0.0%) |
| College or Associate's Degree | 20 (100.0%) | 0 (0.0%) |
| Bachelor's Degree | 172 (78.2%) | 48 (21.8%) |
| Graduate Degree | 43 (100.0%) | 0 (0.0%) |
| Total | 235 (83.0%) | 48 (17.0%) |
Employment Characteristics in Bainbridge Island
Employment by Class of Employer in Bainbridge Island
Among the 11,160 employed individuals in Bainbridge Island, private company employees (6,254 | 56.0%), self-employed (not incorporated) (1,179 | 10.6%), and not-for-profit organizations (1,146 | 10.3%) make up the most common classes of employment.
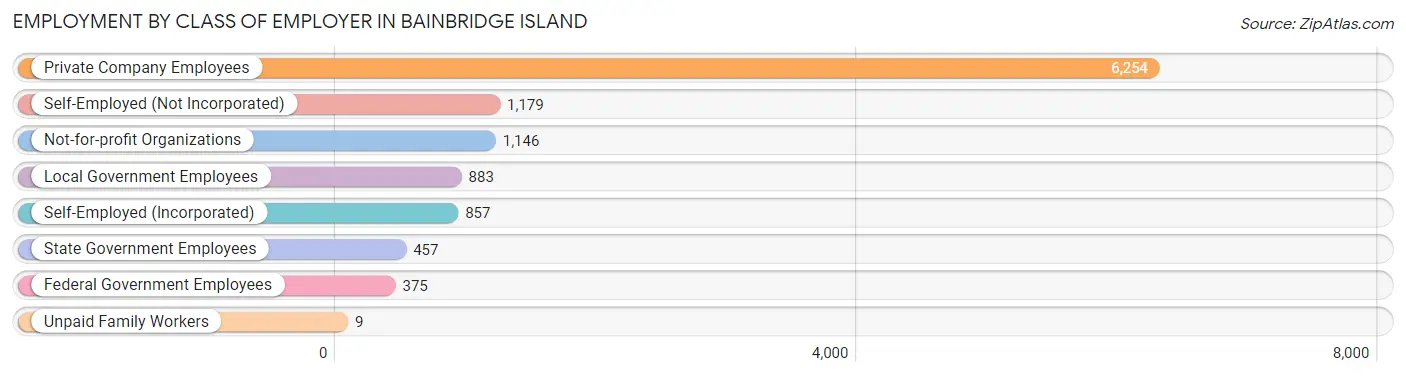
| Employer Class | # Employees | % Employees |
| Private Company Employees | 6,254 | 56.0% |
| Self-Employed (Incorporated) | 857 | 7.7% |
| Self-Employed (Not Incorporated) | 1,179 | 10.6% |
| Not-for-profit Organizations | 1,146 | 10.3% |
| Local Government Employees | 883 | 7.9% |
| State Government Employees | 457 | 4.1% |
| Federal Government Employees | 375 | 3.4% |
| Unpaid Family Workers | 9 | 0.1% |
| Total | 11,160 | 100.0% |
Employment Status by Age in Bainbridge Island
According to the labor force statistics for Bainbridge Island, out of the total population over 16 years of age (20,373), 57.8% or 11,776 individuals are in the labor force, with 2.9% or 342 of them unemployed. The age group with the highest labor force participation rate is 35 to 44 years, with 87.4% or 2,868 individuals in the labor force. Within the labor force, the 16 to 19 years age range has the highest percentage of unemployed individuals, with 11.3% or 66 of them being unemployed.
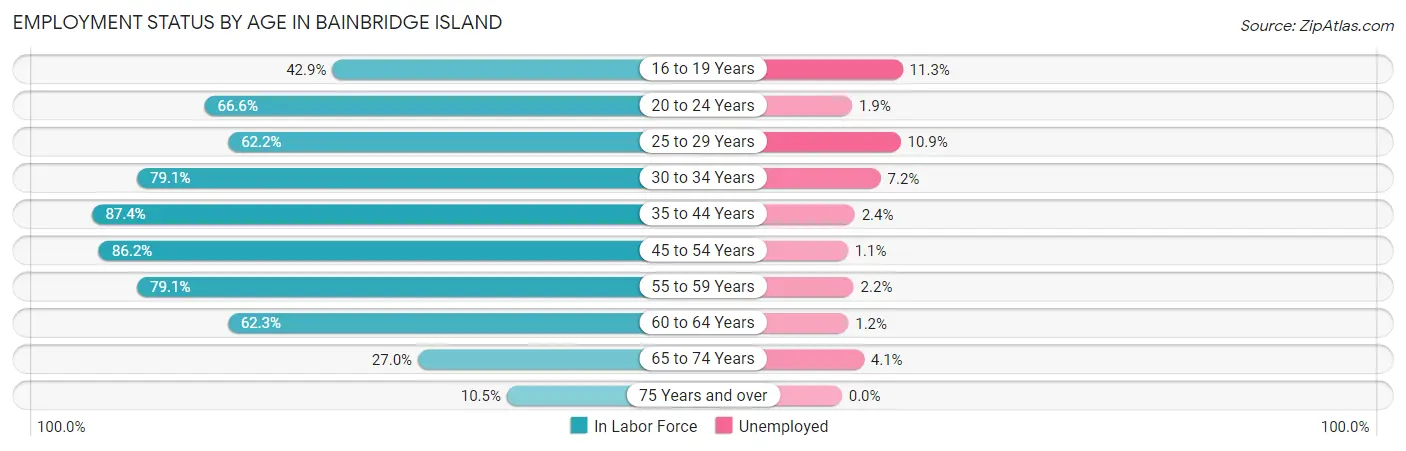
| Age Bracket | In Labor Force | Unemployed |
| 16 to 19 Years | 583 (42.9%) | 66 (11.3%) |
| 20 to 24 Years | 313 (66.6%) | 6 (1.9%) |
| 25 to 29 Years | 273 (62.2%) | 30 (10.9%) |
| 30 to 34 Years | 732 (79.1%) | 53 (7.2%) |
| 35 to 44 Years | 2,868 (87.4%) | 69 (2.4%) |
| 45 to 54 Years | 2,834 (86.2%) | 31 (1.1%) |
| 55 to 59 Years | 1,470 (79.1%) | 32 (2.2%) |
| 60 to 64 Years | 1,252 (62.3%) | 15 (1.2%) |
| 65 to 74 Years | 1,209 (27.0%) | 50 (4.1%) |
| 75 Years and over | 238 (10.5%) | 0 (0.0%) |
| Total | 11,776 (57.8%) | 342 (2.9%) |
Employment Status by Educational Attainment in Bainbridge Island
According to labor force statistics for Bainbridge Island, 79.9% of individuals (9,430) out of the total population between 25 and 64 years of age (11,802) are in the labor force, with 2.4% or 226 of them being unemployed. The group with the highest labor force participation rate are those with the educational attainment of bachelor's degree or higher, with 83.4% or 7,294 individuals in the labor force. Within the labor force, individuals with less than high school education have the highest percentage of unemployment, with 28.6% or 8 of them being unemployed.
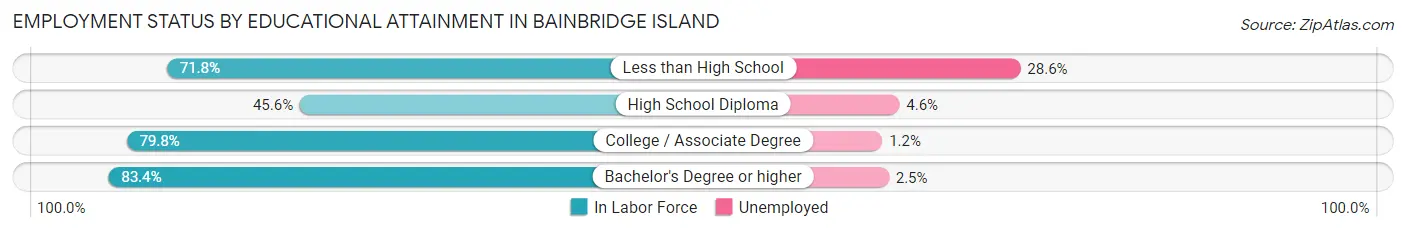
| Educational Attainment | In Labor Force | Unemployed |
| Less than High School | 28 (71.8%) | 11 (28.6%) |
| High School Diploma | 394 (45.6%) | 40 (4.6%) |
| College / Associate Degree | 1,718 (79.8%) | 26 (1.2%) |
| Bachelor's Degree or higher | 7,294 (83.4%) | 219 (2.5%) |
| Total | 9,430 (79.9%) | 283 (2.4%) |
Employment Occupations by Sex in Bainbridge Island
Management, Business, Science and Arts Occupations
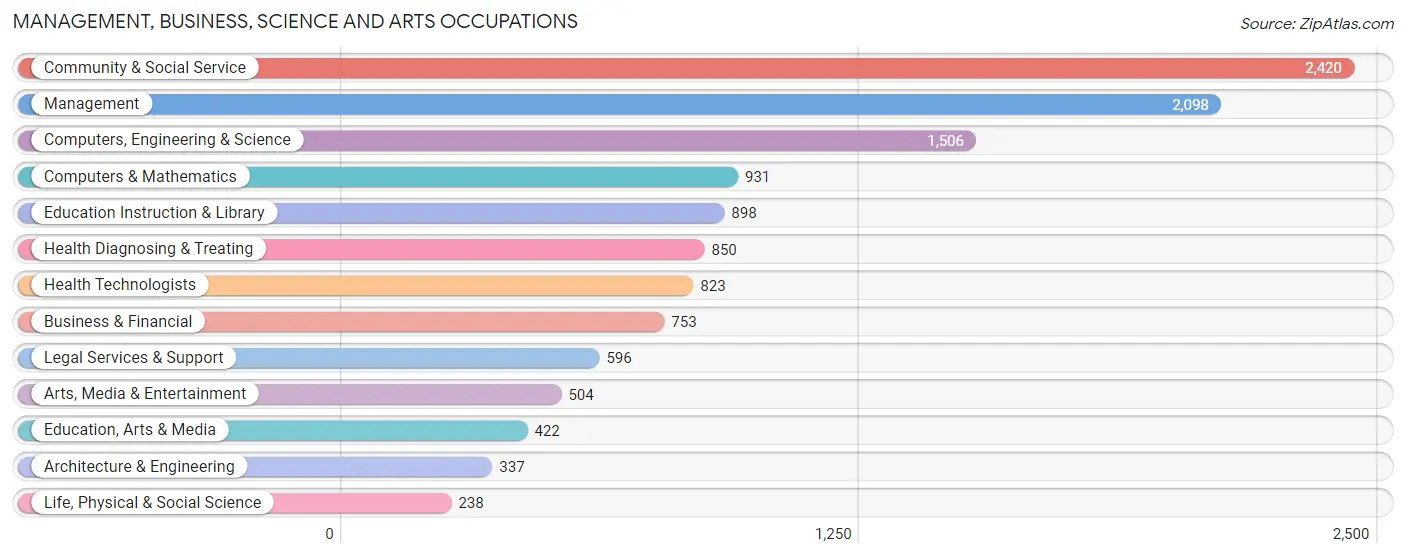
The most common Management, Business, Science and Arts occupations in Bainbridge Island are Community & Social Service (2,420 | 21.3%), Management (2,098 | 18.5%), Computers, Engineering & Science (1,506 | 13.3%), Computers & Mathematics (931 | 8.2%), and Education Instruction & Library (898 | 7.9%).
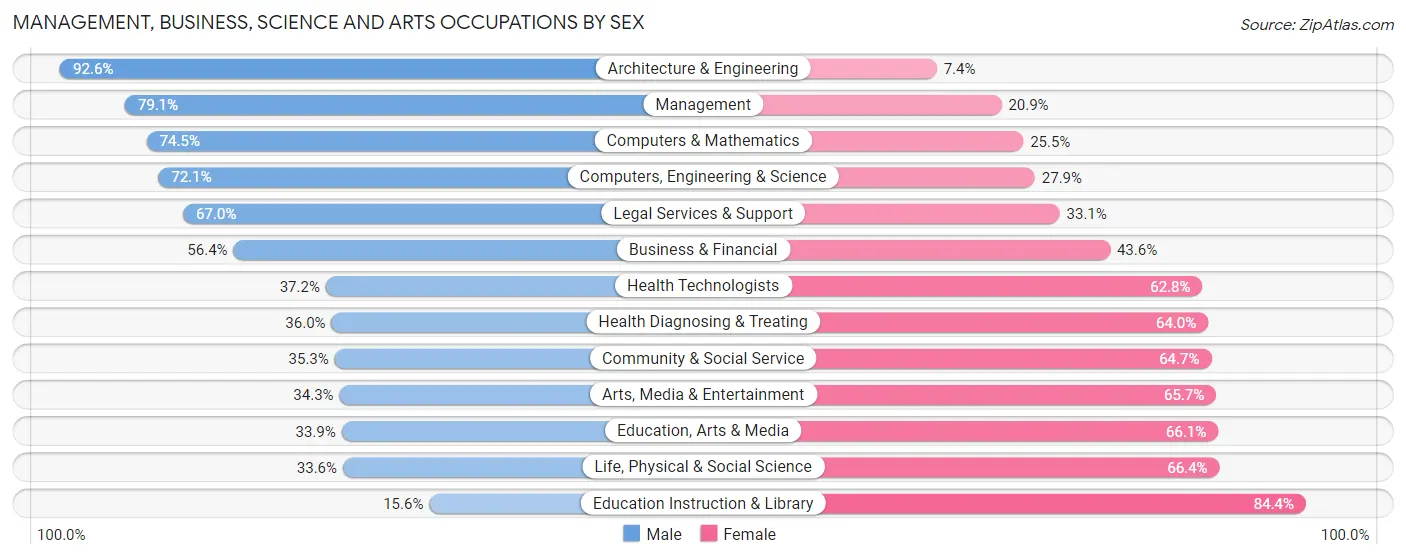
Management, Business, Science and Arts Occupations by Sex
Within the Management, Business, Science and Arts occupations in Bainbridge Island, the most male-oriented occupations are Architecture & Engineering (92.6%), Management (79.1%), and Computers & Mathematics (74.5%), while the most female-oriented occupations are Education Instruction & Library (84.4%), Life, Physical & Social Science (66.4%), and Education, Arts & Media (66.1%).
| Occupation | Male | Female |
| Management | 1,659 (79.1%) | 439 (20.9%) |
| Business & Financial | 425 (56.4%) | 328 (43.6%) |
| Computers, Engineering & Science | 1,086 (72.1%) | 420 (27.9%) |
| Computers & Mathematics | 694 (74.5%) | 237 (25.5%) |
| Architecture & Engineering | 312 (92.6%) | 25 (7.4%) |
| Life, Physical & Social Science | 80 (33.6%) | 158 (66.4%) |
| Community & Social Service | 855 (35.3%) | 1,565 (64.7%) |
| Education, Arts & Media | 143 (33.9%) | 279 (66.1%) |
| Legal Services & Support | 399 (66.9%) | 197 (33.1%) |
| Education Instruction & Library | 140 (15.6%) | 758 (84.4%) |
| Arts, Media & Entertainment | 173 (34.3%) | 331 (65.7%) |
| Health Diagnosing & Treating | 306 (36.0%) | 544 (64.0%) |
| Health Technologists | 306 (37.2%) | 517 (62.8%) |
| Total (Category) | 4,331 (56.8%) | 3,296 (43.2%) |
| Total (Overall) | 6,157 (54.2%) | 5,207 (45.8%) |
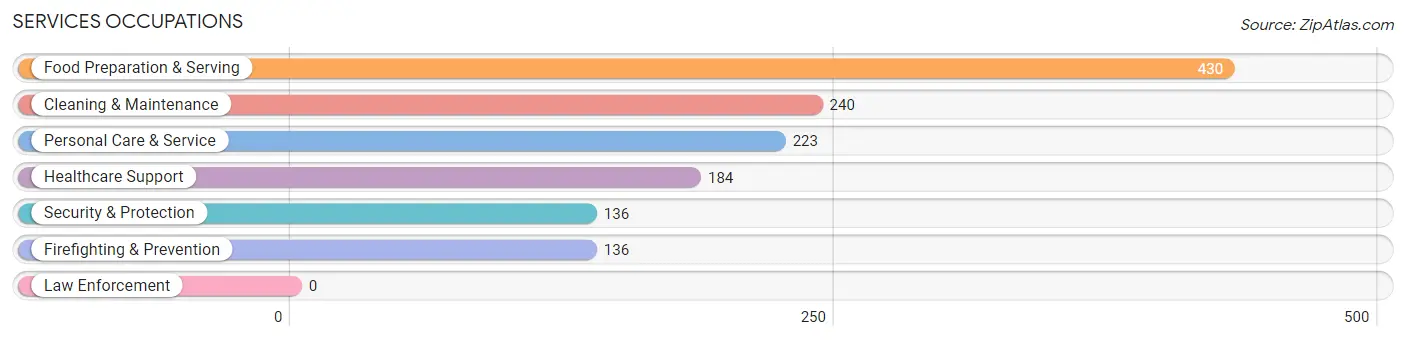
Services Occupations
The most common Services occupations in Bainbridge Island are Food Preparation & Serving (430 | 3.8%), Cleaning & Maintenance (240 | 2.1%), Personal Care & Service (223 | 2.0%), Healthcare Support (184 | 1.6%), and Security & Protection (136 | 1.2%).
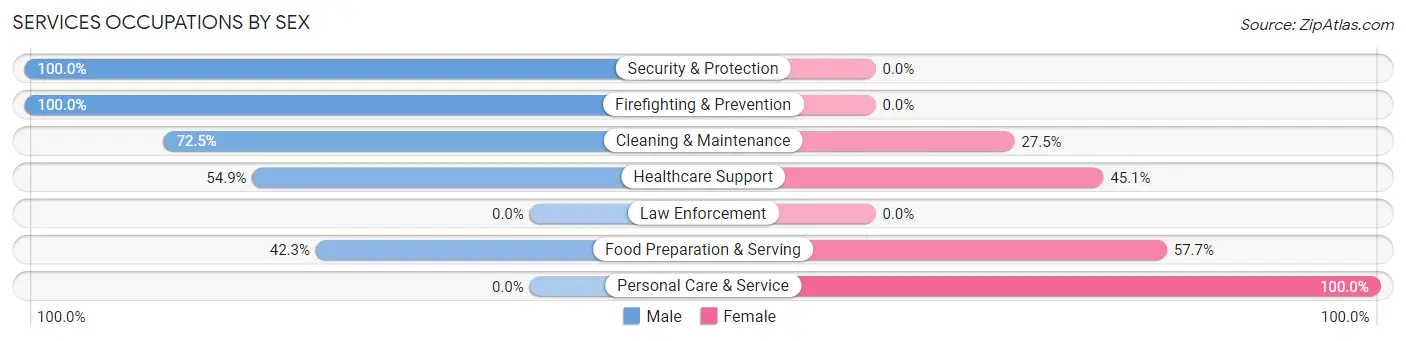
Services Occupations by Sex
Within the Services occupations in Bainbridge Island, the most male-oriented occupations are Security & Protection (100.0%), Firefighting & Prevention (100.0%), and Cleaning & Maintenance (72.5%), while the most female-oriented occupations are Personal Care & Service (100.0%), Food Preparation & Serving (57.7%), and Healthcare Support (45.1%).
| Occupation | Male | Female |
| Healthcare Support | 101 (54.9%) | 83 (45.1%) |
| Security & Protection | 136 (100.0%) | 0 (0.0%) |
| Firefighting & Prevention | 136 (100.0%) | 0 (0.0%) |
| Law Enforcement | 0 (0.0%) | 0 (0.0%) |
| Food Preparation & Serving | 182 (42.3%) | 248 (57.7%) |
| Cleaning & Maintenance | 174 (72.5%) | 66 (27.5%) |
| Personal Care & Service | 0 (0.0%) | 223 (100.0%) |
| Total (Category) | 593 (48.9%) | 620 (51.1%) |
| Total (Overall) | 6,157 (54.2%) | 5,207 (45.8%) |
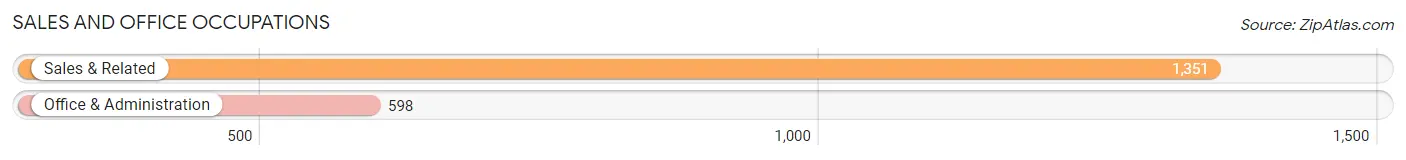
Sales and Office Occupations
The most common Sales and Office occupations in Bainbridge Island are Sales & Related (1,351 | 11.9%), and Office & Administration (598 | 5.3%).
Sales and Office Occupations by Sex
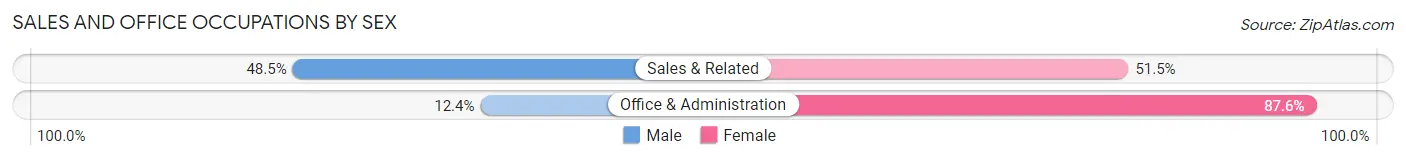
| Occupation | Male | Female |
| Sales & Related | 655 (48.5%) | 696 (51.5%) |
| Office & Administration | 74 (12.4%) | 524 (87.6%) |
| Total (Category) | 729 (37.4%) | 1,220 (62.6%) |
| Total (Overall) | 6,157 (54.2%) | 5,207 (45.8%) |
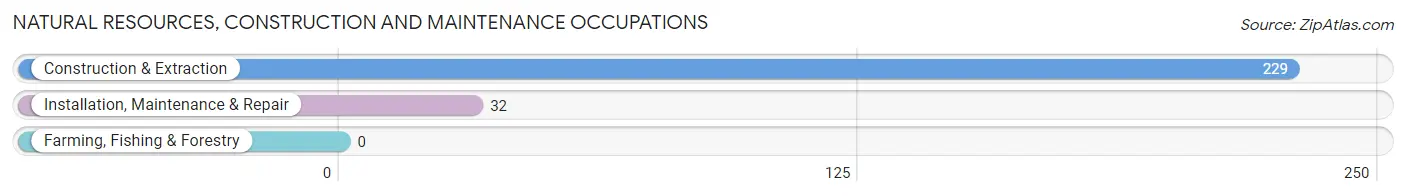
Natural Resources, Construction and Maintenance Occupations
The most common Natural Resources, Construction and Maintenance occupations in Bainbridge Island are Construction & Extraction (229 | 2.0%), and Installation, Maintenance & Repair (32 | 0.3%).
Natural Resources, Construction and Maintenance Occupations by Sex
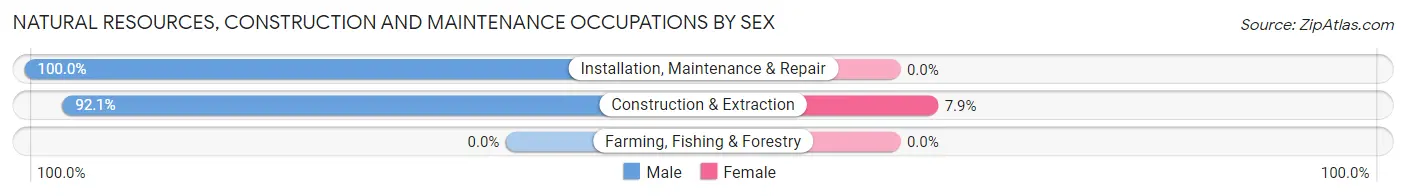
| Occupation | Male | Female |
| Farming, Fishing & Forestry | 0 (0.0%) | 0 (0.0%) |
| Construction & Extraction | 211 (92.1%) | 18 (7.9%) |
| Installation, Maintenance & Repair | 32 (100.0%) | 0 (0.0%) |
| Total (Category) | 243 (93.1%) | 18 (6.9%) |
| Total (Overall) | 6,157 (54.2%) | 5,207 (45.8%) |
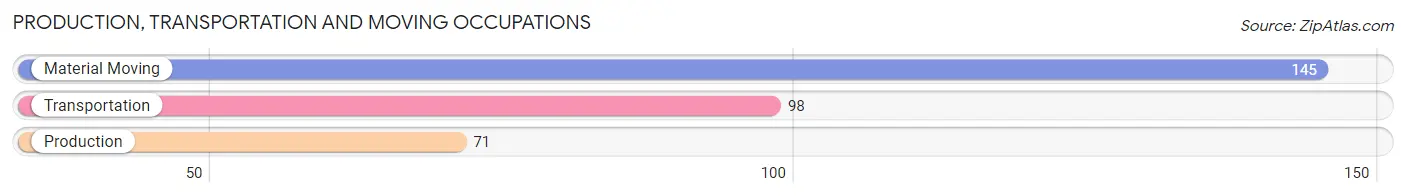
Production, Transportation and Moving Occupations
The most common Production, Transportation and Moving occupations in Bainbridge Island are Material Moving (145 | 1.3%), Transportation (98 | 0.9%), and Production (71 | 0.6%).
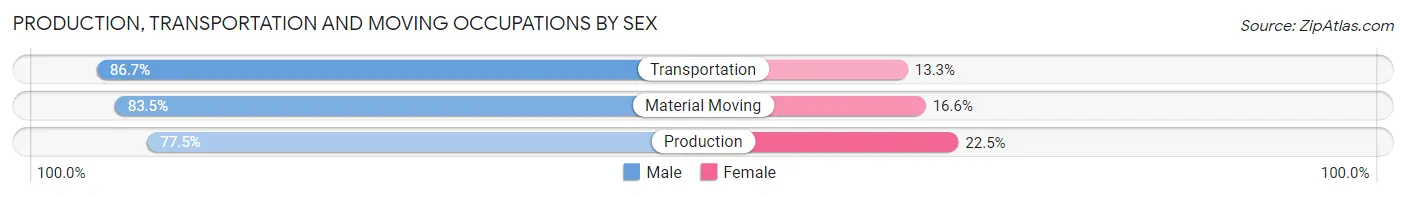
Production, Transportation and Moving Occupations by Sex
| Occupation | Male | Female |
| Production | 55 (77.5%) | 16 (22.5%) |
| Transportation | 85 (86.7%) | 13 (13.3%) |
| Material Moving | 121 (83.5%) | 24 (16.6%) |
| Total (Category) | 261 (83.1%) | 53 (16.9%) |
| Total (Overall) | 6,157 (54.2%) | 5,207 (45.8%) |
Employment Industries by Sex in Bainbridge Island
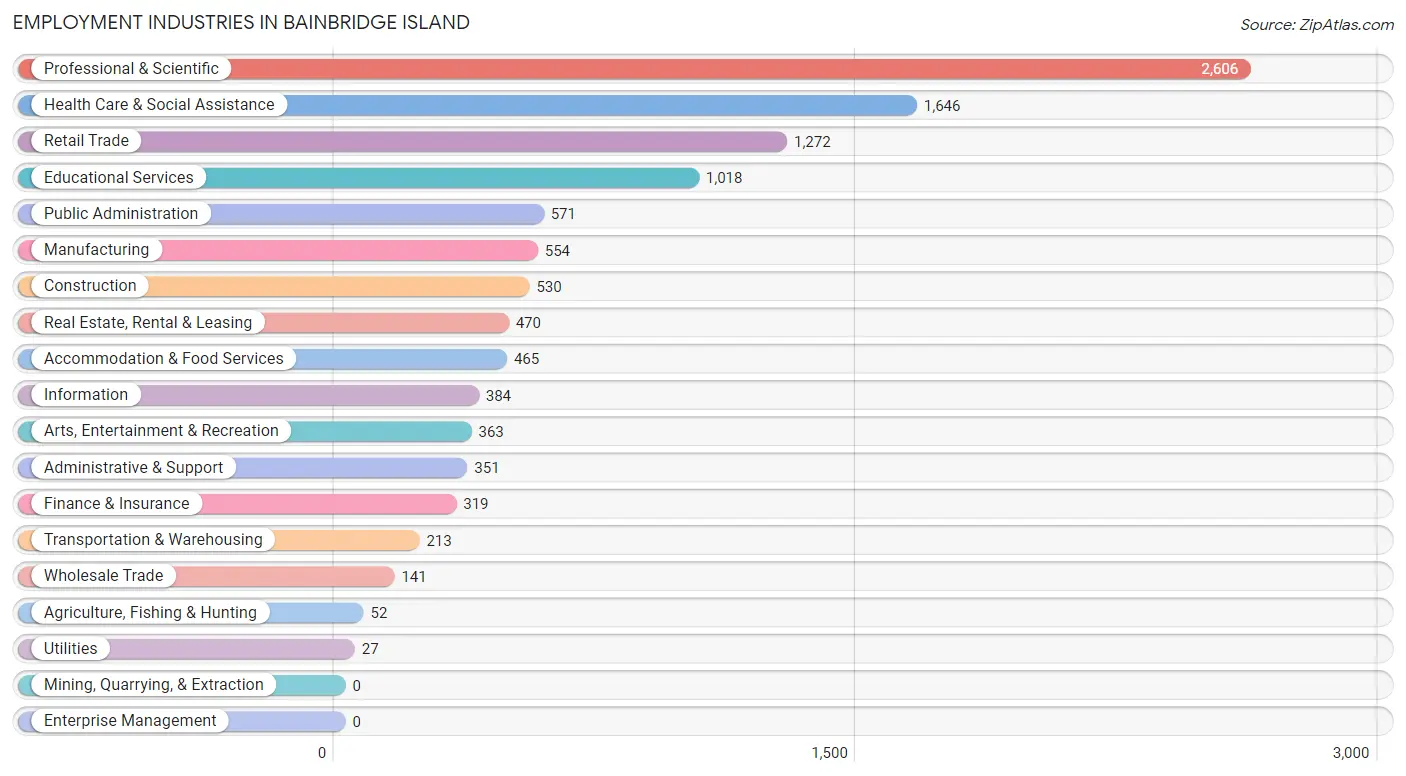
Employment Industries in Bainbridge Island
The major employment industries in Bainbridge Island include Professional & Scientific (2,606 | 22.9%), Health Care & Social Assistance (1,646 | 14.5%), Retail Trade (1,272 | 11.2%), Educational Services (1,018 | 9.0%), and Public Administration (571 | 5.0%).
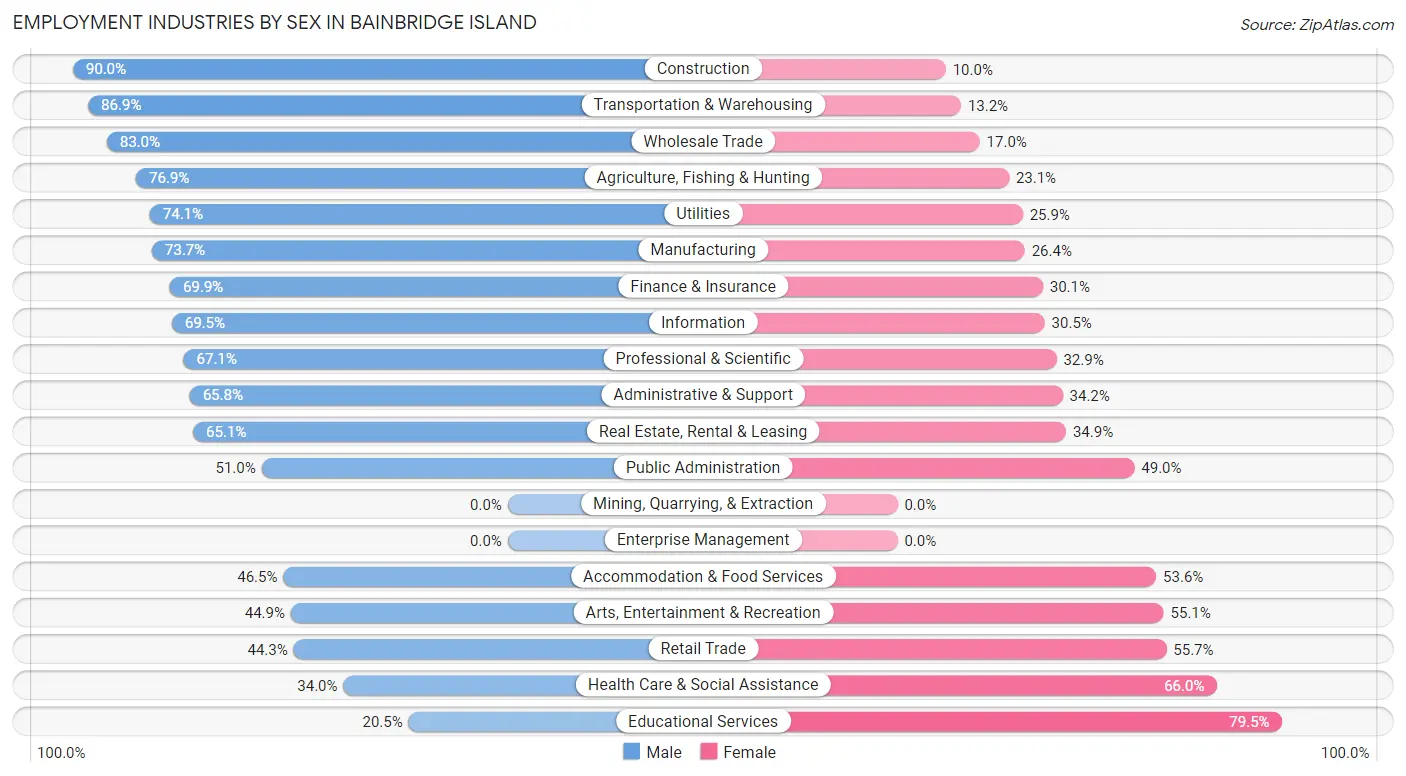
Employment Industries by Sex in Bainbridge Island
The Bainbridge Island industries that see more men than women are Construction (90.0%), Transportation & Warehousing (86.9%), and Wholesale Trade (83.0%), whereas the industries that tend to have a higher number of women are Educational Services (79.5%), Health Care & Social Assistance (66.0%), and Retail Trade (55.7%).
| Industry | Male | Female |
| Agriculture, Fishing & Hunting | 40 (76.9%) | 12 (23.1%) |
| Mining, Quarrying, & Extraction | 0 (0.0%) | 0 (0.0%) |
| Construction | 477 (90.0%) | 53 (10.0%) |
| Manufacturing | 408 (73.7%) | 146 (26.4%) |
| Wholesale Trade | 117 (83.0%) | 24 (17.0%) |
| Retail Trade | 564 (44.3%) | 708 (55.7%) |
| Transportation & Warehousing | 185 (86.9%) | 28 (13.2%) |
| Utilities | 20 (74.1%) | 7 (25.9%) |
| Information | 267 (69.5%) | 117 (30.5%) |
| Finance & Insurance | 223 (69.9%) | 96 (30.1%) |
| Real Estate, Rental & Leasing | 306 (65.1%) | 164 (34.9%) |
| Professional & Scientific | 1,748 (67.1%) | 858 (32.9%) |
| Enterprise Management | 0 (0.0%) | 0 (0.0%) |
| Administrative & Support | 231 (65.8%) | 120 (34.2%) |
| Educational Services | 209 (20.5%) | 809 (79.5%) |
| Health Care & Social Assistance | 560 (34.0%) | 1,086 (66.0%) |
| Arts, Entertainment & Recreation | 163 (44.9%) | 200 (55.1%) |
| Accommodation & Food Services | 216 (46.5%) | 249 (53.5%) |
| Public Administration | 291 (51.0%) | 280 (49.0%) |
| Total | 6,157 (54.2%) | 5,207 (45.8%) |
Education in Bainbridge Island
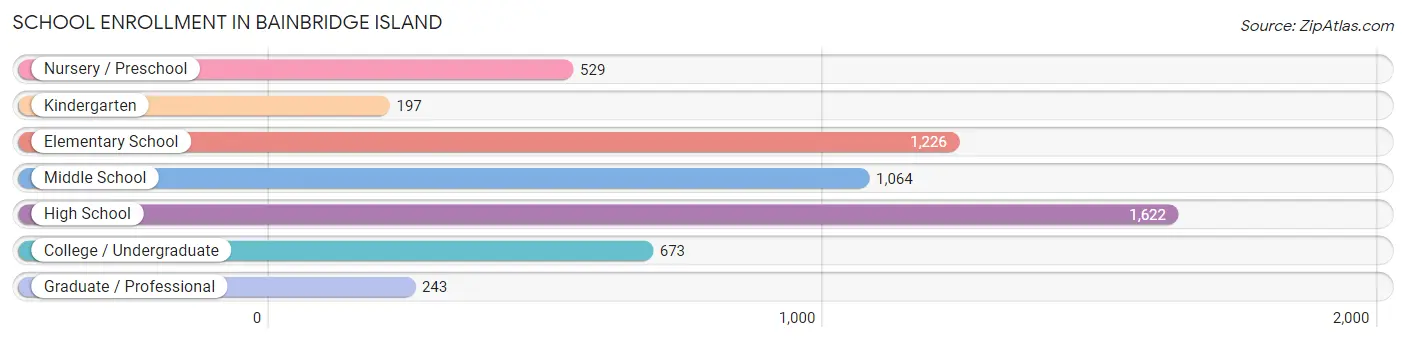
School Enrollment in Bainbridge Island
The most common levels of schooling among the 5,554 students in Bainbridge Island are high school (1,622 | 29.2%), elementary school (1,226 | 22.1%), and middle school (1,064 | 19.2%).
| School Level | # Students | % Students |
| Nursery / Preschool | 529 | 9.5% |
| Kindergarten | 197 | 3.5% |
| Elementary School | 1,226 | 22.1% |
| Middle School | 1,064 | 19.2% |
| High School | 1,622 | 29.2% |
| College / Undergraduate | 673 | 12.1% |
| Graduate / Professional | 243 | 4.4% |
| Total | 5,554 | 100.0% |
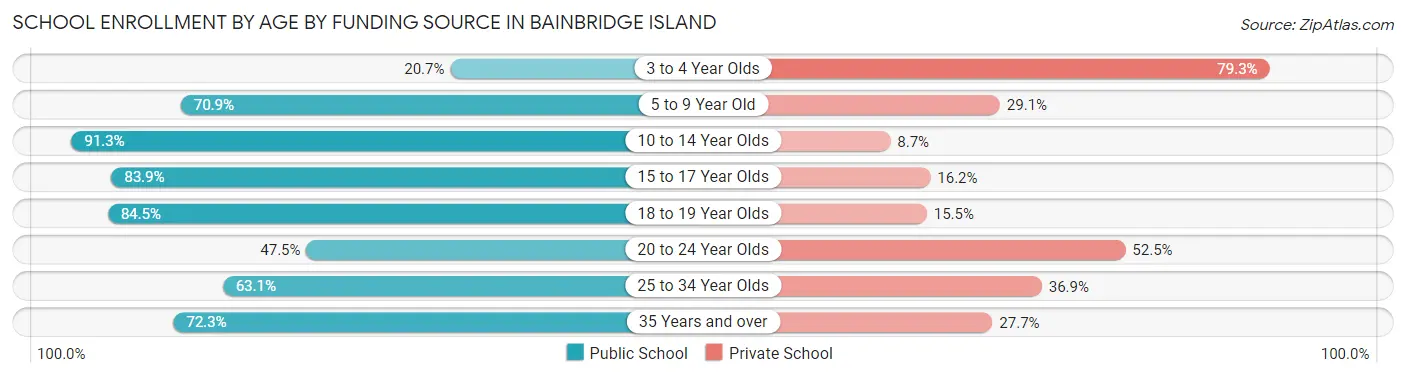
School Enrollment by Age by Funding Source in Bainbridge Island
Out of a total of 5,554 students who are enrolled in schools in Bainbridge Island, 1,361 (24.5%) attend a private institution, while the remaining 4,193 (75.5%) are enrolled in public schools. The age group of 3 to 4 year olds has the highest likelihood of being enrolled in private schools, with 333 (79.3% in the age bracket) enrolled. Conversely, the age group of 10 to 14 year olds has the lowest likelihood of being enrolled in a private school, with 1,395 (91.3% in the age bracket) attending a public institution.
| Age Bracket | Public School | Private School |
| 3 to 4 Year Olds | 87 (20.7%) | 333 (79.3%) |
| 5 to 9 Year Old | 899 (70.9%) | 369 (29.1%) |
| 10 to 14 Year Olds | 1,395 (91.3%) | 133 (8.7%) |
| 15 to 17 Year Olds | 1,007 (83.9%) | 194 (16.2%) |
| 18 to 19 Year Olds | 344 (84.5%) | 63 (15.5%) |
| 20 to 24 Year Olds | 96 (47.5%) | 106 (52.5%) |
| 25 to 34 Year Olds | 94 (63.1%) | 55 (36.9%) |
| 35 Years and over | 274 (72.3%) | 105 (27.7%) |
| Total | 4,193 (75.5%) | 1,361 (24.5%) |
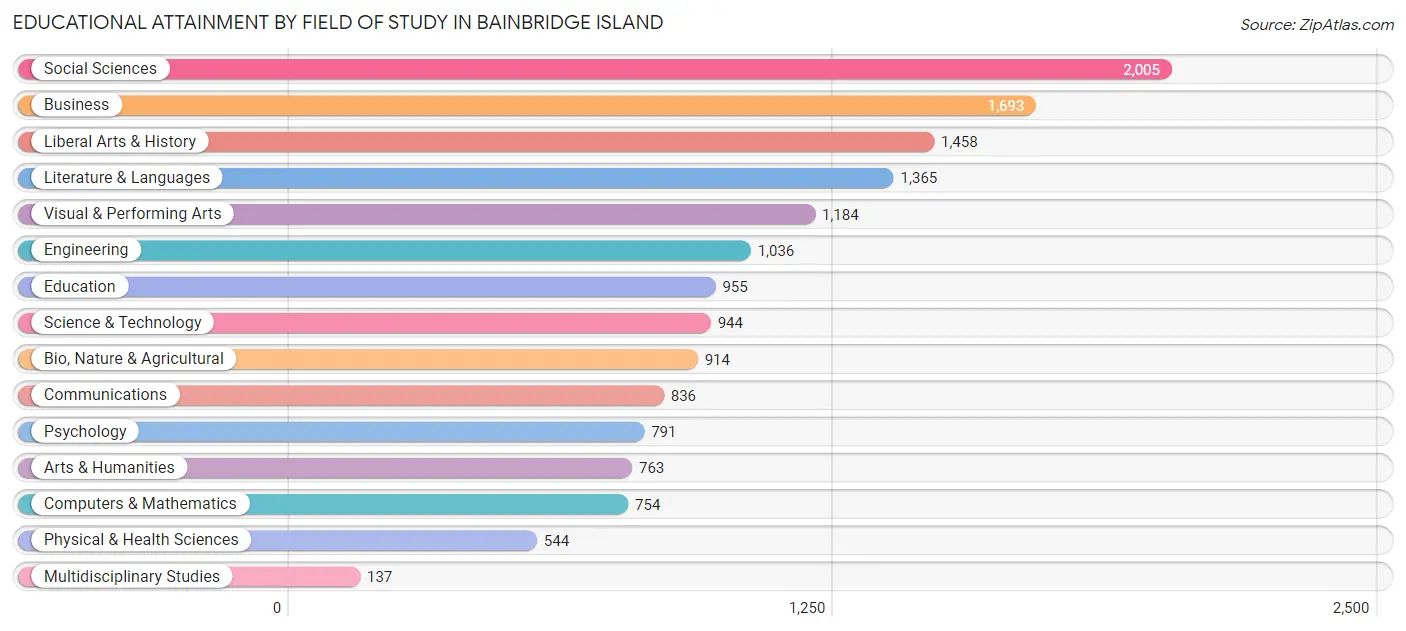
Educational Attainment by Field of Study in Bainbridge Island
Social sciences (2,005 | 13.0%), business (1,693 | 11.0%), liberal arts & history (1,458 | 9.5%), literature & languages (1,365 | 8.9%), and visual & performing arts (1,184 | 7.7%) are the most common fields of study among 15,379 individuals in Bainbridge Island who have obtained a bachelor's degree or higher.
| Field of Study | # Graduates | % Graduates |
| Computers & Mathematics | 754 | 4.9% |
| Bio, Nature & Agricultural | 914 | 5.9% |
| Physical & Health Sciences | 544 | 3.5% |
| Psychology | 791 | 5.1% |
| Social Sciences | 2,005 | 13.0% |
| Engineering | 1,036 | 6.7% |
| Multidisciplinary Studies | 137 | 0.9% |
| Science & Technology | 944 | 6.1% |
| Business | 1,693 | 11.0% |
| Education | 955 | 6.2% |
| Literature & Languages | 1,365 | 8.9% |
| Liberal Arts & History | 1,458 | 9.5% |
| Visual & Performing Arts | 1,184 | 7.7% |
| Communications | 836 | 5.4% |
| Arts & Humanities | 763 | 5.0% |
| Total | 15,379 | 100.0% |
Transportation & Commute in Bainbridge Island
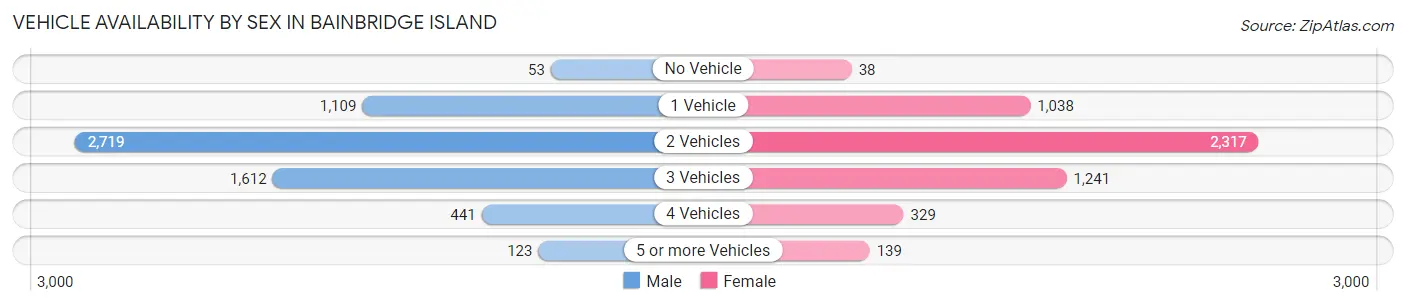
Vehicle Availability by Sex in Bainbridge Island
The most prevalent vehicle ownership categories in Bainbridge Island are males with 2 vehicles (2,719, accounting for 44.9%) and females with 2 vehicles (2,317, making up 53.3%).
| Vehicles Available | Male | Female |
| No Vehicle | 53 (0.9%) | 38 (0.7%) |
| 1 Vehicle | 1,109 (18.3%) | 1,038 (20.3%) |
| 2 Vehicles | 2,719 (44.9%) | 2,317 (45.4%) |
| 3 Vehicles | 1,612 (26.6%) | 1,241 (24.3%) |
| 4 Vehicles | 441 (7.3%) | 329 (6.5%) |
| 5 or more Vehicles | 123 (2.0%) | 139 (2.7%) |
| Total | 6,057 (100.0%) | 5,102 (100.0%) |
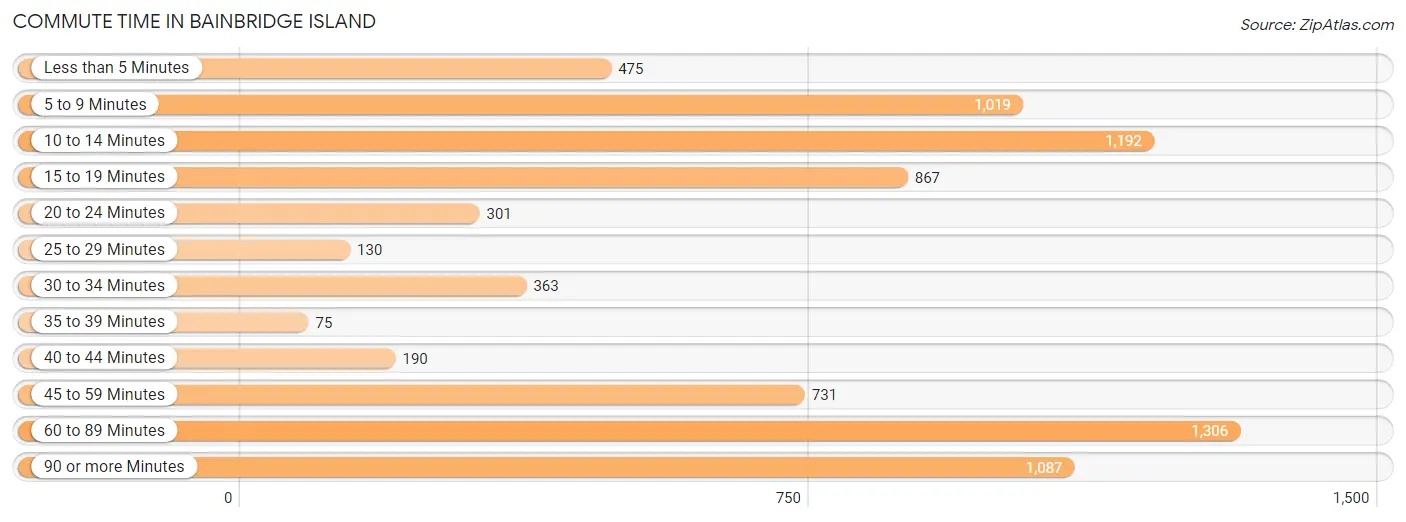
Commute Time in Bainbridge Island
The most frequently occuring commute durations in Bainbridge Island are 60 to 89 minutes (1,306 commuters, 16.9%), 10 to 14 minutes (1,192 commuters, 15.4%), and 90 or more minutes (1,087 commuters, 14.1%).
| Commute Time | # Commuters | % Commuters |
| Less than 5 Minutes | 475 | 6.1% |
| 5 to 9 Minutes | 1,019 | 13.2% |
| 10 to 14 Minutes | 1,192 | 15.4% |
| 15 to 19 Minutes | 867 | 11.2% |
| 20 to 24 Minutes | 301 | 3.9% |
| 25 to 29 Minutes | 130 | 1.7% |
| 30 to 34 Minutes | 363 | 4.7% |
| 35 to 39 Minutes | 75 | 1.0% |
| 40 to 44 Minutes | 190 | 2.5% |
| 45 to 59 Minutes | 731 | 9.5% |
| 60 to 89 Minutes | 1,306 | 16.9% |
| 90 or more Minutes | 1,087 | 14.1% |
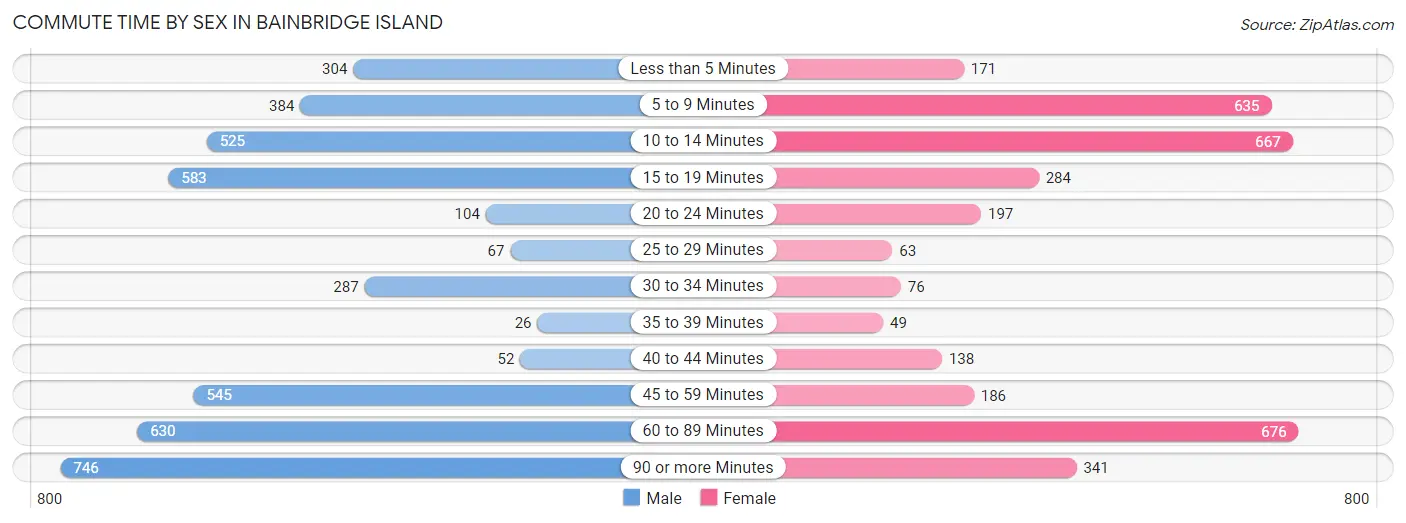
Commute Time by Sex in Bainbridge Island
The most common commute times in Bainbridge Island are 90 or more minutes (746 commuters, 17.5%) for males and 60 to 89 minutes (676 commuters, 19.4%) for females.
| Commute Time | Male | Female |
| Less than 5 Minutes | 304 (7.1%) | 171 (4.9%) |
| 5 to 9 Minutes | 384 (9.0%) | 635 (18.2%) |
| 10 to 14 Minutes | 525 (12.3%) | 667 (19.2%) |
| 15 to 19 Minutes | 583 (13.7%) | 284 (8.2%) |
| 20 to 24 Minutes | 104 (2.5%) | 197 (5.7%) |
| 25 to 29 Minutes | 67 (1.6%) | 63 (1.8%) |
| 30 to 34 Minutes | 287 (6.8%) | 76 (2.2%) |
| 35 to 39 Minutes | 26 (0.6%) | 49 (1.4%) |
| 40 to 44 Minutes | 52 (1.2%) | 138 (4.0%) |
| 45 to 59 Minutes | 545 (12.8%) | 186 (5.3%) |
| 60 to 89 Minutes | 630 (14.8%) | 676 (19.4%) |
| 90 or more Minutes | 746 (17.5%) | 341 (9.8%) |
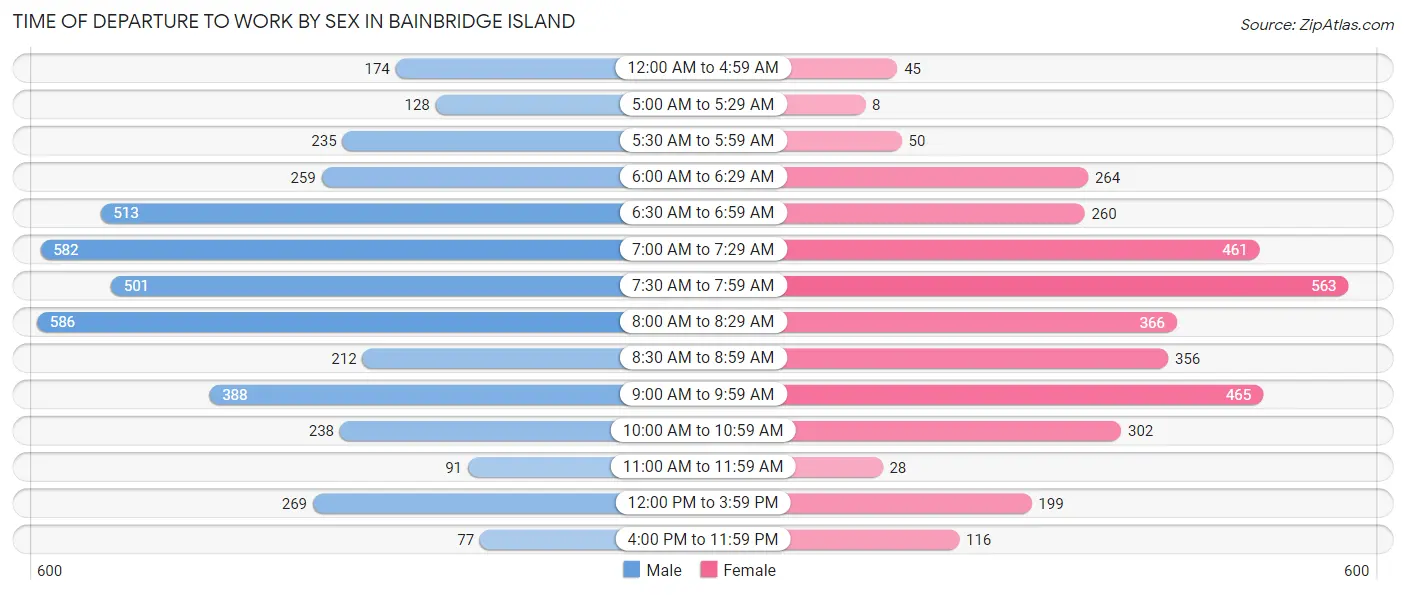
Time of Departure to Work by Sex in Bainbridge Island
The most frequent times of departure to work in Bainbridge Island are 8:00 AM to 8:29 AM (586, 13.8%) for males and 7:30 AM to 7:59 AM (563, 16.2%) for females.
| Time of Departure | Male | Female |
| 12:00 AM to 4:59 AM | 174 (4.1%) | 45 (1.3%) |
| 5:00 AM to 5:29 AM | 128 (3.0%) | 8 (0.2%) |
| 5:30 AM to 5:59 AM | 235 (5.5%) | 50 (1.4%) |
| 6:00 AM to 6:29 AM | 259 (6.1%) | 264 (7.6%) |
| 6:30 AM to 6:59 AM | 513 (12.1%) | 260 (7.5%) |
| 7:00 AM to 7:29 AM | 582 (13.7%) | 461 (13.2%) |
| 7:30 AM to 7:59 AM | 501 (11.8%) | 563 (16.2%) |
| 8:00 AM to 8:29 AM | 586 (13.8%) | 366 (10.5%) |
| 8:30 AM to 8:59 AM | 212 (5.0%) | 356 (10.2%) |
| 9:00 AM to 9:59 AM | 388 (9.1%) | 465 (13.4%) |
| 10:00 AM to 10:59 AM | 238 (5.6%) | 302 (8.7%) |
| 11:00 AM to 11:59 AM | 91 (2.1%) | 28 (0.8%) |
| 12:00 PM to 3:59 PM | 269 (6.3%) | 199 (5.7%) |
| 4:00 PM to 11:59 PM | 77 (1.8%) | 116 (3.3%) |
| Total | 4,253 (100.0%) | 3,483 (100.0%) |
Housing Occupancy in Bainbridge Island
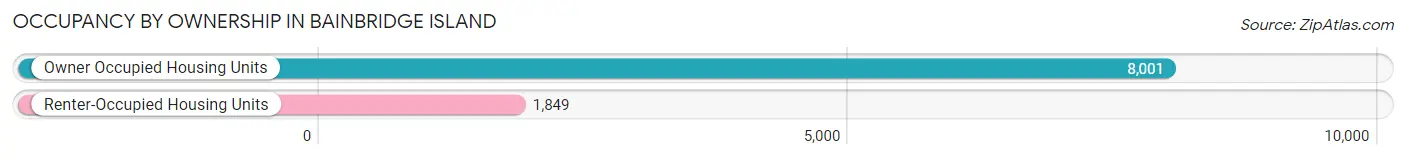
Occupancy by Ownership in Bainbridge Island
Of the total 9,850 dwellings in Bainbridge Island, owner-occupied units account for 8,001 (81.2%), while renter-occupied units make up 1,849 (18.8%).
| Occupancy | # Housing Units | % Housing Units |
| Owner Occupied Housing Units | 8,001 | 81.2% |
| Renter-Occupied Housing Units | 1,849 | 18.8% |
| Total Occupied Housing Units | 9,850 | 100.0% |
Occupancy by Household Size in Bainbridge Island
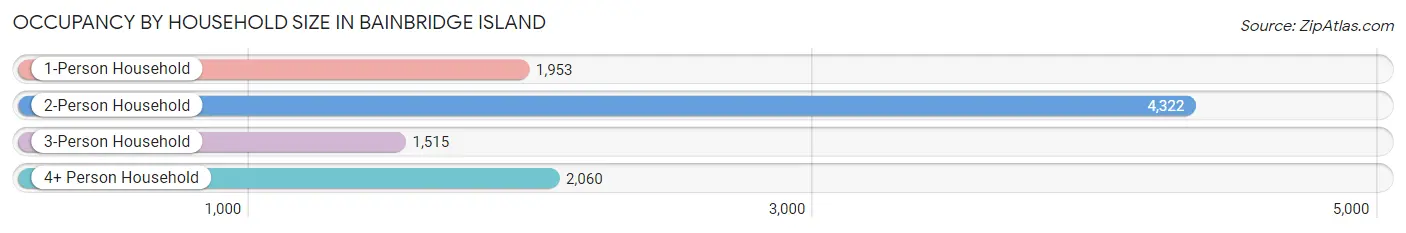
| Household Size | # Housing Units | % Housing Units |
| 1-Person Household | 1,953 | 19.8% |
| 2-Person Household | 4,322 | 43.9% |
| 3-Person Household | 1,515 | 15.4% |
| 4+ Person Household | 2,060 | 20.9% |
| Total Housing Units | 9,850 | 100.0% |
Occupancy by Ownership by Household Size in Bainbridge Island
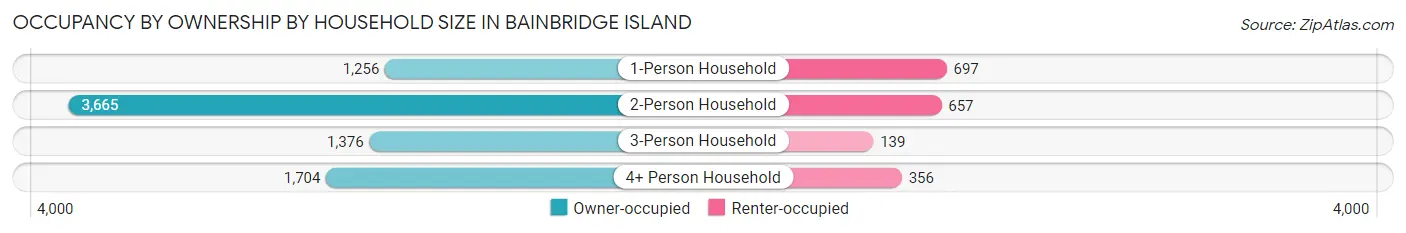
| Household Size | Owner-occupied | Renter-occupied |
| 1-Person Household | 1,256 (64.3%) | 697 (35.7%) |
| 2-Person Household | 3,665 (84.8%) | 657 (15.2%) |
| 3-Person Household | 1,376 (90.8%) | 139 (9.2%) |
| 4+ Person Household | 1,704 (82.7%) | 356 (17.3%) |
| Total Housing Units | 8,001 (81.2%) | 1,849 (18.8%) |
Occupancy by Educational Attainment in Bainbridge Island
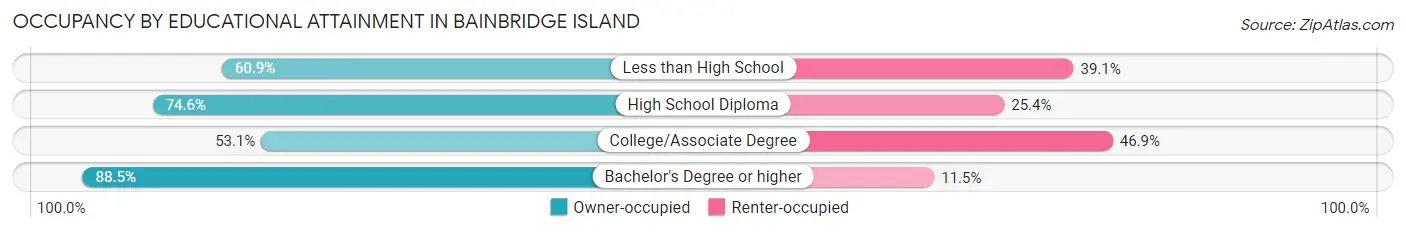
| Household Size | Owner-occupied | Renter-occupied |
| Less than High School | 28 (60.9%) | 18 (39.1%) |
| High School Diploma | 326 (74.6%) | 111 (25.4%) |
| College/Associate Degree | 962 (53.1%) | 850 (46.9%) |
| Bachelor's Degree or higher | 6,685 (88.5%) | 870 (11.5%) |
Occupancy by Age of Householder in Bainbridge Island
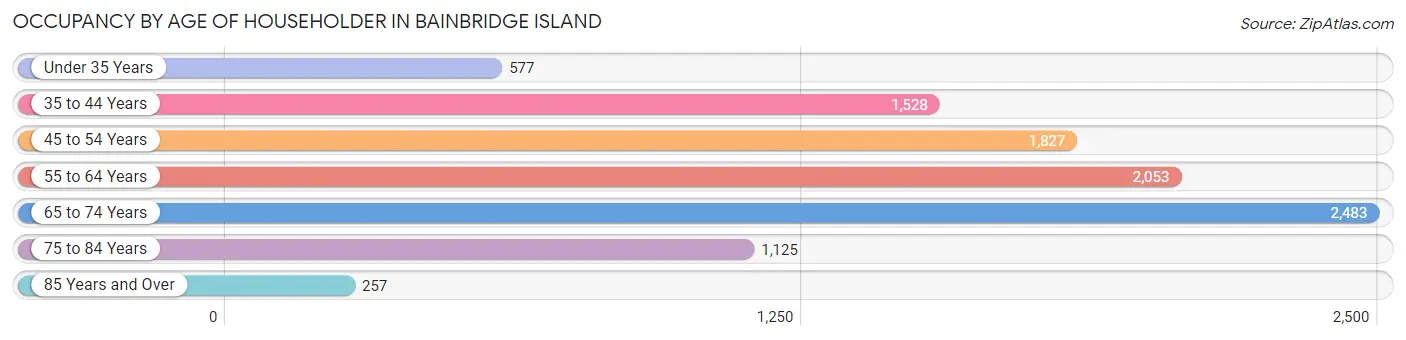
| Age Bracket | # Households | % Households |
| Under 35 Years | 577 | 5.9% |
| 35 to 44 Years | 1,528 | 15.5% |
| 45 to 54 Years | 1,827 | 18.5% |
| 55 to 64 Years | 2,053 | 20.8% |
| 65 to 74 Years | 2,483 | 25.2% |
| 75 to 84 Years | 1,125 | 11.4% |
| 85 Years and Over | 257 | 2.6% |
| Total | 9,850 | 100.0% |
Housing Finances in Bainbridge Island
Median Income by Occupancy in Bainbridge Island
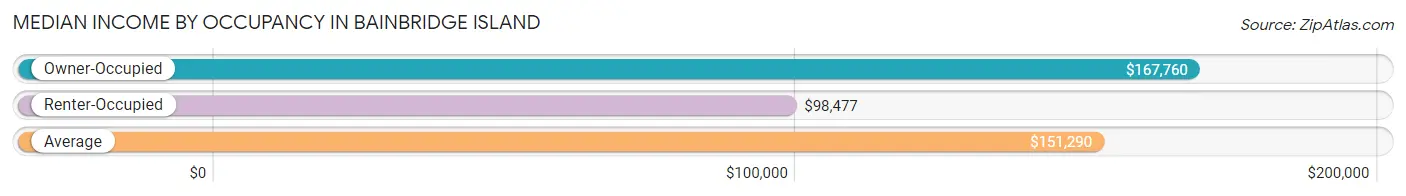
| Occupancy Type | # Households | Median Income |
| Owner-Occupied | 8,001 (81.2%) | $167,760 |
| Renter-Occupied | 1,849 (18.8%) | $98,477 |
| Average | 9,850 (100.0%) | $151,290 |
Occupancy by Householder Income Bracket in Bainbridge Island
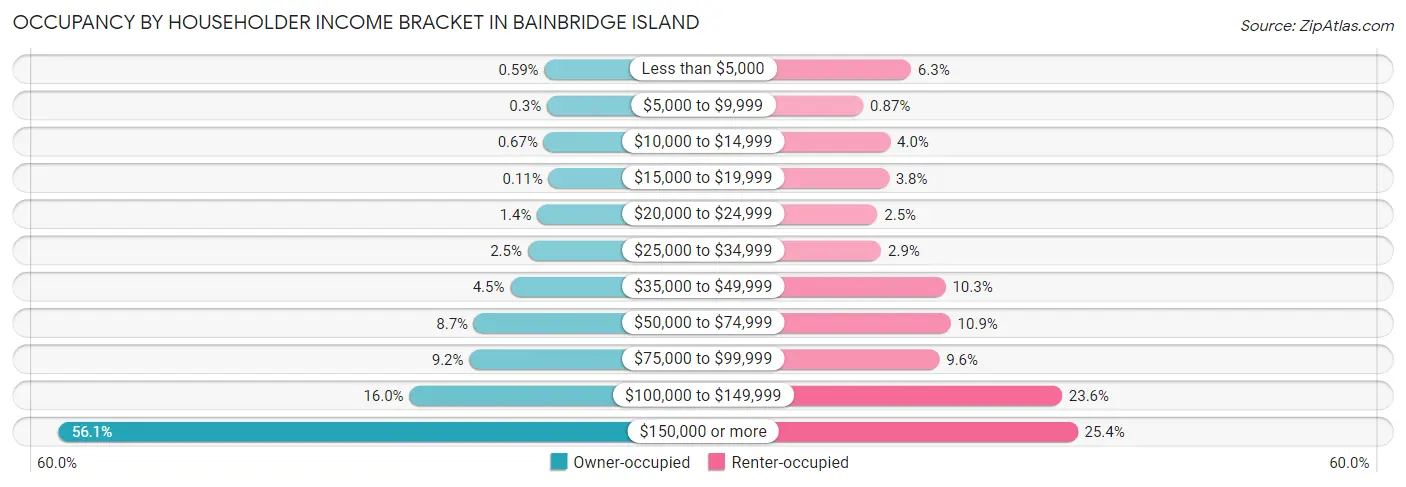
| Income Bracket | Owner-occupied | Renter-occupied |
| Less than $5,000 | 47 (0.6%) | 117 (6.3%) |
| $5,000 to $9,999 | 24 (0.3%) | 16 (0.9%) |
| $10,000 to $14,999 | 54 (0.7%) | 73 (4.0%) |
| $15,000 to $19,999 | 9 (0.1%) | 70 (3.8%) |
| $20,000 to $24,999 | 113 (1.4%) | 46 (2.5%) |
| $25,000 to $34,999 | 199 (2.5%) | 54 (2.9%) |
| $35,000 to $49,999 | 359 (4.5%) | 190 (10.3%) |
| $50,000 to $74,999 | 692 (8.6%) | 201 (10.9%) |
| $75,000 to $99,999 | 734 (9.2%) | 177 (9.6%) |
| $100,000 to $149,999 | 1,282 (16.0%) | 436 (23.6%) |
| $150,000 or more | 4,488 (56.1%) | 469 (25.4%) |
| Total | 8,001 (100.0%) | 1,849 (100.0%) |
Monthly Housing Cost Tiers in Bainbridge Island
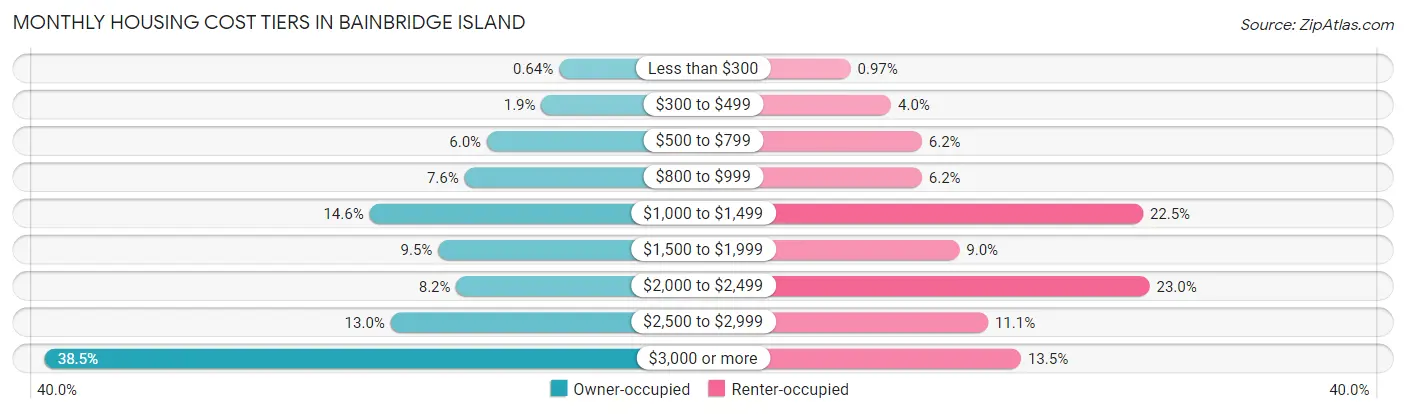
| Monthly Cost | Owner-occupied | Renter-occupied |
| Less than $300 | 51 (0.6%) | 18 (1.0%) |
| $300 to $499 | 155 (1.9%) | 73 (4.0%) |
| $500 to $799 | 476 (5.9%) | 115 (6.2%) |
| $800 to $999 | 608 (7.6%) | 115 (6.2%) |
| $1,000 to $1,499 | 1,168 (14.6%) | 416 (22.5%) |
| $1,500 to $1,999 | 763 (9.5%) | 166 (9.0%) |
| $2,000 to $2,499 | 656 (8.2%) | 425 (23.0%) |
| $2,500 to $2,999 | 1,043 (13.0%) | 205 (11.1%) |
| $3,000 or more | 3,081 (38.5%) | 250 (13.5%) |
| Total | 8,001 (100.0%) | 1,849 (100.0%) |
Physical Housing Characteristics in Bainbridge Island
Housing Structures in Bainbridge Island
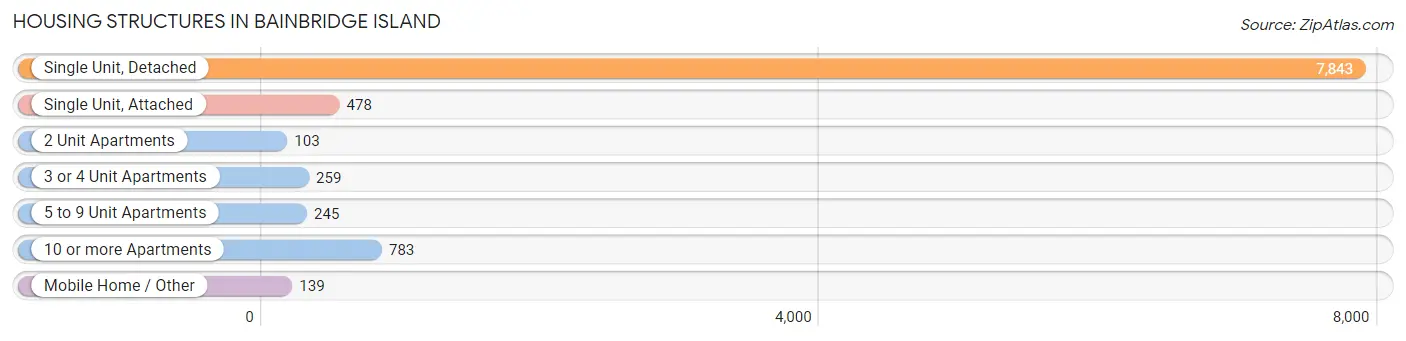
| Structure Type | # Housing Units | % Housing Units |
| Single Unit, Detached | 7,843 | 79.6% |
| Single Unit, Attached | 478 | 4.9% |
| 2 Unit Apartments | 103 | 1.1% |
| 3 or 4 Unit Apartments | 259 | 2.6% |
| 5 to 9 Unit Apartments | 245 | 2.5% |
| 10 or more Apartments | 783 | 8.0% |
| Mobile Home / Other | 139 | 1.4% |
| Total | 9,850 | 100.0% |
Housing Structures by Occupancy in Bainbridge Island
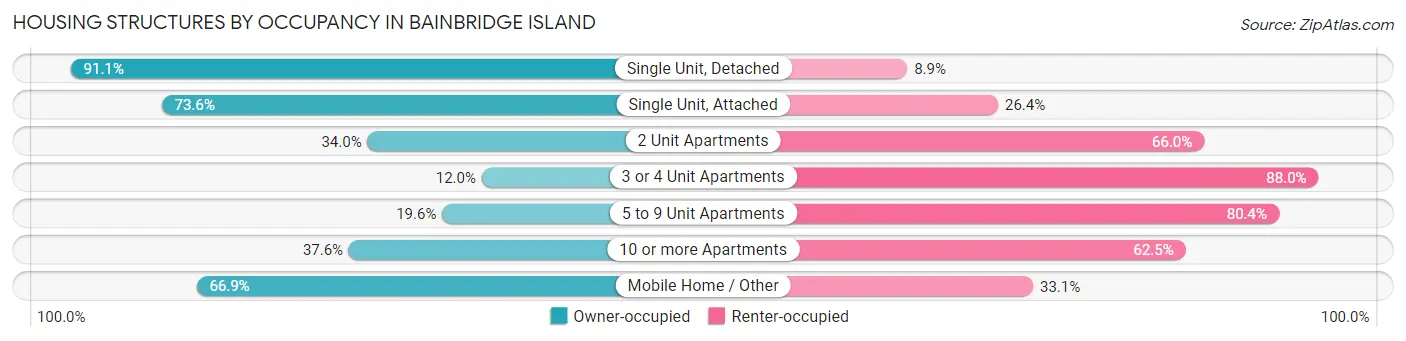
| Structure Type | Owner-occupied | Renter-occupied |
| Single Unit, Detached | 7,148 (91.1%) | 695 (8.9%) |
| Single Unit, Attached | 352 (73.6%) | 126 (26.4%) |
| 2 Unit Apartments | 35 (34.0%) | 68 (66.0%) |
| 3 or 4 Unit Apartments | 31 (12.0%) | 228 (88.0%) |
| 5 to 9 Unit Apartments | 48 (19.6%) | 197 (80.4%) |
| 10 or more Apartments | 294 (37.6%) | 489 (62.5%) |
| Mobile Home / Other | 93 (66.9%) | 46 (33.1%) |
| Total | 8,001 (81.2%) | 1,849 (18.8%) |
Housing Structures by Number of Rooms in Bainbridge Island
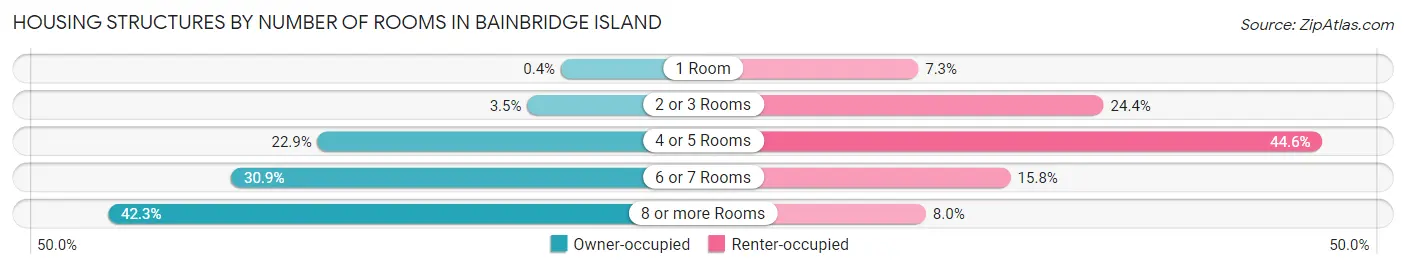
| Number of Rooms | Owner-occupied | Renter-occupied |
| 1 Room | 32 (0.4%) | 134 (7.2%) |
| 2 or 3 Rooms | 281 (3.5%) | 451 (24.4%) |
| 4 or 5 Rooms | 1,833 (22.9%) | 825 (44.6%) |
| 6 or 7 Rooms | 2,472 (30.9%) | 292 (15.8%) |
| 8 or more Rooms | 3,383 (42.3%) | 147 (8.0%) |
| Total | 8,001 (100.0%) | 1,849 (100.0%) |
Housing Structure by Heating Type in Bainbridge Island
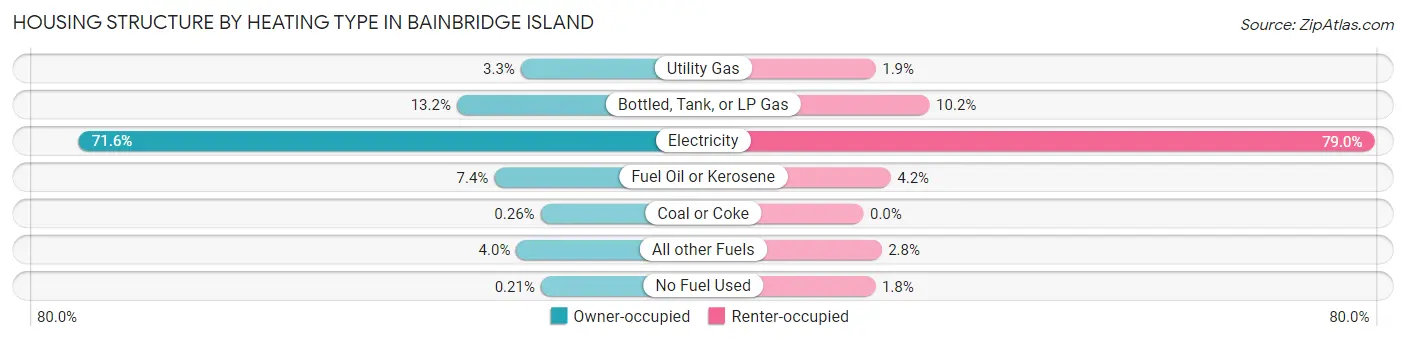
| Heating Type | Owner-occupied | Renter-occupied |
| Utility Gas | 265 (3.3%) | 35 (1.9%) |
| Bottled, Tank, or LP Gas | 1,056 (13.2%) | 189 (10.2%) |
| Electricity | 5,729 (71.6%) | 1,461 (79.0%) |
| Fuel Oil or Kerosene | 593 (7.4%) | 78 (4.2%) |
| Coal or Coke | 21 (0.3%) | 0 (0.0%) |
| All other Fuels | 320 (4.0%) | 52 (2.8%) |
| No Fuel Used | 17 (0.2%) | 34 (1.8%) |
| Total | 8,001 (100.0%) | 1,849 (100.0%) |
Household Vehicle Usage in Bainbridge Island
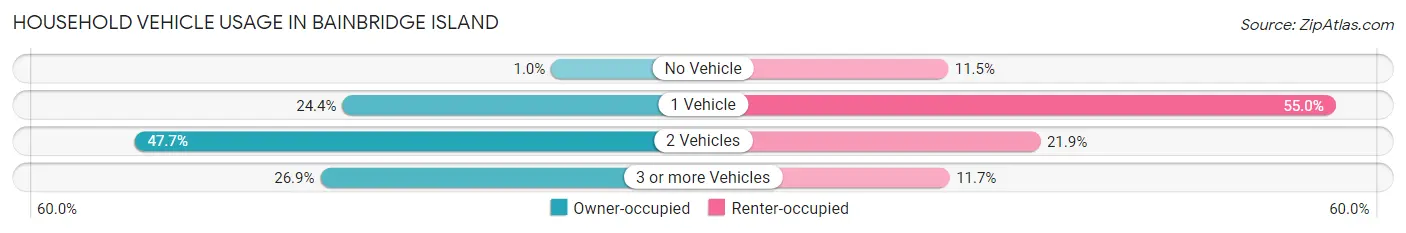
| Vehicles per Household | Owner-occupied | Renter-occupied |
| No Vehicle | 82 (1.0%) | 213 (11.5%) |
| 1 Vehicle | 1,953 (24.4%) | 1,016 (54.9%) |
| 2 Vehicles | 3,815 (47.7%) | 404 (21.8%) |
| 3 or more Vehicles | 2,151 (26.9%) | 216 (11.7%) |
| Total | 8,001 (100.0%) | 1,849 (100.0%) |
Real Estate & Mortgages in Bainbridge Island
Real Estate and Mortgage Overview in Bainbridge Island
| Characteristic | Without Mortgage | With Mortgage |
| Housing Units | 3,068 | 4,933 |
| Median Property Value | $930,500 | $1,007,900 |
| Median Household Income | $126,774 | $3,165 |
| Monthly Housing Costs | $1,204 | $3,003 |
| Real Estate Taxes | $7,920 | $30 |
Property Value by Mortgage Status in Bainbridge Island
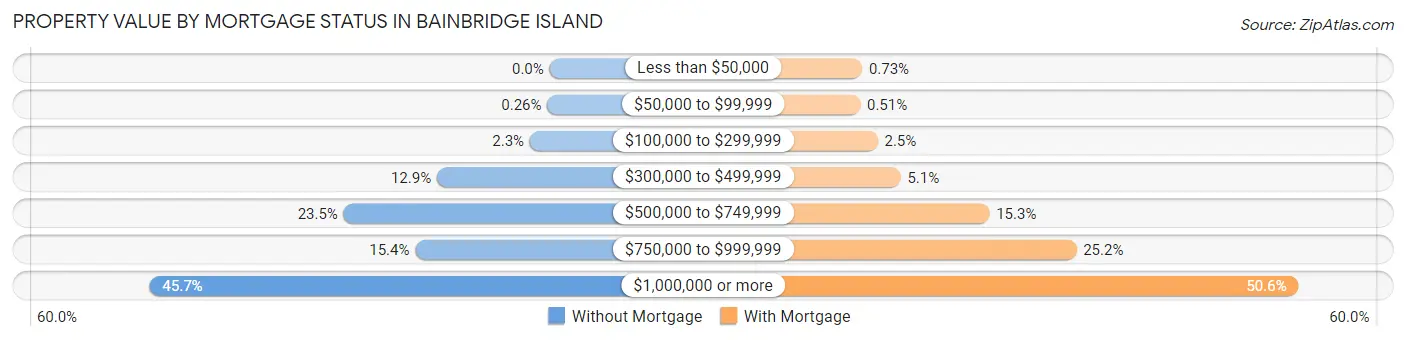
| Property Value | Without Mortgage | With Mortgage |
| Less than $50,000 | 0 (0.0%) | 36 (0.7%) |
| $50,000 to $99,999 | 8 (0.3%) | 25 (0.5%) |
| $100,000 to $299,999 | 69 (2.2%) | 124 (2.5%) |
| $300,000 to $499,999 | 395 (12.9%) | 253 (5.1%) |
| $500,000 to $749,999 | 722 (23.5%) | 754 (15.3%) |
| $750,000 to $999,999 | 471 (15.3%) | 1,244 (25.2%) |
| $1,000,000 or more | 1,403 (45.7%) | 2,497 (50.6%) |
| Total | 3,068 (100.0%) | 4,933 (100.0%) |
Household Income by Mortgage Status in Bainbridge Island
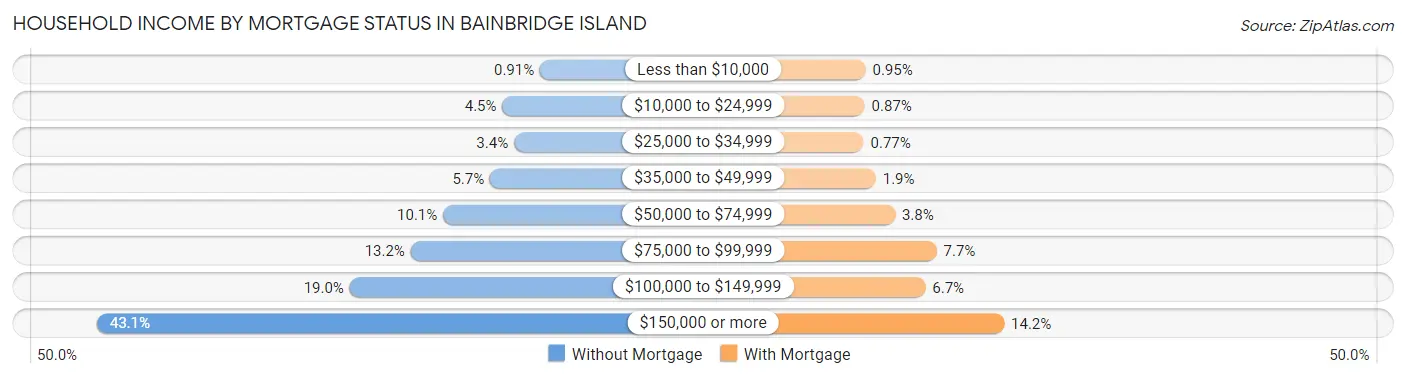
| Household Income | Without Mortgage | With Mortgage |
| Less than $10,000 | 28 (0.9%) | 47 (0.9%) |
| $10,000 to $24,999 | 138 (4.5%) | 43 (0.9%) |
| $25,000 to $34,999 | 104 (3.4%) | 38 (0.8%) |
| $35,000 to $49,999 | 174 (5.7%) | 95 (1.9%) |
| $50,000 to $74,999 | 311 (10.1%) | 185 (3.7%) |
| $75,000 to $99,999 | 406 (13.2%) | 381 (7.7%) |
| $100,000 to $149,999 | 584 (19.0%) | 328 (6.7%) |
| $150,000 or more | 1,323 (43.1%) | 698 (14.1%) |
| Total | 3,068 (100.0%) | 4,933 (100.0%) |
Property Value to Household Income Ratio in Bainbridge Island
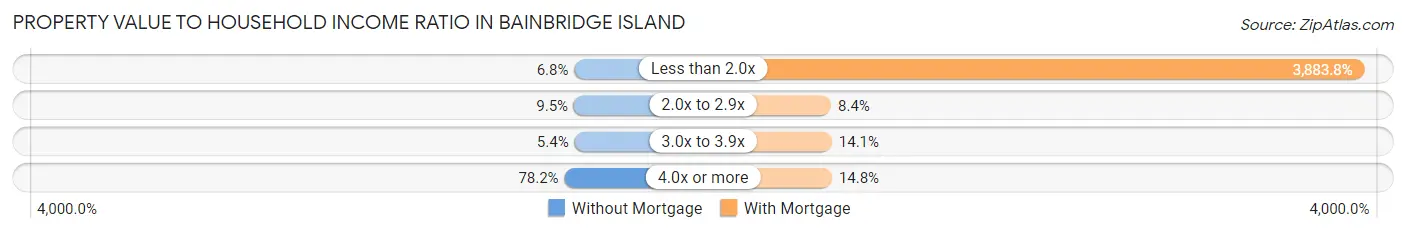
| Value-to-Income Ratio | Without Mortgage | With Mortgage |
| Less than 2.0x | 208 (6.8%) | 191,589 (3,883.8%) |
| 2.0x to 2.9x | 291 (9.5%) | 416 (8.4%) |
| 3.0x to 3.9x | 166 (5.4%) | 697 (14.1%) |
| 4.0x or more | 2,400 (78.2%) | 732 (14.8%) |
| Total | 3,068 (100.0%) | 4,933 (100.0%) |
Real Estate Taxes by Mortgage Status in Bainbridge Island
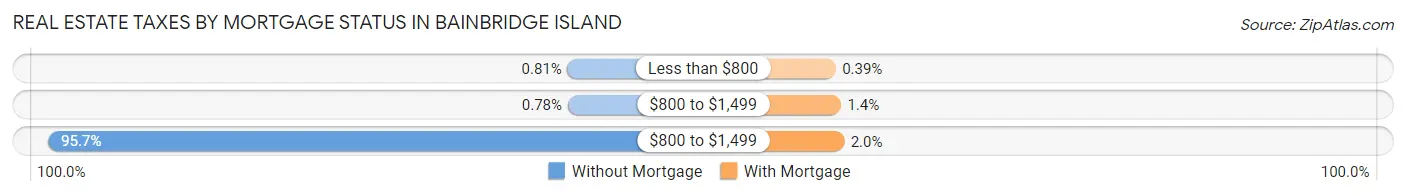
| Property Taxes | Without Mortgage | With Mortgage |
| Less than $800 | 25 (0.8%) | 19 (0.4%) |
| $800 to $1,499 | 24 (0.8%) | 67 (1.4%) |
| $800 to $1,499 | 2,936 (95.7%) | 96 (1.9%) |
| Total | 3,068 (100.0%) | 4,933 (100.0%) |
Health & Disability in Bainbridge Island
Health Insurance Coverage by Age in Bainbridge Island
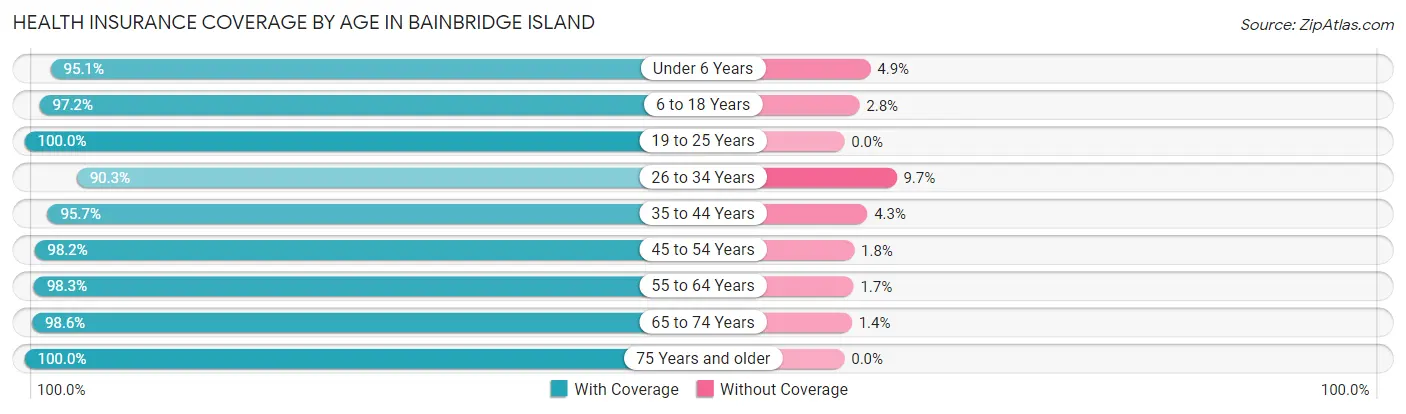
| Age Bracket | With Coverage | Without Coverage |
| Under 6 Years | 1,232 (95.1%) | 63 (4.9%) |
| 6 to 18 Years | 4,018 (97.2%) | 116 (2.8%) |
| 19 to 25 Years | 715 (100.0%) | 0 (0.0%) |
| 26 to 34 Years | 1,178 (90.3%) | 127 (9.7%) |
| 35 to 44 Years | 3,142 (95.7%) | 140 (4.3%) |
| 45 to 54 Years | 3,213 (98.2%) | 60 (1.8%) |
| 55 to 64 Years | 3,802 (98.3%) | 66 (1.7%) |
| 65 to 74 Years | 4,365 (98.6%) | 61 (1.4%) |
| 75 Years and older | 2,183 (100.0%) | 0 (0.0%) |
| Total | 23,848 (97.4%) | 633 (2.6%) |
Health Insurance Coverage by Citizenship Status in Bainbridge Island
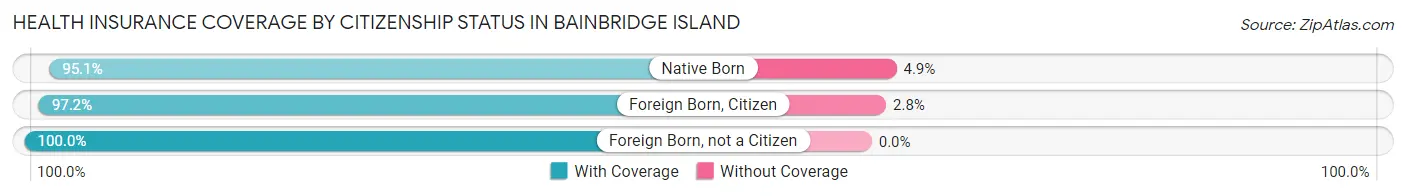
| Citizenship Status | With Coverage | Without Coverage |
| Native Born | 1,232 (95.1%) | 63 (4.9%) |
| Foreign Born, Citizen | 4,018 (97.2%) | 116 (2.8%) |
| Foreign Born, not a Citizen | 715 (100.0%) | 0 (0.0%) |
Health Insurance Coverage by Household Income in Bainbridge Island
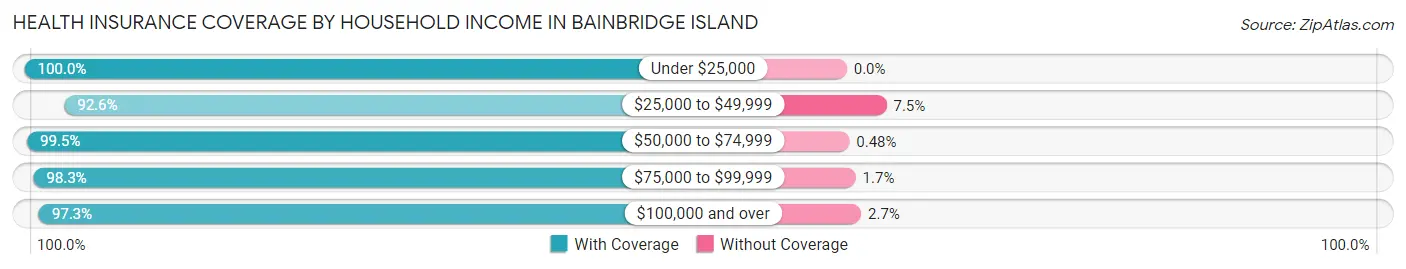
| Household Income | With Coverage | Without Coverage |
| Under $25,000 | 726 (100.0%) | 0 (0.0%) |
| $25,000 to $49,999 | 1,118 (92.5%) | 90 (7.4%) |
| $50,000 to $74,999 | 1,850 (99.5%) | 9 (0.5%) |
| $75,000 to $99,999 | 1,893 (98.3%) | 32 (1.7%) |
| $100,000 and over | 18,205 (97.3%) | 501 (2.7%) |
Public vs Private Health Insurance Coverage by Age in Bainbridge Island
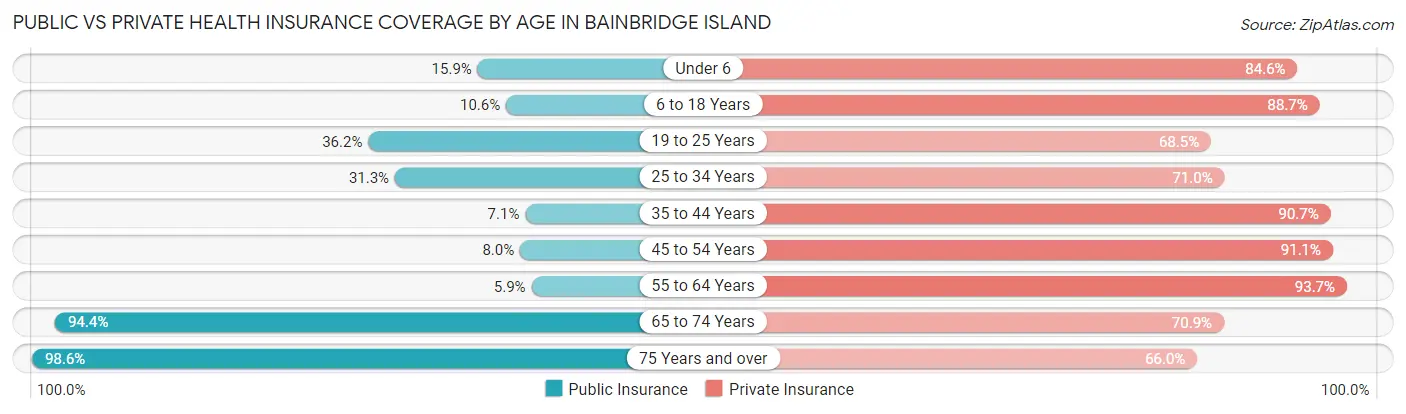
| Age Bracket | Public Insurance | Private Insurance |
| Under 6 | 206 (15.9%) | 1,095 (84.6%) |
| 6 to 18 Years | 440 (10.6%) | 3,666 (88.7%) |
| 19 to 25 Years | 259 (36.2%) | 490 (68.5%) |
| 25 to 34 Years | 408 (31.3%) | 927 (71.0%) |
| 35 to 44 Years | 232 (7.1%) | 2,977 (90.7%) |
| 45 to 54 Years | 263 (8.0%) | 2,983 (91.1%) |
| 55 to 64 Years | 229 (5.9%) | 3,626 (93.7%) |
| 65 to 74 Years | 4,176 (94.4%) | 3,139 (70.9%) |
| 75 Years and over | 2,153 (98.6%) | 1,440 (66.0%) |
| Total | 8,366 (34.2%) | 20,343 (83.1%) |
Disability Status by Sex by Age in Bainbridge Island
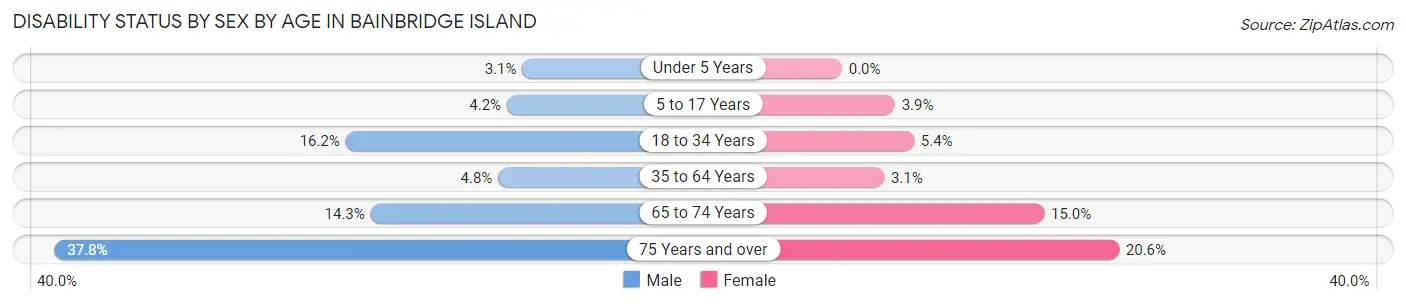
| Age Bracket | Male | Female |
| Under 5 Years | 16 (3.0%) | 0 (0.0%) |
| 5 to 17 Years | 91 (4.2%) | 74 (3.9%) |
| 18 to 34 Years | 179 (16.2%) | 65 (5.3%) |
| 35 to 64 Years | 245 (4.8%) | 168 (3.1%) |
| 65 to 74 Years | 296 (14.3%) | 354 (15.0%) |
| 75 Years and over | 452 (37.8%) | 203 (20.6%) |
Disability Class by Sex by Age in Bainbridge Island
Disability Class: Hearing Difficulty
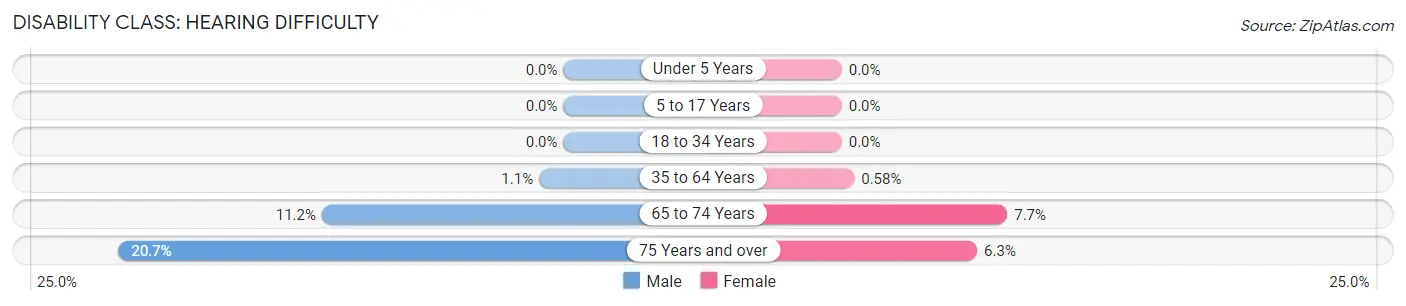
| Age Bracket | Male | Female |
| Under 5 Years | 0 (0.0%) | 0 (0.0%) |
| 5 to 17 Years | 0 (0.0%) | 0 (0.0%) |
| 18 to 34 Years | 0 (0.0%) | 0 (0.0%) |
| 35 to 64 Years | 57 (1.1%) | 31 (0.6%) |
| 65 to 74 Years | 232 (11.2%) | 181 (7.7%) |
| 75 Years and over | 247 (20.6%) | 62 (6.3%) |
Disability Class: Vision Difficulty
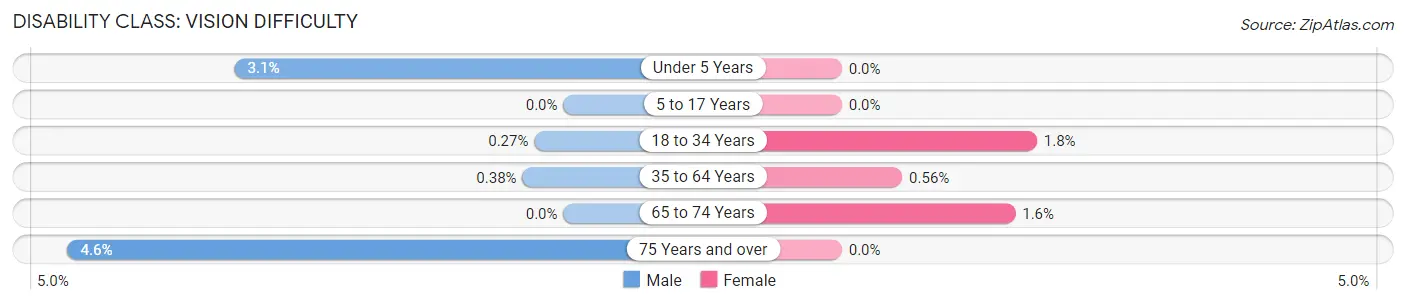
| Age Bracket | Male | Female |
| Under 5 Years | 16 (3.0%) | 0 (0.0%) |
| 5 to 17 Years | 0 (0.0%) | 0 (0.0%) |
| 18 to 34 Years | 3 (0.3%) | 22 (1.8%) |
| 35 to 64 Years | 19 (0.4%) | 30 (0.6%) |
| 65 to 74 Years | 0 (0.0%) | 38 (1.6%) |
| 75 Years and over | 55 (4.6%) | 0 (0.0%) |
Disability Class: Cognitive Difficulty
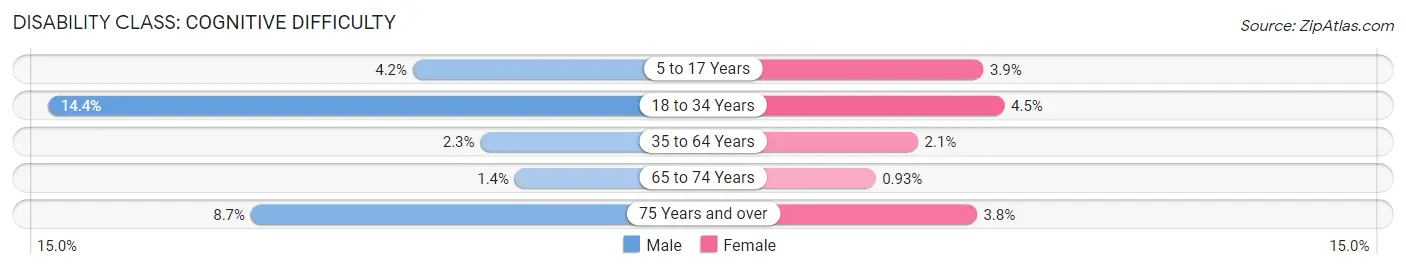
| Age Bracket | Male | Female |
| 5 to 17 Years | 91 (4.2%) | 74 (3.9%) |
| 18 to 34 Years | 159 (14.3%) | 55 (4.5%) |
| 35 to 64 Years | 117 (2.3%) | 113 (2.1%) |
| 65 to 74 Years | 28 (1.3%) | 22 (0.9%) |
| 75 Years and over | 104 (8.7%) | 37 (3.7%) |
Disability Class: Ambulatory Difficulty
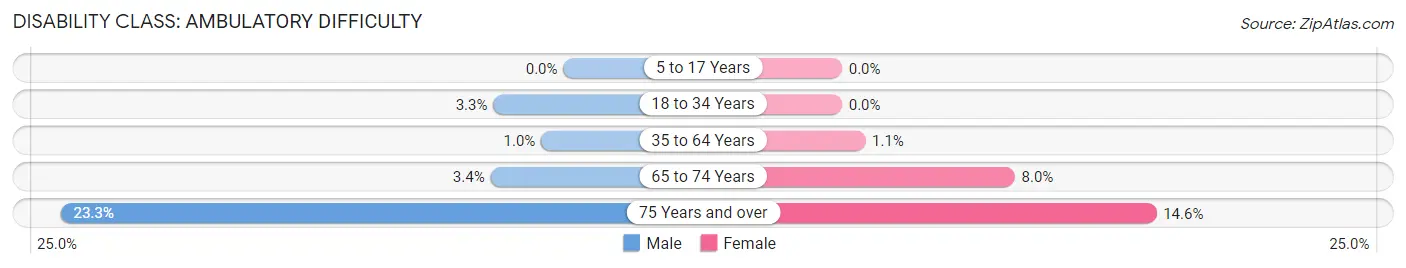
| Age Bracket | Male | Female |
| 5 to 17 Years | 0 (0.0%) | 0 (0.0%) |
| 18 to 34 Years | 36 (3.3%) | 0 (0.0%) |
| 35 to 64 Years | 52 (1.0%) | 58 (1.1%) |
| 65 to 74 Years | 70 (3.4%) | 189 (8.0%) |
| 75 Years and over | 279 (23.3%) | 144 (14.6%) |
Disability Class: Self-Care Difficulty
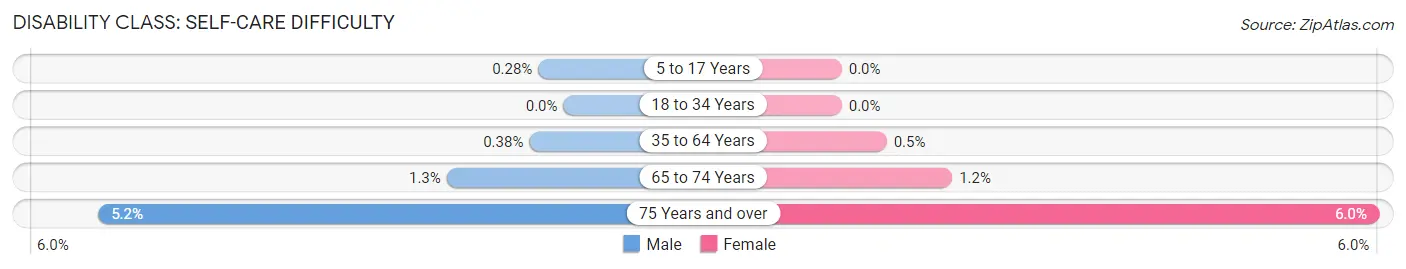
| Age Bracket | Male | Female |
| 5 to 17 Years | 6 (0.3%) | 0 (0.0%) |
| 18 to 34 Years | 0 (0.0%) | 0 (0.0%) |
| 35 to 64 Years | 19 (0.4%) | 27 (0.5%) |
| 65 to 74 Years | 27 (1.3%) | 29 (1.2%) |
| 75 Years and over | 62 (5.2%) | 59 (6.0%) |
Technology Access in Bainbridge Island
Computing Device Access in Bainbridge Island
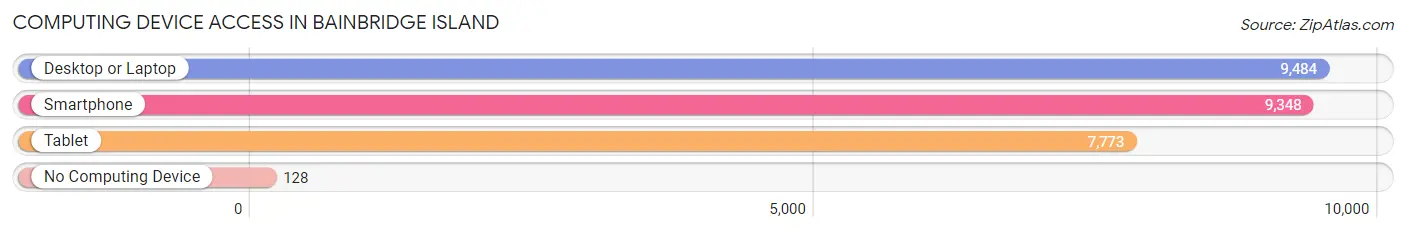
| Device Type | # Households | % Households |
| Desktop or Laptop | 9,484 | 96.3% |
| Smartphone | 9,348 | 94.9% |
| Tablet | 7,773 | 78.9% |
| No Computing Device | 128 | 1.3% |
| Total | 9,850 | 100.0% |
Internet Access in Bainbridge Island
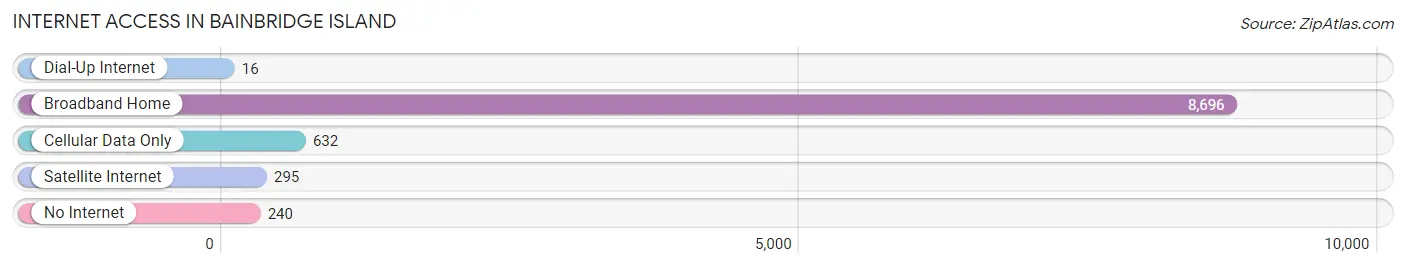
| Internet Type | # Households | % Households |
| Dial-Up Internet | 16 | 0.2% |
| Broadband Home | 8,696 | 88.3% |
| Cellular Data Only | 632 | 6.4% |
| Satellite Internet | 295 | 3.0% |
| No Internet | 240 | 2.4% |
| Total | 9,850 | 100.0% |
Bainbridge Island Summary
Bainbridge Island is a city located in Kitsap County, Washington, United States, and is the largest city on the island of the same name in Puget Sound. The population was 23,025 at the 2010 census, making Bainbridge Island the second largest city in Kitsap County. The island is connected to the Kitsap Peninsula by the Agate Pass Bridge, and is accessible by ferry from Seattle.
History
The first known inhabitants of Bainbridge Island were the Suquamish people, who had inhabited the area for thousands of years prior to the arrival of European settlers. The Suquamish were a peaceful people who lived off the land, fishing and gathering shellfish and other resources from the island.
In 1841, the first European settlers arrived on the island, led by William Bainbridge. The settlers established a small community and began to farm the land. In 1853, the island was officially incorporated as the Town of Bainbridge Island.
In the late 19th century, the island became a popular destination for tourists, who came to enjoy the island’s natural beauty and recreational activities. The island also became a popular summer retreat for wealthy Seattleites, who built large summer homes on the island.
In the early 20th century, the island’s economy shifted from agriculture to tourism and recreation. The island became a popular destination for boaters, fishermen, and beachgoers.
In the 1950s, the island’s population began to grow rapidly, as people moved to the island from Seattle and other parts of the country. The island’s population has continued to grow since then, and today the island is home to over 23,000 people.
Geography
Bainbridge Island is located in the Puget Sound region of Washington State, approximately 30 miles west of Seattle. The island is approximately 8 miles long and 4 miles wide, and is separated from the Kitsap Peninsula by Agate Pass. The island is surrounded by several smaller islands, including Blakely Island, Eagle Harbor, and Port Madison.
The island is mostly composed of low-lying hills and valleys, with the highest point being Point White at an elevation of 463 feet. The island is covered in dense forests, with Douglas fir, western hemlock, and western red cedar being the most common trees.
Economy
The economy of Bainbridge Island is largely based on tourism and recreation. The island is a popular destination for boaters, fishermen, and beachgoers, and is home to several marinas, boat launches, and public beaches.
The island is also home to several wineries, breweries, and distilleries, as well as several art galleries and museums. The island is also home to several retail stores, restaurants, and other businesses.
The island is also home to several technology companies, including Microsoft, which has a large campus on the island.
Demographics
As of the 2010 census, the population of Bainbridge Island was 23,025. The population is predominantly white (90.2%), with the remaining population being made up of Asian (4.2%), African American (2.2%), and Hispanic (2.2%) residents.
The median household income on the island is $90,845, and the median home value is $521,000. The island is home to several affluent neighborhoods, including Winslow, Rolling Bay, and Lynwood Center.
The island is served by the Bainbridge Island School District, which consists of seven elementary schools, two middle schools, and one high school. The island is also home to several private schools, including the Bainbridge Island Japanese American Exclusion Memorial School.
Common Questions
What is Per Capita Income in Bainbridge Island?
Per Capita income in Bainbridge Island is $86,747.
What is the Median Family Income in Bainbridge Island?
Median Family Income in Bainbridge Island is $180,240.
What is the Median Household income in Bainbridge Island?
Median Household Income in Bainbridge Island is $151,290.
What is Income or Wage Gap in Bainbridge Island?
Income or Wage Gap in Bainbridge Island is 51.4%.
Women in Bainbridge Island earn 48.6 cents for every dollar earned by a man.
What is Inequality or Gini Index in Bainbridge Island?
Inequality or Gini Index in Bainbridge Island is 0.47.
What is the Total Population of Bainbridge Island?
Total Population of Bainbridge Island is 24,681.
What is the Total Male Population of Bainbridge Island?
Total Male Population of Bainbridge Island is 12,195.
What is the Total Female Population of Bainbridge Island?
Total Female Population of Bainbridge Island is 12,486.
What is the Ratio of Males per 100 Females in Bainbridge Island?
There are 97.67 Males per 100 Females in Bainbridge Island.
What is the Ratio of Females per 100 Males in Bainbridge Island?
There are 102.39 Females per 100 Males in Bainbridge Island.
What is the Median Population Age in Bainbridge Island?
Median Population Age in Bainbridge Island is 49.5 Years.
What is the Average Family Size in Bainbridge Island
Average Family Size in Bainbridge Island is 2.8 People.
What is the Average Household Size in Bainbridge Island
Average Household Size in Bainbridge Island is 2.5 People.
How Large is the Labor Force in Bainbridge Island?
There are 11,776 People in the Labor Forcein in Bainbridge Island.
What is the Percentage of People in the Labor Force in Bainbridge Island?
57.8% of People are in the Labor Force in Bainbridge Island.
What is the Unemployment Rate in Bainbridge Island?
Unemployment Rate in Bainbridge Island is 2.9%.