Issaquah, WA Map & Demographics
Issaquah Map
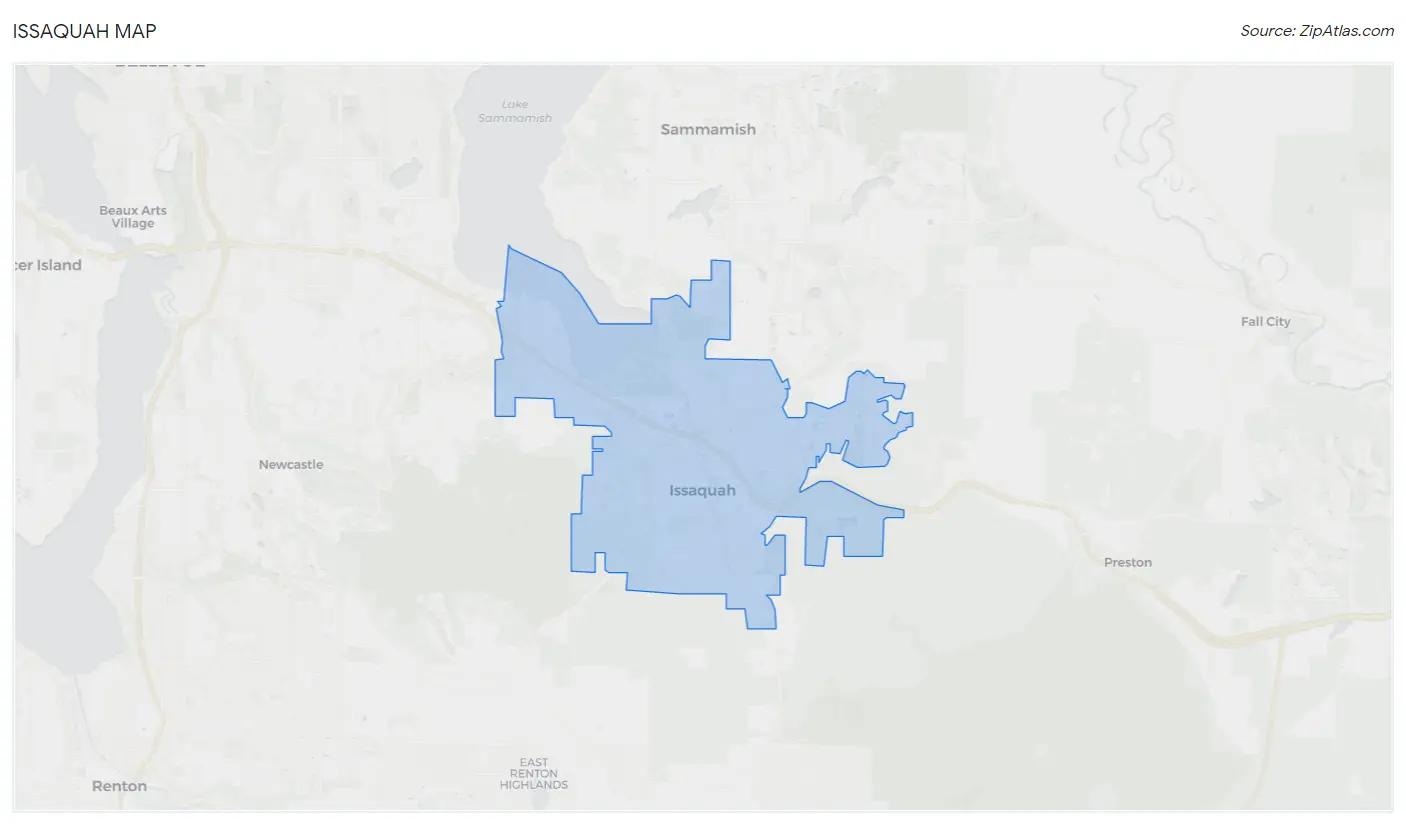
Issaquah Overview
$83,644
PER CAPITA INCOME
$172,862
AVG FAMILY INCOME
$143,006
AVG HOUSEHOLD INCOME
32.7%
WAGE / INCOME GAP [ % ]
67.3¢/ $1
WAGE / INCOME GAP [ $ ]
0.47
INEQUALITY / GINI INDEX
39,400
TOTAL POPULATION
19,589
MALE POPULATION
19,811
FEMALE POPULATION
98.88
MALES / 100 FEMALES
101.13
FEMALES / 100 MALES
36.8
MEDIAN AGE
2.9
AVG FAMILY SIZE
2.4
AVG HOUSEHOLD SIZE
23,419
LABOR FORCE [ PEOPLE ]
73.3%
PERCENT IN LABOR FORCE
3.2%
UNEMPLOYMENT RATE
Issaquah Area Codes
Income in Issaquah
Income Overview in Issaquah
Per Capita Income in Issaquah is $83,644, while median incomes of families and households are $172,862 and $143,006 respectively.
| Characteristic | Number | Measure |
| Per Capita Income | 39,400 | $83,644 |
| Median Family Income | 10,526 | $172,862 |
| Mean Family Income | 10,526 | $218,996 |
| Median Household Income | 16,415 | $143,006 |
| Mean Household Income | 16,415 | $196,431 |
| Income Deficit | 10,526 | $0 |
| Wage / Income Gap (%) | 39,400 | 32.68% |
| Wage / Income Gap ($) | 39,400 | 67.32¢ per $1 |
| Gini / Inequality Index | 39,400 | 0.47 |
Earnings by Sex in Issaquah
Average Earnings in Issaquah are $83,571, $102,308 for men and $68,872 for women, a difference of 32.7%.
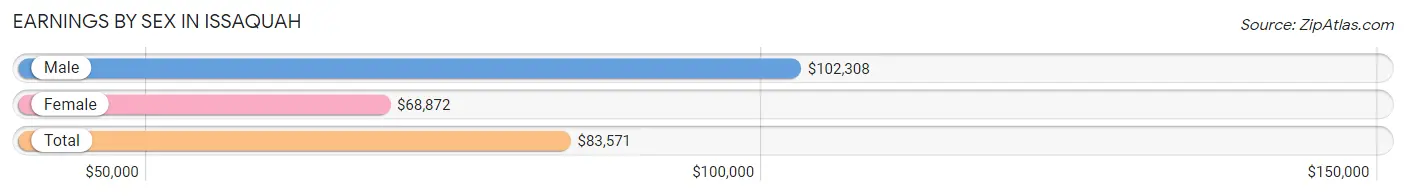
| Sex | Number | Average Earnings |
| Male | 13,308 (55.4%) | $102,308 |
| Female | 10,704 (44.6%) | $68,872 |
| Total | 24,012 (100.0%) | $83,571 |
Earnings by Sex by Income Bracket in Issaquah
The most common earnings brackets in Issaquah are $100,000+ for men (6,702 | 50.4%) and $100,000+ for women (3,578 | 33.4%).
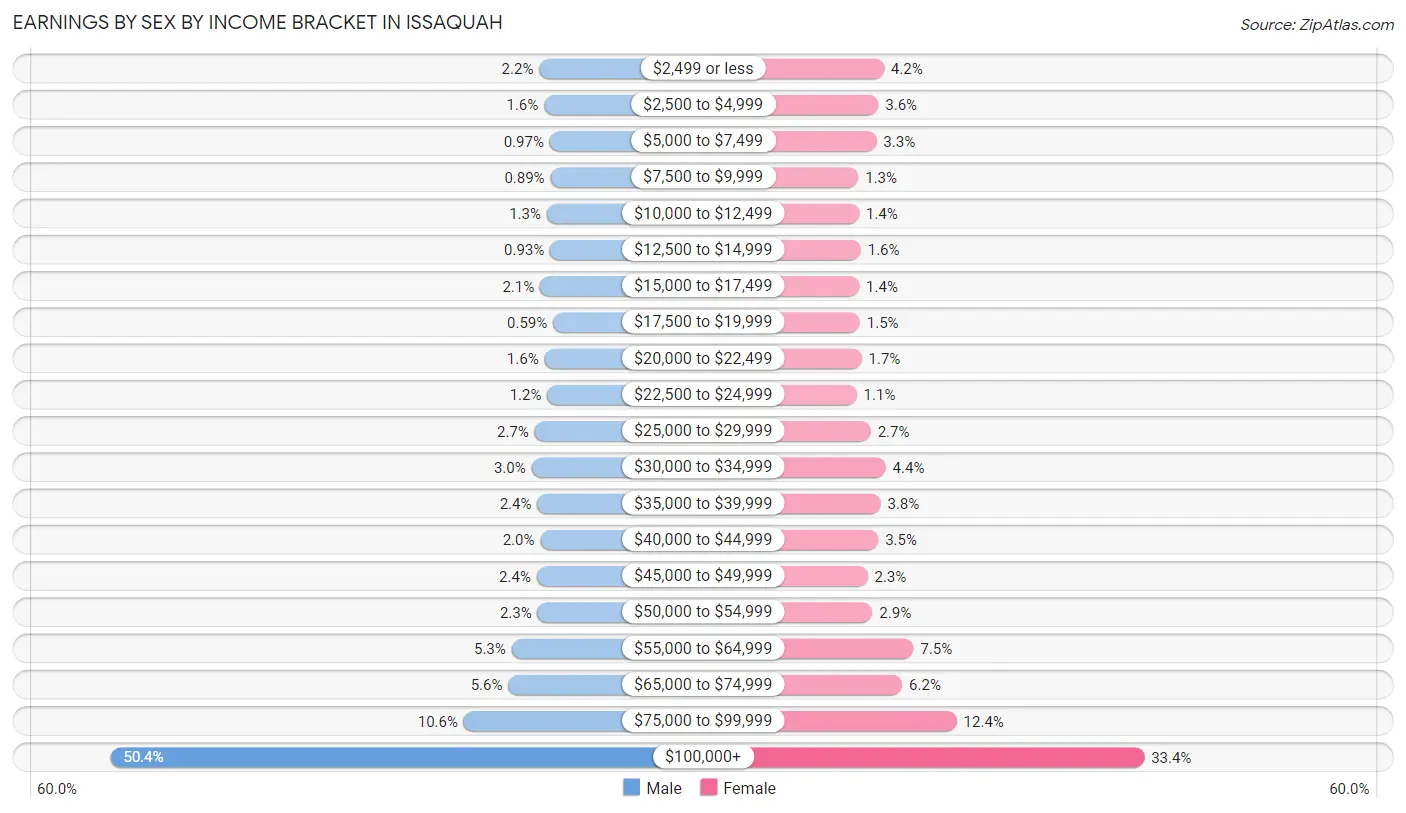
| Income | Male | Female |
| $2,499 or less | 286 (2.1%) | 446 (4.2%) |
| $2,500 to $4,999 | 214 (1.6%) | 380 (3.5%) |
| $5,000 to $7,499 | 129 (1.0%) | 356 (3.3%) |
| $7,500 to $9,999 | 119 (0.9%) | 138 (1.3%) |
| $10,000 to $12,499 | 173 (1.3%) | 147 (1.4%) |
| $12,500 to $14,999 | 124 (0.9%) | 168 (1.6%) |
| $15,000 to $17,499 | 273 (2.1%) | 149 (1.4%) |
| $17,500 to $19,999 | 79 (0.6%) | 157 (1.5%) |
| $20,000 to $22,499 | 208 (1.6%) | 178 (1.7%) |
| $22,500 to $24,999 | 165 (1.2%) | 119 (1.1%) |
| $25,000 to $29,999 | 354 (2.7%) | 288 (2.7%) |
| $30,000 to $34,999 | 400 (3.0%) | 468 (4.4%) |
| $35,000 to $39,999 | 315 (2.4%) | 406 (3.8%) |
| $40,000 to $44,999 | 270 (2.0%) | 378 (3.5%) |
| $45,000 to $49,999 | 324 (2.4%) | 249 (2.3%) |
| $50,000 to $54,999 | 311 (2.3%) | 308 (2.9%) |
| $55,000 to $64,999 | 699 (5.2%) | 803 (7.5%) |
| $65,000 to $74,999 | 749 (5.6%) | 666 (6.2%) |
| $75,000 to $99,999 | 1,414 (10.6%) | 1,322 (12.3%) |
| $100,000+ | 6,702 (50.4%) | 3,578 (33.4%) |
| Total | 13,308 (100.0%) | 10,704 (100.0%) |
Earnings by Sex by Educational Attainment in Issaquah
Average earnings in Issaquah are $113,418 for men and $74,256 for women, a difference of 34.5%. Men with an educational attainment of graduate degree enjoy the highest average annual earnings of $172,784, while those with less than high school education earn the least with $37,583. Women with an educational attainment of graduate degree earn the most with the average annual earnings of $102,351, while those with less than high school education have the smallest earnings of $19,432.
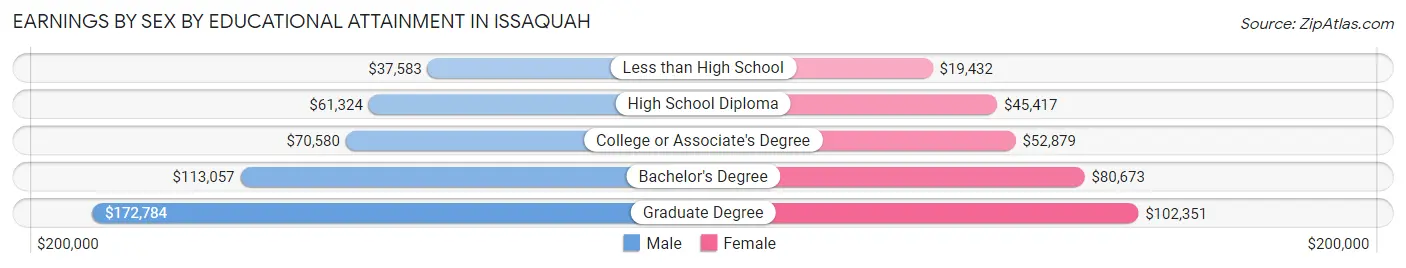
| Educational Attainment | Male Income | Female Income |
| Less than High School | $37,583 | $19,432 |
| High School Diploma | $61,324 | $45,417 |
| College or Associate's Degree | $70,580 | $52,879 |
| Bachelor's Degree | $113,057 | $80,673 |
| Graduate Degree | $172,784 | $102,351 |
| Total | $113,418 | $74,256 |
Family Income in Issaquah
Family Income Brackets in Issaquah
According to the Issaquah family income data, there are 4,305 families falling into the $200,000+ income range, which is the most common income bracket and makes up 40.9% of all families. Conversely, the $10,000 to $14,999 income bracket is the least frequent group with only 32 families (0.3%) belonging to this category.
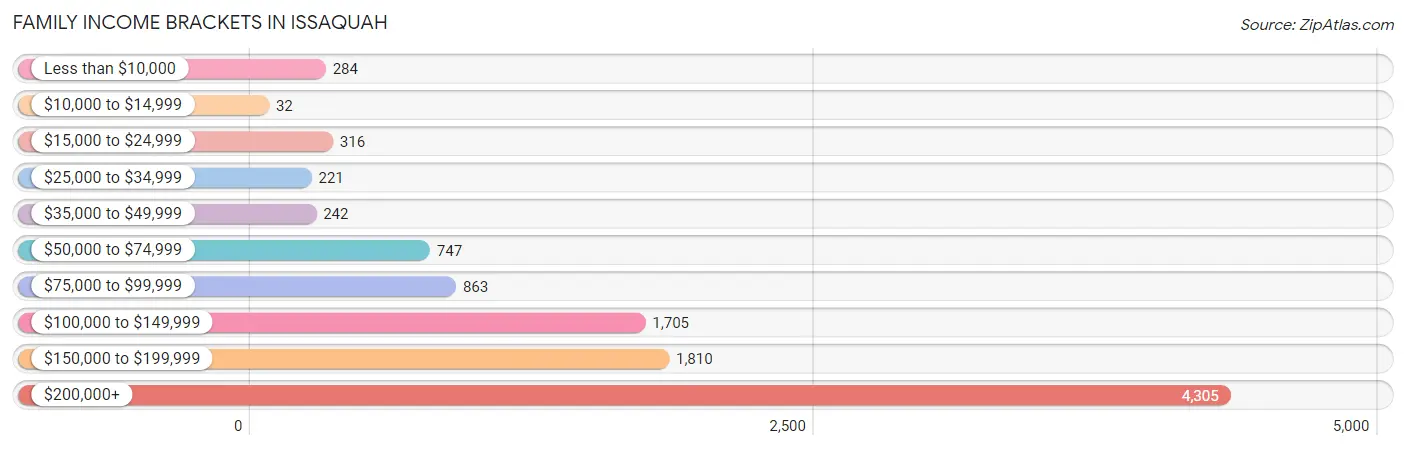
| Income Bracket | # Families | % Families |
| Less than $10,000 | 284 | 2.7% |
| $10,000 to $14,999 | 32 | 0.3% |
| $15,000 to $24,999 | 316 | 3.0% |
| $25,000 to $34,999 | 221 | 2.1% |
| $35,000 to $49,999 | 242 | 2.3% |
| $50,000 to $74,999 | 747 | 7.1% |
| $75,000 to $99,999 | 863 | 8.2% |
| $100,000 to $149,999 | 1,705 | 16.2% |
| $150,000 to $199,999 | 1,810 | 17.2% |
| $200,000+ | 4,305 | 40.9% |
Family Income by Famaliy Size in Issaquah
6-person families (62 | 0.6%) account for the highest median family income in Issaquah with $250,001 per family, while 2-person families (4,986 | 47.4%) have the highest median income of $74,535 per family member.
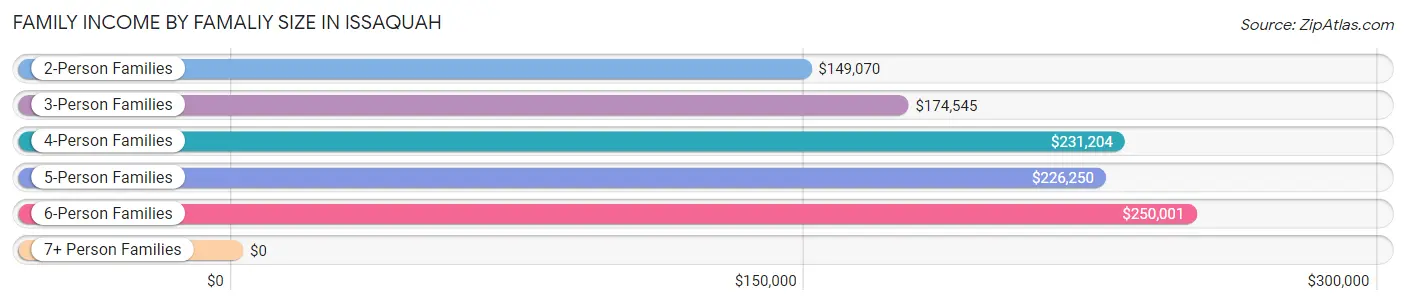
| Income Bracket | # Families | Median Income |
| 2-Person Families | 4,986 (47.4%) | $149,070 |
| 3-Person Families | 2,534 (24.1%) | $174,545 |
| 4-Person Families | 2,246 (21.3%) | $231,204 |
| 5-Person Families | 655 (6.2%) | $226,250 |
| 6-Person Families | 62 (0.6%) | $250,001 |
| 7+ Person Families | 43 (0.4%) | $0 |
| Total | 10,526 (100.0%) | $172,862 |
Family Income by Number of Earners in Issaquah
The median family income in Issaquah is $172,862, with families comprising 3+ earners (850) having the highest median family income of $231,651, while families with no earners (1,229) have the lowest median family income of $77,409, accounting for 8.1% and 11.7% of families, respectively.
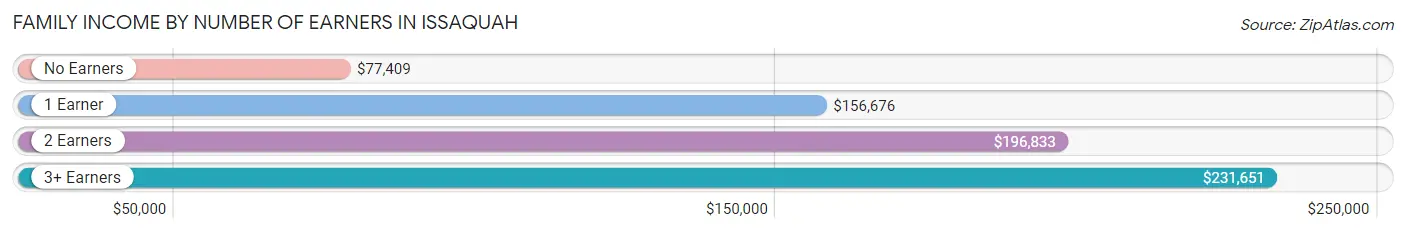
| Number of Earners | # Families | Median Income |
| No Earners | 1,229 (11.7%) | $77,409 |
| 1 Earner | 3,041 (28.9%) | $156,676 |
| 2 Earners | 5,406 (51.4%) | $196,833 |
| 3+ Earners | 850 (8.1%) | $231,651 |
| Total | 10,526 (100.0%) | $172,862 |
Household Income in Issaquah
Household Income Brackets in Issaquah
With 5,433 households falling in the category, the $200,000+ income range is the most frequent in Issaquah, accounting for 33.1% of all households. In contrast, only 115 households (0.7%) fall into the $10,000 to $14,999 income bracket, making it the least populous group.
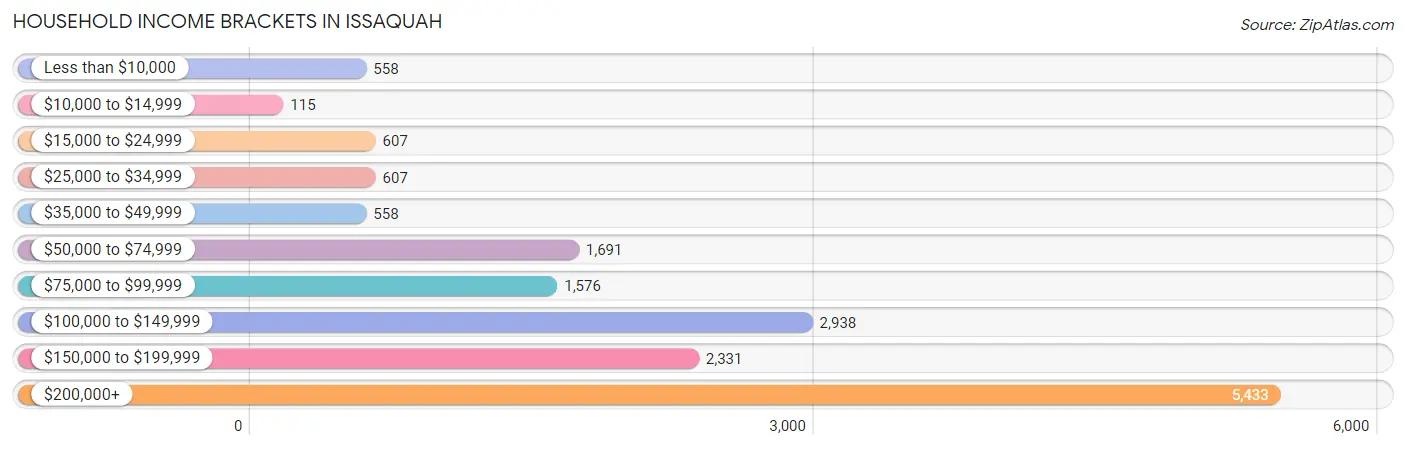
| Income Bracket | # Households | % Households |
| Less than $10,000 | 558 | 3.4% |
| $10,000 to $14,999 | 115 | 0.7% |
| $15,000 to $24,999 | 607 | 3.7% |
| $25,000 to $34,999 | 607 | 3.7% |
| $35,000 to $49,999 | 558 | 3.4% |
| $50,000 to $74,999 | 1,691 | 10.3% |
| $75,000 to $99,999 | 1,576 | 9.6% |
| $100,000 to $149,999 | 2,938 | 17.9% |
| $150,000 to $199,999 | 2,331 | 14.2% |
| $200,000+ | 5,433 | 33.1% |
Household Income by Householder Age in Issaquah
The median household income in Issaquah is $143,006, with the highest median household income of $164,007 found in the 45 to 64 years age bracket for the primary householder. A total of 5,501 households (33.5%) fall into this category. Meanwhile, the 15 to 24 years age bracket for the primary householder has the lowest median household income of $0, with 220 households (1.3%) in this group.
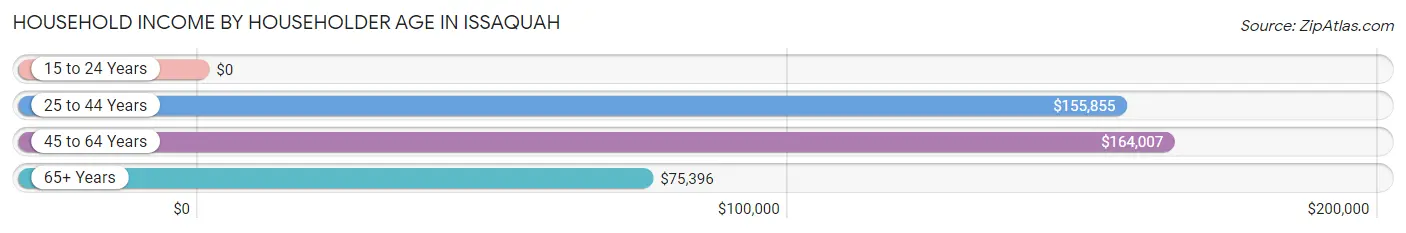
| Income Bracket | # Households | Median Income |
| 15 to 24 Years | 220 (1.3%) | $0 |
| 25 to 44 Years | 7,789 (47.4%) | $155,855 |
| 45 to 64 Years | 5,501 (33.5%) | $164,007 |
| 65+ Years | 2,905 (17.7%) | $75,396 |
| Total | 16,415 (100.0%) | $143,006 |
Poverty in Issaquah
Income Below Poverty by Sex and Age in Issaquah
With 6.2% poverty level for males and 7.1% for females among the residents of Issaquah, 16 and 17 year old males and 16 and 17 year old females are the most vulnerable to poverty, with 104 males (20.4%) and 54 females (14.6%) in their respective age groups living below the poverty level.
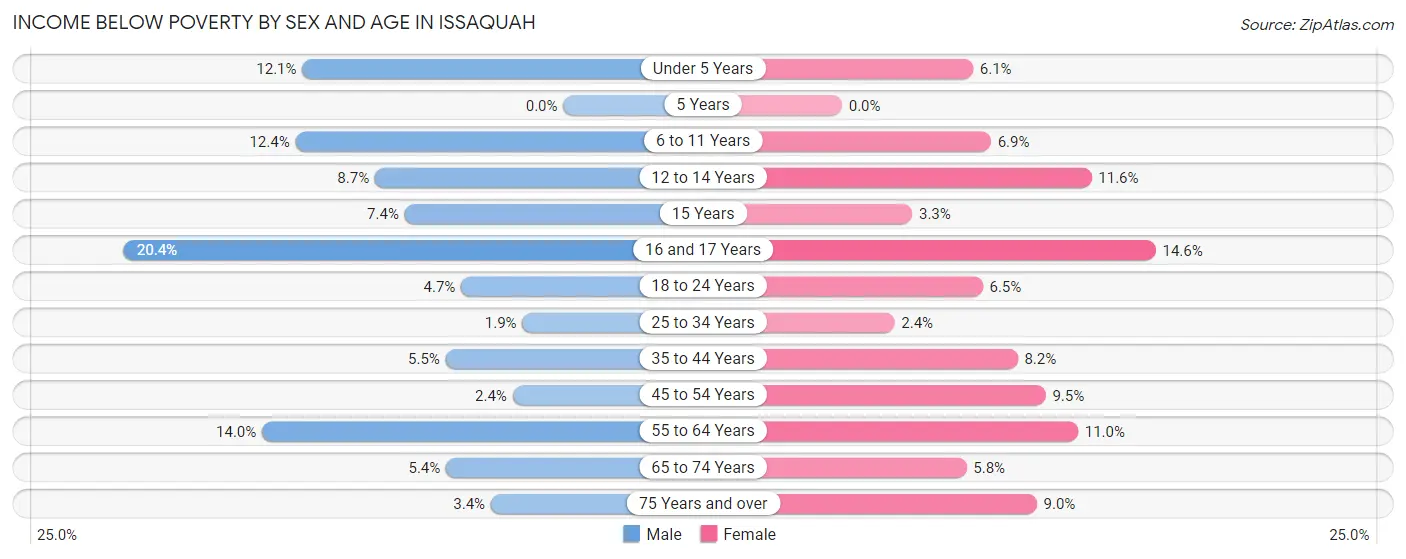
| Age Bracket | Male | Female |
| Under 5 Years | 113 (12.1%) | 59 (6.1%) |
| 5 Years | 0 (0.0%) | 0 (0.0%) |
| 6 to 11 Years | 175 (12.4%) | 104 (6.9%) |
| 12 to 14 Years | 59 (8.7%) | 74 (11.6%) |
| 15 Years | 24 (7.4%) | 15 (3.3%) |
| 16 and 17 Years | 104 (20.4%) | 54 (14.6%) |
| 18 to 24 Years | 42 (4.7%) | 75 (6.5%) |
| 25 to 34 Years | 74 (1.9%) | 94 (2.4%) |
| 35 to 44 Years | 214 (5.5%) | 269 (8.2%) |
| 45 to 54 Years | 69 (2.4%) | 267 (9.5%) |
| 55 to 64 Years | 239 (14.0%) | 190 (11.0%) |
| 65 to 74 Years | 53 (5.4%) | 64 (5.8%) |
| 75 Years and over | 32 (3.4%) | 135 (9.0%) |
| Total | 1,198 (6.2%) | 1,400 (7.1%) |
Income Above Poverty by Sex and Age in Issaquah
According to the poverty statistics in Issaquah, males aged 5 years and females aged 5 years are the age groups that are most secure financially, with 100.0% of males and 100.0% of females in these age groups living above the poverty line.
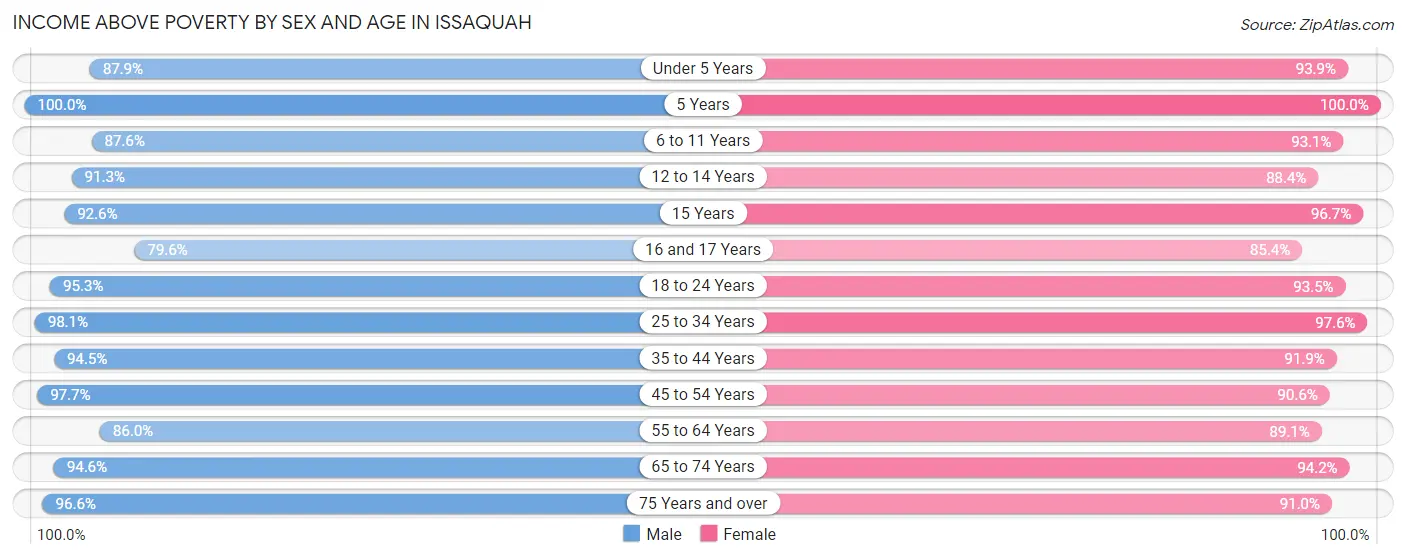
| Age Bracket | Male | Female |
| Under 5 Years | 820 (87.9%) | 912 (93.9%) |
| 5 Years | 317 (100.0%) | 165 (100.0%) |
| 6 to 11 Years | 1,233 (87.6%) | 1,402 (93.1%) |
| 12 to 14 Years | 616 (91.3%) | 565 (88.4%) |
| 15 Years | 302 (92.6%) | 445 (96.7%) |
| 16 and 17 Years | 406 (79.6%) | 317 (85.4%) |
| 18 to 24 Years | 844 (95.3%) | 1,074 (93.5%) |
| 25 to 34 Years | 3,818 (98.1%) | 3,761 (97.6%) |
| 35 to 44 Years | 3,708 (94.5%) | 3,032 (91.8%) |
| 45 to 54 Years | 2,863 (97.7%) | 2,558 (90.5%) |
| 55 to 64 Years | 1,471 (86.0%) | 1,545 (89.0%) |
| 65 to 74 Years | 922 (94.6%) | 1,044 (94.2%) |
| 75 Years and over | 919 (96.6%) | 1,358 (91.0%) |
| Total | 18,239 (93.8%) | 18,178 (92.8%) |
Income Below Poverty Among Married-Couple Families in Issaquah
The poverty statistics for married-couple families in Issaquah show that 4.5% or 398 of the total 8,868 families live below the poverty line. Families with 1 or 2 children have the highest poverty rate of 7.0%, comprising of 263 families. On the other hand, families with no children have the lowest poverty rate of 2.4%, which includes 112 families.
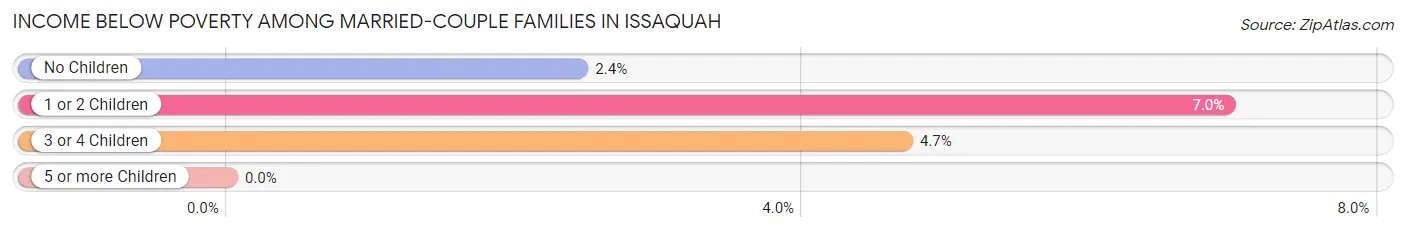
| Children | Above Poverty | Below Poverty |
| No Children | 4,483 (97.6%) | 112 (2.4%) |
| 1 or 2 Children | 3,521 (93.0%) | 263 (7.0%) |
| 3 or 4 Children | 466 (95.3%) | 23 (4.7%) |
| 5 or more Children | 0 (0.0%) | 0 (0.0%) |
| Total | 8,470 (95.5%) | 398 (4.5%) |
Income Below Poverty Among Single-Parent Households in Issaquah
According to the poverty data in Issaquah, 4.7% or 25 single-father households and 19.8% or 224 single-mother households are living below the poverty line. Among single-father households, those with 1 or 2 children have the highest poverty rate, with 25 households (10.2%) experiencing poverty. Likewise, among single-mother households, those with 3 or 4 children have the highest poverty rate, with 35 households (76.1%) falling below the poverty line.
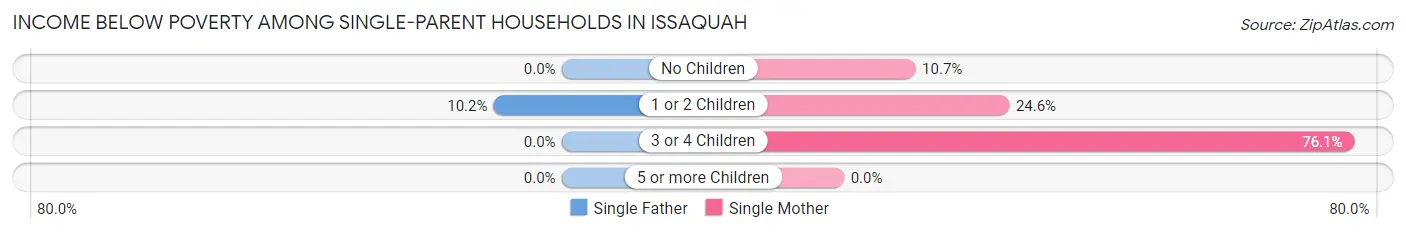
| Children | Single Father | Single Mother |
| No Children | 0 (0.0%) | 56 (10.6%) |
| 1 or 2 Children | 25 (10.2%) | 133 (24.6%) |
| 3 or 4 Children | 0 (0.0%) | 35 (76.1%) |
| 5 or more Children | 0 (0.0%) | 0 (0.0%) |
| Total | 25 (4.7%) | 224 (19.8%) |
Income Below Poverty Among Married-Couple vs Single-Parent Households in Issaquah
The poverty data for Issaquah shows that 398 of the married-couple family households (4.5%) and 249 of the single-parent households (15.0%) are living below the poverty level. Within the married-couple family households, those with 1 or 2 children have the highest poverty rate, with 263 households (7.0%) falling below the poverty line. Among the single-parent households, those with 3 or 4 children have the highest poverty rate, with 35 household (61.4%) living below poverty.
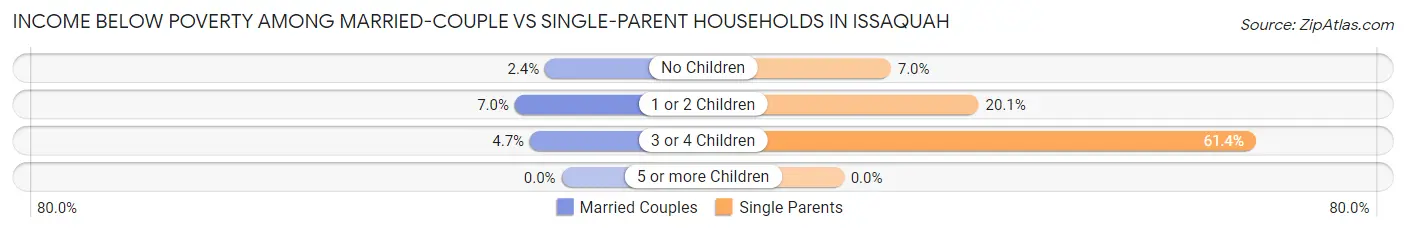
| Children | Married-Couple Families | Single-Parent Households |
| No Children | 112 (2.4%) | 56 (7.0%) |
| 1 or 2 Children | 263 (7.0%) | 158 (20.1%) |
| 3 or 4 Children | 23 (4.7%) | 35 (61.4%) |
| 5 or more Children | 0 (0.0%) | 0 (0.0%) |
| Total | 398 (4.5%) | 249 (15.0%) |
Race in Issaquah
The most populous races in Issaquah are White / Caucasian (23,457 | 59.5%), Asian (10,441 | 26.5%), and Two or more Races (3,360 | 8.5%).
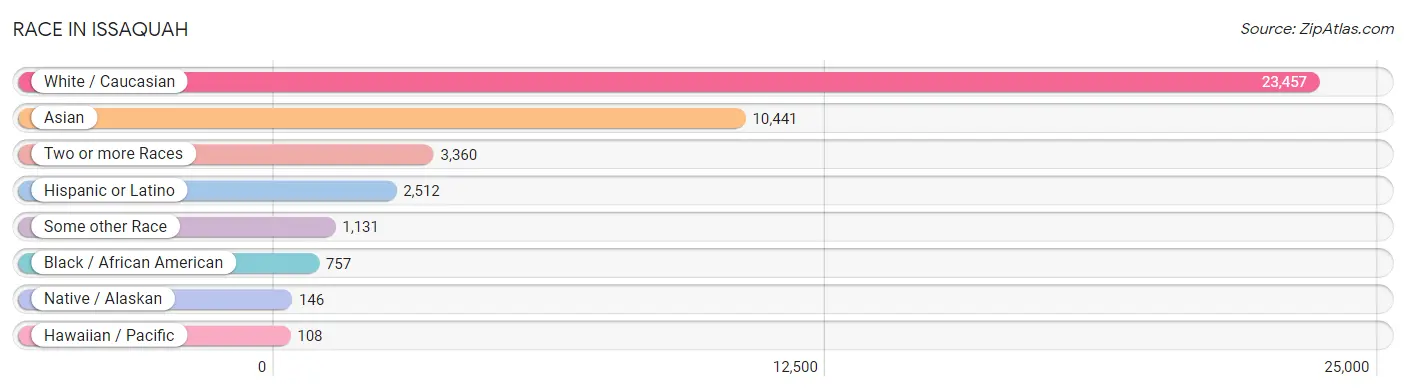
| Race | # Population | % Population |
| Asian | 10,441 | 26.5% |
| Black / African American | 757 | 1.9% |
| Hawaiian / Pacific | 108 | 0.3% |
| Hispanic or Latino | 2,512 | 6.4% |
| Native / Alaskan | 146 | 0.4% |
| White / Caucasian | 23,457 | 59.5% |
| Two or more Races | 3,360 | 8.5% |
| Some other Race | 1,131 | 2.9% |
| Total | 39,400 | 100.0% |
Ancestry in Issaquah
The most populous ancestries reported in Issaquah are English (4,510 | 11.5%), German (4,382 | 11.1%), Indian (Asian) (4,313 | 11.0%), Thai (3,964 | 10.1%), and Irish (2,428 | 6.2%), together accounting for 49.7% of all Issaquah residents.
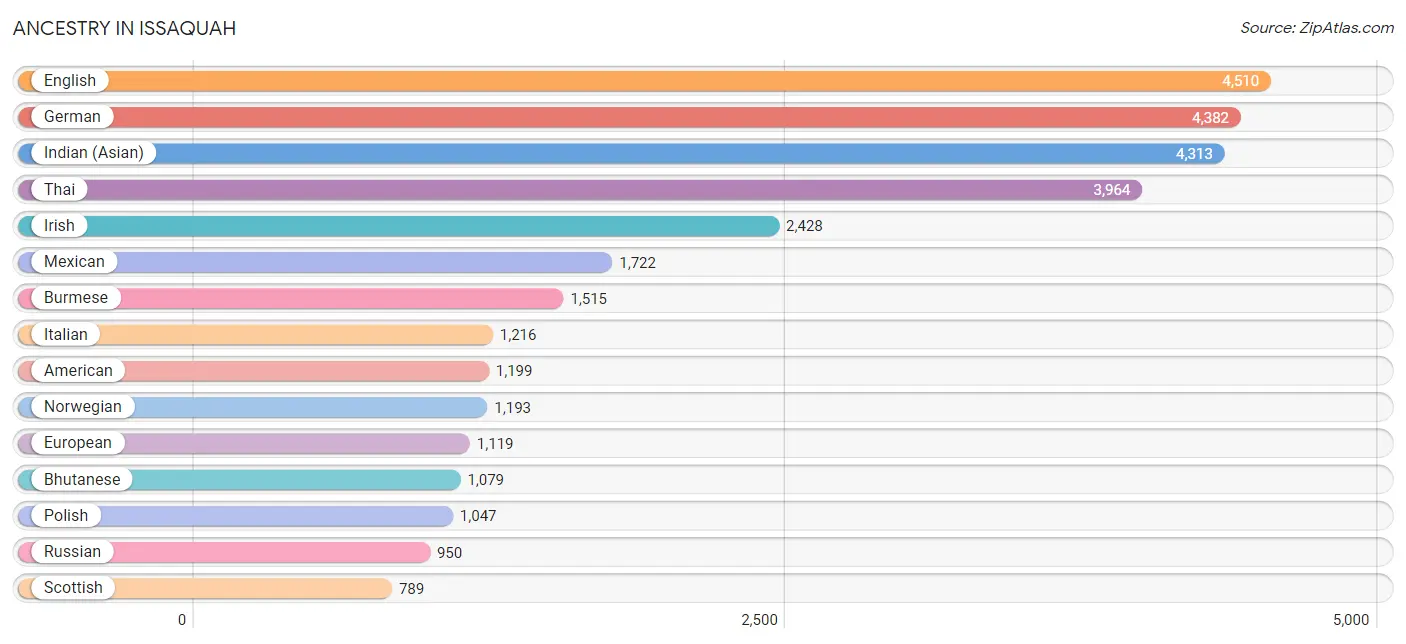
| Ancestry | # Population | % Population |
| African | 264 | 0.7% |
| Alaskan Athabascan | 11 | 0.0% |
| Aleut | 20 | 0.1% |
| Alsatian | 25 | 0.1% |
| American | 1,199 | 3.0% |
| Arab | 217 | 0.5% |
| Australian | 275 | 0.7% |
| Austrian | 145 | 0.4% |
| Basque | 12 | 0.0% |
| Belgian | 25 | 0.1% |
| Bermudan | 18 | 0.1% |
| Bhutanese | 1,079 | 2.7% |
| Blackfeet | 59 | 0.2% |
| Brazilian | 495 | 1.3% |
| British | 517 | 1.3% |
| Bulgarian | 12 | 0.0% |
| Burmese | 1,515 | 3.8% |
| Canadian | 208 | 0.5% |
| Celtic | 44 | 0.1% |
| Central American | 41 | 0.1% |
| Central American Indian | 36 | 0.1% |
| Cherokee | 130 | 0.3% |
| Chilean | 48 | 0.1% |
| Colombian | 17 | 0.0% |
| Comanche | 18 | 0.1% |
| Croatian | 67 | 0.2% |
| Cuban | 60 | 0.2% |
| Czech | 125 | 0.3% |
| Czechoslovakian | 154 | 0.4% |
| Danish | 99 | 0.3% |
| Dutch | 344 | 0.9% |
| Eastern European | 276 | 0.7% |
| Egyptian | 36 | 0.1% |
| English | 4,510 | 11.5% |
| European | 1,119 | 2.8% |
| Filipino | 208 | 0.5% |
| Finnish | 180 | 0.5% |
| French | 755 | 1.9% |
| French American Indian | 26 | 0.1% |
| French Canadian | 195 | 0.5% |
| German | 4,382 | 11.1% |
| Greek | 168 | 0.4% |
| Guatemalan | 11 | 0.0% |
| Hungarian | 165 | 0.4% |
| Indian (Asian) | 4,313 | 11.0% |
| Inupiat | 25 | 0.1% |
| Iranian | 102 | 0.3% |
| Iraqi | 82 | 0.2% |
| Irish | 2,428 | 6.2% |
| Iroquois | 20 | 0.1% |
| Italian | 1,216 | 3.1% |
| Korean | 495 | 1.3% |
| Laotian | 28 | 0.1% |
| Latvian | 24 | 0.1% |
| Lebanese | 5 | 0.0% |
| Lithuanian | 144 | 0.4% |
| Malaysian | 140 | 0.4% |
| Marshallese | 179 | 0.4% |
| Mexican | 1,722 | 4.4% |
| Mexican American Indian | 57 | 0.1% |
| Mongolian | 15 | 0.0% |
| Native Hawaiian | 57 | 0.1% |
| New Zealander | 21 | 0.1% |
| Northern European | 167 | 0.4% |
| Norwegian | 1,193 | 3.0% |
| Pakistani | 12 | 0.0% |
| Palestinian | 17 | 0.0% |
| Pennsylvania German | 27 | 0.1% |
| Peruvian | 52 | 0.1% |
| Polish | 1,047 | 2.7% |
| Portuguese | 90 | 0.2% |
| Puerto Rican | 210 | 0.5% |
| Puget Sound Salish | 43 | 0.1% |
| Romanian | 81 | 0.2% |
| Russian | 950 | 2.4% |
| Salvadoran | 30 | 0.1% |
| Samoan | 210 | 0.5% |
| Scandinavian | 204 | 0.5% |
| Scotch-Irish | 397 | 1.0% |
| Scottish | 789 | 2.0% |
| Slavic | 26 | 0.1% |
| Slovak | 4 | 0.0% |
| South American | 144 | 0.4% |
| Spaniard | 180 | 0.5% |
| Sri Lankan | 443 | 1.1% |
| Subsaharan African | 520 | 1.3% |
| Sudanese | 256 | 0.6% |
| Swedish | 685 | 1.7% |
| Swiss | 159 | 0.4% |
| Syrian | 62 | 0.2% |
| Thai | 3,964 | 10.1% |
| Tlingit-Haida | 10 | 0.0% |
| Trinidadian and Tobagonian | 18 | 0.1% |
| Turkish | 162 | 0.4% |
| Ukrainian | 586 | 1.5% |
| Venezuelan | 27 | 0.1% |
| Welsh | 175 | 0.4% |
| Yup'ik | 10 | 0.0% | View All 98 Rows |
Immigrants in Issaquah
The most numerous immigrant groups reported in Issaquah came from Asia (7,464 | 18.9%), Eastern Asia (3,696 | 9.4%), South Central Asia (2,961 | 7.5%), China (2,798 | 7.1%), and India (2,745 | 7.0%), together accounting for 49.9% of all Issaquah residents.
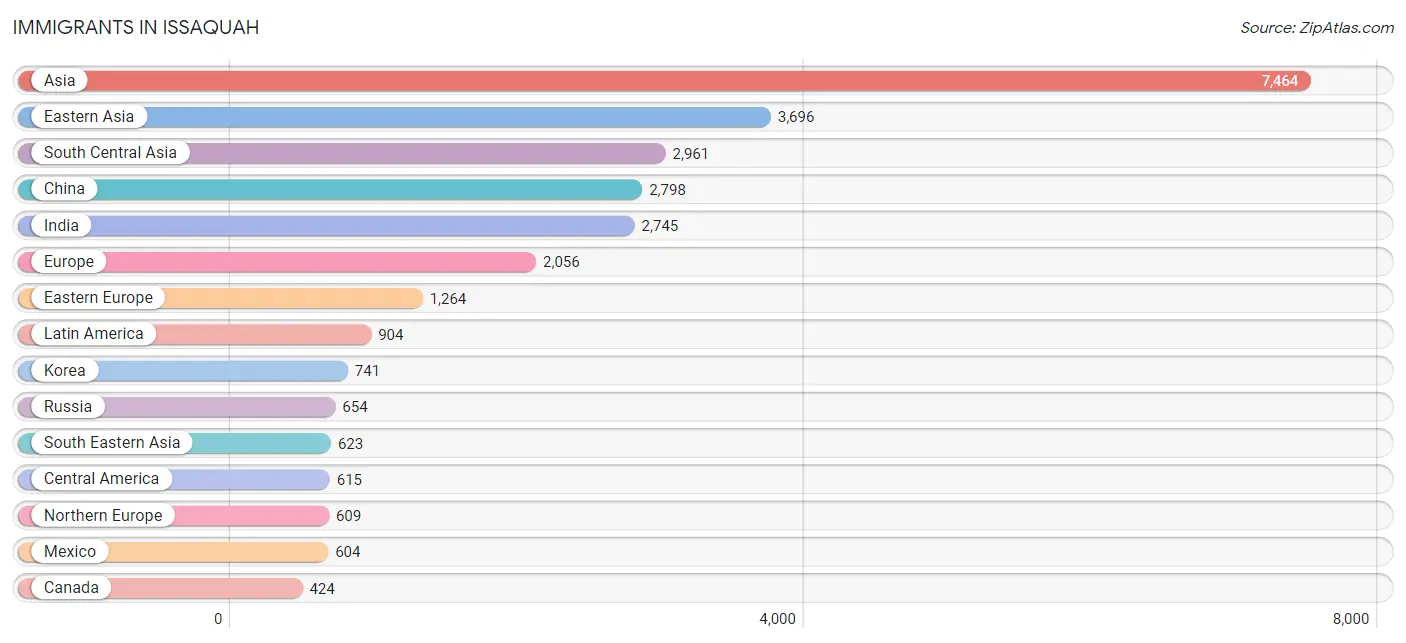
| Immigration Origin | # Population | % Population |
| Africa | 399 | 1.0% |
| Asia | 7,464 | 18.9% |
| Australia | 237 | 0.6% |
| Belarus | 80 | 0.2% |
| Brazil | 250 | 0.6% |
| Bulgaria | 12 | 0.0% |
| Cambodia | 56 | 0.1% |
| Canada | 424 | 1.1% |
| Central America | 615 | 1.6% |
| Chile | 22 | 0.1% |
| China | 2,798 | 7.1% |
| Croatia | 42 | 0.1% |
| Czechoslovakia | 47 | 0.1% |
| Eastern Africa | 138 | 0.4% |
| Eastern Asia | 3,696 | 9.4% |
| Eastern Europe | 1,264 | 3.2% |
| Egypt | 6 | 0.0% |
| England | 257 | 0.6% |
| Europe | 2,056 | 5.2% |
| France | 10 | 0.0% |
| Germany | 90 | 0.2% |
| Guatemala | 11 | 0.0% |
| Hong Kong | 198 | 0.5% |
| India | 2,745 | 7.0% |
| Indonesia | 14 | 0.0% |
| Iran | 68 | 0.2% |
| Iraq | 82 | 0.2% |
| Ireland | 119 | 0.3% |
| Japan | 157 | 0.4% |
| Korea | 741 | 1.9% |
| Laos | 62 | 0.2% |
| Latin America | 904 | 2.3% |
| Malaysia | 15 | 0.0% |
| Mexico | 604 | 1.5% |
| Micronesia | 81 | 0.2% |
| Moldova | 29 | 0.1% |
| Netherlands | 47 | 0.1% |
| Northern Africa | 196 | 0.5% |
| Northern Europe | 609 | 1.5% |
| Oceania | 351 | 0.9% |
| Pakistan | 148 | 0.4% |
| Peru | 17 | 0.0% |
| Philippines | 164 | 0.4% |
| Poland | 130 | 0.3% |
| Romania | 42 | 0.1% |
| Russia | 654 | 1.7% |
| Scotland | 7 | 0.0% |
| Singapore | 97 | 0.3% |
| South Africa | 65 | 0.2% |
| South America | 289 | 0.7% |
| South Central Asia | 2,961 | 7.5% |
| South Eastern Asia | 623 | 1.6% |
| Southern Europe | 36 | 0.1% |
| Spain | 36 | 0.1% |
| Sudan | 190 | 0.5% |
| Sweden | 8 | 0.0% |
| Taiwan | 242 | 0.6% |
| Thailand | 12 | 0.0% |
| Turkey | 102 | 0.3% |
| Ukraine | 228 | 0.6% |
| Vietnam | 203 | 0.5% |
| Western Asia | 184 | 0.5% |
| Western Europe | 147 | 0.4% | View All 63 Rows |
Sex and Age in Issaquah
Sex and Age in Issaquah
The most populous age groups in Issaquah are 35 to 39 Years (2,100 | 10.7%) for men and 30 to 34 Years (2,421 | 12.2%) for women.
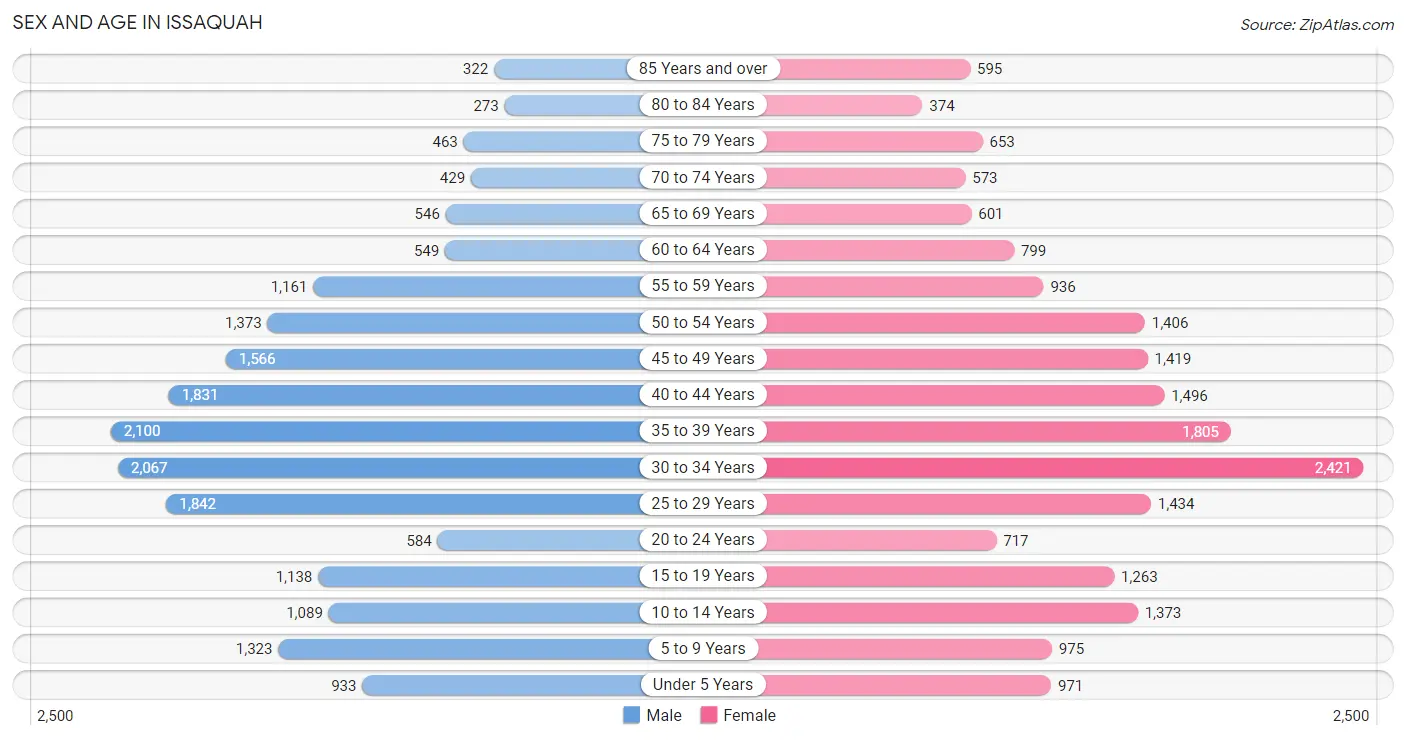
| Age Bracket | Male | Female |
| Under 5 Years | 933 (4.8%) | 971 (4.9%) |
| 5 to 9 Years | 1,323 (6.8%) | 975 (4.9%) |
| 10 to 14 Years | 1,089 (5.6%) | 1,373 (6.9%) |
| 15 to 19 Years | 1,138 (5.8%) | 1,263 (6.4%) |
| 20 to 24 Years | 584 (3.0%) | 717 (3.6%) |
| 25 to 29 Years | 1,842 (9.4%) | 1,434 (7.2%) |
| 30 to 34 Years | 2,067 (10.5%) | 2,421 (12.2%) |
| 35 to 39 Years | 2,100 (10.7%) | 1,805 (9.1%) |
| 40 to 44 Years | 1,831 (9.3%) | 1,496 (7.5%) |
| 45 to 49 Years | 1,566 (8.0%) | 1,419 (7.2%) |
| 50 to 54 Years | 1,373 (7.0%) | 1,406 (7.1%) |
| 55 to 59 Years | 1,161 (5.9%) | 936 (4.7%) |
| 60 to 64 Years | 549 (2.8%) | 799 (4.0%) |
| 65 to 69 Years | 546 (2.8%) | 601 (3.0%) |
| 70 to 74 Years | 429 (2.2%) | 573 (2.9%) |
| 75 to 79 Years | 463 (2.4%) | 653 (3.3%) |
| 80 to 84 Years | 273 (1.4%) | 374 (1.9%) |
| 85 Years and over | 322 (1.6%) | 595 (3.0%) |
| Total | 19,589 (100.0%) | 19,811 (100.0%) |
Families and Households in Issaquah
Median Family Size in Issaquah
The median family size in Issaquah is 2.89 persons per family, with single female/mother families (1,129 | 10.7%) accounting for the largest median family size of 2.98 persons per family. On the other hand, single male/father families (529 | 5.0%) represent the smallest median family size with 2.35 persons per family.
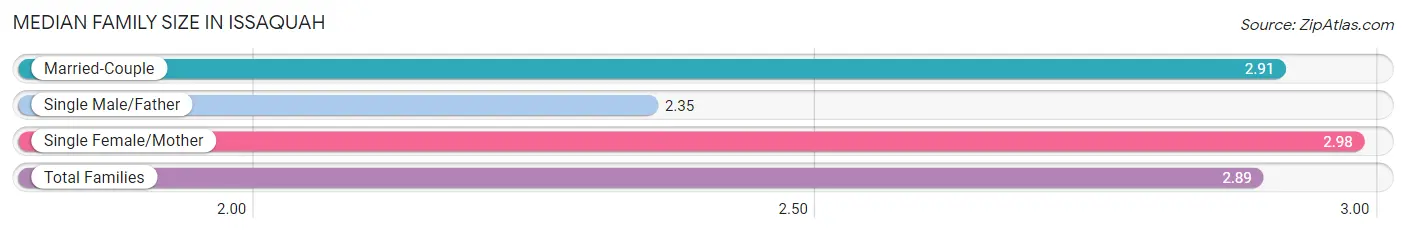
| Family Type | # Families | Family Size |
| Married-Couple | 8,868 (84.3%) | 2.91 |
| Single Male/Father | 529 (5.0%) | 2.35 |
| Single Female/Mother | 1,129 (10.7%) | 2.98 |
| Total Families | 10,526 (100.0%) | 2.89 |
Median Household Size in Issaquah
The median household size in Issaquah is 2.38 persons per household, with single female/mother households (1,129 | 6.9%) accounting for the largest median household size of 3.09 persons per household. non-family households (5,889 | 35.9%) represent the smallest median household size with 1.40 persons per household.
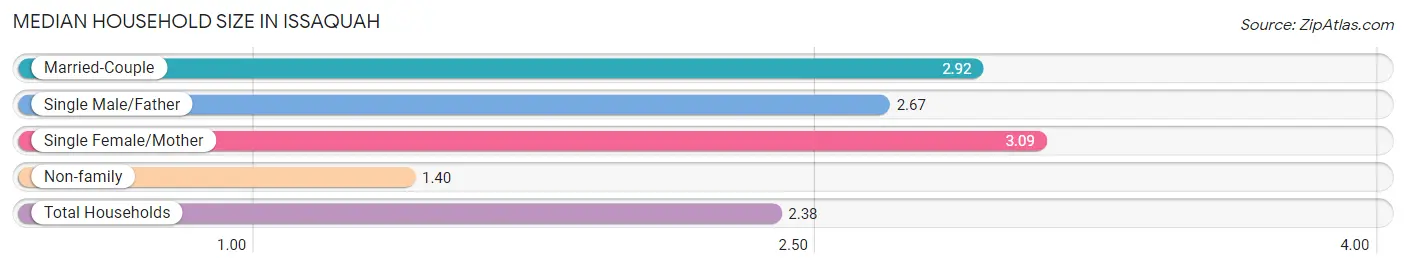
| Household Type | # Households | Household Size |
| Married-Couple | 8,868 (54.0%) | 2.92 |
| Single Male/Father | 529 (3.2%) | 2.67 |
| Single Female/Mother | 1,129 (6.9%) | 3.09 |
| Non-family | 5,889 (35.9%) | 1.40 |
| Total Households | 16,415 (100.0%) | 2.38 |
Household Size by Marriage Status in Issaquah
Out of a total of 16,415 households in Issaquah, 10,526 (64.1%) are family households, while 5,889 (35.9%) are nonfamily households. The most numerous type of family households are 2-person households, comprising 4,874, and the most common type of nonfamily households are 1-person households, comprising 4,040.
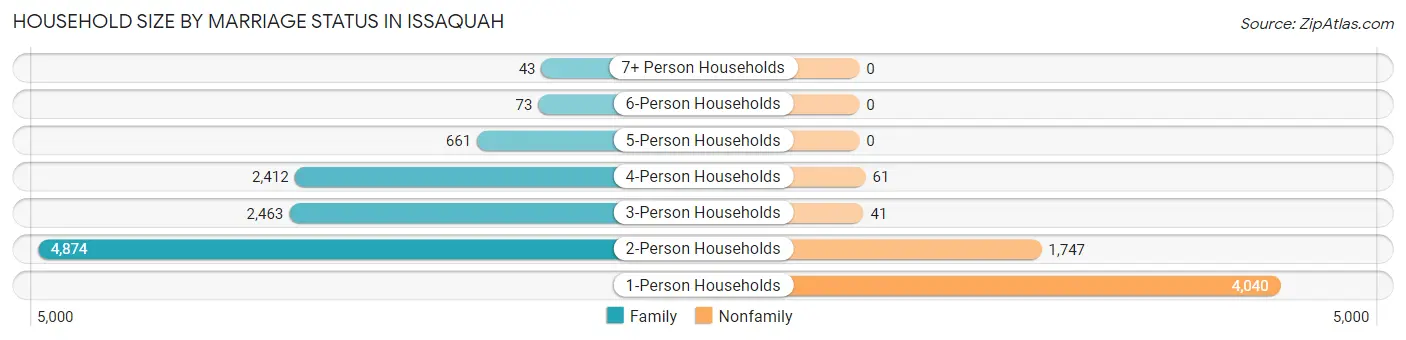
| Household Size | Family Households | Nonfamily Households |
| 1-Person Households | - | 4,040 (24.6%) |
| 2-Person Households | 4,874 (29.7%) | 1,747 (10.6%) |
| 3-Person Households | 2,463 (15.0%) | 41 (0.3%) |
| 4-Person Households | 2,412 (14.7%) | 61 (0.4%) |
| 5-Person Households | 661 (4.0%) | 0 (0.0%) |
| 6-Person Households | 73 (0.4%) | 0 (0.0%) |
| 7+ Person Households | 43 (0.3%) | 0 (0.0%) |
| Total | 10,526 (64.1%) | 5,889 (35.9%) |
Female Fertility in Issaquah
Fertility by Age in Issaquah
Average fertility rate in Issaquah is 32.0 births per 1,000 women. Women in the age bracket of 20 to 34 years have the highest fertility rate with 53.0 births per 1,000 women. Women in the age bracket of 20 to 34 years acount for 70.3% of all women with births.
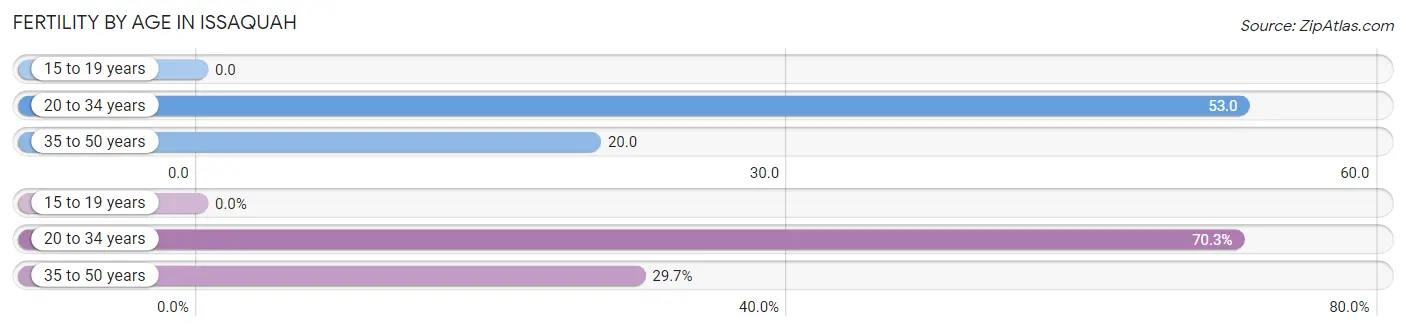
| Age Bracket | Women with Births | Births / 1,000 Women |
| 15 to 19 years | 0 (0.0%) | 0.0 |
| 20 to 34 years | 244 (70.3%) | 53.0 |
| 35 to 50 years | 103 (29.7%) | 20.0 |
| Total | 347 (100.0%) | 32.0 |
Fertility by Age by Marriage Status in Issaquah
76.7% of women with births (347) in Issaquah are married. The highest percentage of unmarried women with births falls into 35 to 50 years age bracket with 27.2% of them unmarried at the time of birth, while the lowest percentage of unmarried women with births belong to 20 to 34 years age bracket with 21.7% of them unmarried.
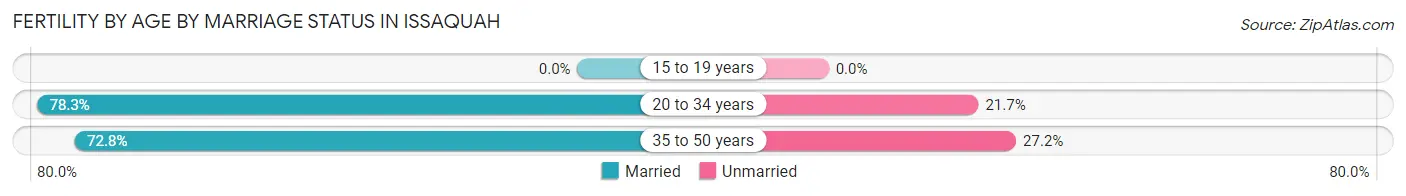
| Age Bracket | Married | Unmarried |
| 15 to 19 years | 0 (0.0%) | 0 (0.0%) |
| 20 to 34 years | 191 (78.3%) | 53 (21.7%) |
| 35 to 50 years | 75 (72.8%) | 28 (27.2%) |
| Total | 266 (76.7%) | 81 (23.3%) |
Fertility by Education in Issaquah
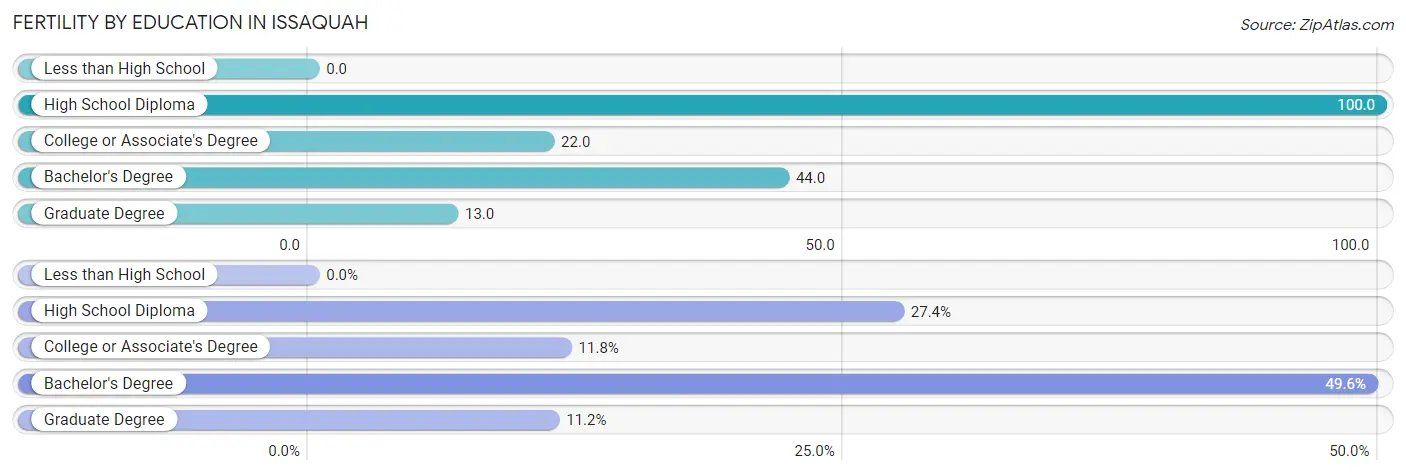
| Educational Attainment | Women with Births | Births / 1,000 Women |
| Less than High School | 0 (0.0%) | 0.0 |
| High School Diploma | 95 (27.4%) | 100.0 |
| College or Associate's Degree | 41 (11.8%) | 22.0 |
| Bachelor's Degree | 172 (49.6%) | 44.0 |
| Graduate Degree | 39 (11.2%) | 13.0 |
| Total | 347 (100.0%) | 32.0 |
Fertility by Education by Marriage Status in Issaquah
23.3% of women with births in Issaquah are unmarried. Women with the educational attainment of college or associate's degree are most likely to be married with 100.0% of them married at childbirth, while women with the educational attainment of high school diploma are least likely to be married with 55.8% of them unmarried at childbirth.
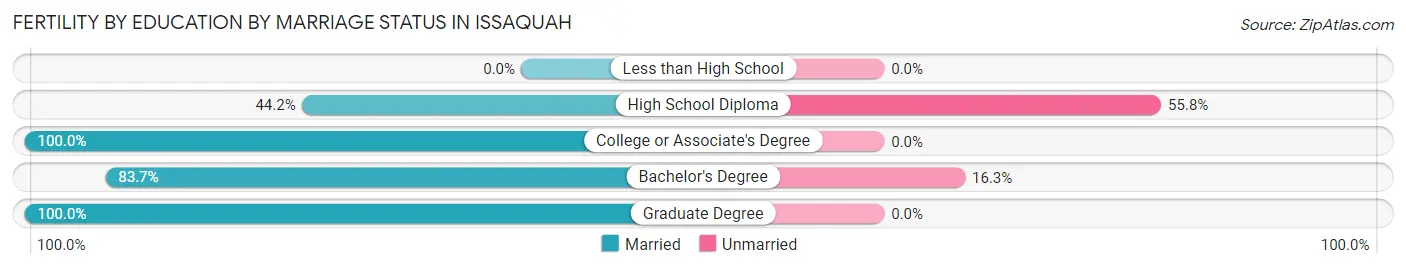
| Educational Attainment | Married | Unmarried |
| Less than High School | 0 (0.0%) | 0 (0.0%) |
| High School Diploma | 42 (44.2%) | 53 (55.8%) |
| College or Associate's Degree | 41 (100.0%) | 0 (0.0%) |
| Bachelor's Degree | 144 (83.7%) | 28 (16.3%) |
| Graduate Degree | 39 (100.0%) | 0 (0.0%) |
| Total | 266 (76.7%) | 81 (23.3%) |
Employment Characteristics in Issaquah
Employment by Class of Employer in Issaquah
Among the 22,117 employed individuals in Issaquah, private company employees (17,333 | 78.4%), not-for-profit organizations (1,216 | 5.5%), and self-employed (not incorporated) (1,038 | 4.7%) make up the most common classes of employment.
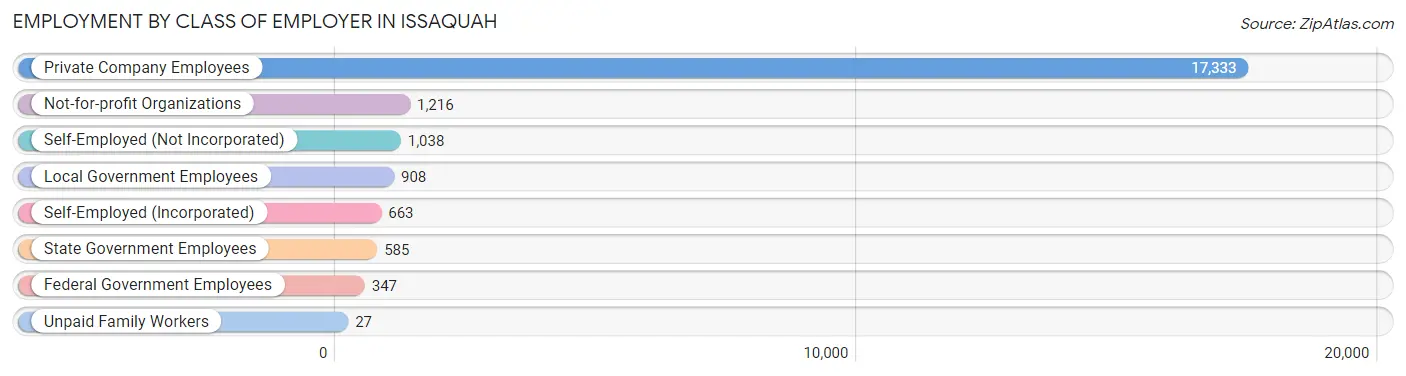
| Employer Class | # Employees | % Employees |
| Private Company Employees | 17,333 | 78.4% |
| Self-Employed (Incorporated) | 663 | 3.0% |
| Self-Employed (Not Incorporated) | 1,038 | 4.7% |
| Not-for-profit Organizations | 1,216 | 5.5% |
| Local Government Employees | 908 | 4.1% |
| State Government Employees | 585 | 2.6% |
| Federal Government Employees | 347 | 1.6% |
| Unpaid Family Workers | 27 | 0.1% |
| Total | 22,117 | 100.0% |
Employment Status by Age in Issaquah
According to the labor force statistics for Issaquah, out of the total population over 16 years of age (31,950), 73.3% or 23,419 individuals are in the labor force, with 3.2% or 749 of them unemployed. The age group with the highest labor force participation rate is 20 to 24 years, with 92.8% or 1,207 individuals in the labor force. Within the labor force, the 16 to 19 years age range has the highest percentage of unemployed individuals, with 11.1% or 74 of them being unemployed.
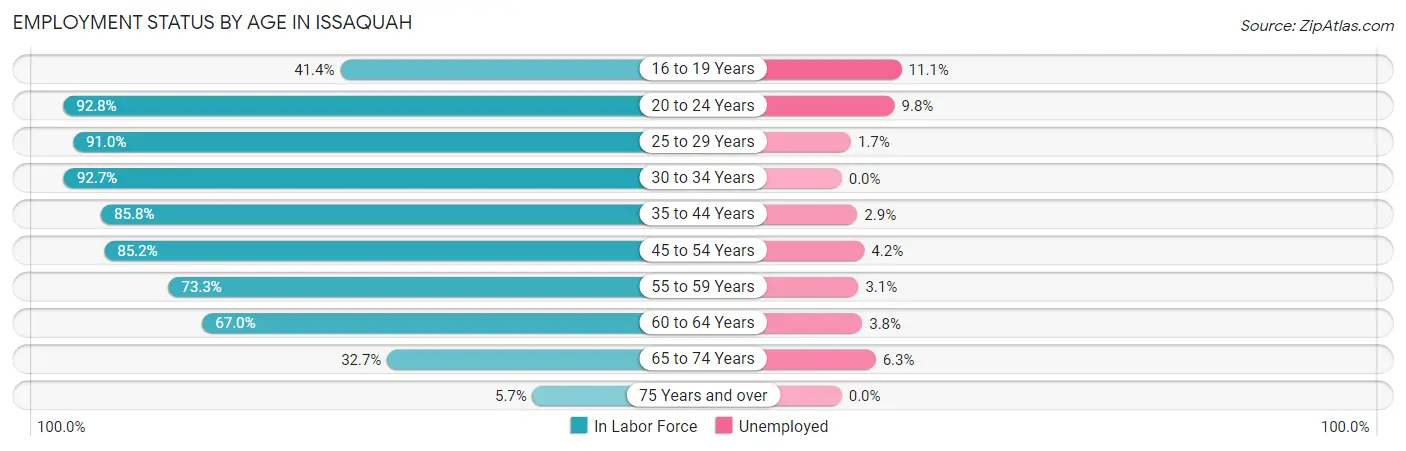
| Age Bracket | In Labor Force | Unemployed |
| 16 to 19 Years | 669 (41.4%) | 74 (11.1%) |
| 20 to 24 Years | 1,207 (92.8%) | 118 (9.8%) |
| 25 to 29 Years | 2,981 (91.0%) | 51 (1.7%) |
| 30 to 34 Years | 4,160 (92.7%) | 0 (0.0%) |
| 35 to 44 Years | 6,205 (85.8%) | 180 (2.9%) |
| 45 to 54 Years | 4,911 (85.2%) | 206 (4.2%) |
| 55 to 59 Years | 1,537 (73.3%) | 48 (3.1%) |
| 60 to 64 Years | 903 (67.0%) | 34 (3.8%) |
| 65 to 74 Years | 703 (32.7%) | 44 (6.3%) |
| 75 Years and over | 153 (5.7%) | 0 (0.0%) |
| Total | 23,419 (73.3%) | 749 (3.2%) |
Employment Status by Educational Attainment in Issaquah
According to labor force statistics for Issaquah, 85.5% of individuals (20,695) out of the total population between 25 and 64 years of age (24,205) are in the labor force, with 2.5% or 517 of them being unemployed. The group with the highest labor force participation rate are those with the educational attainment of bachelor's degree or higher, with 87.0% or 14,767 individuals in the labor force. Within the labor force, individuals with less than high school education have the highest percentage of unemployment, with 6.5% or 28 of them being unemployed.
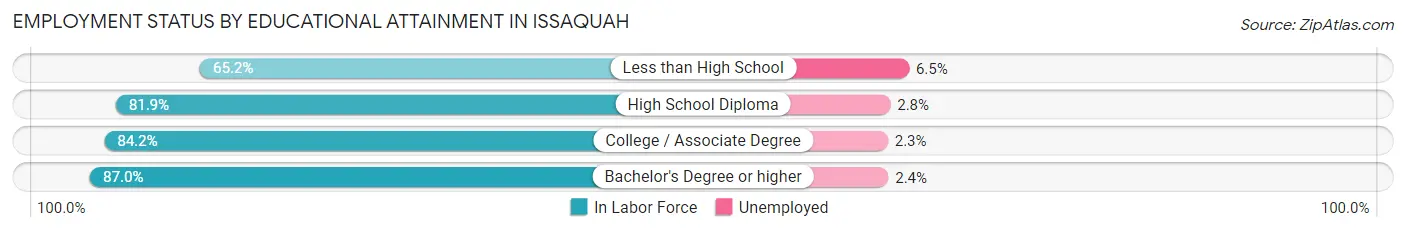
| Educational Attainment | In Labor Force | Unemployed |
| Less than High School | 430 (65.2%) | 43 (6.5%) |
| High School Diploma | 1,492 (81.9%) | 51 (2.8%) |
| College / Associate Degree | 4,000 (84.2%) | 109 (2.3%) |
| Bachelor's Degree or higher | 14,767 (87.0%) | 407 (2.4%) |
| Total | 20,695 (85.5%) | 605 (2.5%) |
Employment Occupations by Sex in Issaquah
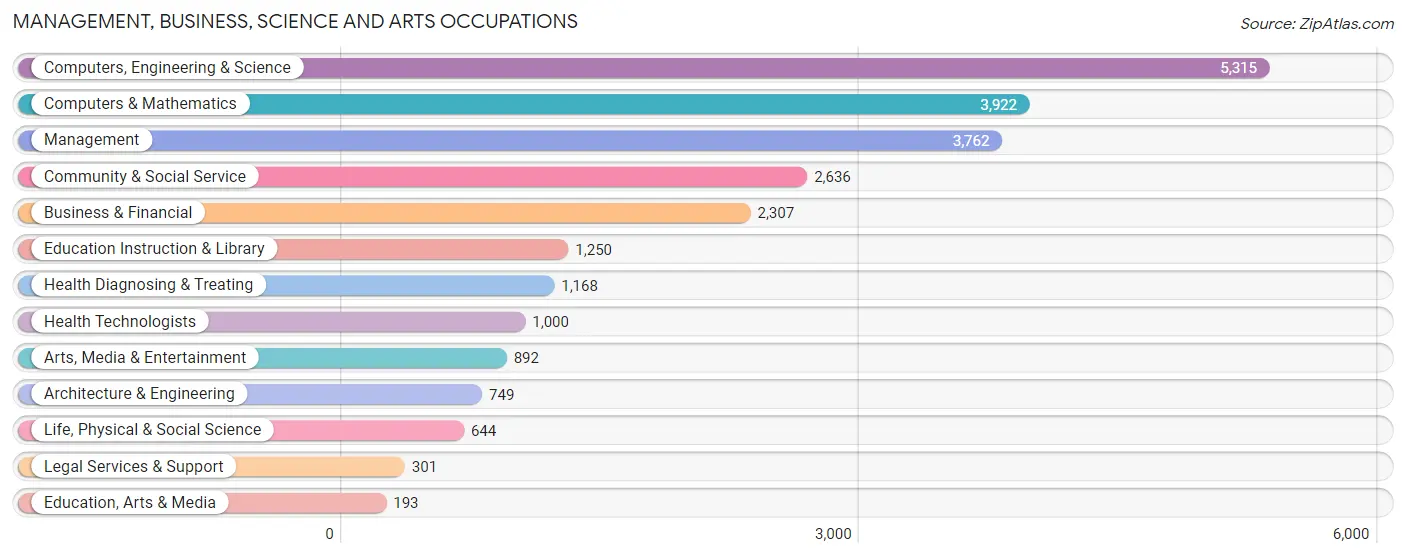
Management, Business, Science and Arts Occupations
The most common Management, Business, Science and Arts occupations in Issaquah are Computers, Engineering & Science (5,315 | 23.5%), Computers & Mathematics (3,922 | 17.3%), Management (3,762 | 16.6%), Community & Social Service (2,636 | 11.6%), and Business & Financial (2,307 | 10.2%).
Management, Business, Science and Arts Occupations by Sex
Within the Management, Business, Science and Arts occupations in Issaquah, the most male-oriented occupations are Architecture & Engineering (76.4%), Computers & Mathematics (75.4%), and Computers, Engineering & Science (74.2%), while the most female-oriented occupations are Legal Services & Support (91.4%), Education Instruction & Library (88.2%), and Health Technologists (70.5%).
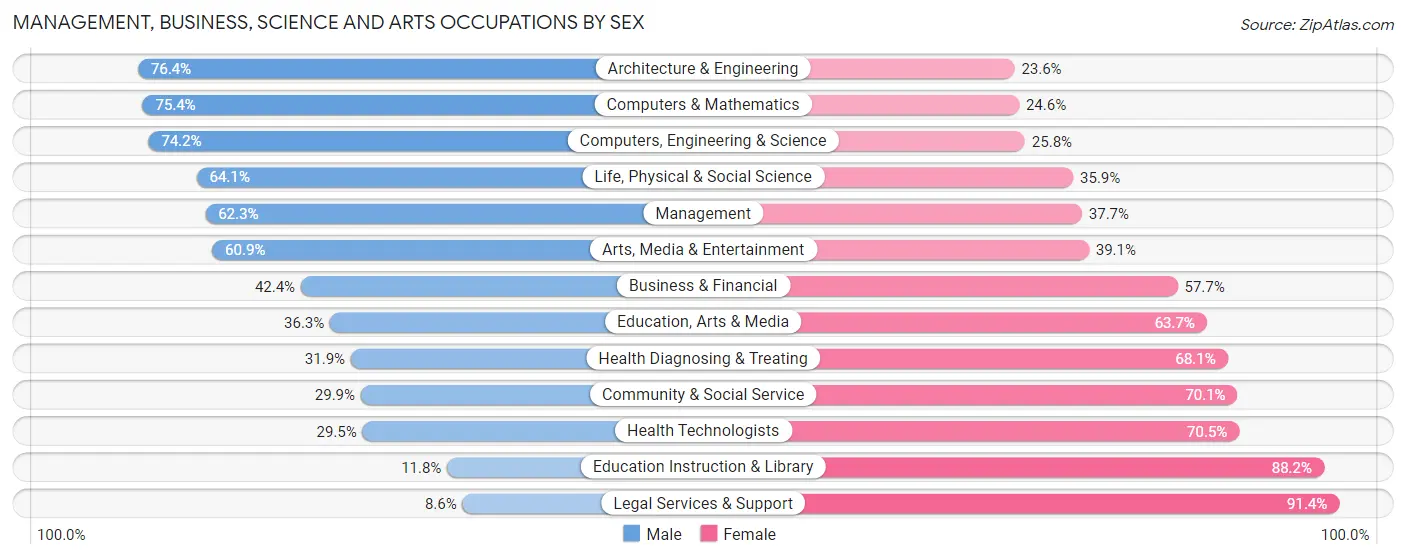
| Occupation | Male | Female |
| Management | 2,344 (62.3%) | 1,418 (37.7%) |
| Business & Financial | 977 (42.3%) | 1,330 (57.7%) |
| Computers, Engineering & Science | 3,943 (74.2%) | 1,372 (25.8%) |
| Computers & Mathematics | 2,958 (75.4%) | 964 (24.6%) |
| Architecture & Engineering | 572 (76.4%) | 177 (23.6%) |
| Life, Physical & Social Science | 413 (64.1%) | 231 (35.9%) |
| Community & Social Service | 787 (29.9%) | 1,849 (70.1%) |
| Education, Arts & Media | 70 (36.3%) | 123 (63.7%) |
| Legal Services & Support | 26 (8.6%) | 275 (91.4%) |
| Education Instruction & Library | 148 (11.8%) | 1,102 (88.2%) |
| Arts, Media & Entertainment | 543 (60.9%) | 349 (39.1%) |
| Health Diagnosing & Treating | 373 (31.9%) | 795 (68.1%) |
| Health Technologists | 295 (29.5%) | 705 (70.5%) |
| Total (Category) | 8,424 (55.5%) | 6,764 (44.5%) |
| Total (Overall) | 12,695 (56.1%) | 9,943 (43.9%) |
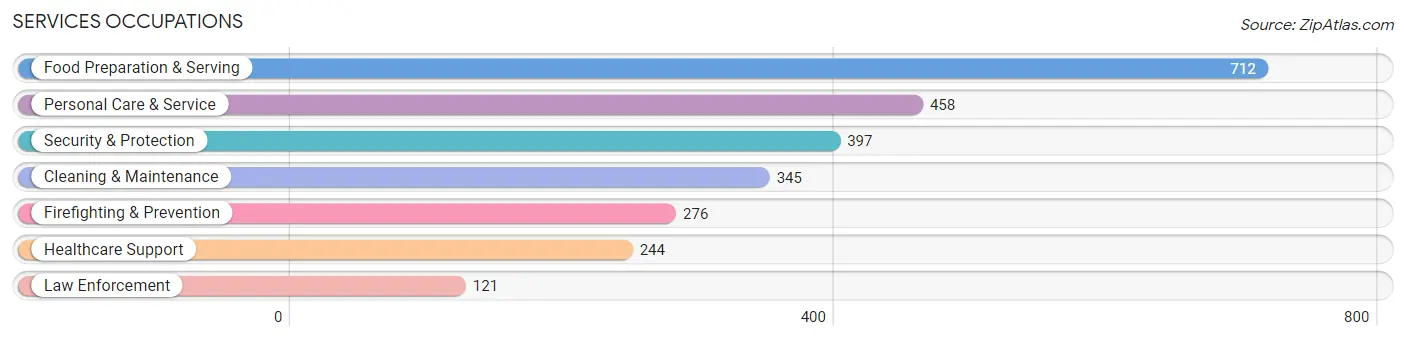
Services Occupations
The most common Services occupations in Issaquah are Food Preparation & Serving (712 | 3.2%), Personal Care & Service (458 | 2.0%), Security & Protection (397 | 1.8%), Cleaning & Maintenance (345 | 1.5%), and Firefighting & Prevention (276 | 1.2%).
Services Occupations by Sex
Within the Services occupations in Issaquah, the most male-oriented occupations are Law Enforcement (100.0%), Security & Protection (80.1%), and Firefighting & Prevention (71.4%), while the most female-oriented occupations are Personal Care & Service (90.4%), Healthcare Support (54.1%), and Cleaning & Maintenance (51.6%).
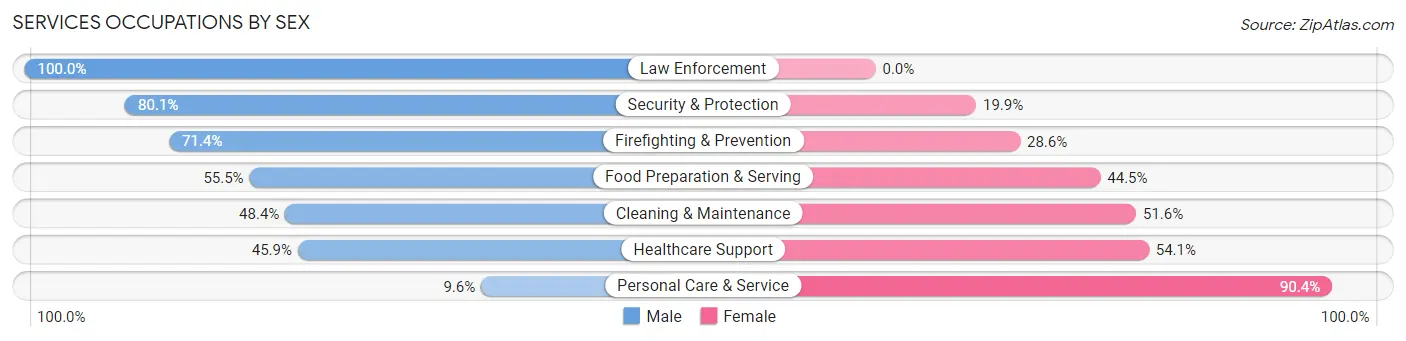
| Occupation | Male | Female |
| Healthcare Support | 112 (45.9%) | 132 (54.1%) |
| Security & Protection | 318 (80.1%) | 79 (19.9%) |
| Firefighting & Prevention | 197 (71.4%) | 79 (28.6%) |
| Law Enforcement | 121 (100.0%) | 0 (0.0%) |
| Food Preparation & Serving | 395 (55.5%) | 317 (44.5%) |
| Cleaning & Maintenance | 167 (48.4%) | 178 (51.6%) |
| Personal Care & Service | 44 (9.6%) | 414 (90.4%) |
| Total (Category) | 1,036 (48.0%) | 1,120 (51.9%) |
| Total (Overall) | 12,695 (56.1%) | 9,943 (43.9%) |
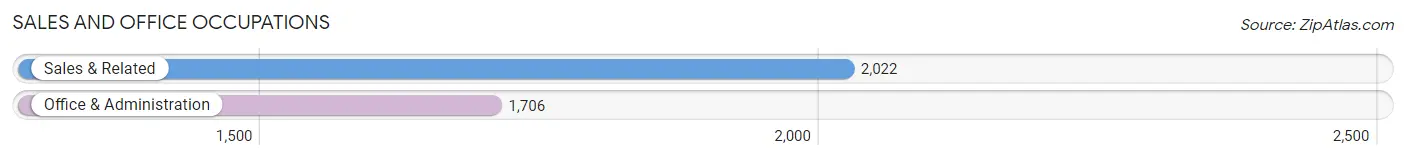
Sales and Office Occupations
The most common Sales and Office occupations in Issaquah are Sales & Related (2,022 | 8.9%), and Office & Administration (1,706 | 7.5%).
Sales and Office Occupations by Sex
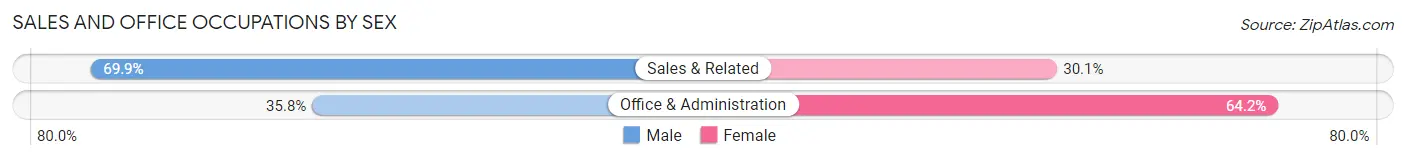
| Occupation | Male | Female |
| Sales & Related | 1,413 (69.9%) | 609 (30.1%) |
| Office & Administration | 610 (35.8%) | 1,096 (64.2%) |
| Total (Category) | 2,023 (54.3%) | 1,705 (45.7%) |
| Total (Overall) | 12,695 (56.1%) | 9,943 (43.9%) |
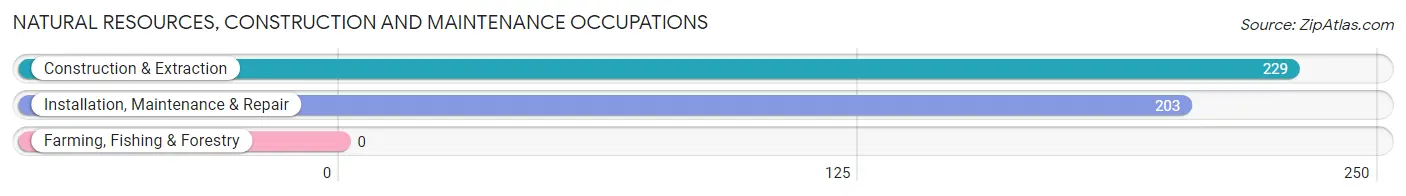
Natural Resources, Construction and Maintenance Occupations
The most common Natural Resources, Construction and Maintenance occupations in Issaquah are Construction & Extraction (229 | 1.0%), and Installation, Maintenance & Repair (203 | 0.9%).
Natural Resources, Construction and Maintenance Occupations by Sex
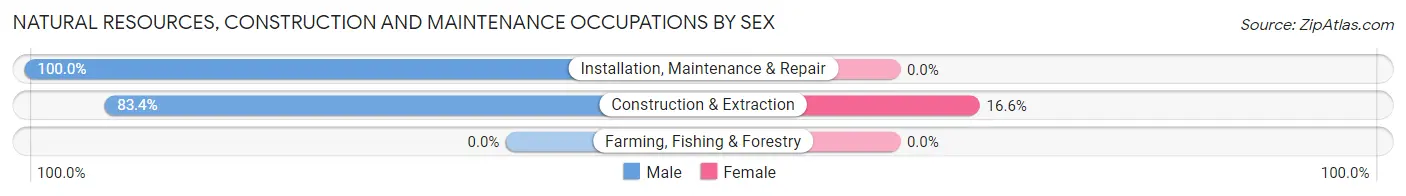
| Occupation | Male | Female |
| Farming, Fishing & Forestry | 0 (0.0%) | 0 (0.0%) |
| Construction & Extraction | 191 (83.4%) | 38 (16.6%) |
| Installation, Maintenance & Repair | 203 (100.0%) | 0 (0.0%) |
| Total (Category) | 394 (91.2%) | 38 (8.8%) |
| Total (Overall) | 12,695 (56.1%) | 9,943 (43.9%) |
Production, Transportation and Moving Occupations
The most common Production, Transportation and Moving occupations in Issaquah are Material Moving (654 | 2.9%), Production (312 | 1.4%), and Transportation (168 | 0.7%).
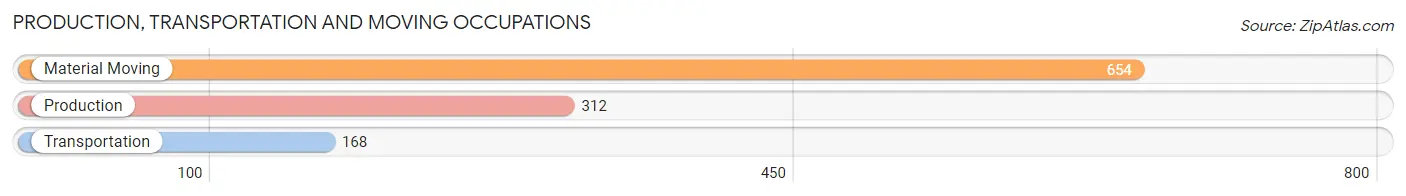
Production, Transportation and Moving Occupations by Sex
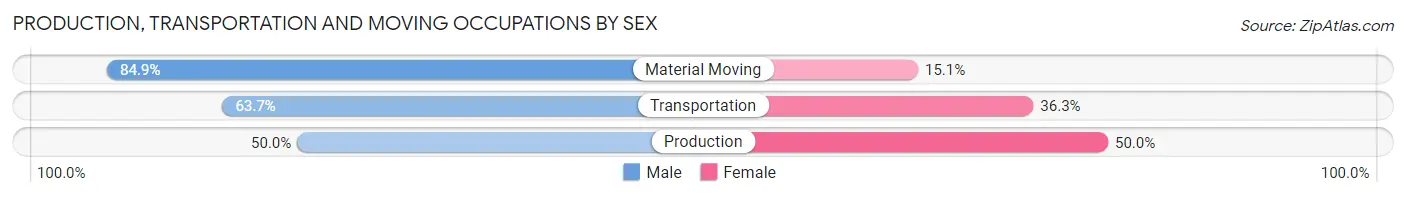
| Occupation | Male | Female |
| Production | 156 (50.0%) | 156 (50.0%) |
| Transportation | 107 (63.7%) | 61 (36.3%) |
| Material Moving | 555 (84.9%) | 99 (15.1%) |
| Total (Category) | 818 (72.1%) | 316 (27.9%) |
| Total (Overall) | 12,695 (56.1%) | 9,943 (43.9%) |
Employment Industries by Sex in Issaquah
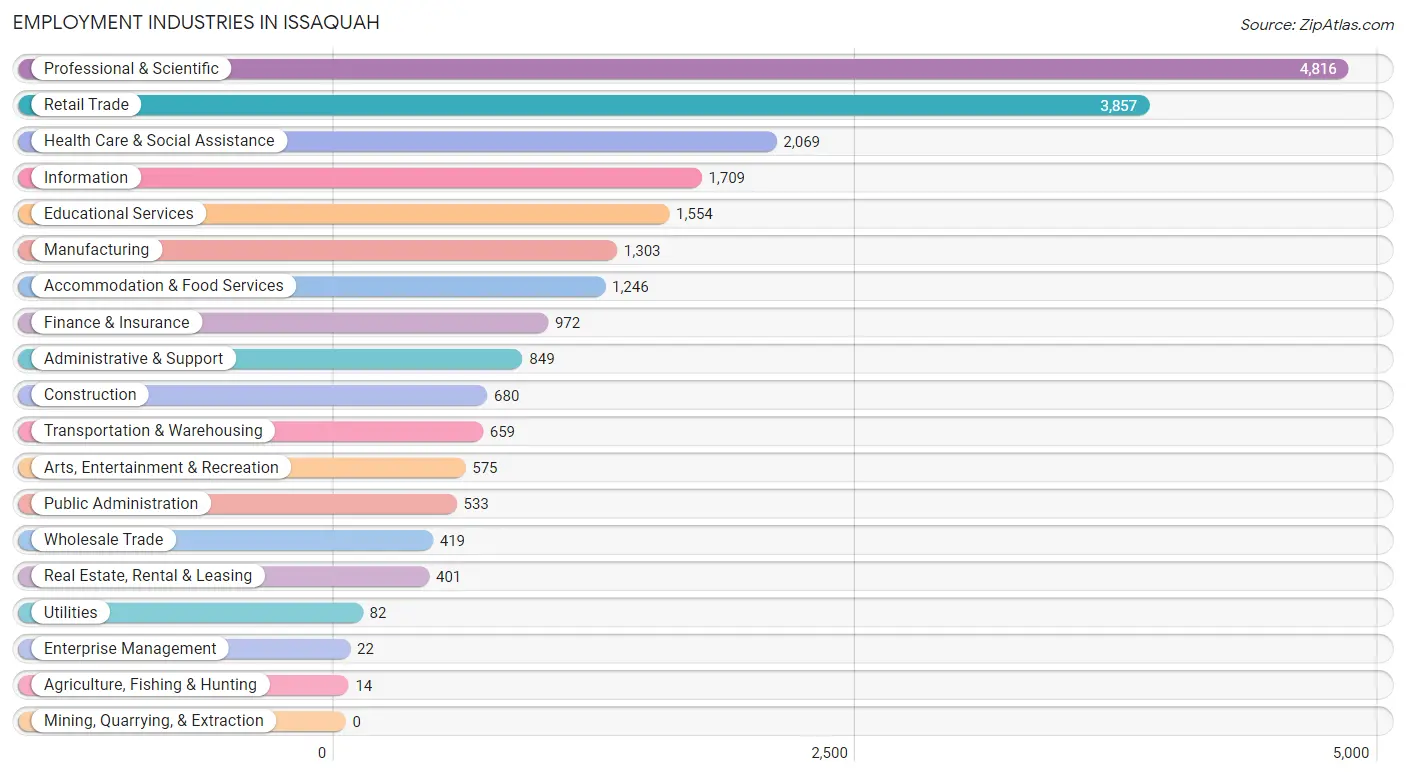
Employment Industries in Issaquah
The major employment industries in Issaquah include Professional & Scientific (4,816 | 21.3%), Retail Trade (3,857 | 17.0%), Health Care & Social Assistance (2,069 | 9.1%), Information (1,709 | 7.5%), and Educational Services (1,554 | 6.9%).
Employment Industries by Sex in Issaquah
The Issaquah industries that see more men than women are Agriculture, Fishing & Hunting (100.0%), Utilities (100.0%), and Construction (71.3%), whereas the industries that tend to have a higher number of women are Educational Services (76.6%), Health Care & Social Assistance (76.4%), and Real Estate, Rental & Leasing (50.1%).
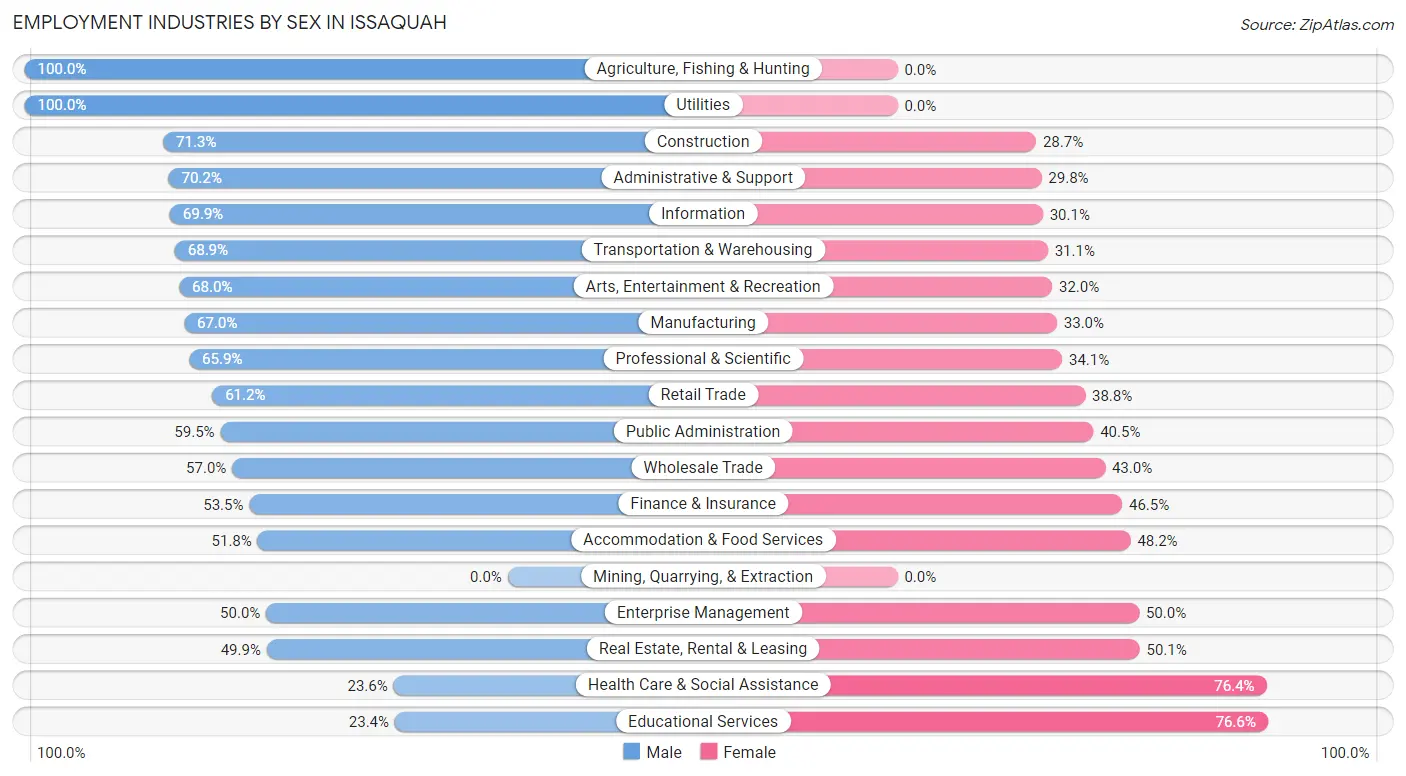
| Industry | Male | Female |
| Agriculture, Fishing & Hunting | 14 (100.0%) | 0 (0.0%) |
| Mining, Quarrying, & Extraction | 0 (0.0%) | 0 (0.0%) |
| Construction | 485 (71.3%) | 195 (28.7%) |
| Manufacturing | 873 (67.0%) | 430 (33.0%) |
| Wholesale Trade | 239 (57.0%) | 180 (43.0%) |
| Retail Trade | 2,359 (61.2%) | 1,498 (38.8%) |
| Transportation & Warehousing | 454 (68.9%) | 205 (31.1%) |
| Utilities | 82 (100.0%) | 0 (0.0%) |
| Information | 1,195 (69.9%) | 514 (30.1%) |
| Finance & Insurance | 520 (53.5%) | 452 (46.5%) |
| Real Estate, Rental & Leasing | 200 (49.9%) | 201 (50.1%) |
| Professional & Scientific | 3,175 (65.9%) | 1,641 (34.1%) |
| Enterprise Management | 11 (50.0%) | 11 (50.0%) |
| Administrative & Support | 596 (70.2%) | 253 (29.8%) |
| Educational Services | 363 (23.4%) | 1,191 (76.6%) |
| Health Care & Social Assistance | 489 (23.6%) | 1,580 (76.4%) |
| Arts, Entertainment & Recreation | 391 (68.0%) | 184 (32.0%) |
| Accommodation & Food Services | 645 (51.8%) | 601 (48.2%) |
| Public Administration | 317 (59.5%) | 216 (40.5%) |
| Total | 12,695 (56.1%) | 9,943 (43.9%) |
Education in Issaquah
School Enrollment in Issaquah
The most common levels of schooling among the 8,851 students in Issaquah are high school (2,287 | 25.8%), elementary school (1,895 | 21.4%), and middle school (1,850 | 20.9%).
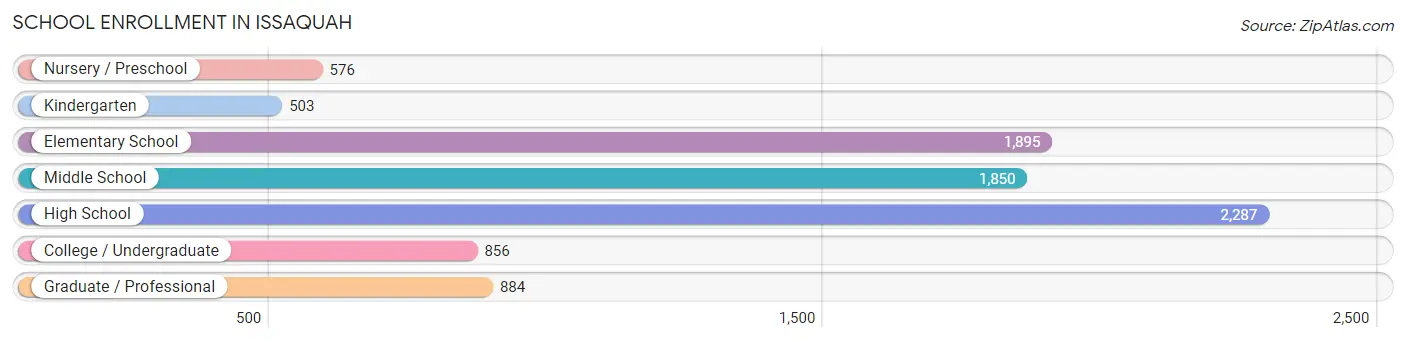
| School Level | # Students | % Students |
| Nursery / Preschool | 576 | 6.5% |
| Kindergarten | 503 | 5.7% |
| Elementary School | 1,895 | 21.4% |
| Middle School | 1,850 | 20.9% |
| High School | 2,287 | 25.8% |
| College / Undergraduate | 856 | 9.7% |
| Graduate / Professional | 884 | 10.0% |
| Total | 8,851 | 100.0% |
School Enrollment by Age by Funding Source in Issaquah
Out of a total of 8,851 students who are enrolled in schools in Issaquah, 1,708 (19.3%) attend a private institution, while the remaining 7,143 (80.7%) are enrolled in public schools. The age group of 3 to 4 year olds has the highest likelihood of being enrolled in private schools, with 303 (79.9% in the age bracket) enrolled. Conversely, the age group of 18 to 19 year olds has the lowest likelihood of being enrolled in a private school, with 557 (97.0% in the age bracket) attending a public institution.
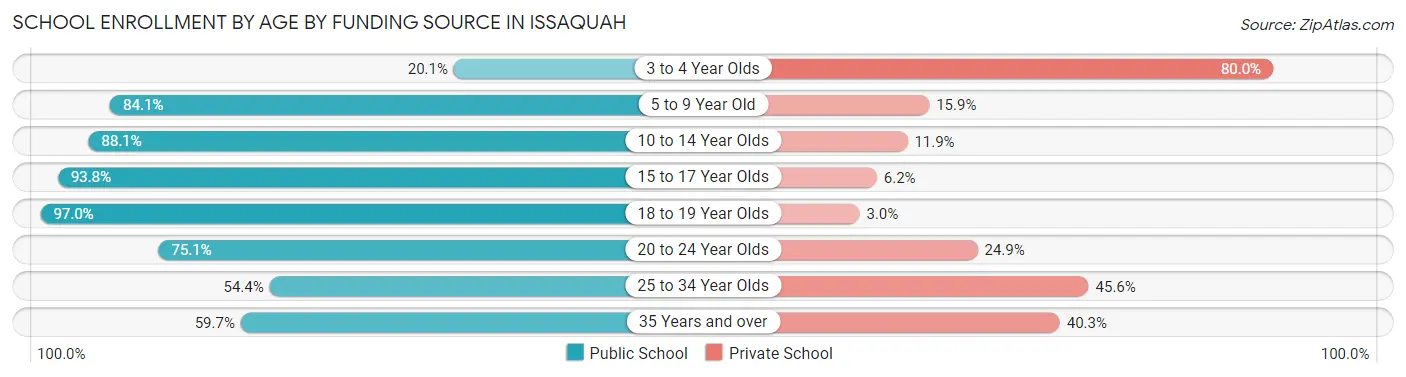
| Age Bracket | Public School | Private School |
| 3 to 4 Year Olds | 76 (20.1%) | 303 (79.9%) |
| 5 to 9 Year Old | 1,877 (84.1%) | 356 (15.9%) |
| 10 to 14 Year Olds | 2,137 (88.1%) | 288 (11.9%) |
| 15 to 17 Year Olds | 1,518 (93.8%) | 100 (6.2%) |
| 18 to 19 Year Olds | 557 (97.0%) | 17 (3.0%) |
| 20 to 24 Year Olds | 262 (75.1%) | 87 (24.9%) |
| 25 to 34 Year Olds | 441 (54.4%) | 370 (45.6%) |
| 35 Years and over | 276 (59.7%) | 186 (40.3%) |
| Total | 7,143 (80.7%) | 1,708 (19.3%) |
Educational Attainment by Field of Study in Issaquah
Engineering (3,986 | 18.5%), business (3,739 | 17.4%), computers & mathematics (2,788 | 13.0%), social sciences (1,873 | 8.7%), and science & technology (1,446 | 6.7%) are the most common fields of study among 21,493 individuals in Issaquah who have obtained a bachelor's degree or higher.
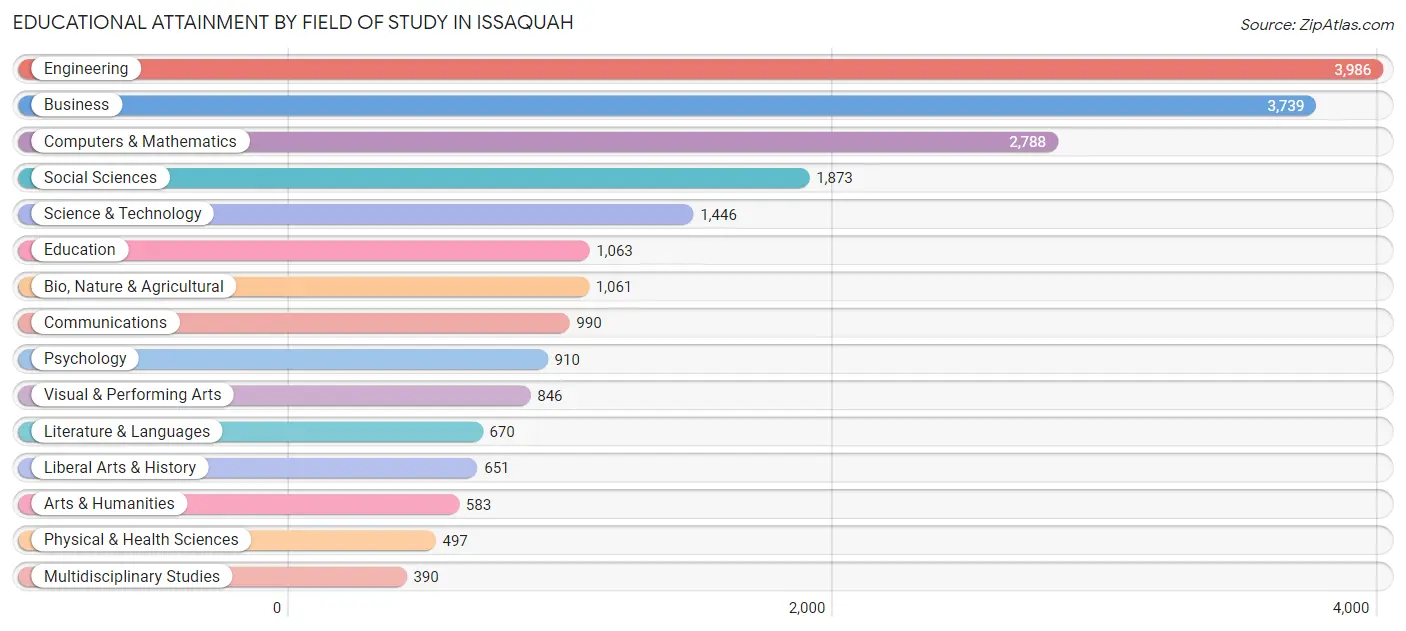
| Field of Study | # Graduates | % Graduates |
| Computers & Mathematics | 2,788 | 13.0% |
| Bio, Nature & Agricultural | 1,061 | 4.9% |
| Physical & Health Sciences | 497 | 2.3% |
| Psychology | 910 | 4.2% |
| Social Sciences | 1,873 | 8.7% |
| Engineering | 3,986 | 18.5% |
| Multidisciplinary Studies | 390 | 1.8% |
| Science & Technology | 1,446 | 6.7% |
| Business | 3,739 | 17.4% |
| Education | 1,063 | 5.0% |
| Literature & Languages | 670 | 3.1% |
| Liberal Arts & History | 651 | 3.0% |
| Visual & Performing Arts | 846 | 3.9% |
| Communications | 990 | 4.6% |
| Arts & Humanities | 583 | 2.7% |
| Total | 21,493 | 100.0% |
Transportation & Commute in Issaquah
Vehicle Availability by Sex in Issaquah
The most prevalent vehicle ownership categories in Issaquah are males with 2 vehicles (6,302, accounting for 50.7%) and females with 2 vehicles (4,533, making up 65.1%).
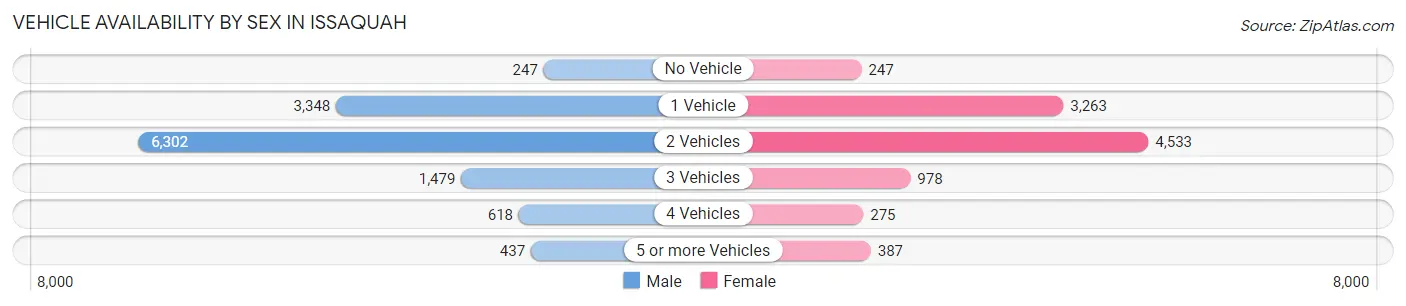
| Vehicles Available | Male | Female |
| No Vehicle | 247 (2.0%) | 247 (2.5%) |
| 1 Vehicle | 3,348 (26.9%) | 3,263 (33.7%) |
| 2 Vehicles | 6,302 (50.7%) | 4,533 (46.8%) |
| 3 Vehicles | 1,479 (11.9%) | 978 (10.1%) |
| 4 Vehicles | 618 (5.0%) | 275 (2.8%) |
| 5 or more Vehicles | 437 (3.5%) | 387 (4.0%) |
| Total | 12,431 (100.0%) | 9,683 (100.0%) |
Commute Time in Issaquah
The most frequently occuring commute durations in Issaquah are 30 to 34 minutes (2,352 commuters, 15.0%), 20 to 24 minutes (2,293 commuters, 14.6%), and 45 to 59 minutes (2,156 commuters, 13.7%).
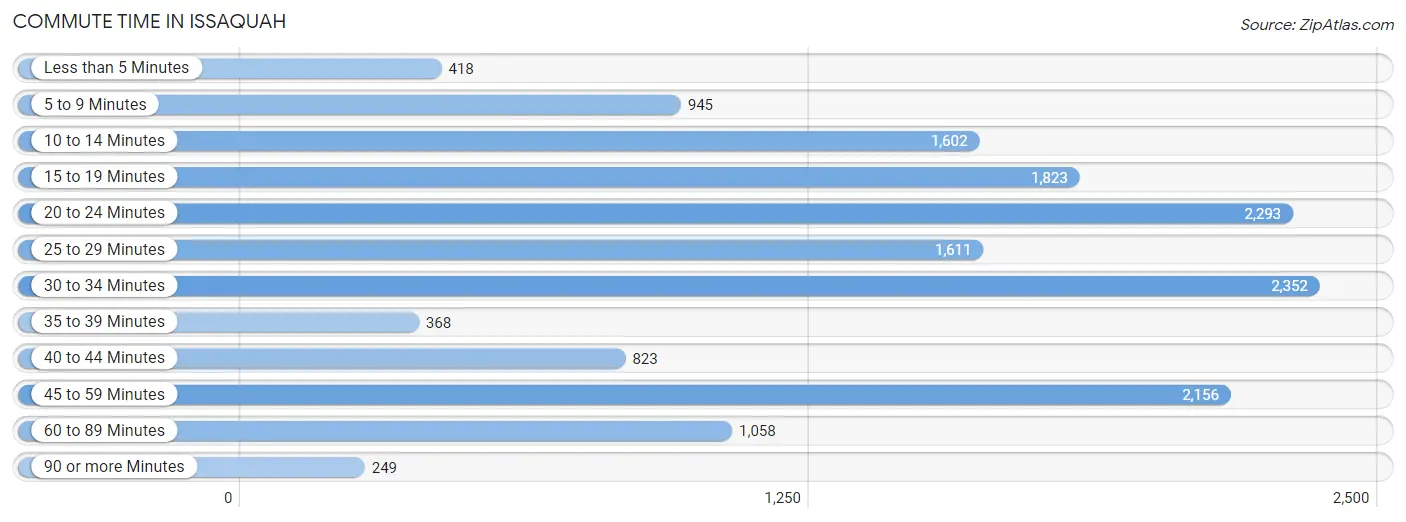
| Commute Time | # Commuters | % Commuters |
| Less than 5 Minutes | 418 | 2.7% |
| 5 to 9 Minutes | 945 | 6.0% |
| 10 to 14 Minutes | 1,602 | 10.2% |
| 15 to 19 Minutes | 1,823 | 11.6% |
| 20 to 24 Minutes | 2,293 | 14.6% |
| 25 to 29 Minutes | 1,611 | 10.3% |
| 30 to 34 Minutes | 2,352 | 15.0% |
| 35 to 39 Minutes | 368 | 2.3% |
| 40 to 44 Minutes | 823 | 5.2% |
| 45 to 59 Minutes | 2,156 | 13.7% |
| 60 to 89 Minutes | 1,058 | 6.7% |
| 90 or more Minutes | 249 | 1.6% |
Commute Time by Sex in Issaquah
The most common commute times in Issaquah are 30 to 34 minutes (1,361 commuters, 15.2%) for males and 20 to 24 minutes (1,170 commuters, 17.3%) for females.
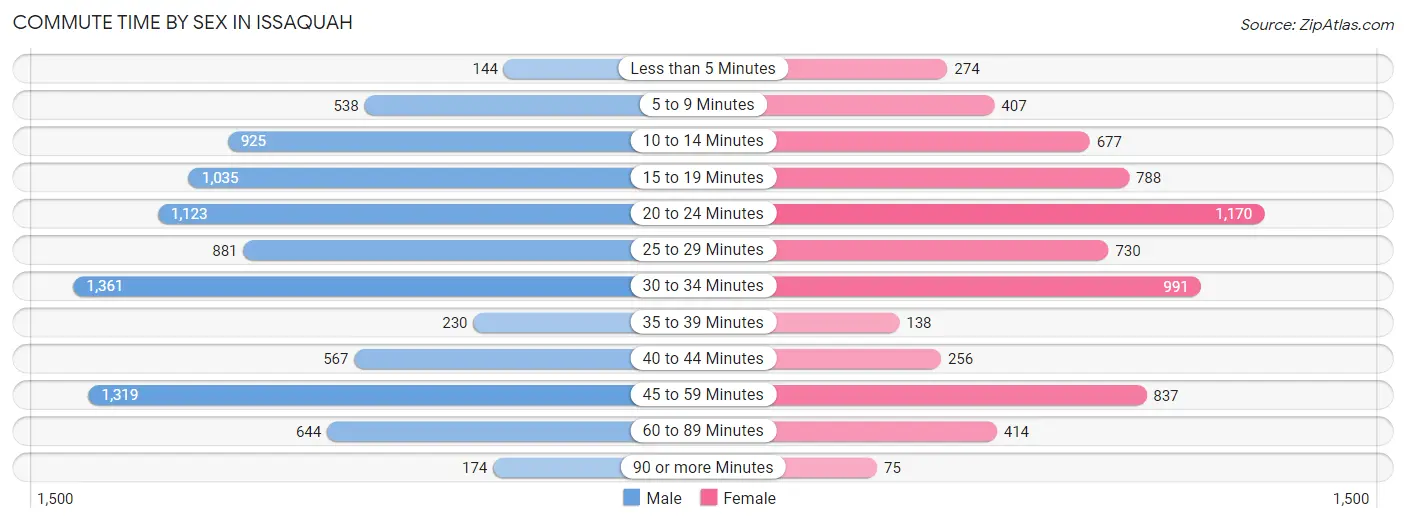
| Commute Time | Male | Female |
| Less than 5 Minutes | 144 (1.6%) | 274 (4.1%) |
| 5 to 9 Minutes | 538 (6.0%) | 407 (6.0%) |
| 10 to 14 Minutes | 925 (10.3%) | 677 (10.0%) |
| 15 to 19 Minutes | 1,035 (11.6%) | 788 (11.7%) |
| 20 to 24 Minutes | 1,123 (12.6%) | 1,170 (17.3%) |
| 25 to 29 Minutes | 881 (9.9%) | 730 (10.8%) |
| 30 to 34 Minutes | 1,361 (15.2%) | 991 (14.7%) |
| 35 to 39 Minutes | 230 (2.6%) | 138 (2.0%) |
| 40 to 44 Minutes | 567 (6.3%) | 256 (3.8%) |
| 45 to 59 Minutes | 1,319 (14.7%) | 837 (12.4%) |
| 60 to 89 Minutes | 644 (7.2%) | 414 (6.1%) |
| 90 or more Minutes | 174 (1.9%) | 75 (1.1%) |
Time of Departure to Work by Sex in Issaquah
The most frequent times of departure to work in Issaquah are 7:30 AM to 7:59 AM (1,367, 15.3%) for males and 7:00 AM to 7:29 AM (1,461, 21.6%) for females.
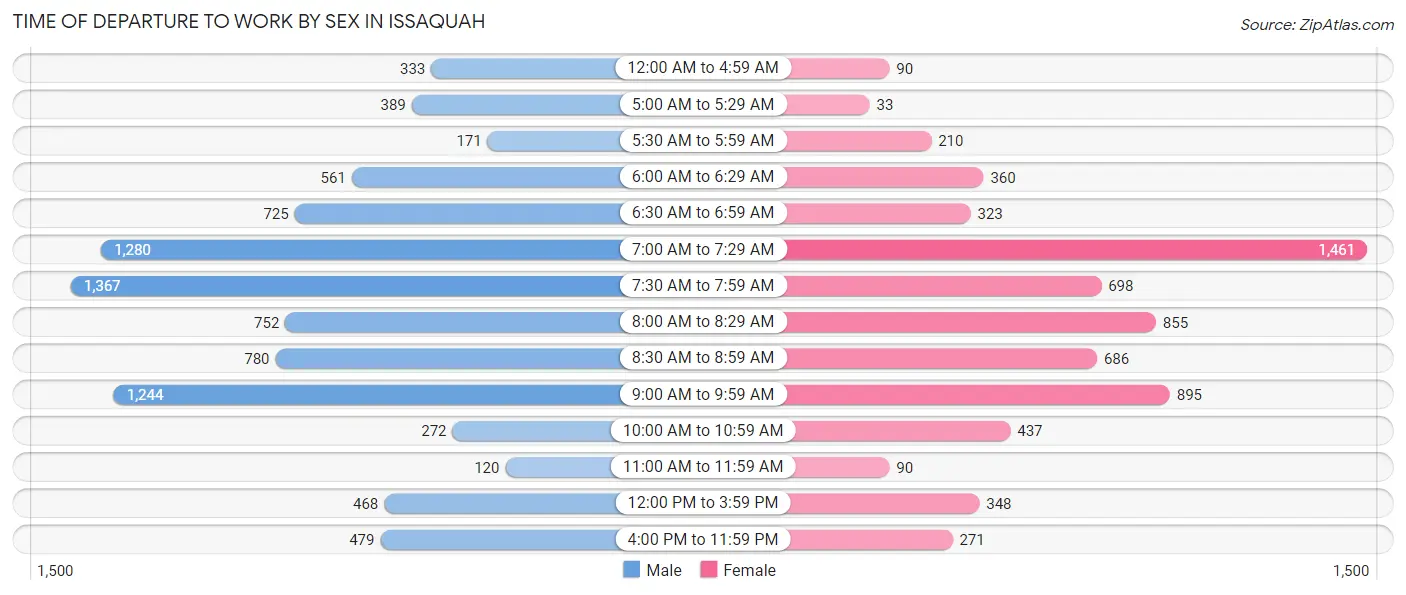
| Time of Departure | Male | Female |
| 12:00 AM to 4:59 AM | 333 (3.7%) | 90 (1.3%) |
| 5:00 AM to 5:29 AM | 389 (4.3%) | 33 (0.5%) |
| 5:30 AM to 5:59 AM | 171 (1.9%) | 210 (3.1%) |
| 6:00 AM to 6:29 AM | 561 (6.3%) | 360 (5.3%) |
| 6:30 AM to 6:59 AM | 725 (8.1%) | 323 (4.8%) |
| 7:00 AM to 7:29 AM | 1,280 (14.3%) | 1,461 (21.6%) |
| 7:30 AM to 7:59 AM | 1,367 (15.3%) | 698 (10.3%) |
| 8:00 AM to 8:29 AM | 752 (8.4%) | 855 (12.7%) |
| 8:30 AM to 8:59 AM | 780 (8.7%) | 686 (10.2%) |
| 9:00 AM to 9:59 AM | 1,244 (13.9%) | 895 (13.3%) |
| 10:00 AM to 10:59 AM | 272 (3.0%) | 437 (6.5%) |
| 11:00 AM to 11:59 AM | 120 (1.3%) | 90 (1.3%) |
| 12:00 PM to 3:59 PM | 468 (5.2%) | 348 (5.1%) |
| 4:00 PM to 11:59 PM | 479 (5.4%) | 271 (4.0%) |
| Total | 8,941 (100.0%) | 6,757 (100.0%) |
Housing Occupancy in Issaquah
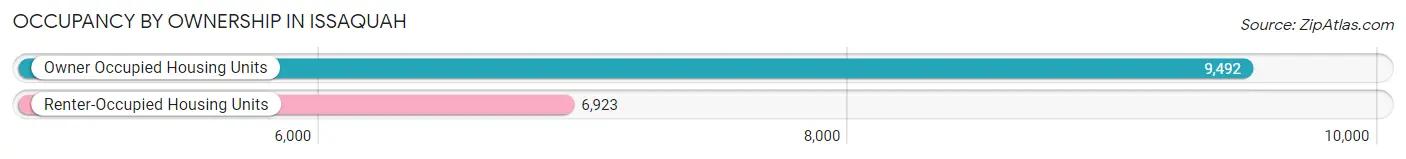
Occupancy by Ownership in Issaquah
Of the total 16,415 dwellings in Issaquah, owner-occupied units account for 9,492 (57.8%), while renter-occupied units make up 6,923 (42.2%).
| Occupancy | # Housing Units | % Housing Units |
| Owner Occupied Housing Units | 9,492 | 57.8% |
| Renter-Occupied Housing Units | 6,923 | 42.2% |
| Total Occupied Housing Units | 16,415 | 100.0% |
Occupancy by Household Size in Issaquah
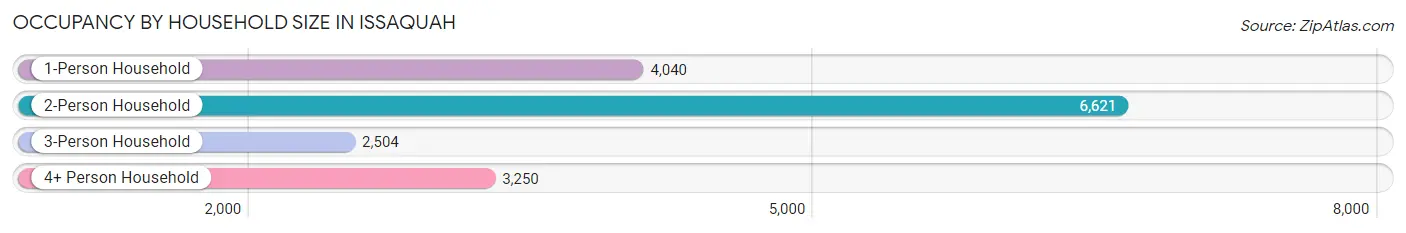
| Household Size | # Housing Units | % Housing Units |
| 1-Person Household | 4,040 | 24.6% |
| 2-Person Household | 6,621 | 40.3% |
| 3-Person Household | 2,504 | 15.2% |
| 4+ Person Household | 3,250 | 19.8% |
| Total Housing Units | 16,415 | 100.0% |
Occupancy by Ownership by Household Size in Issaquah
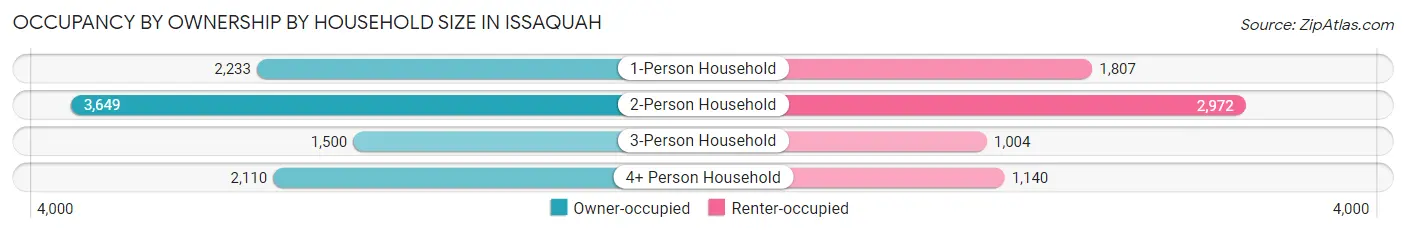
| Household Size | Owner-occupied | Renter-occupied |
| 1-Person Household | 2,233 (55.3%) | 1,807 (44.7%) |
| 2-Person Household | 3,649 (55.1%) | 2,972 (44.9%) |
| 3-Person Household | 1,500 (59.9%) | 1,004 (40.1%) |
| 4+ Person Household | 2,110 (64.9%) | 1,140 (35.1%) |
| Total Housing Units | 9,492 (57.8%) | 6,923 (42.2%) |
Occupancy by Educational Attainment in Issaquah
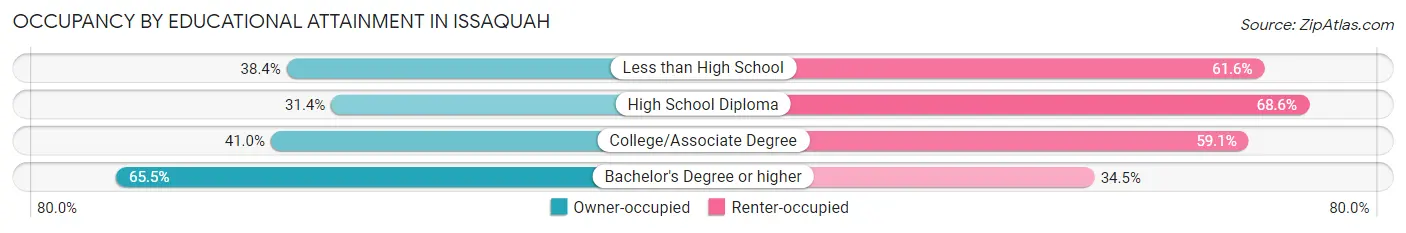
| Household Size | Owner-occupied | Renter-occupied |
| Less than High School | 128 (38.4%) | 205 (61.6%) |
| High School Diploma | 273 (31.4%) | 597 (68.6%) |
| College/Associate Degree | 1,455 (40.9%) | 2,098 (59.1%) |
| Bachelor's Degree or higher | 7,636 (65.5%) | 4,023 (34.5%) |
Occupancy by Age of Householder in Issaquah
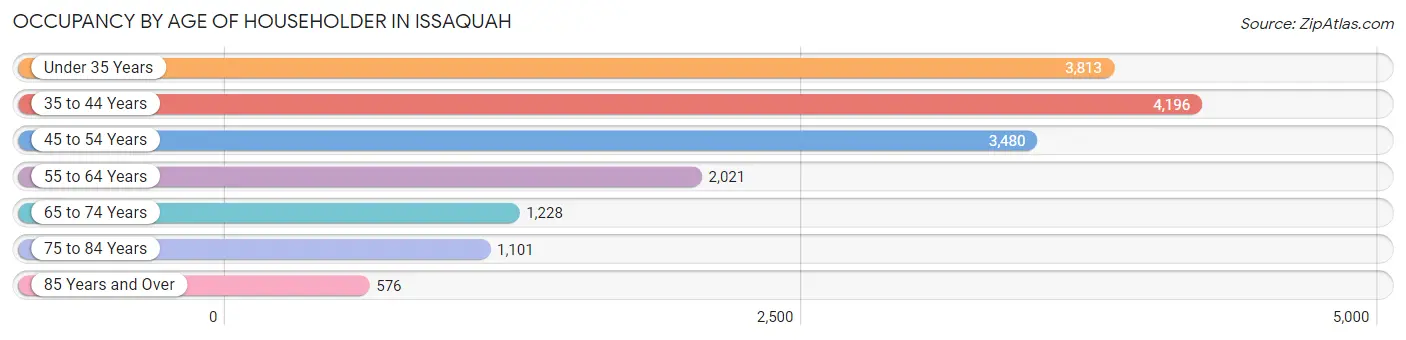
| Age Bracket | # Households | % Households |
| Under 35 Years | 3,813 | 23.2% |
| 35 to 44 Years | 4,196 | 25.6% |
| 45 to 54 Years | 3,480 | 21.2% |
| 55 to 64 Years | 2,021 | 12.3% |
| 65 to 74 Years | 1,228 | 7.5% |
| 75 to 84 Years | 1,101 | 6.7% |
| 85 Years and Over | 576 | 3.5% |
| Total | 16,415 | 100.0% |
Housing Finances in Issaquah
Median Income by Occupancy in Issaquah
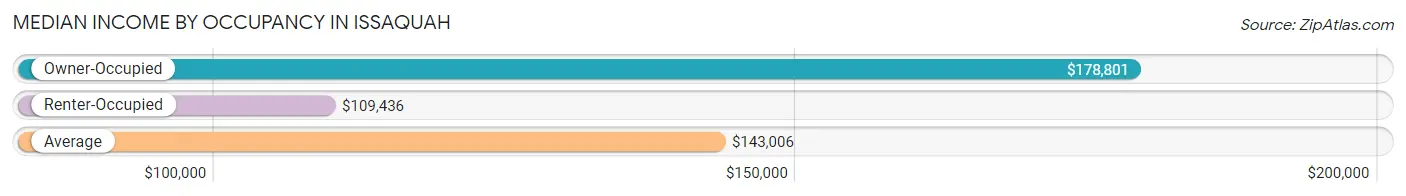
| Occupancy Type | # Households | Median Income |
| Owner-Occupied | 9,492 (57.8%) | $178,801 |
| Renter-Occupied | 6,923 (42.2%) | $109,436 |
| Average | 16,415 (100.0%) | $143,006 |
Occupancy by Householder Income Bracket in Issaquah
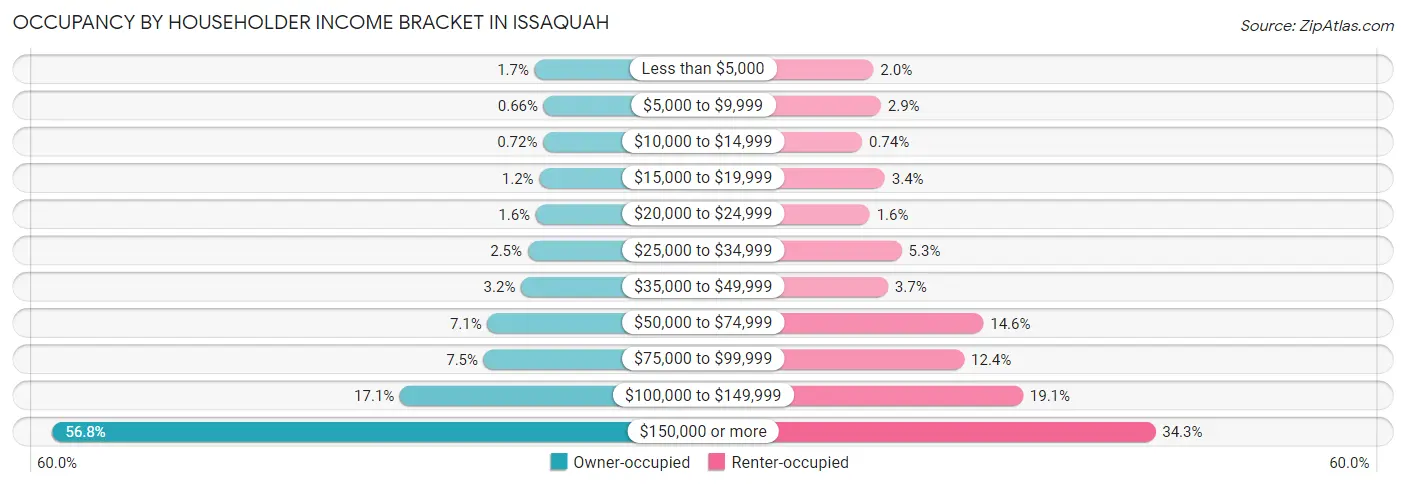
| Income Bracket | Owner-occupied | Renter-occupied |
| Less than $5,000 | 160 (1.7%) | 141 (2.0%) |
| $5,000 to $9,999 | 63 (0.7%) | 200 (2.9%) |
| $10,000 to $14,999 | 68 (0.7%) | 51 (0.7%) |
| $15,000 to $19,999 | 110 (1.2%) | 232 (3.4%) |
| $20,000 to $24,999 | 148 (1.6%) | 112 (1.6%) |
| $25,000 to $34,999 | 235 (2.5%) | 365 (5.3%) |
| $35,000 to $49,999 | 308 (3.2%) | 256 (3.7%) |
| $50,000 to $74,999 | 673 (7.1%) | 1,011 (14.6%) |
| $75,000 to $99,999 | 713 (7.5%) | 859 (12.4%) |
| $100,000 to $149,999 | 1,621 (17.1%) | 1,324 (19.1%) |
| $150,000 or more | 5,393 (56.8%) | 2,372 (34.3%) |
| Total | 9,492 (100.0%) | 6,923 (100.0%) |
Monthly Housing Cost Tiers in Issaquah
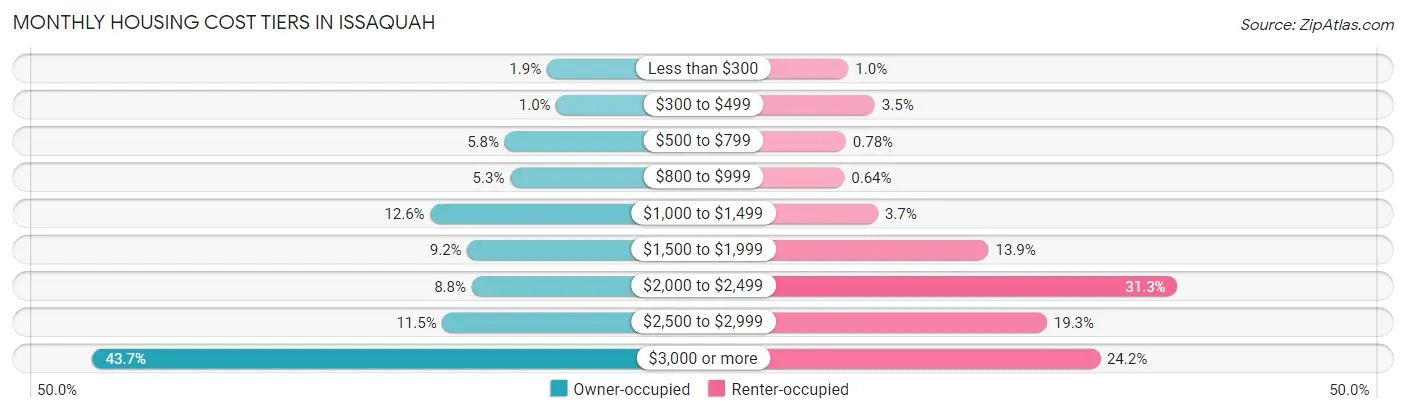
| Monthly Cost | Owner-occupied | Renter-occupied |
| Less than $300 | 181 (1.9%) | 70 (1.0%) |
| $300 to $499 | 99 (1.0%) | 239 (3.5%) |
| $500 to $799 | 550 (5.8%) | 54 (0.8%) |
| $800 to $999 | 502 (5.3%) | 44 (0.6%) |
| $1,000 to $1,499 | 1,200 (12.6%) | 258 (3.7%) |
| $1,500 to $1,999 | 876 (9.2%) | 964 (13.9%) |
| $2,000 to $2,499 | 838 (8.8%) | 2,167 (31.3%) |
| $2,500 to $2,999 | 1,094 (11.5%) | 1,335 (19.3%) |
| $3,000 or more | 4,152 (43.7%) | 1,673 (24.2%) |
| Total | 9,492 (100.0%) | 6,923 (100.0%) |
Physical Housing Characteristics in Issaquah
Housing Structures in Issaquah
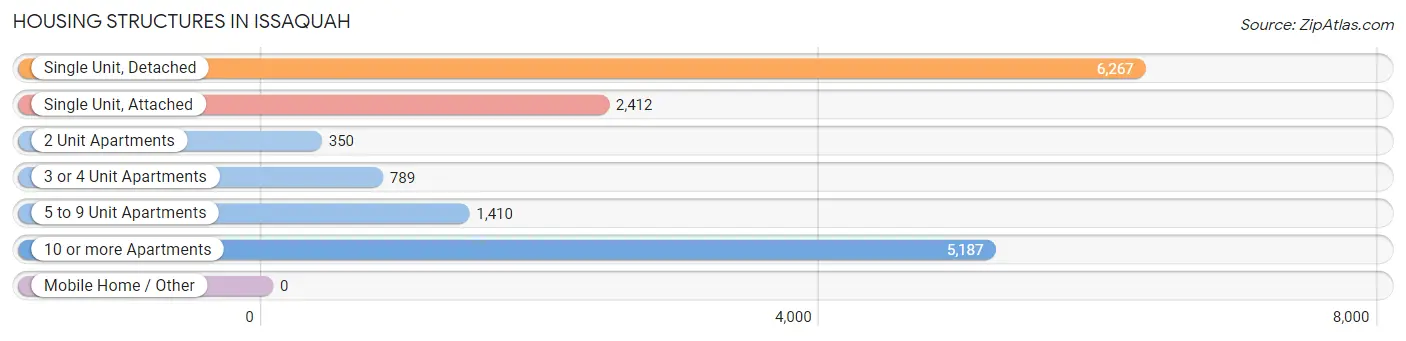
| Structure Type | # Housing Units | % Housing Units |
| Single Unit, Detached | 6,267 | 38.2% |
| Single Unit, Attached | 2,412 | 14.7% |
| 2 Unit Apartments | 350 | 2.1% |
| 3 or 4 Unit Apartments | 789 | 4.8% |
| 5 to 9 Unit Apartments | 1,410 | 8.6% |
| 10 or more Apartments | 5,187 | 31.6% |
| Mobile Home / Other | 0 | 0.0% |
| Total | 16,415 | 100.0% |
Housing Structures by Occupancy in Issaquah
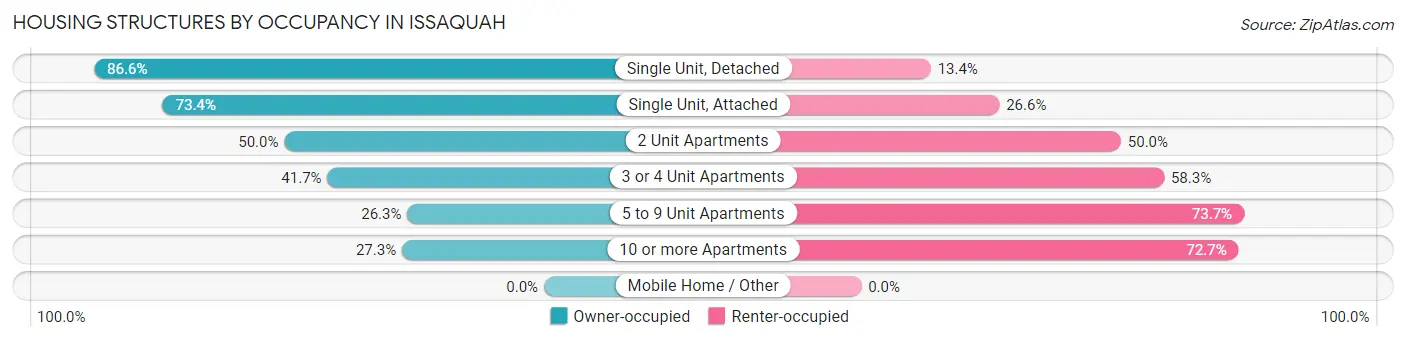
| Structure Type | Owner-occupied | Renter-occupied |
| Single Unit, Detached | 5,428 (86.6%) | 839 (13.4%) |
| Single Unit, Attached | 1,771 (73.4%) | 641 (26.6%) |
| 2 Unit Apartments | 175 (50.0%) | 175 (50.0%) |
| 3 or 4 Unit Apartments | 329 (41.7%) | 460 (58.3%) |
| 5 to 9 Unit Apartments | 371 (26.3%) | 1,039 (73.7%) |
| 10 or more Apartments | 1,418 (27.3%) | 3,769 (72.7%) |
| Mobile Home / Other | 0 (0.0%) | 0 (0.0%) |
| Total | 9,492 (57.8%) | 6,923 (42.2%) |
Housing Structures by Number of Rooms in Issaquah
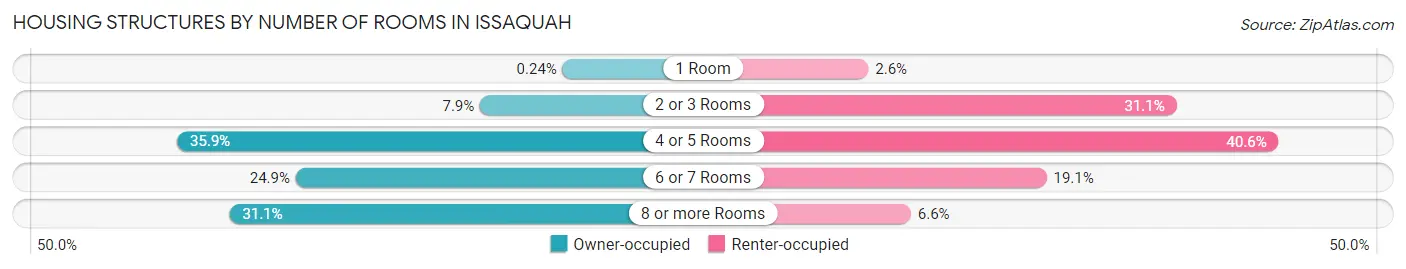
| Number of Rooms | Owner-occupied | Renter-occupied |
| 1 Room | 23 (0.2%) | 182 (2.6%) |
| 2 or 3 Rooms | 747 (7.9%) | 2,155 (31.1%) |
| 4 or 5 Rooms | 3,409 (35.9%) | 2,809 (40.6%) |
| 6 or 7 Rooms | 2,365 (24.9%) | 1,323 (19.1%) |
| 8 or more Rooms | 2,948 (31.1%) | 454 (6.6%) |
| Total | 9,492 (100.0%) | 6,923 (100.0%) |
Housing Structure by Heating Type in Issaquah
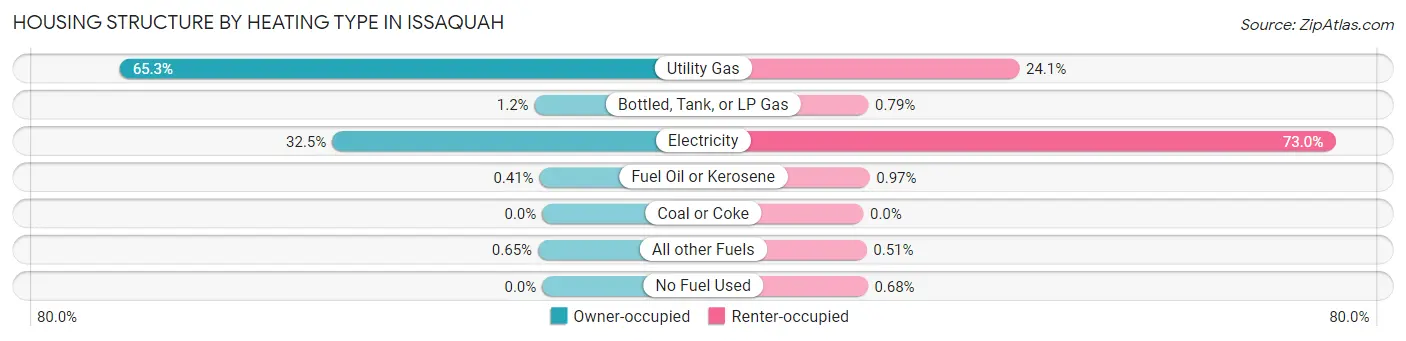
| Heating Type | Owner-occupied | Renter-occupied |
| Utility Gas | 6,197 (65.3%) | 1,669 (24.1%) |
| Bottled, Tank, or LP Gas | 113 (1.2%) | 55 (0.8%) |
| Electricity | 3,081 (32.5%) | 5,050 (73.0%) |
| Fuel Oil or Kerosene | 39 (0.4%) | 67 (1.0%) |
| Coal or Coke | 0 (0.0%) | 0 (0.0%) |
| All other Fuels | 62 (0.6%) | 35 (0.5%) |
| No Fuel Used | 0 (0.0%) | 47 (0.7%) |
| Total | 9,492 (100.0%) | 6,923 (100.0%) |
Household Vehicle Usage in Issaquah
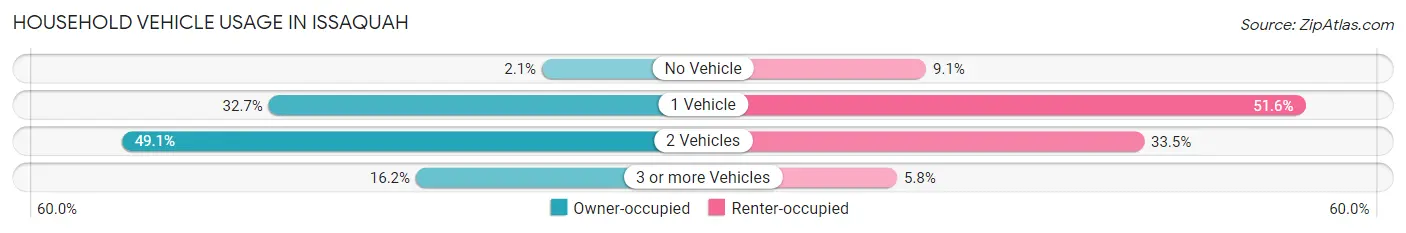
| Vehicles per Household | Owner-occupied | Renter-occupied |
| No Vehicle | 195 (2.1%) | 629 (9.1%) |
| 1 Vehicle | 3,100 (32.7%) | 3,570 (51.6%) |
| 2 Vehicles | 4,662 (49.1%) | 2,320 (33.5%) |
| 3 or more Vehicles | 1,535 (16.2%) | 404 (5.8%) |
| Total | 9,492 (100.0%) | 6,923 (100.0%) |
Real Estate & Mortgages in Issaquah
Real Estate and Mortgage Overview in Issaquah
| Characteristic | Without Mortgage | With Mortgage |
| Housing Units | 2,732 | 6,760 |
| Median Property Value | $736,000 | $928,200 |
| Median Household Income | $118,094 | $4,307 |
| Monthly Housing Costs | $1,050 | $4,088 |
| Real Estate Taxes | $6,235 | $38 |
Property Value by Mortgage Status in Issaquah
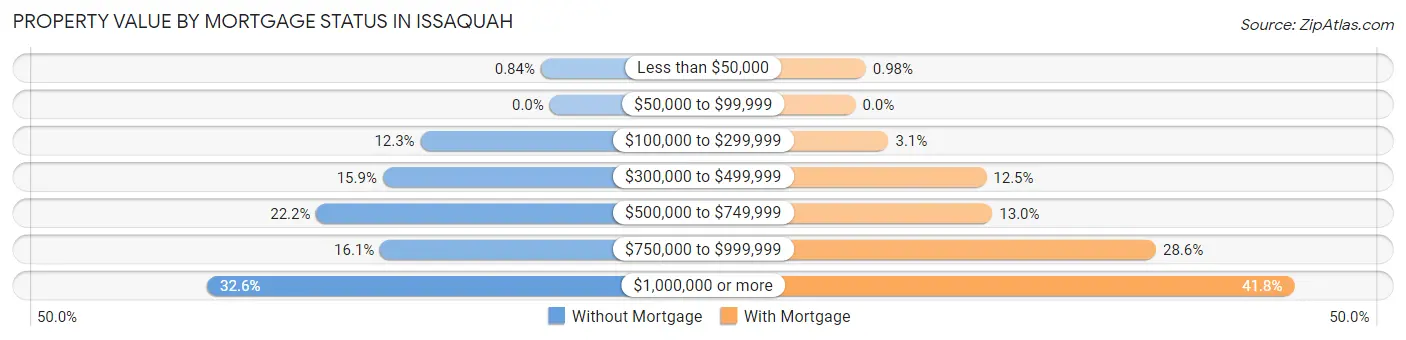
| Property Value | Without Mortgage | With Mortgage |
| Less than $50,000 | 23 (0.8%) | 66 (1.0%) |
| $50,000 to $99,999 | 0 (0.0%) | 0 (0.0%) |
| $100,000 to $299,999 | 336 (12.3%) | 212 (3.1%) |
| $300,000 to $499,999 | 434 (15.9%) | 842 (12.5%) |
| $500,000 to $749,999 | 607 (22.2%) | 881 (13.0%) |
| $750,000 to $999,999 | 441 (16.1%) | 1,935 (28.6%) |
| $1,000,000 or more | 891 (32.6%) | 2,824 (41.8%) |
| Total | 2,732 (100.0%) | 6,760 (100.0%) |
Household Income by Mortgage Status in Issaquah
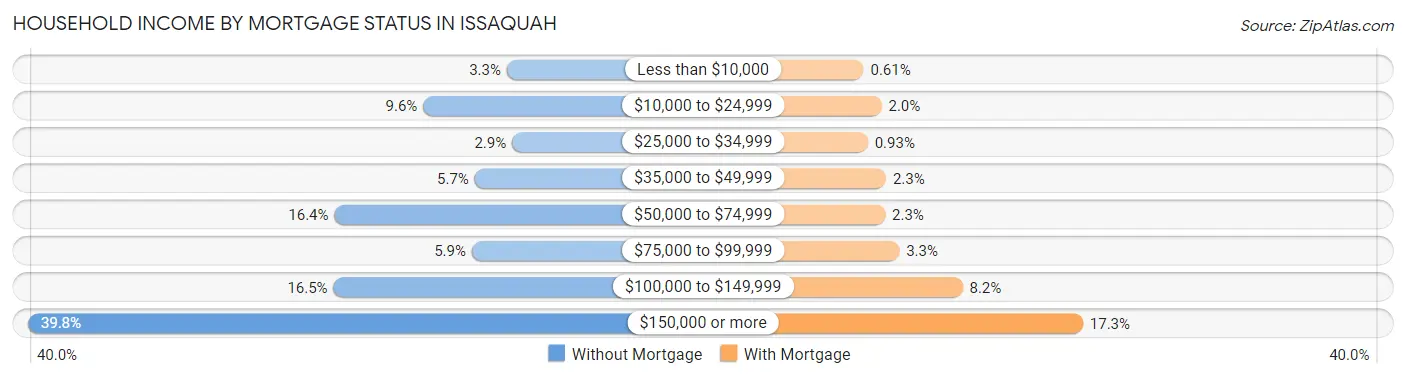
| Household Income | Without Mortgage | With Mortgage |
| Less than $10,000 | 89 (3.3%) | 41 (0.6%) |
| $10,000 to $24,999 | 263 (9.6%) | 134 (2.0%) |
| $25,000 to $34,999 | 78 (2.9%) | 63 (0.9%) |
| $35,000 to $49,999 | 156 (5.7%) | 157 (2.3%) |
| $50,000 to $74,999 | 448 (16.4%) | 152 (2.2%) |
| $75,000 to $99,999 | 162 (5.9%) | 225 (3.3%) |
| $100,000 to $149,999 | 450 (16.5%) | 551 (8.2%) |
| $150,000 or more | 1,086 (39.8%) | 1,171 (17.3%) |
| Total | 2,732 (100.0%) | 6,760 (100.0%) |
Property Value to Household Income Ratio in Issaquah
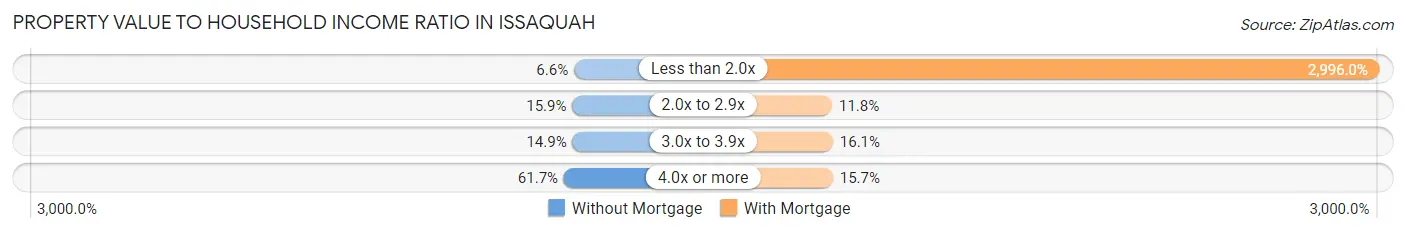
| Value-to-Income Ratio | Without Mortgage | With Mortgage |
| Less than 2.0x | 181 (6.6%) | 202,532 (2,996.0%) |
| 2.0x to 2.9x | 435 (15.9%) | 794 (11.7%) |
| 3.0x to 3.9x | 407 (14.9%) | 1,085 (16.1%) |
| 4.0x or more | 1,686 (61.7%) | 1,059 (15.7%) |
| Total | 2,732 (100.0%) | 6,760 (100.0%) |
Real Estate Taxes by Mortgage Status in Issaquah
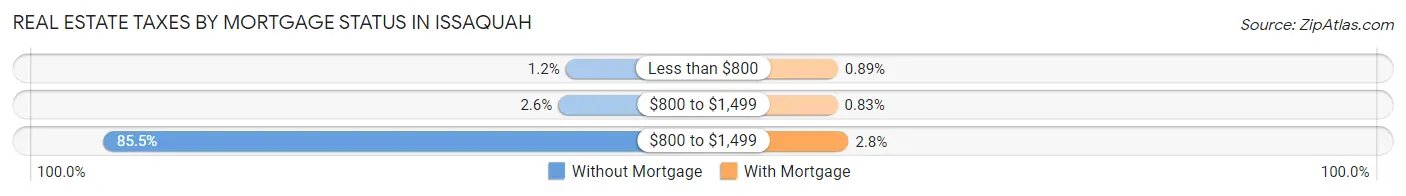
| Property Taxes | Without Mortgage | With Mortgage |
| Less than $800 | 33 (1.2%) | 60 (0.9%) |
| $800 to $1,499 | 70 (2.6%) | 56 (0.8%) |
| $800 to $1,499 | 2,336 (85.5%) | 191 (2.8%) |
| Total | 2,732 (100.0%) | 6,760 (100.0%) |
Health & Disability in Issaquah
Health Insurance Coverage by Age in Issaquah
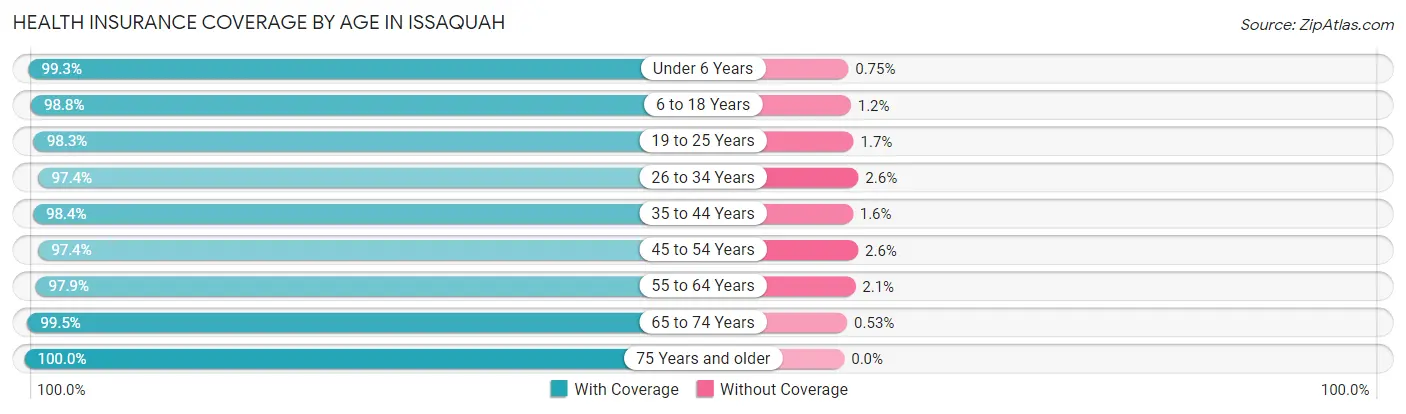
| Age Bracket | With Coverage | Without Coverage |
| Under 6 Years | 2,368 (99.3%) | 18 (0.7%) |
| 6 to 18 Years | 6,365 (98.8%) | 78 (1.2%) |
| 19 to 25 Years | 2,368 (98.3%) | 42 (1.7%) |
| 26 to 34 Years | 6,662 (97.4%) | 180 (2.6%) |
| 35 to 44 Years | 7,109 (98.4%) | 114 (1.6%) |
| 45 to 54 Years | 5,609 (97.4%) | 148 (2.6%) |
| 55 to 64 Years | 3,374 (97.9%) | 71 (2.1%) |
| 65 to 74 Years | 2,072 (99.5%) | 11 (0.5%) |
| 75 Years and older | 2,444 (100.0%) | 0 (0.0%) |
| Total | 38,371 (98.3%) | 662 (1.7%) |
Health Insurance Coverage by Citizenship Status in Issaquah
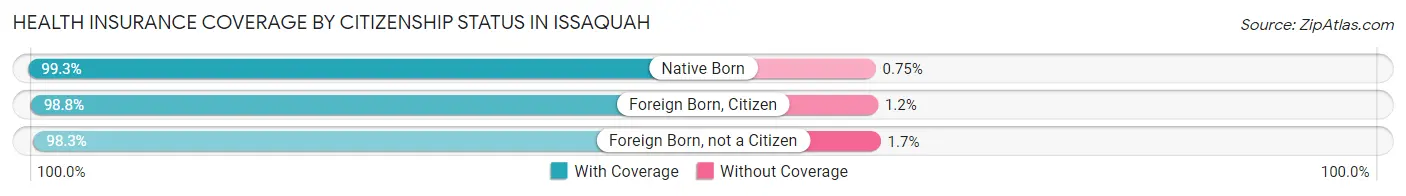
| Citizenship Status | With Coverage | Without Coverage |
| Native Born | 2,368 (99.3%) | 18 (0.7%) |
| Foreign Born, Citizen | 6,365 (98.8%) | 78 (1.2%) |
| Foreign Born, not a Citizen | 2,368 (98.3%) | 42 (1.7%) |
Health Insurance Coverage by Household Income in Issaquah
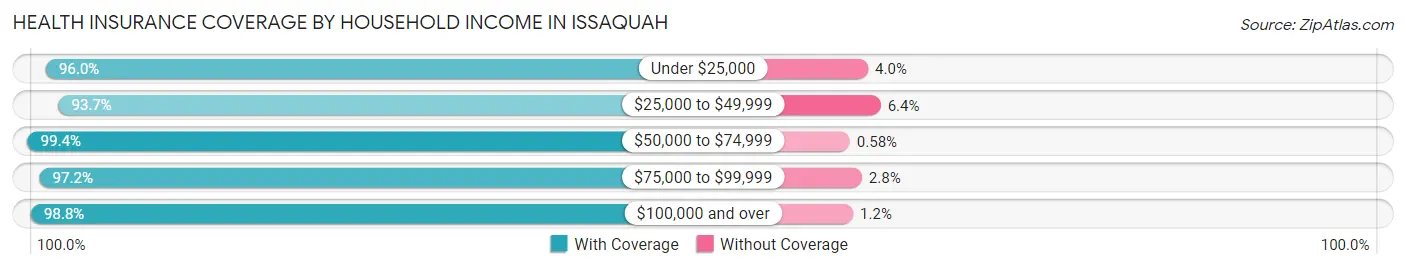
| Household Income | With Coverage | Without Coverage |
| Under $25,000 | 2,282 (96.0%) | 95 (4.0%) |
| $25,000 to $49,999 | 1,798 (93.6%) | 122 (6.4%) |
| $50,000 to $74,999 | 3,273 (99.4%) | 19 (0.6%) |
| $75,000 to $99,999 | 3,164 (97.2%) | 92 (2.8%) |
| $100,000 and over | 27,814 (98.8%) | 334 (1.2%) |
Public vs Private Health Insurance Coverage by Age in Issaquah
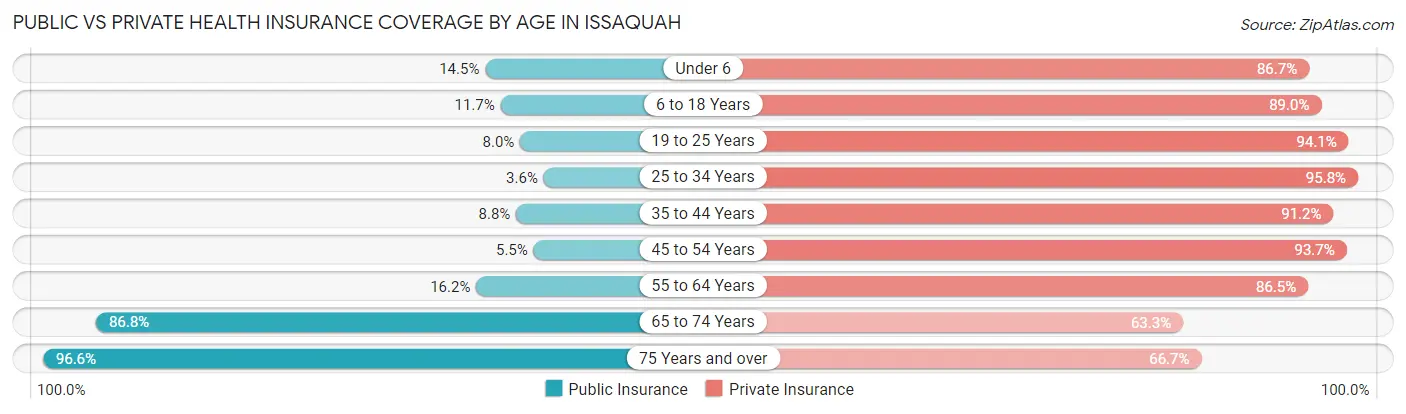
| Age Bracket | Public Insurance | Private Insurance |
| Under 6 | 346 (14.5%) | 2,069 (86.7%) |
| 6 to 18 Years | 751 (11.7%) | 5,733 (89.0%) |
| 19 to 25 Years | 193 (8.0%) | 2,267 (94.1%) |
| 25 to 34 Years | 249 (3.6%) | 6,554 (95.8%) |
| 35 to 44 Years | 632 (8.7%) | 6,589 (91.2%) |
| 45 to 54 Years | 318 (5.5%) | 5,393 (93.7%) |
| 55 to 64 Years | 557 (16.2%) | 2,981 (86.5%) |
| 65 to 74 Years | 1,807 (86.8%) | 1,319 (63.3%) |
| 75 Years and over | 2,361 (96.6%) | 1,631 (66.7%) |
| Total | 7,214 (18.5%) | 34,536 (88.5%) |
Disability Status by Sex by Age in Issaquah
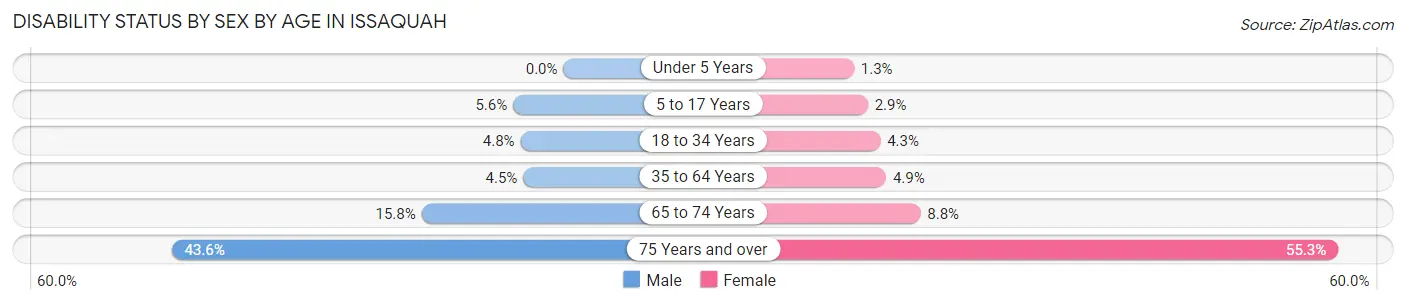
| Age Bracket | Male | Female |
| Under 5 Years | 0 (0.0%) | 13 (1.3%) |
| 5 to 17 Years | 182 (5.6%) | 92 (2.9%) |
| 18 to 34 Years | 227 (4.8%) | 214 (4.3%) |
| 35 to 64 Years | 383 (4.5%) | 387 (4.9%) |
| 65 to 74 Years | 154 (15.8%) | 97 (8.7%) |
| 75 Years and over | 415 (43.6%) | 825 (55.3%) |
Disability Class by Sex by Age in Issaquah
Disability Class: Hearing Difficulty
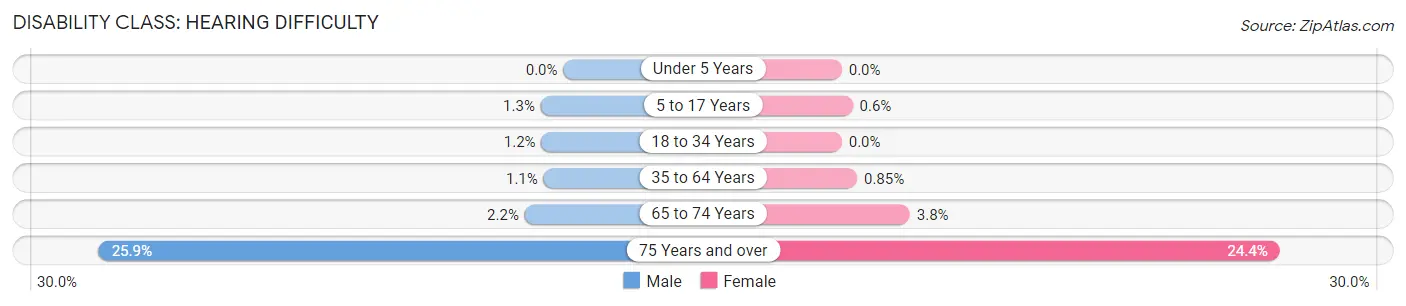
| Age Bracket | Male | Female |
| Under 5 Years | 0 (0.0%) | 0 (0.0%) |
| 5 to 17 Years | 41 (1.3%) | 19 (0.6%) |
| 18 to 34 Years | 58 (1.2%) | 0 (0.0%) |
| 35 to 64 Years | 94 (1.1%) | 67 (0.9%) |
| 65 to 74 Years | 21 (2.1%) | 42 (3.8%) |
| 75 Years and over | 246 (25.9%) | 364 (24.4%) |
Disability Class: Vision Difficulty
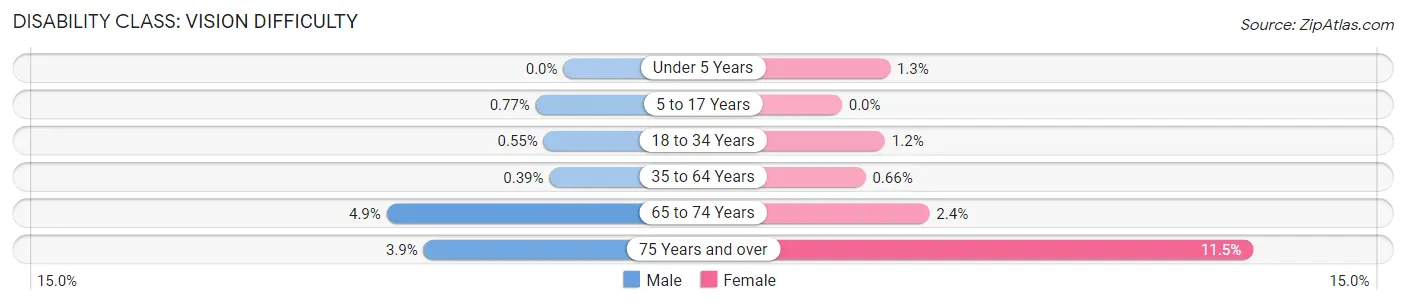
| Age Bracket | Male | Female |
| Under 5 Years | 0 (0.0%) | 13 (1.3%) |
| 5 to 17 Years | 25 (0.8%) | 0 (0.0%) |
| 18 to 34 Years | 26 (0.5%) | 60 (1.2%) |
| 35 to 64 Years | 33 (0.4%) | 52 (0.7%) |
| 65 to 74 Years | 48 (4.9%) | 27 (2.4%) |
| 75 Years and over | 37 (3.9%) | 171 (11.5%) |
Disability Class: Cognitive Difficulty
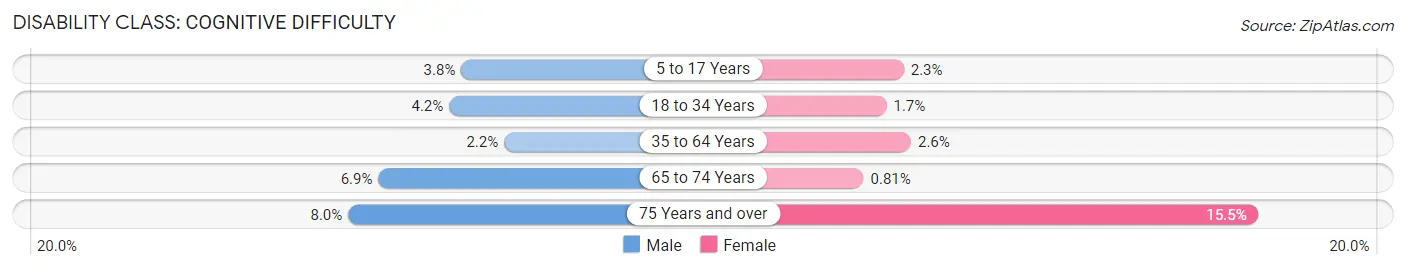
| Age Bracket | Male | Female |
| 5 to 17 Years | 123 (3.8%) | 73 (2.3%) |
| 18 to 34 Years | 201 (4.2%) | 83 (1.7%) |
| 35 to 64 Years | 188 (2.2%) | 202 (2.6%) |
| 65 to 74 Years | 67 (6.9%) | 9 (0.8%) |
| 75 Years and over | 76 (8.0%) | 231 (15.5%) |
Disability Class: Ambulatory Difficulty
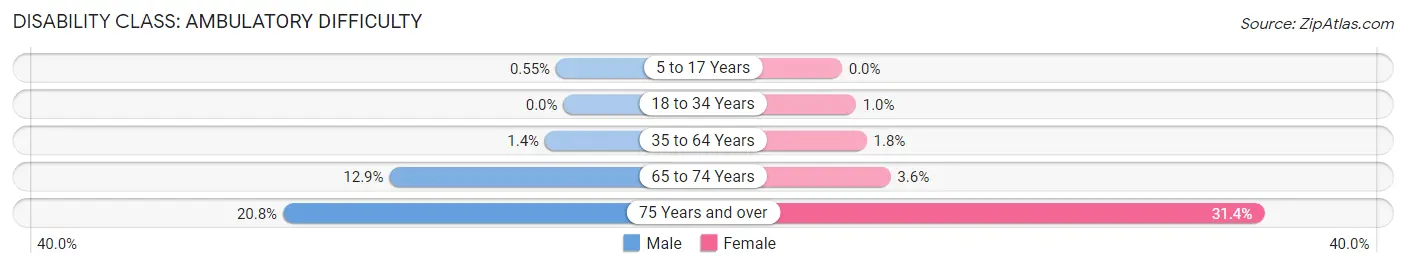
| Age Bracket | Male | Female |
| 5 to 17 Years | 18 (0.5%) | 0 (0.0%) |
| 18 to 34 Years | 0 (0.0%) | 52 (1.0%) |
| 35 to 64 Years | 117 (1.4%) | 145 (1.8%) |
| 65 to 74 Years | 126 (12.9%) | 40 (3.6%) |
| 75 Years and over | 198 (20.8%) | 468 (31.4%) |
Disability Class: Self-Care Difficulty
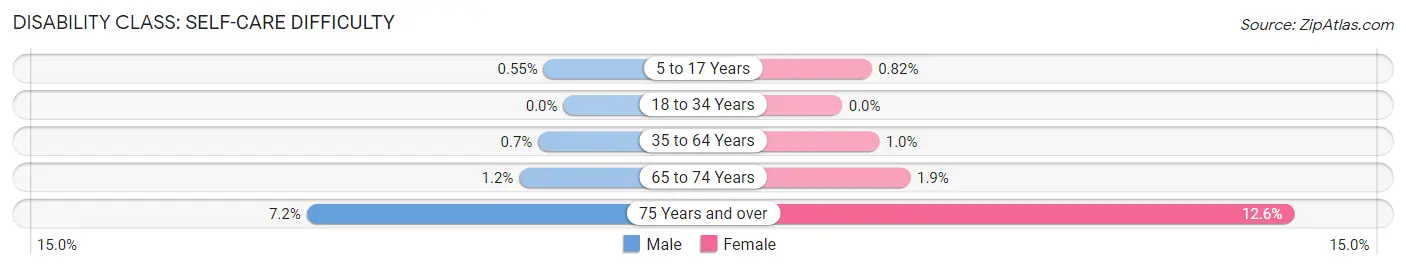
| Age Bracket | Male | Female |
| 5 to 17 Years | 18 (0.5%) | 26 (0.8%) |
| 18 to 34 Years | 0 (0.0%) | 0 (0.0%) |
| 35 to 64 Years | 60 (0.7%) | 81 (1.0%) |
| 65 to 74 Years | 12 (1.2%) | 21 (1.9%) |
| 75 Years and over | 68 (7.1%) | 188 (12.6%) |
Technology Access in Issaquah
Computing Device Access in Issaquah
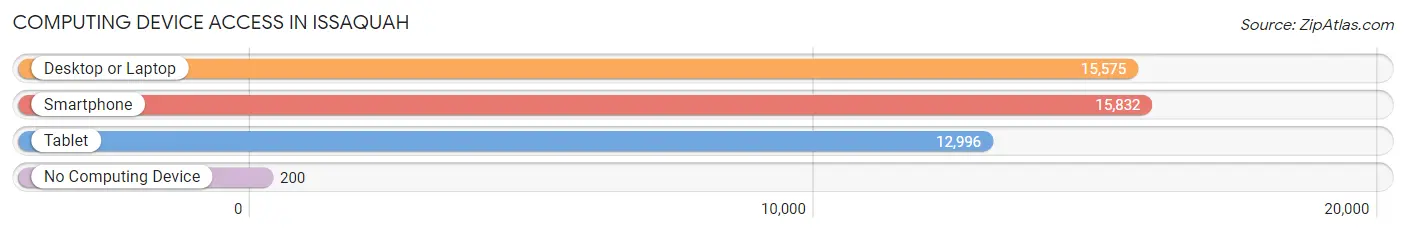
| Device Type | # Households | % Households |
| Desktop or Laptop | 15,575 | 94.9% |
| Smartphone | 15,832 | 96.5% |
| Tablet | 12,996 | 79.2% |
| No Computing Device | 200 | 1.2% |
| Total | 16,415 | 100.0% |
Internet Access in Issaquah
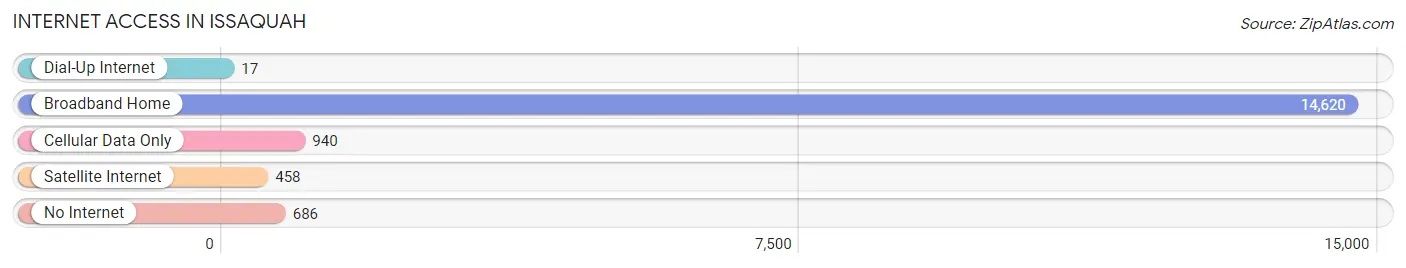
| Internet Type | # Households | % Households |
| Dial-Up Internet | 17 | 0.1% |
| Broadband Home | 14,620 | 89.1% |
| Cellular Data Only | 940 | 5.7% |
| Satellite Internet | 458 | 2.8% |
| No Internet | 686 | 4.2% |
| Total | 16,415 | 100.0% |
Issaquah Summary
History
The area now known as Issaquah, Washington was first inhabited by the Squak, Snoqualmie, and other Native American tribes. The first European settlers arrived in the area in the mid-1800s, and the first permanent settlement was established in 1892. The town was originally called Gilman, after the first postmaster, but was later renamed Issaquah, a Native American word meaning “snake” or “little stream.”
In the early 1900s, Issaquah was a small logging and farming community. The town was connected to Seattle by a railway in 1910, and the population began to grow. The town was incorporated in 1892, and the first mayor was elected in 1895.
In the 1920s, Issaquah began to develop as a tourist destination. The town was known for its natural beauty and outdoor recreation opportunities, and it became a popular weekend getaway for Seattle residents.
In the 1950s, the population of Issaquah began to grow rapidly. The town was connected to Seattle by the Interstate 90 freeway in the 1960s, and the population continued to grow. By the 1990s, Issaquah had become a bedroom community for Seattle, and the population had grown to over 20,000.
Geography
Issaquah is located in King County, Washington, about 20 miles east of Seattle. The city is situated in the foothills of the Cascade Mountains, and is surrounded by forests and lakes. The city covers an area of 10.7 square miles, and has an elevation of 486 feet.
The climate in Issaquah is mild and temperate. The average high temperature in July is 78 degrees Fahrenheit, and the average low temperature in January is 33 degrees Fahrenheit. The city receives an average of 37 inches of precipitation per year.
Economy
The economy of Issaquah is largely based on technology and retail. The city is home to several large technology companies, including Microsoft, T-Mobile, and Nintendo. The city is also home to several large retail stores, including Costco, Target, and Walmart.
The city is also home to several large medical centers, including Swedish Medical Center and Overlake Medical Center. The city is also home to several large educational institutions, including Bellevue College and the University of Washington.
Demographics
As of the 2010 census, the population of Issaquah was 30,434. The population is predominantly white (83.3%), with smaller percentages of Asian (7.2%), African American (2.2%), and Hispanic (2.1%) residents. The median household income is $90,845, and the median home value is $521,000.
The city is home to several large employers, including Microsoft, T-Mobile, and Nintendo. The city is also home to several large educational institutions, including Bellevue College and the University of Washington.
Conclusion
Issaquah, Washington is a small city located in King County, about 20 miles east of Seattle. The city is known for its natural beauty and outdoor recreation opportunities, and is home to several large technology and retail companies. The population of Issaquah is predominantly white, with smaller percentages of Asian, African American, and Hispanic residents. The median household income is $90,845, and the median home value is $521,000.
Common Questions
What is Per Capita Income in Issaquah?
Per Capita income in Issaquah is $83,644.
What is the Median Family Income in Issaquah?
Median Family Income in Issaquah is $172,862.
What is the Median Household income in Issaquah?
Median Household Income in Issaquah is $143,006.
What is Income or Wage Gap in Issaquah?
Income or Wage Gap in Issaquah is 32.7%.
Women in Issaquah earn 67.3 cents for every dollar earned by a man.
What is Inequality or Gini Index in Issaquah?
Inequality or Gini Index in Issaquah is 0.47.
What is the Total Population of Issaquah?
Total Population of Issaquah is 39,400.
What is the Total Male Population of Issaquah?
Total Male Population of Issaquah is 19,589.
What is the Total Female Population of Issaquah?
Total Female Population of Issaquah is 19,811.
What is the Ratio of Males per 100 Females in Issaquah?
There are 98.88 Males per 100 Females in Issaquah.
What is the Ratio of Females per 100 Males in Issaquah?
There are 101.13 Females per 100 Males in Issaquah.
What is the Median Population Age in Issaquah?
Median Population Age in Issaquah is 36.8 Years.
What is the Average Family Size in Issaquah
Average Family Size in Issaquah is 2.9 People.
What is the Average Household Size in Issaquah
Average Household Size in Issaquah is 2.4 People.
How Large is the Labor Force in Issaquah?
There are 23,419 People in the Labor Forcein in Issaquah.
What is the Percentage of People in the Labor Force in Issaquah?
73.3% of People are in the Labor Force in Issaquah.
What is the Unemployment Rate in Issaquah?
Unemployment Rate in Issaquah is 3.2%.