Zip Codes with the Highest Percentage of Population Employed in Computer, Engineering & Science in Bellingham, WA
RELATED REPORTS & OPTIONS
Computer, Engineering & Science
Bellingham
Compare Zip Codes
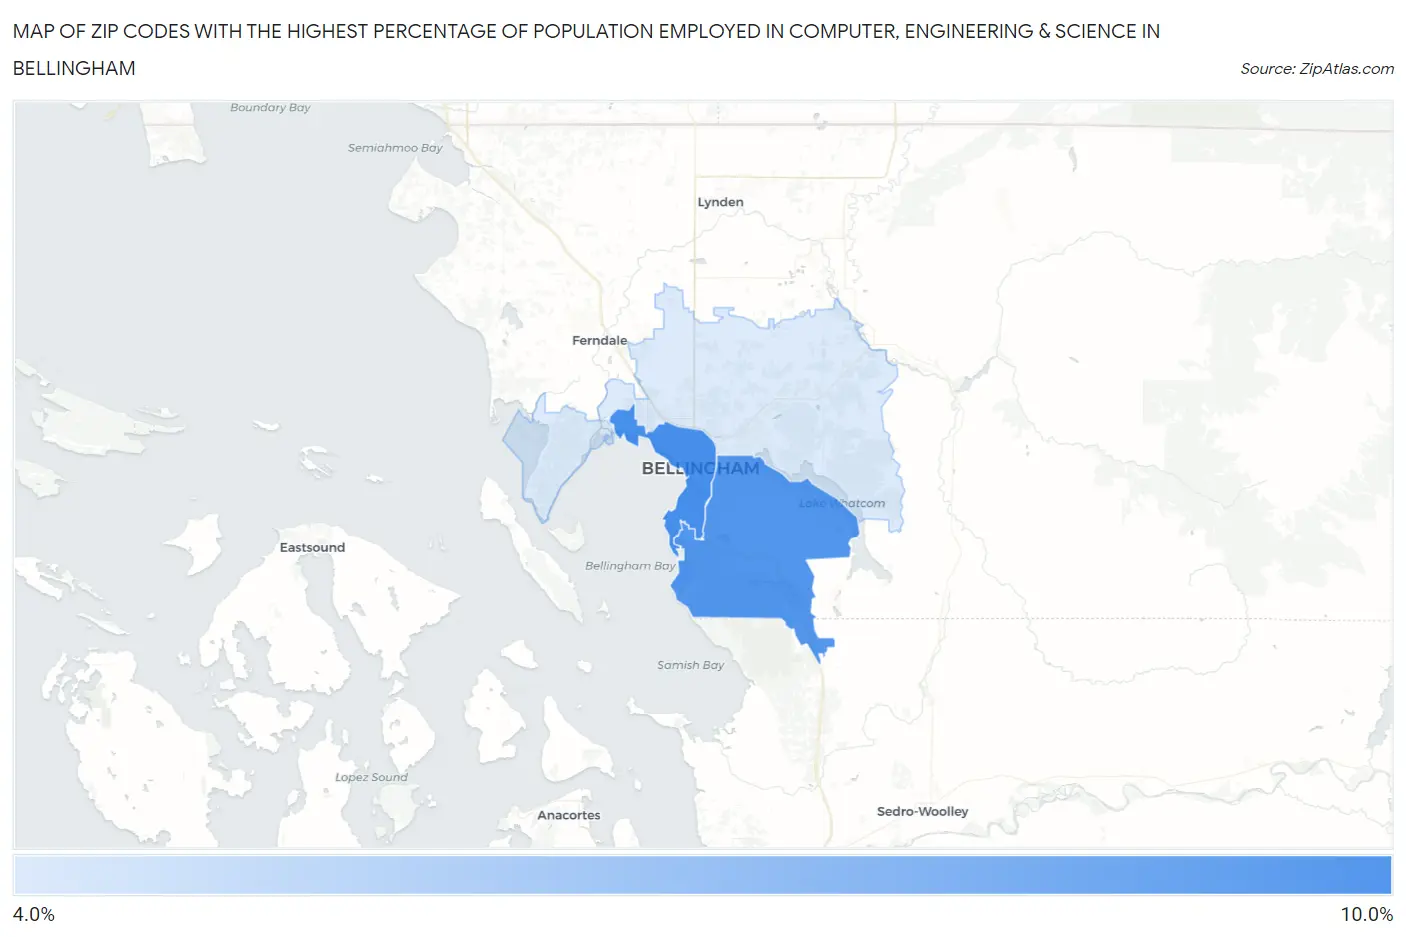
Map of Zip Codes with the Highest Percentage of Population Employed in Computer, Engineering & Science in Bellingham
4.2%
8.7%
Zip Codes with the Highest Percentage of Population Employed in Computer, Engineering & Science in Bellingham, WA
| Zip Code | % Employed | vs State | vs National | |
| 1. | 98225 | 8.7% | 10.2%(-1.47)#140 | 6.8%(+1.93)#4,386 |
| 2. | 98229 | 8.4% | 10.2%(-1.80)#147 | 6.8%(+1.59)#4,760 |
| 3. | 98226 | 4.2% | 10.2%(-5.96)#353 | 6.8%(-2.56)#13,841 |
1
Common Questions
What are the Top Zip Codes with the Highest Percentage of Population Employed in Computer, Engineering & Science in Bellingham, WA?
Top Zip Codes with the Highest Percentage of Population Employed in Computer, Engineering & Science in Bellingham, WA are:
What zip code has the Highest Percentage of Population Employed in Computer, Engineering & Science in Bellingham, WA?
98225 has the Highest Percentage of Population Employed in Computer, Engineering & Science in Bellingham, WA with 8.7%.
What is the Percentage of Population Employed in Computer, Engineering & Science in Bellingham, WA?
Percentage of Population Employed in Computer, Engineering & Science in Bellingham is 6.8%.
What is the Percentage of Population Employed in Computer, Engineering & Science in Washington?
Percentage of Population Employed in Computer, Engineering & Science in Washington is 10.2%.
What is the Percentage of Population Employed in Computer, Engineering & Science in the United States?
Percentage of Population Employed in Computer, Engineering & Science in the United States is 6.8%.