Zip Codes with the Highest Percentage of Population Employed in Computer, Engineering & Science in Kirkland, WA
RELATED REPORTS & OPTIONS
Computer, Engineering & Science
Kirkland
Compare Zip Codes
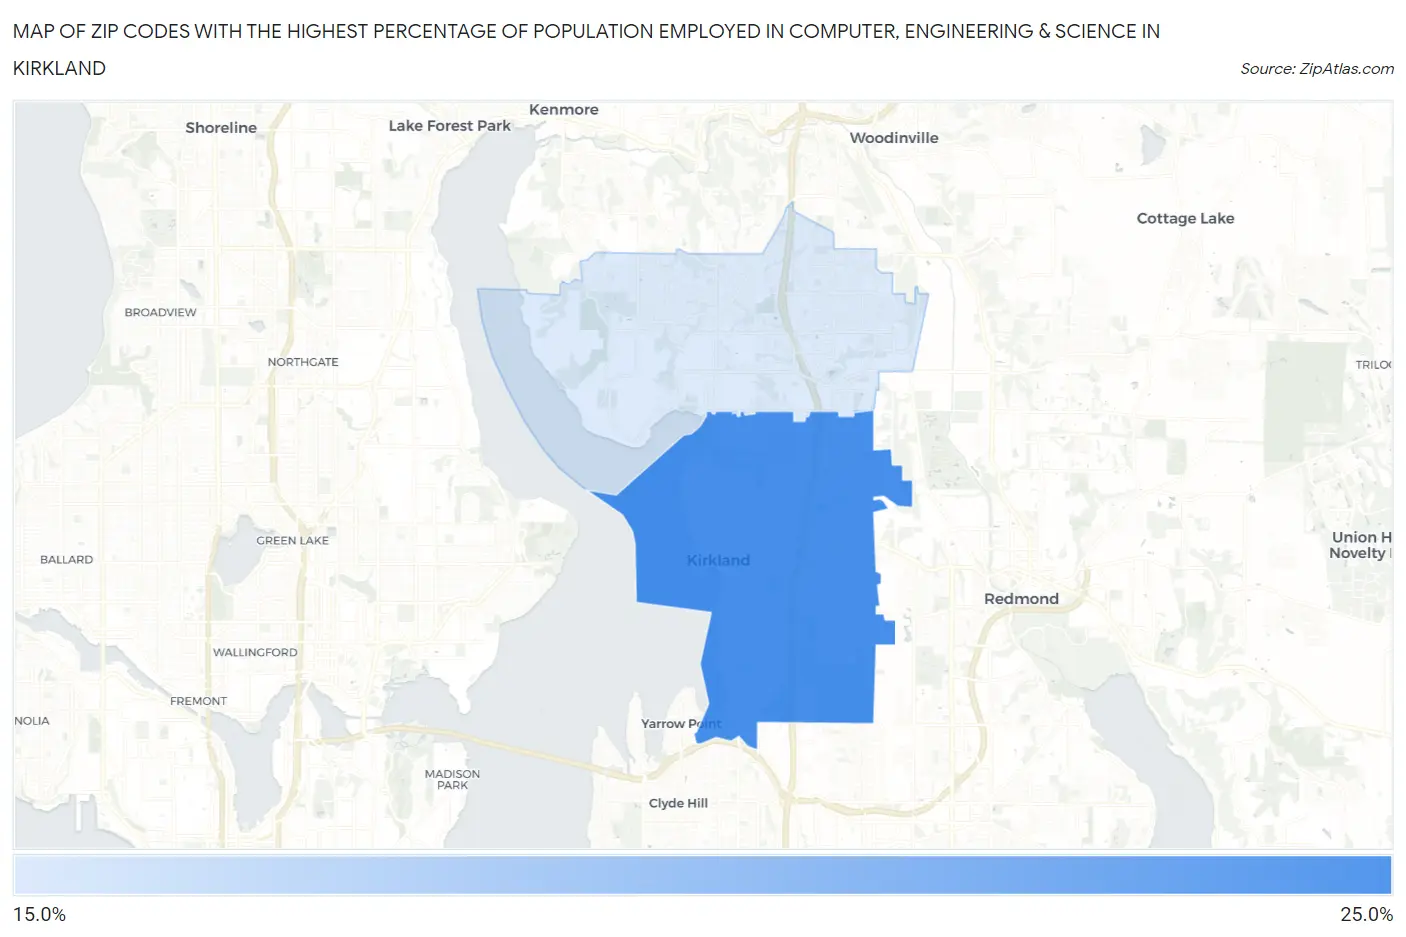
Map of Zip Codes with the Highest Percentage of Population Employed in Computer, Engineering & Science in Kirkland
20.5%
24.4%
Zip Codes with the Highest Percentage of Population Employed in Computer, Engineering & Science in Kirkland, WA
| Zip Code | % Employed | vs State | vs National | |
| 1. | 98033 | 24.4% | 10.2%(+14.2)#20 | 6.8%(+17.6)#291 |
| 2. | 98034 | 20.5% | 10.2%(+10.4)#37 | 6.8%(+13.8)#476 |
1
Common Questions
What are the Top Zip Codes with the Highest Percentage of Population Employed in Computer, Engineering & Science in Kirkland, WA?
Top Zip Codes with the Highest Percentage of Population Employed in Computer, Engineering & Science in Kirkland, WA are:
What zip code has the Highest Percentage of Population Employed in Computer, Engineering & Science in Kirkland, WA?
98033 has the Highest Percentage of Population Employed in Computer, Engineering & Science in Kirkland, WA with 24.4%.
What is the Percentage of Population Employed in Computer, Engineering & Science in Kirkland, WA?
Percentage of Population Employed in Computer, Engineering & Science in Kirkland is 22.3%.
What is the Percentage of Population Employed in Computer, Engineering & Science in Washington?
Percentage of Population Employed in Computer, Engineering & Science in Washington is 10.2%.
What is the Percentage of Population Employed in Computer, Engineering & Science in the United States?
Percentage of Population Employed in Computer, Engineering & Science in the United States is 6.8%.