Canterwood, WA Map & Demographics
Canterwood Map
Canterwood Overview
$71,541
PER CAPITA INCOME
$144,292
AVG FAMILY INCOME
$123,167
AVG HOUSEHOLD INCOME
67.5%
WAGE / INCOME GAP [ % ]
32.5¢/ $1
WAGE / INCOME GAP [ $ ]
0.45
INEQUALITY / GINI INDEX
2,991
TOTAL POPULATION
1,414
MALE POPULATION
1,577
FEMALE POPULATION
89.66
MALES / 100 FEMALES
111.53
FEMALES / 100 MALES
52.5
MEDIAN AGE
2.8
AVG FAMILY SIZE
2.6
AVG HOUSEHOLD SIZE
1,250
LABOR FORCE [ PEOPLE ]
51.6%
PERCENT IN LABOR FORCE
4.0%
UNEMPLOYMENT RATE
Income in Canterwood
Income Overview in Canterwood
Per Capita Income in Canterwood is $71,541, while median incomes of families and households are $144,292 and $123,167 respectively.
| Characteristic | Number | Measure |
| Per Capita Income | 2,991 | $71,541 |
| Median Family Income | 969 | $144,292 |
| Mean Family Income | 969 | $200,995 |
| Median Household Income | 1,150 | $123,167 |
| Mean Household Income | 1,150 | $185,636 |
| Income Deficit | 969 | $0 |
| Wage / Income Gap (%) | 2,991 | 67.54% |
| Wage / Income Gap ($) | 2,991 | 32.46¢ per $1 |
| Gini / Inequality Index | 2,991 | 0.45 |
Earnings by Sex in Canterwood
Average Earnings in Canterwood are $60,331, $100,179 for men and $32,520 for women, a difference of 67.5%.
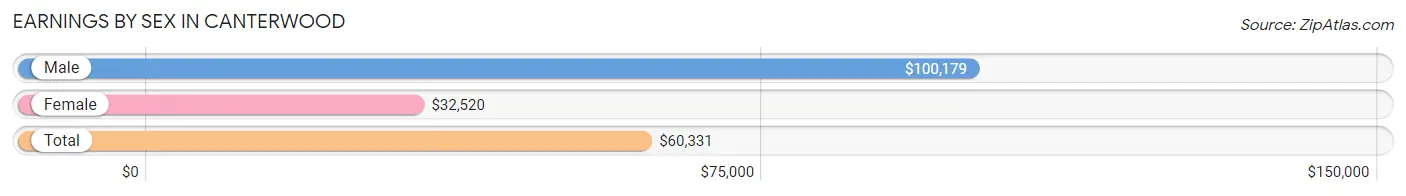
| Sex | Number | Average Earnings |
| Male | 718 (52.4%) | $100,179 |
| Female | 651 (47.5%) | $32,520 |
| Total | 1,369 (100.0%) | $60,331 |
Earnings by Sex by Income Bracket in Canterwood
The most common earnings brackets in Canterwood are $100,000+ for men (364 | 50.7%) and $100,000+ for women (98 | 15.0%).
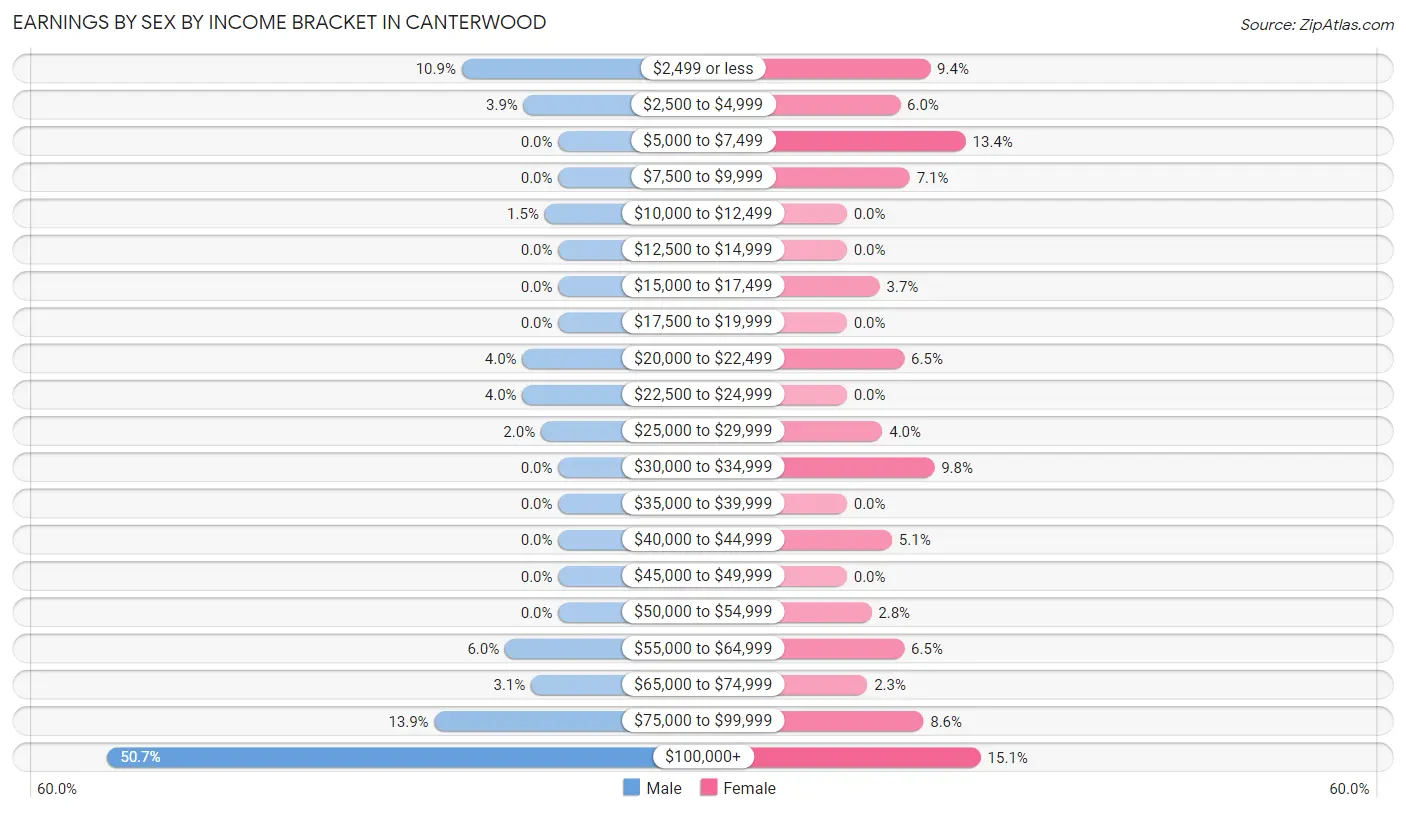
| Income | Male | Female |
| $2,499 or less | 78 (10.9%) | 61 (9.4%) |
| $2,500 to $4,999 | 28 (3.9%) | 39 (6.0%) |
| $5,000 to $7,499 | 0 (0.0%) | 87 (13.4%) |
| $7,500 to $9,999 | 0 (0.0%) | 46 (7.1%) |
| $10,000 to $12,499 | 11 (1.5%) | 0 (0.0%) |
| $12,500 to $14,999 | 0 (0.0%) | 0 (0.0%) |
| $15,000 to $17,499 | 0 (0.0%) | 24 (3.7%) |
| $17,500 to $19,999 | 0 (0.0%) | 0 (0.0%) |
| $20,000 to $22,499 | 29 (4.0%) | 42 (6.5%) |
| $22,500 to $24,999 | 29 (4.0%) | 0 (0.0%) |
| $25,000 to $29,999 | 14 (1.9%) | 26 (4.0%) |
| $30,000 to $34,999 | 0 (0.0%) | 64 (9.8%) |
| $35,000 to $39,999 | 0 (0.0%) | 0 (0.0%) |
| $40,000 to $44,999 | 0 (0.0%) | 33 (5.1%) |
| $45,000 to $49,999 | 0 (0.0%) | 0 (0.0%) |
| $50,000 to $54,999 | 0 (0.0%) | 18 (2.8%) |
| $55,000 to $64,999 | 43 (6.0%) | 42 (6.5%) |
| $65,000 to $74,999 | 22 (3.1%) | 15 (2.3%) |
| $75,000 to $99,999 | 100 (13.9%) | 56 (8.6%) |
| $100,000+ | 364 (50.7%) | 98 (15.0%) |
| Total | 718 (100.0%) | 651 (100.0%) |
Earnings by Sex by Educational Attainment in Canterwood
Average earnings in Canterwood are $101,482 for men and $33,145 for women, a difference of 67.3%. Men with an educational attainment of college or associate's degree enjoy the highest average annual earnings of $250,001, while those with bachelor's degree education earn the least with $99,099. Women with an educational attainment of bachelor's degree earn the most with the average annual earnings of $60,478, while those with bachelor's degree education have the smallest earnings of $60,478.
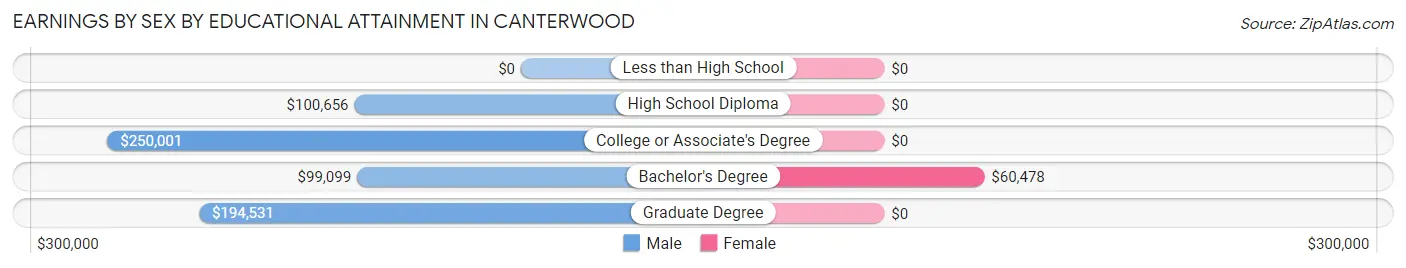
| Educational Attainment | Male Income | Female Income |
| Less than High School | - | - |
| High School Diploma | $100,656 | $0 |
| College or Associate's Degree | $250,001 | $0 |
| Bachelor's Degree | $99,099 | $60,478 |
| Graduate Degree | $194,531 | $0 |
| Total | $101,482 | $33,145 |
Family Income in Canterwood
Family Income Brackets in Canterwood
According to the Canterwood family income data, there are 369 families falling into the $200,000+ income range, which is the most common income bracket and makes up 38.1% of all families.
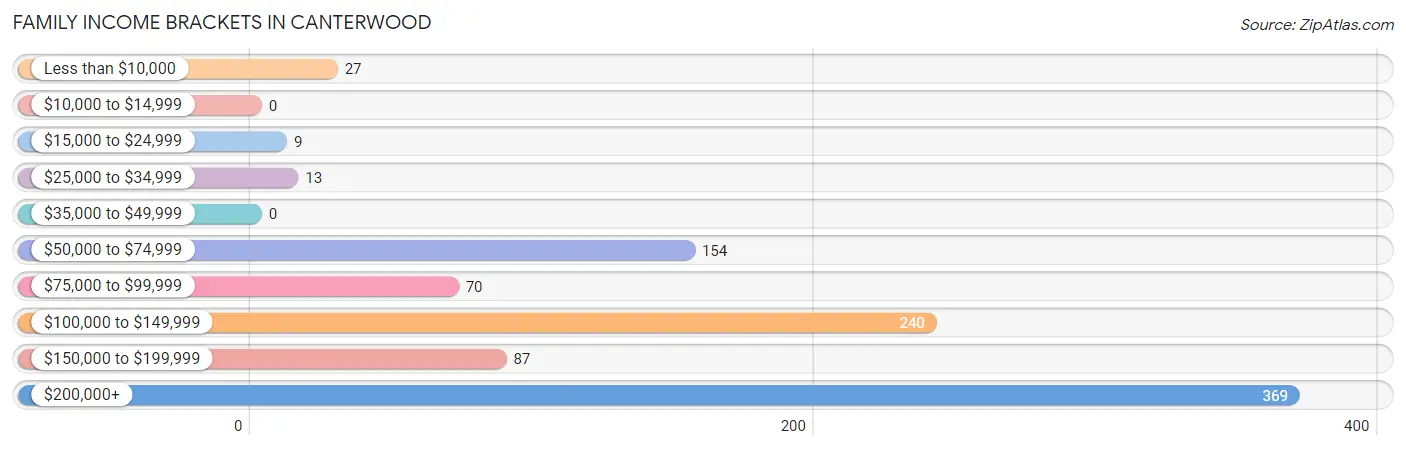
| Income Bracket | # Families | % Families |
| Less than $10,000 | 27 | 2.8% |
| $10,000 to $14,999 | 0 | 0.0% |
| $15,000 to $24,999 | 9 | 0.9% |
| $25,000 to $34,999 | 13 | 1.3% |
| $35,000 to $49,999 | 0 | 0.0% |
| $50,000 to $74,999 | 154 | 15.9% |
| $75,000 to $99,999 | 70 | 7.2% |
| $100,000 to $149,999 | 240 | 24.8% |
| $150,000 to $199,999 | 87 | 9.0% |
| $200,000+ | 369 | 38.1% |
Family Income by Famaliy Size in Canterwood
5-person families (103 | 10.6%) account for the highest median family income in Canterwood with $250,001 per family, while 3-person families (171 | 17.6%) have the highest median income of $81,227 per family member.
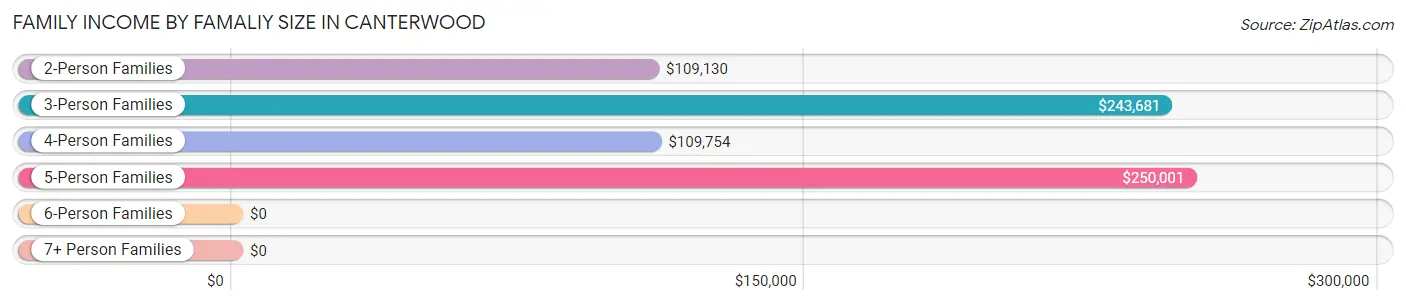
| Income Bracket | # Families | Median Income |
| 2-Person Families | 576 (59.4%) | $109,130 |
| 3-Person Families | 171 (17.6%) | $243,681 |
| 4-Person Families | 119 (12.3%) | $109,754 |
| 5-Person Families | 103 (10.6%) | $250,001 |
| 6-Person Families | 0 (0.0%) | $0 |
| 7+ Person Families | 0 (0.0%) | $0 |
| Total | 969 (100.0%) | $144,292 |
Family Income by Number of Earners in Canterwood
The median family income in Canterwood is $144,292, with families comprising 1 earner (199) having the highest median family income of $234,702, while families with no earners (330) have the lowest median family income of $74,000, accounting for 20.5% and 34.1% of families, respectively.
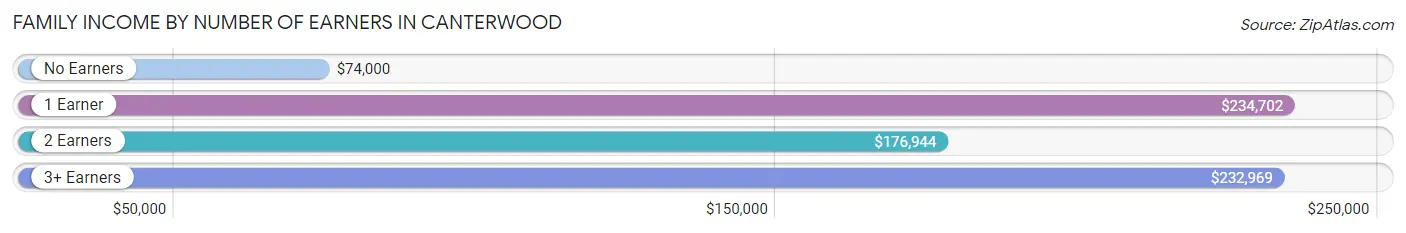
| Number of Earners | # Families | Median Income |
| No Earners | 330 (34.1%) | $74,000 |
| 1 Earner | 199 (20.5%) | $234,702 |
| 2 Earners | 318 (32.8%) | $176,944 |
| 3+ Earners | 122 (12.6%) | $232,969 |
| Total | 969 (100.0%) | $144,292 |
Household Income in Canterwood
Household Income Brackets in Canterwood
With 392 households falling in the category, the $200,000+ income range is the most frequent in Canterwood, accounting for 34.1% of all households.
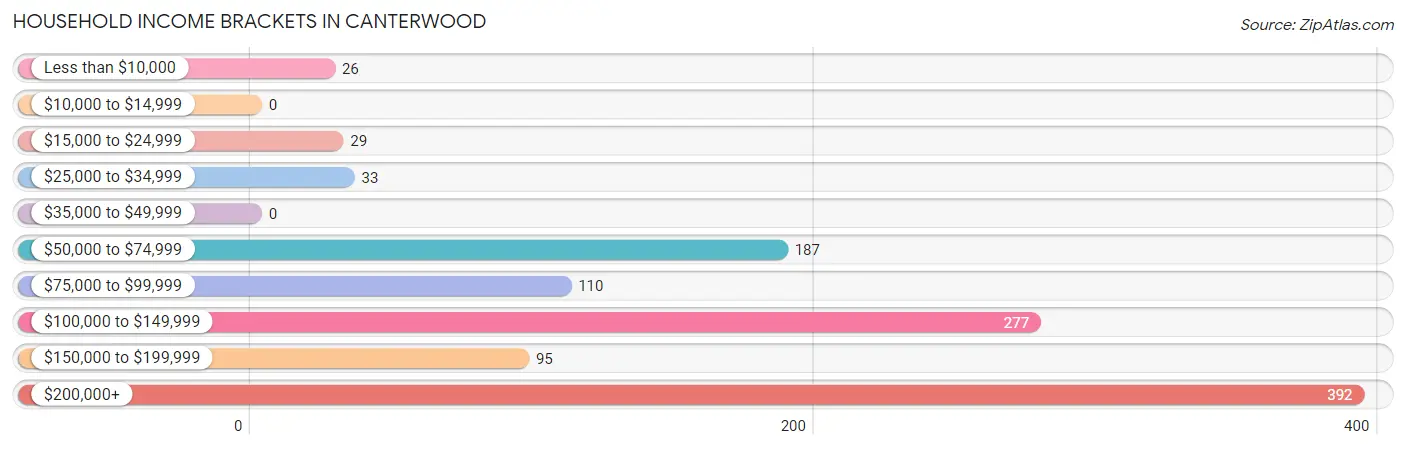
| Income Bracket | # Households | % Households |
| Less than $10,000 | 26 | 2.3% |
| $10,000 to $14,999 | 0 | 0.0% |
| $15,000 to $24,999 | 29 | 2.5% |
| $25,000 to $34,999 | 33 | 2.9% |
| $35,000 to $49,999 | 0 | 0.0% |
| $50,000 to $74,999 | 187 | 16.3% |
| $75,000 to $99,999 | 110 | 9.6% |
| $100,000 to $149,999 | 277 | 24.1% |
| $150,000 to $199,999 | 95 | 8.3% |
| $200,000+ | 392 | 34.1% |
Household Income by Householder Age in Canterwood
The median household income in Canterwood is $123,167, with the highest median household income of $234,392 found in the 45 to 64 years age bracket for the primary householder. A total of 492 households (42.8%) fall into this category. Meanwhile, the 15 to 24 years age bracket for the primary householder has the lowest median household income of $0, with 6 households (0.5%) in this group.
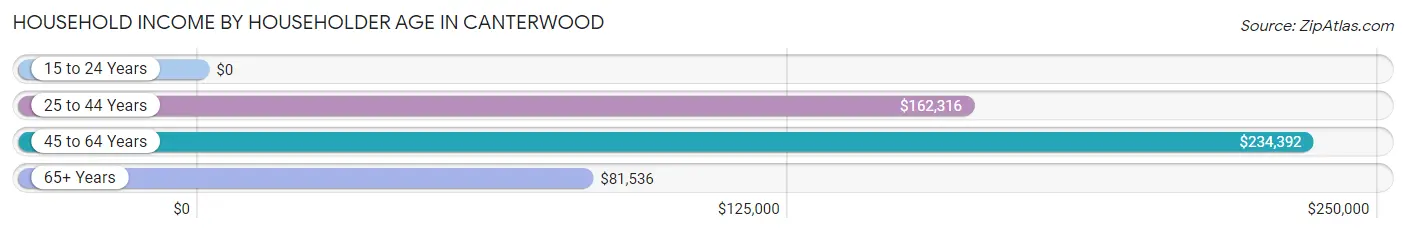
| Income Bracket | # Households | Median Income |
| 15 to 24 Years | 6 (0.5%) | $0 |
| 25 to 44 Years | 205 (17.8%) | $162,316 |
| 45 to 64 Years | 492 (42.8%) | $234,392 |
| 65+ Years | 447 (38.9%) | $81,536 |
| Total | 1,150 (100.0%) | $123,167 |
Poverty in Canterwood
Income Below Poverty by Sex and Age in Canterwood
With 2.5% poverty level for males and 2.2% for females among the residents of Canterwood, 55 to 64 year old males and 55 to 64 year old females are the most vulnerable to poverty, with 27 males (8.2%) and 25 females (7.6%) in their respective age groups living below the poverty level.
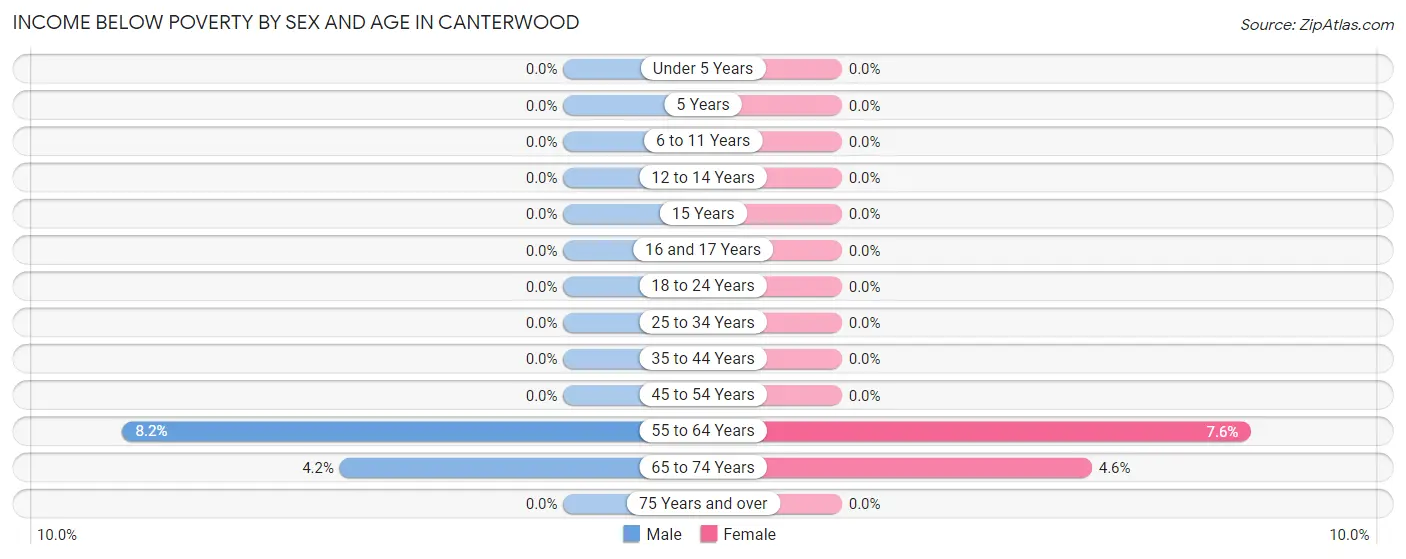
| Age Bracket | Male | Female |
| Under 5 Years | 0 (0.0%) | 0 (0.0%) |
| 5 Years | 0 (0.0%) | 0 (0.0%) |
| 6 to 11 Years | 0 (0.0%) | 0 (0.0%) |
| 12 to 14 Years | 0 (0.0%) | 0 (0.0%) |
| 15 Years | 0 (0.0%) | 0 (0.0%) |
| 16 and 17 Years | 0 (0.0%) | 0 (0.0%) |
| 18 to 24 Years | 0 (0.0%) | 0 (0.0%) |
| 25 to 34 Years | 0 (0.0%) | 0 (0.0%) |
| 35 to 44 Years | 0 (0.0%) | 0 (0.0%) |
| 45 to 54 Years | 0 (0.0%) | 0 (0.0%) |
| 55 to 64 Years | 27 (8.2%) | 25 (7.6%) |
| 65 to 74 Years | 9 (4.2%) | 9 (4.6%) |
| 75 Years and over | 0 (0.0%) | 0 (0.0%) |
| Total | 36 (2.5%) | 34 (2.2%) |
Income Above Poverty by Sex and Age in Canterwood
According to the poverty statistics in Canterwood, males aged under 5 years and females aged under 5 years are the age groups that are most secure financially, with 100.0% of males and 100.0% of females in these age groups living above the poverty line.
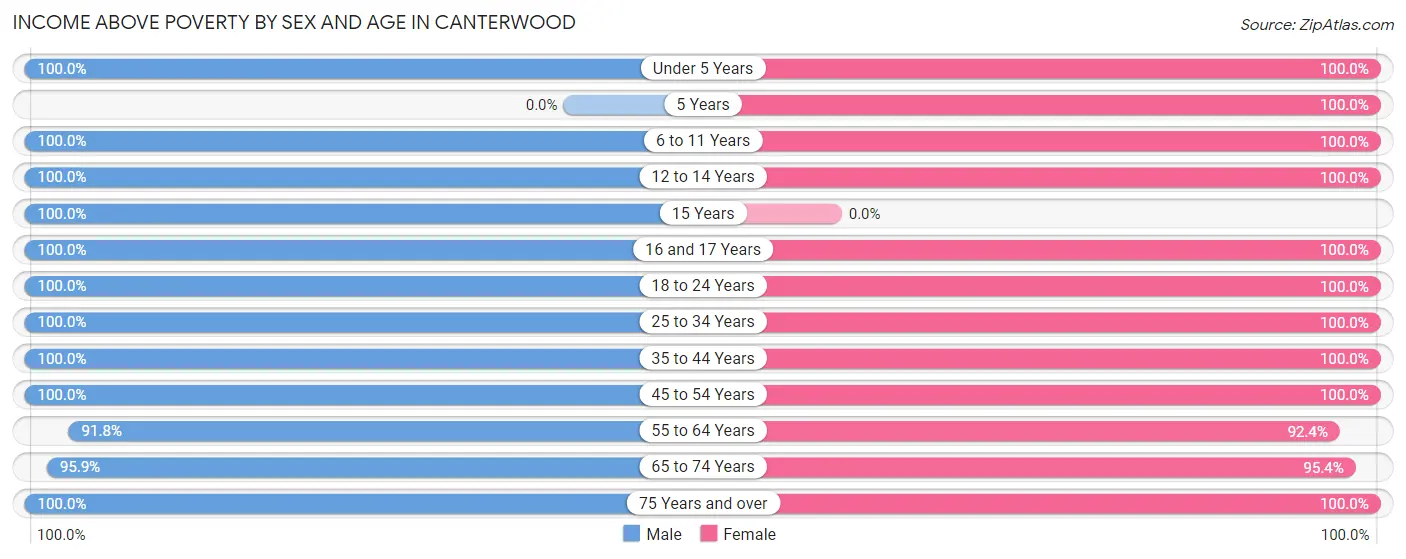
| Age Bracket | Male | Female |
| Under 5 Years | 113 (100.0%) | 67 (100.0%) |
| 5 Years | 0 (0.0%) | 37 (100.0%) |
| 6 to 11 Years | 47 (100.0%) | 211 (100.0%) |
| 12 to 14 Years | 30 (100.0%) | 40 (100.0%) |
| 15 Years | 24 (100.0%) | 0 (0.0%) |
| 16 and 17 Years | 11 (100.0%) | 26 (100.0%) |
| 18 to 24 Years | 79 (100.0%) | 44 (100.0%) |
| 25 to 34 Years | 110 (100.0%) | 73 (100.0%) |
| 35 to 44 Years | 119 (100.0%) | 188 (100.0%) |
| 45 to 54 Years | 148 (100.0%) | 197 (100.0%) |
| 55 to 64 Years | 303 (91.8%) | 305 (92.4%) |
| 65 to 74 Years | 208 (95.9%) | 185 (95.4%) |
| 75 Years and over | 186 (100.0%) | 170 (100.0%) |
| Total | 1,378 (97.5%) | 1,543 (97.8%) |
Income Below Poverty Among Married-Couple Families in Canterwood
The poverty statistics for married-couple families in Canterwood show that 3.8% or 36 of the total 956 families live below the poverty line. Families with no children have the highest poverty rate of 5.2%, comprising of 36 families. On the other hand, families with 1 or 2 children have the lowest poverty rate of 0.0%, which includes 0 families.
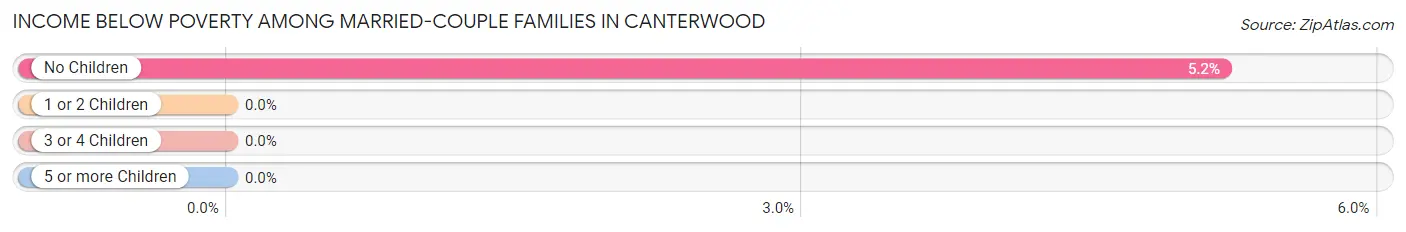
| Children | Above Poverty | Below Poverty |
| No Children | 657 (94.8%) | 36 (5.2%) |
| 1 or 2 Children | 160 (100.0%) | 0 (0.0%) |
| 3 or 4 Children | 103 (100.0%) | 0 (0.0%) |
| 5 or more Children | 0 (0.0%) | 0 (0.0%) |
| Total | 920 (96.2%) | 36 (3.8%) |
Income Below Poverty Among Single-Parent Households in Canterwood
| Children | Single Father | Single Mother |
| No Children | 0 (0.0%) | 0 (0.0%) |
| 1 or 2 Children | 0 (0.0%) | 0 (0.0%) |
| 3 or 4 Children | 0 (0.0%) | 0 (0.0%) |
| 5 or more Children | 0 (0.0%) | 0 (0.0%) |
| Total | 0 (0.0%) | 0 (0.0%) |
Income Below Poverty Among Married-Couple vs Single-Parent Households in Canterwood
| Children | Married-Couple Families | Single-Parent Households |
| No Children | 36 (5.2%) | 0 (0.0%) |
| 1 or 2 Children | 0 (0.0%) | 0 (0.0%) |
| 3 or 4 Children | 0 (0.0%) | 0 (0.0%) |
| 5 or more Children | 0 (0.0%) | 0 (0.0%) |
| Total | 36 (3.8%) | 0 (0.0%) |
Race in Canterwood
The most populous races in Canterwood are White / Caucasian (2,641 | 88.3%), Two or more Races (266 | 8.9%), and Hispanic or Latino (110 | 3.7%).
| Race | # Population | % Population |
| Asian | 55 | 1.8% |
| Black / African American | 0 | 0.0% |
| Hawaiian / Pacific | 0 | 0.0% |
| Hispanic or Latino | 110 | 3.7% |
| Native / Alaskan | 0 | 0.0% |
| White / Caucasian | 2,641 | 88.3% |
| Two or more Races | 266 | 8.9% |
| Some other Race | 29 | 1.0% |
| Total | 2,991 | 100.0% |
Ancestry in Canterwood
The most populous ancestries reported in Canterwood are Irish (794 | 26.6%), German (612 | 20.5%), English (535 | 17.9%), Norwegian (203 | 6.8%), and Swedish (170 | 5.7%), together accounting for 77.4% of all Canterwood residents.
| Ancestry | # Population | % Population |
| Belgian | 49 | 1.6% |
| Bhutanese | 8 | 0.3% |
| British | 42 | 1.4% |
| Cherokee | 34 | 1.1% |
| Croatian | 14 | 0.5% |
| Dutch | 25 | 0.8% |
| Eastern European | 6 | 0.2% |
| English | 535 | 17.9% |
| European | 101 | 3.4% |
| French | 34 | 1.1% |
| French Canadian | 24 | 0.8% |
| German | 612 | 20.5% |
| Hungarian | 55 | 1.8% |
| Irish | 794 | 26.6% |
| Italian | 132 | 4.4% |
| Korean | 111 | 3.7% |
| Mexican | 63 | 2.1% |
| Northern European | 21 | 0.7% |
| Norwegian | 203 | 6.8% |
| Polish | 10 | 0.3% |
| Romanian | 25 | 0.8% |
| Russian | 40 | 1.3% |
| Scandinavian | 20 | 0.7% |
| Scotch-Irish | 24 | 0.8% |
| Scottish | 29 | 1.0% |
| Spaniard | 33 | 1.1% |
| Swedish | 170 | 5.7% |
| Swiss | 16 | 0.5% |
| Thai | 47 | 1.6% |
| Tlingit-Haida | 89 | 3.0% |
| Welsh | 23 | 0.8% | View All 31 Rows |
Immigrants in Canterwood
The most numerous immigrant groups reported in Canterwood came from Europe (147 | 4.9%), Northern Europe (120 | 4.0%), Ireland (76 | 2.5%), Asia (55 | 1.8%), and Scotland (34 | 1.1%), together accounting for 14.4% of all Canterwood residents.
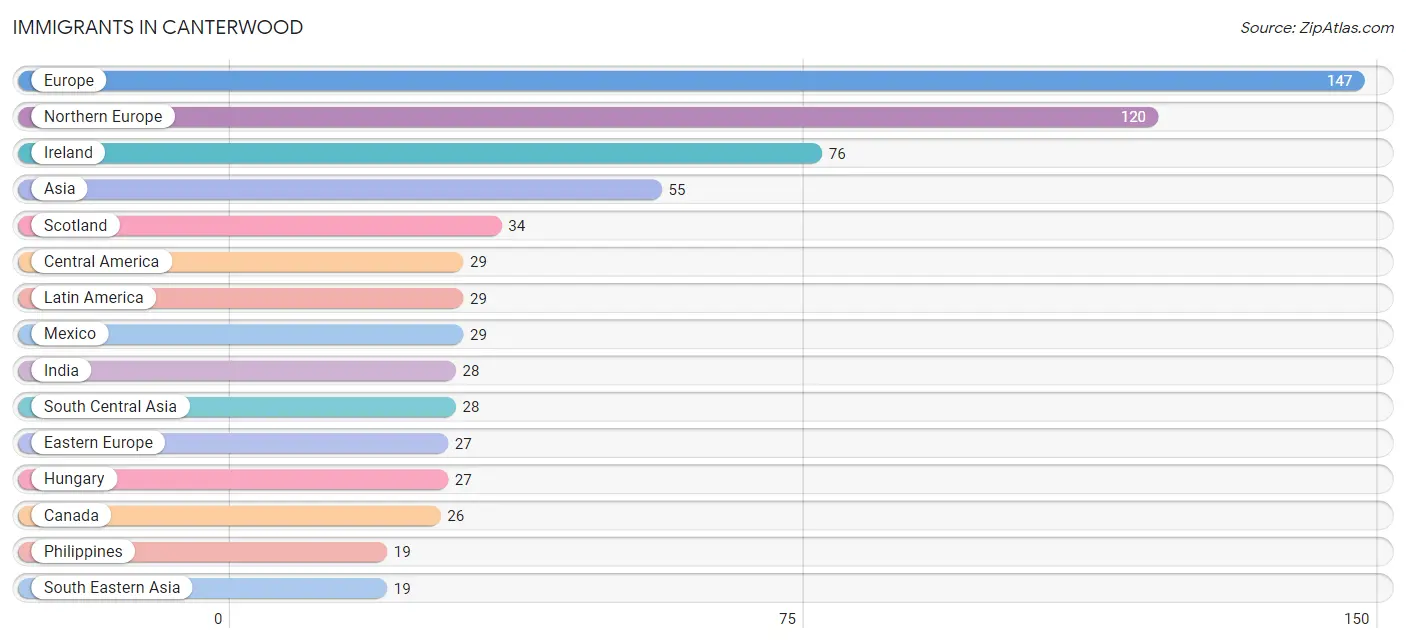
| Immigration Origin | # Population | % Population |
| Asia | 55 | 1.8% |
| Canada | 26 | 0.9% |
| Central America | 29 | 1.0% |
| Denmark | 10 | 0.3% |
| Eastern Asia | 8 | 0.3% |
| Eastern Europe | 27 | 0.9% |
| Europe | 147 | 4.9% |
| Hungary | 27 | 0.9% |
| India | 28 | 0.9% |
| Ireland | 76 | 2.5% |
| Japan | 8 | 0.3% |
| Latin America | 29 | 1.0% |
| Mexico | 29 | 1.0% |
| Northern Europe | 120 | 4.0% |
| Philippines | 19 | 0.6% |
| Scotland | 34 | 1.1% |
| South Central Asia | 28 | 0.9% |
| South Eastern Asia | 19 | 0.6% | View All 18 Rows |
Sex and Age in Canterwood
Sex and Age in Canterwood
The most populous age groups in Canterwood are 55 to 59 Years (241 | 17.0%) for men and 5 to 9 Years (236 | 15.0%) for women.
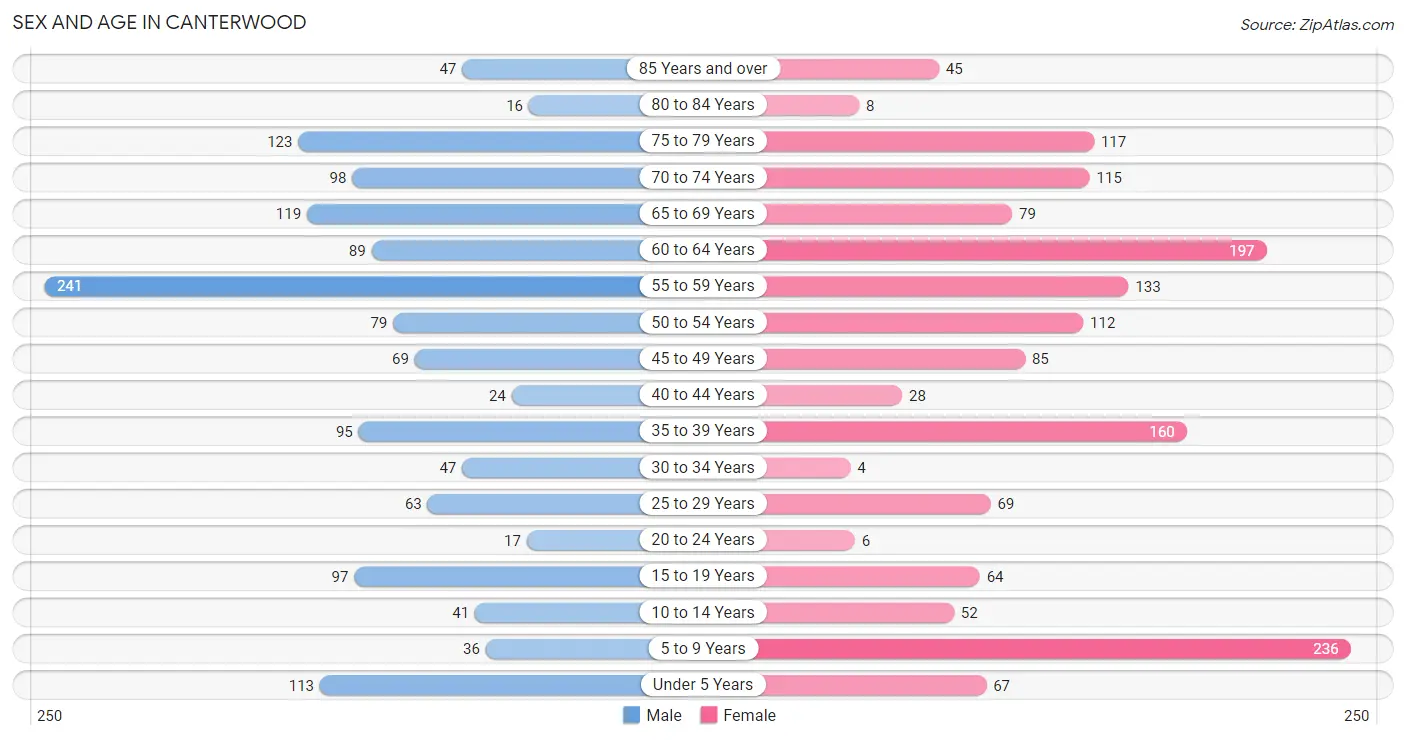
| Age Bracket | Male | Female |
| Under 5 Years | 113 (8.0%) | 67 (4.3%) |
| 5 to 9 Years | 36 (2.5%) | 236 (15.0%) |
| 10 to 14 Years | 41 (2.9%) | 52 (3.3%) |
| 15 to 19 Years | 97 (6.9%) | 64 (4.1%) |
| 20 to 24 Years | 17 (1.2%) | 6 (0.4%) |
| 25 to 29 Years | 63 (4.5%) | 69 (4.4%) |
| 30 to 34 Years | 47 (3.3%) | 4 (0.3%) |
| 35 to 39 Years | 95 (6.7%) | 160 (10.2%) |
| 40 to 44 Years | 24 (1.7%) | 28 (1.8%) |
| 45 to 49 Years | 69 (4.9%) | 85 (5.4%) |
| 50 to 54 Years | 79 (5.6%) | 112 (7.1%) |
| 55 to 59 Years | 241 (17.0%) | 133 (8.4%) |
| 60 to 64 Years | 89 (6.3%) | 197 (12.5%) |
| 65 to 69 Years | 119 (8.4%) | 79 (5.0%) |
| 70 to 74 Years | 98 (6.9%) | 115 (7.3%) |
| 75 to 79 Years | 123 (8.7%) | 117 (7.4%) |
| 80 to 84 Years | 16 (1.1%) | 8 (0.5%) |
| 85 Years and over | 47 (3.3%) | 45 (2.9%) |
| Total | 1,414 (100.0%) | 1,577 (100.0%) |
Families and Households in Canterwood
Median Family Size in Canterwood
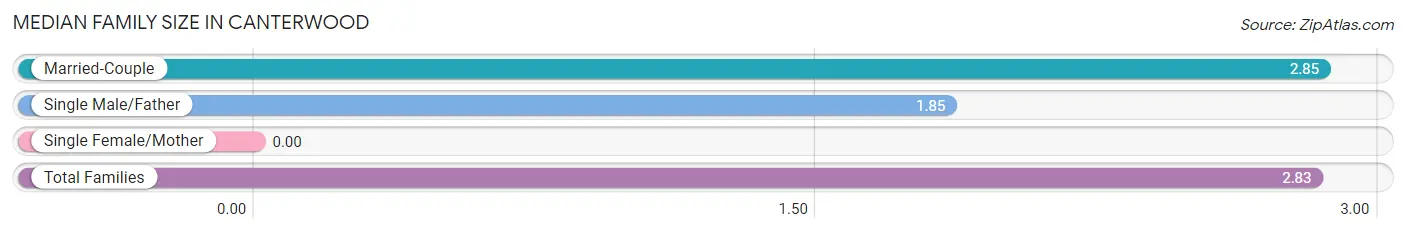
| Family Type | # Families | Family Size |
| Married-Couple | 956 (98.7%) | 2.85 |
| Single Male/Father | 13 (1.3%) | 1.85 |
| Single Female/Mother | 0 (0.0%) | - |
| Total Families | 969 (100.0%) | 2.83 |
Median Household Size in Canterwood
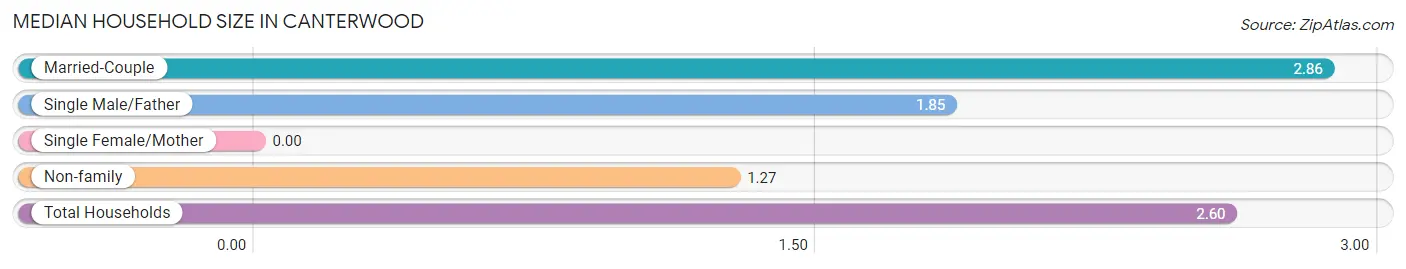
| Household Type | # Households | Household Size |
| Married-Couple | 956 (83.1%) | 2.86 |
| Single Male/Father | 13 (1.1%) | 1.85 |
| Single Female/Mother | 0 (0.0%) | - |
| Non-family | 181 (15.7%) | 1.27 |
| Total Households | 1,150 (100.0%) | 2.60 |
Household Size by Marriage Status in Canterwood
Out of a total of 1,150 households in Canterwood, 969 (84.3%) are family households, while 181 (15.7%) are nonfamily households. The most numerous type of family households are 2-person households, comprising 576, and the most common type of nonfamily households are 1-person households, comprising 125.
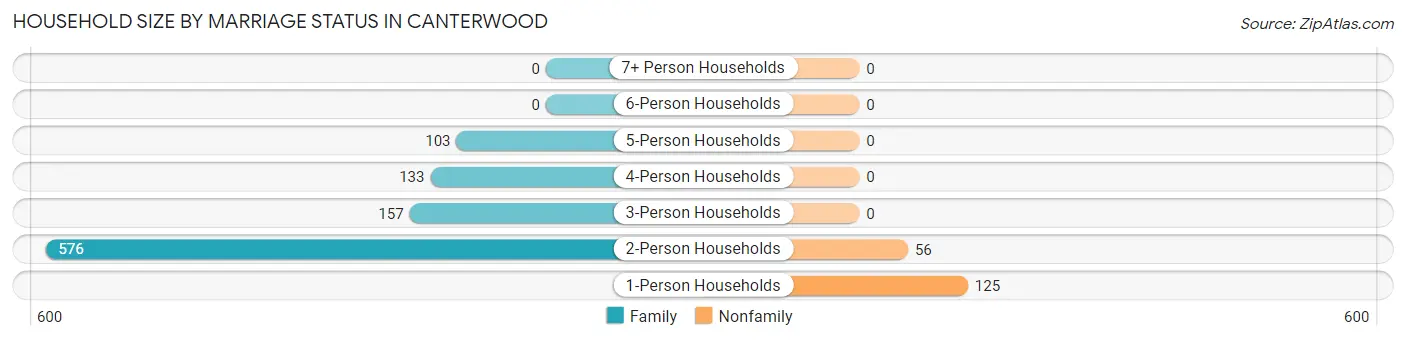
| Household Size | Family Households | Nonfamily Households |
| 1-Person Households | - | 125 (10.9%) |
| 2-Person Households | 576 (50.1%) | 56 (4.9%) |
| 3-Person Households | 157 (13.7%) | 0 (0.0%) |
| 4-Person Households | 133 (11.6%) | 0 (0.0%) |
| 5-Person Households | 103 (9.0%) | 0 (0.0%) |
| 6-Person Households | 0 (0.0%) | 0 (0.0%) |
| 7+ Person Households | 0 (0.0%) | 0 (0.0%) |
| Total | 969 (84.3%) | 181 (15.7%) |
Female Fertility in Canterwood
Fertility by Age in Canterwood
Average fertility rate in Canterwood is 79.0 births per 1,000 women. Women in the age bracket of 35 to 50 years have the highest fertility rate with 119.0 births per 1,000 women. Women in the age bracket of 35 to 50 years acount for 100.0% of all women with births.
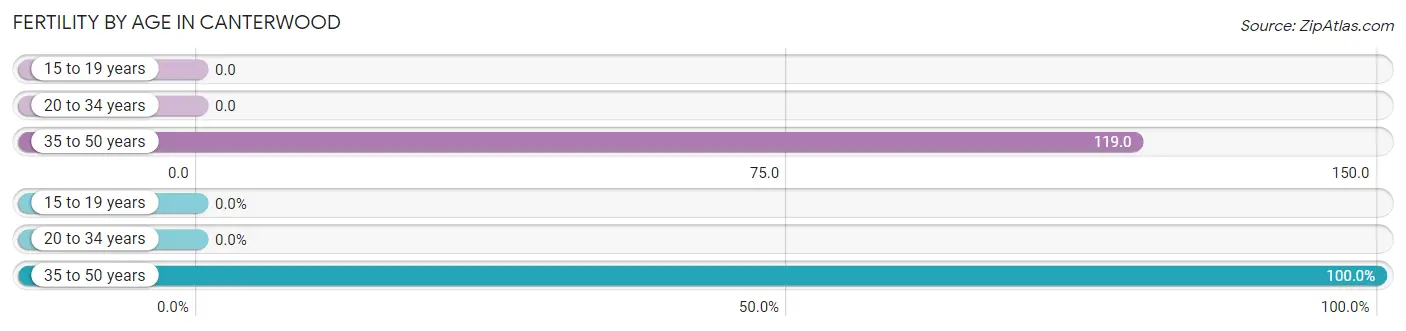
| Age Bracket | Women with Births | Births / 1,000 Women |
| 15 to 19 years | 0 (0.0%) | 0.0 |
| 20 to 34 years | 0 (0.0%) | 0.0 |
| 35 to 50 years | 34 (100.0%) | 119.0 |
| Total | 34 (100.0%) | 79.0 |
Fertility by Age by Marriage Status in Canterwood
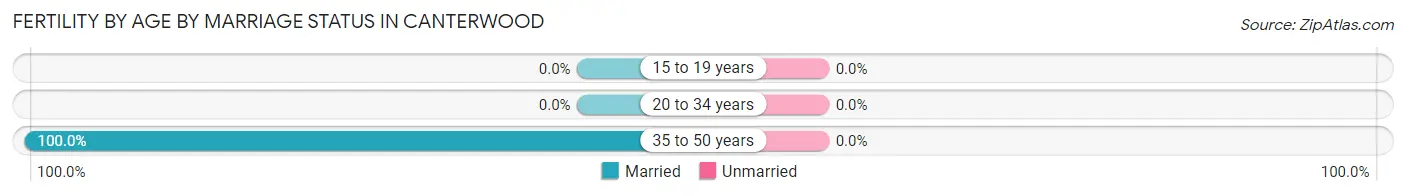
| Age Bracket | Married | Unmarried |
| 15 to 19 years | 0 (0.0%) | 0 (0.0%) |
| 20 to 34 years | 0 (0.0%) | 0 (0.0%) |
| 35 to 50 years | 34 (100.0%) | 0 (0.0%) |
| Total | 34 (100.0%) | 0 (0.0%) |
Fertility by Education in Canterwood
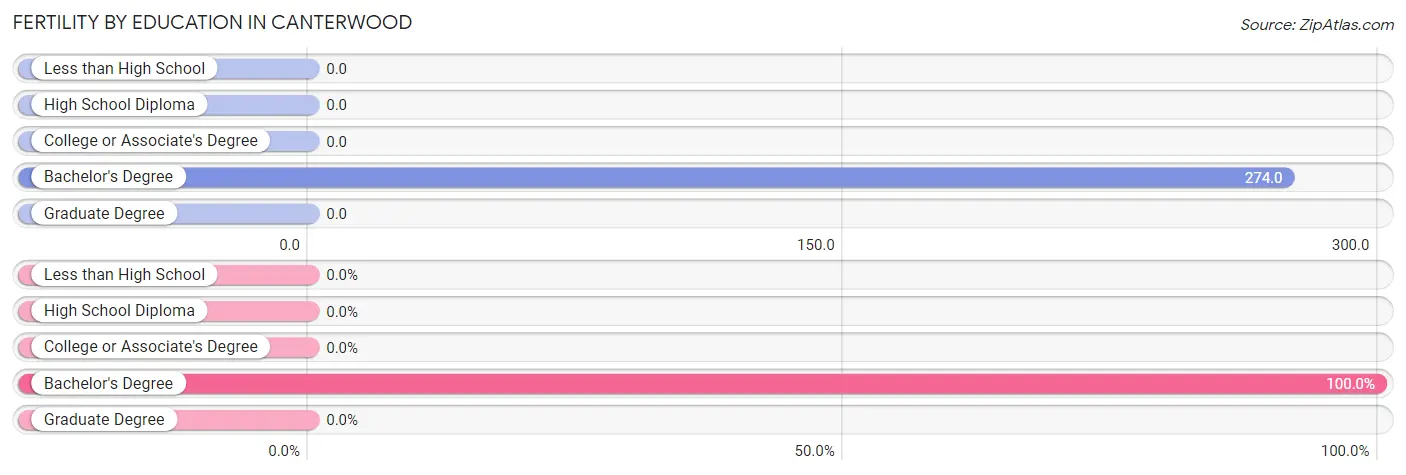
| Educational Attainment | Women with Births | Births / 1,000 Women |
| Less than High School | 0 (0.0%) | 0.0 |
| High School Diploma | 0 (0.0%) | 0.0 |
| College or Associate's Degree | 0 (0.0%) | 0.0 |
| Bachelor's Degree | 34 (100.0%) | 274.0 |
| Graduate Degree | 0 (0.0%) | 0.0 |
| Total | 34 (100.0%) | 79.0 |
Fertility by Education by Marriage Status in Canterwood
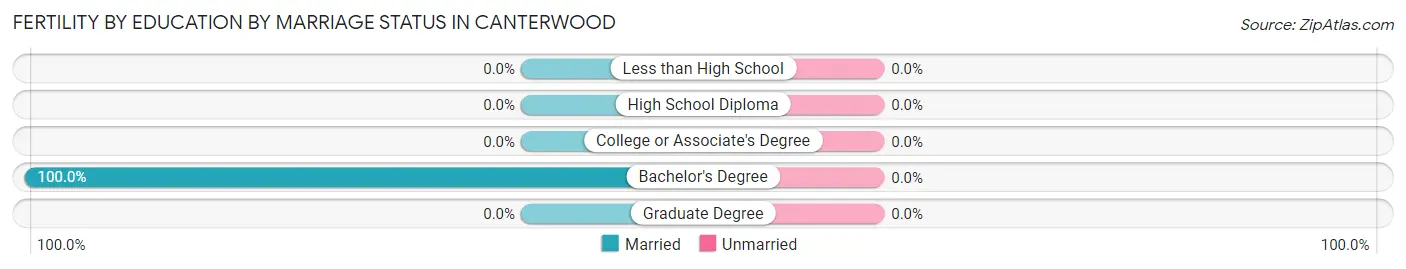
| Educational Attainment | Married | Unmarried |
| Less than High School | 0 (0.0%) | 0 (0.0%) |
| High School Diploma | 0 (0.0%) | 0 (0.0%) |
| College or Associate's Degree | 0 (0.0%) | 0 (0.0%) |
| Bachelor's Degree | 34 (100.0%) | 0 (0.0%) |
| Graduate Degree | 0 (0.0%) | 0 (0.0%) |
| Total | 34 (100.0%) | 0 (0.0%) |
Employment Characteristics in Canterwood
Employment by Class of Employer in Canterwood
Among the 1,069 employed individuals in Canterwood, private company employees (587 | 54.9%), not-for-profit organizations (142 | 13.3%), and local government employees (113 | 10.6%) make up the most common classes of employment.
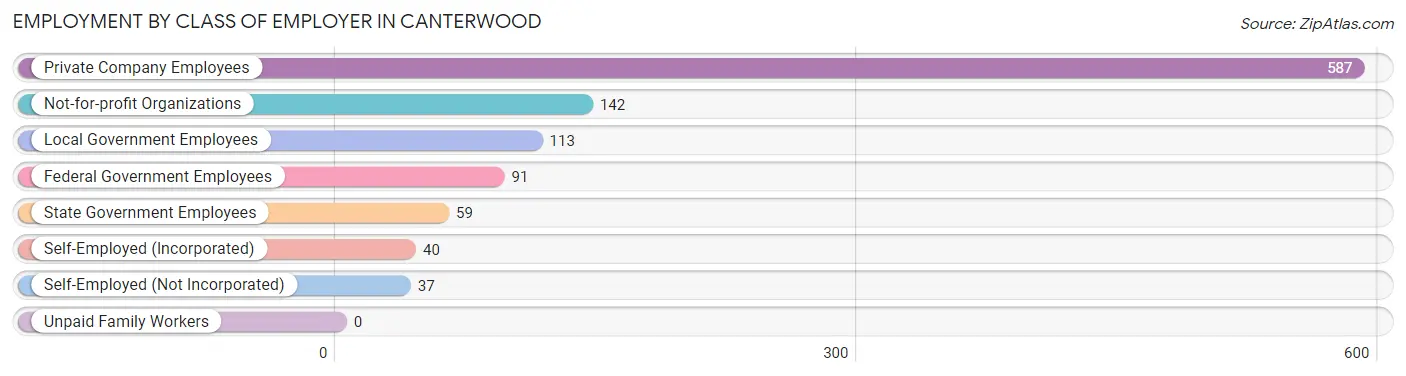
| Employer Class | # Employees | % Employees |
| Private Company Employees | 587 | 54.9% |
| Self-Employed (Incorporated) | 40 | 3.7% |
| Self-Employed (Not Incorporated) | 37 | 3.5% |
| Not-for-profit Organizations | 142 | 13.3% |
| Local Government Employees | 113 | 10.6% |
| State Government Employees | 59 | 5.5% |
| Federal Government Employees | 91 | 8.5% |
| Unpaid Family Workers | 0 | 0.0% |
| Total | 1,069 | 100.0% |
Employment Status by Age in Canterwood
According to the labor force statistics for Canterwood, out of the total population over 16 years of age (2,422), 51.6% or 1,250 individuals are in the labor force, with 4.0% or 50 of them unemployed. The age group with the highest labor force participation rate is 25 to 29 years, with 100.0% or 132 individuals in the labor force. Within the labor force, the 25 to 29 years age range has the highest percentage of unemployed individuals, with 28.8% or 38 of them being unemployed.
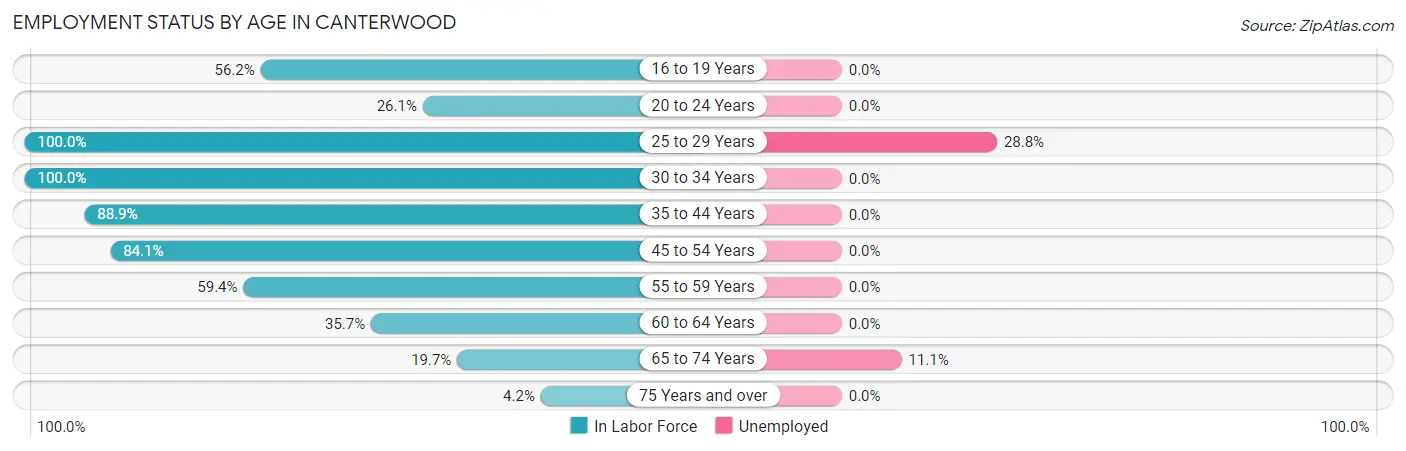
| Age Bracket | In Labor Force | Unemployed |
| 16 to 19 Years | 77 (56.2%) | 0 (0.0%) |
| 20 to 24 Years | 6 (26.1%) | 0 (0.0%) |
| 25 to 29 Years | 132 (100.0%) | 38 (28.8%) |
| 30 to 34 Years | 51 (100.0%) | 0 (0.0%) |
| 35 to 44 Years | 273 (88.9%) | 0 (0.0%) |
| 45 to 54 Years | 290 (84.1%) | 0 (0.0%) |
| 55 to 59 Years | 222 (59.4%) | 0 (0.0%) |
| 60 to 64 Years | 102 (35.7%) | 0 (0.0%) |
| 65 to 74 Years | 81 (19.7%) | 9 (11.1%) |
| 75 Years and over | 15 (4.2%) | 0 (0.0%) |
| Total | 1,250 (51.6%) | 50 (4.0%) |
Employment Status by Educational Attainment in Canterwood
According to labor force statistics for Canterwood, 71.6% of individuals (1,070) out of the total population between 25 and 64 years of age (1,495) are in the labor force, with 3.8% or 41 of them being unemployed. The group with the highest labor force participation rate are those with the educational attainment of high school diploma, with 84.3% or 241 individuals in the labor force. Within the labor force, individuals with college / associate degree education have the highest percentage of unemployment, with 7.8% or 19 of them being unemployed.
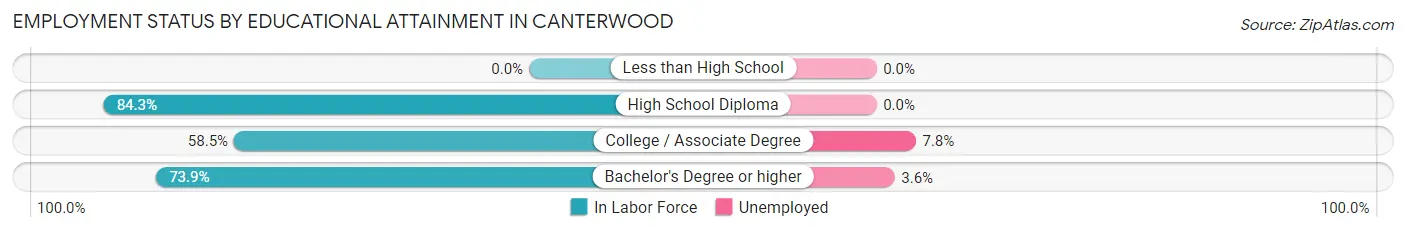
| Educational Attainment | In Labor Force | Unemployed |
| Less than High School | 0 (0.0%) | 0 (0.0%) |
| High School Diploma | 241 (84.3%) | 0 (0.0%) |
| College / Associate Degree | 244 (58.5%) | 33 (7.8%) |
| Bachelor's Degree or higher | 585 (73.9%) | 29 (3.6%) |
| Total | 1,070 (71.6%) | 57 (3.8%) |
Employment Occupations by Sex in Canterwood
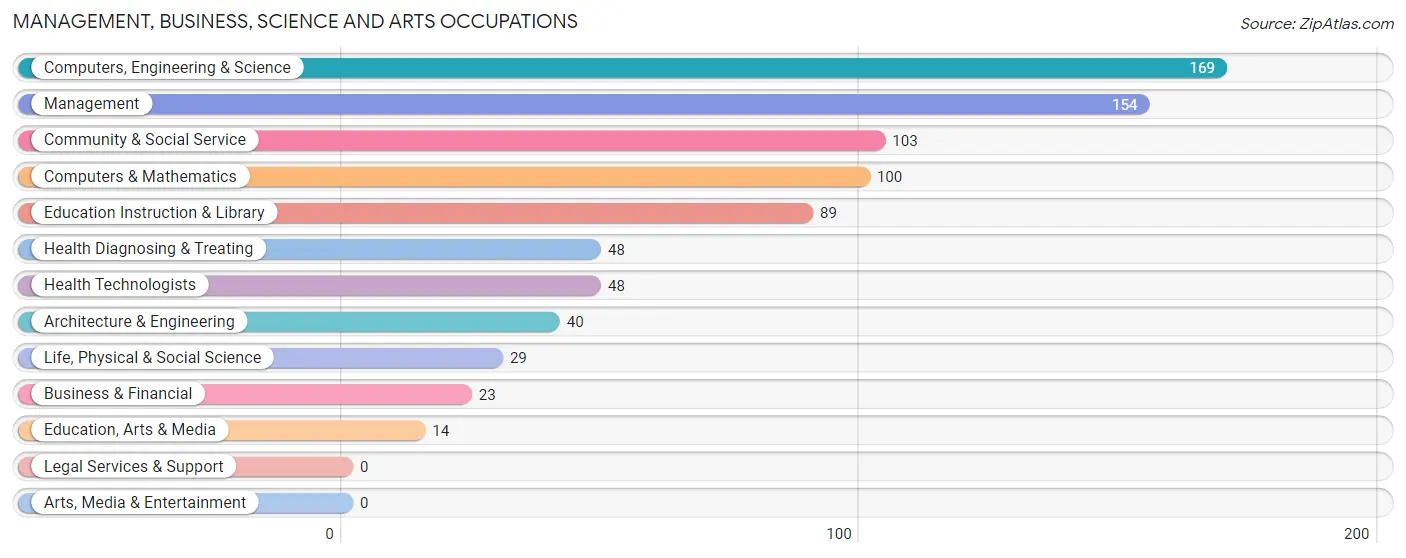
Management, Business, Science and Arts Occupations
The most common Management, Business, Science and Arts occupations in Canterwood are Computers, Engineering & Science (169 | 14.8%), Management (154 | 13.5%), Community & Social Service (103 | 9.0%), Computers & Mathematics (100 | 8.8%), and Education Instruction & Library (89 | 7.8%).
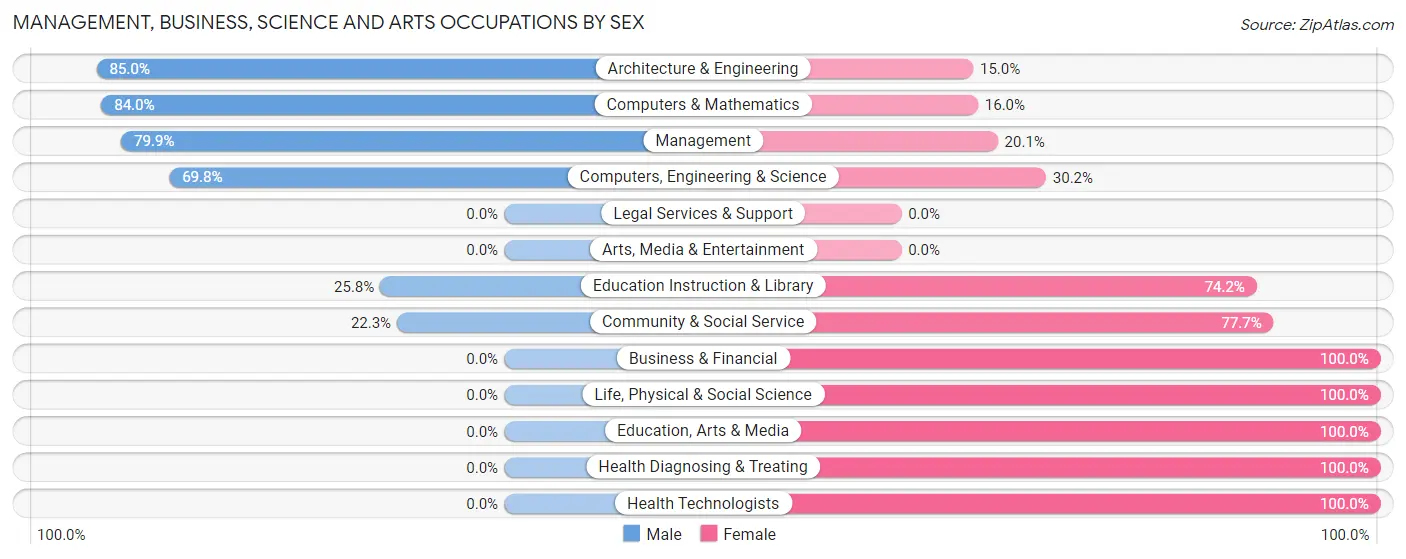
Management, Business, Science and Arts Occupations by Sex
Within the Management, Business, Science and Arts occupations in Canterwood, the most male-oriented occupations are Architecture & Engineering (85.0%), Computers & Mathematics (84.0%), and Management (79.9%), while the most female-oriented occupations are Business & Financial (100.0%), Life, Physical & Social Science (100.0%), and Education, Arts & Media (100.0%).
| Occupation | Male | Female |
| Management | 123 (79.9%) | 31 (20.1%) |
| Business & Financial | 0 (0.0%) | 23 (100.0%) |
| Computers, Engineering & Science | 118 (69.8%) | 51 (30.2%) |
| Computers & Mathematics | 84 (84.0%) | 16 (16.0%) |
| Architecture & Engineering | 34 (85.0%) | 6 (15.0%) |
| Life, Physical & Social Science | 0 (0.0%) | 29 (100.0%) |
| Community & Social Service | 23 (22.3%) | 80 (77.7%) |
| Education, Arts & Media | 0 (0.0%) | 14 (100.0%) |
| Legal Services & Support | 0 (0.0%) | 0 (0.0%) |
| Education Instruction & Library | 23 (25.8%) | 66 (74.2%) |
| Arts, Media & Entertainment | 0 (0.0%) | 0 (0.0%) |
| Health Diagnosing & Treating | 0 (0.0%) | 48 (100.0%) |
| Health Technologists | 0 (0.0%) | 48 (100.0%) |
| Total (Category) | 264 (53.1%) | 233 (46.9%) |
| Total (Overall) | 582 (51.0%) | 558 (48.9%) |
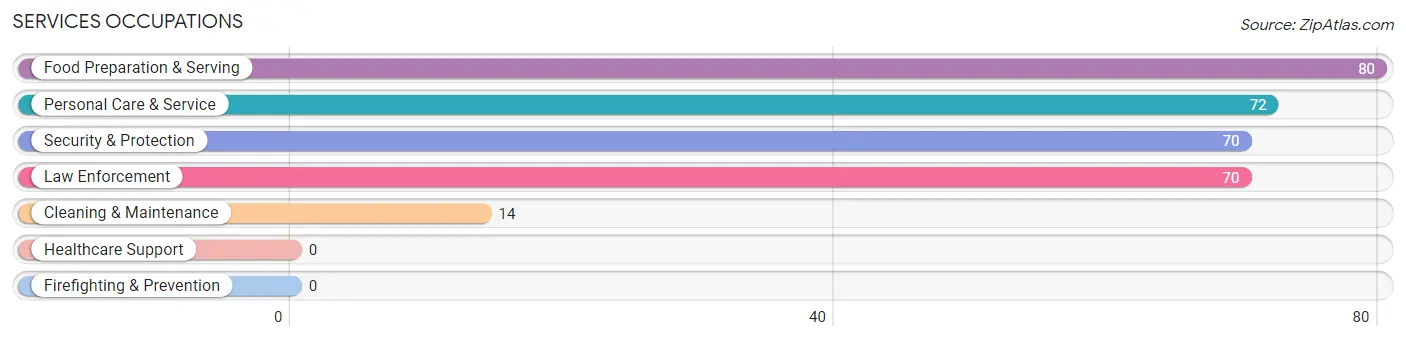
Services Occupations
The most common Services occupations in Canterwood are Food Preparation & Serving (80 | 7.0%), Personal Care & Service (72 | 6.3%), Security & Protection (70 | 6.1%), Law Enforcement (70 | 6.1%), and Cleaning & Maintenance (14 | 1.2%).
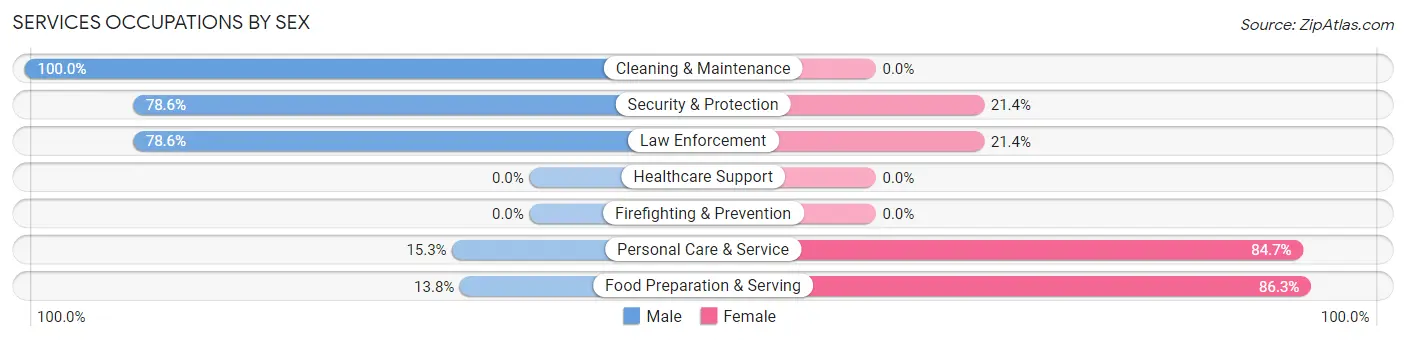
Services Occupations by Sex
Within the Services occupations in Canterwood, the most male-oriented occupations are Cleaning & Maintenance (100.0%), Security & Protection (78.6%), and Law Enforcement (78.6%), while the most female-oriented occupations are Food Preparation & Serving (86.3%), Personal Care & Service (84.7%), and Security & Protection (21.4%).
| Occupation | Male | Female |
| Healthcare Support | 0 (0.0%) | 0 (0.0%) |
| Security & Protection | 55 (78.6%) | 15 (21.4%) |
| Firefighting & Prevention | 0 (0.0%) | 0 (0.0%) |
| Law Enforcement | 55 (78.6%) | 15 (21.4%) |
| Food Preparation & Serving | 11 (13.8%) | 69 (86.3%) |
| Cleaning & Maintenance | 14 (100.0%) | 0 (0.0%) |
| Personal Care & Service | 11 (15.3%) | 61 (84.7%) |
| Total (Category) | 91 (38.6%) | 145 (61.4%) |
| Total (Overall) | 582 (51.0%) | 558 (48.9%) |
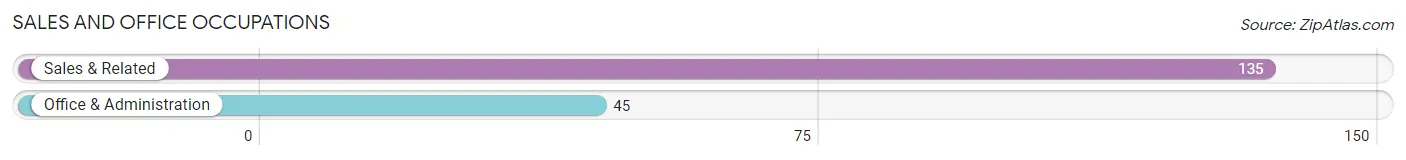
Sales and Office Occupations
The most common Sales and Office occupations in Canterwood are Sales & Related (135 | 11.8%), and Office & Administration (45 | 4.0%).
Sales and Office Occupations by Sex
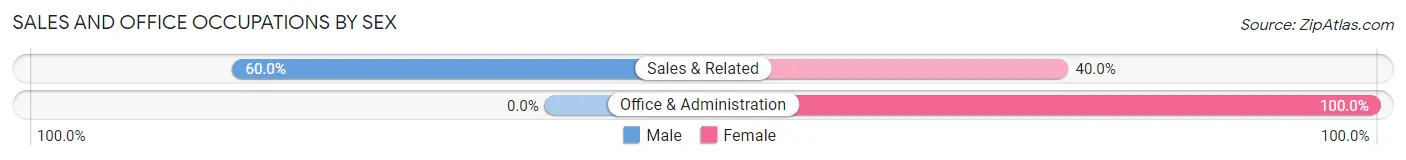
| Occupation | Male | Female |
| Sales & Related | 81 (60.0%) | 54 (40.0%) |
| Office & Administration | 0 (0.0%) | 45 (100.0%) |
| Total (Category) | 81 (45.0%) | 99 (55.0%) |
| Total (Overall) | 582 (51.0%) | 558 (48.9%) |
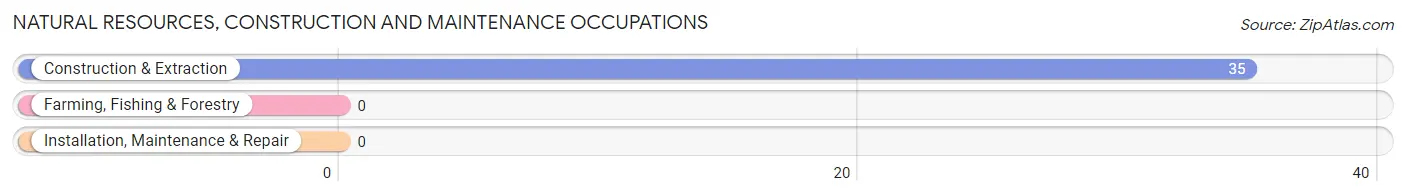
Natural Resources, Construction and Maintenance Occupations
The most common Natural Resources, Construction and Maintenance occupations in Canterwood are , and Construction & Extraction (35 | 3.1%).
Natural Resources, Construction and Maintenance Occupations by Sex
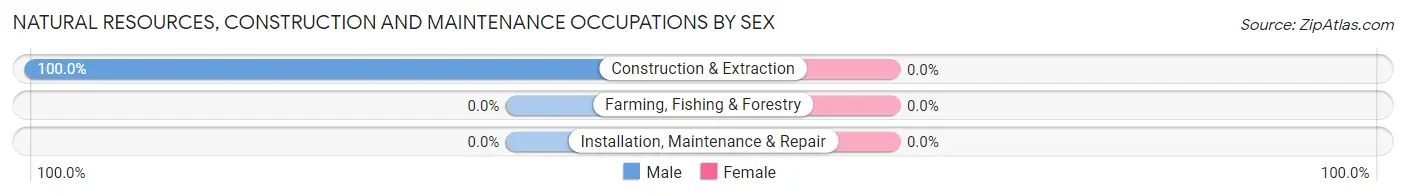
| Occupation | Male | Female |
| Farming, Fishing & Forestry | 0 (0.0%) | 0 (0.0%) |
| Construction & Extraction | 35 (100.0%) | 0 (0.0%) |
| Installation, Maintenance & Repair | 0 (0.0%) | 0 (0.0%) |
| Total (Category) | 35 (100.0%) | 0 (0.0%) |
| Total (Overall) | 582 (51.0%) | 558 (48.9%) |
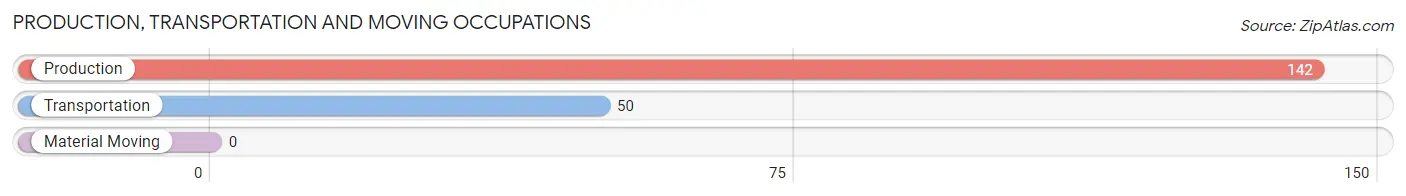
Production, Transportation and Moving Occupations
The most common Production, Transportation and Moving occupations in Canterwood are Production (142 | 12.5%), and Transportation (50 | 4.4%).
Production, Transportation and Moving Occupations by Sex
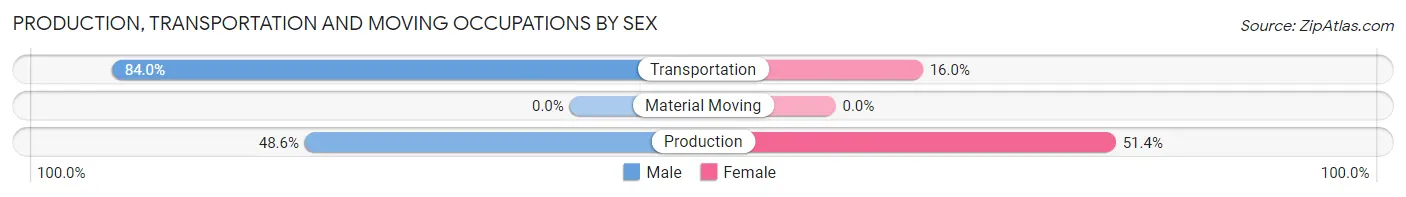
| Occupation | Male | Female |
| Production | 69 (48.6%) | 73 (51.4%) |
| Transportation | 42 (84.0%) | 8 (16.0%) |
| Material Moving | 0 (0.0%) | 0 (0.0%) |
| Total (Category) | 111 (57.8%) | 81 (42.2%) |
| Total (Overall) | 582 (51.0%) | 558 (48.9%) |
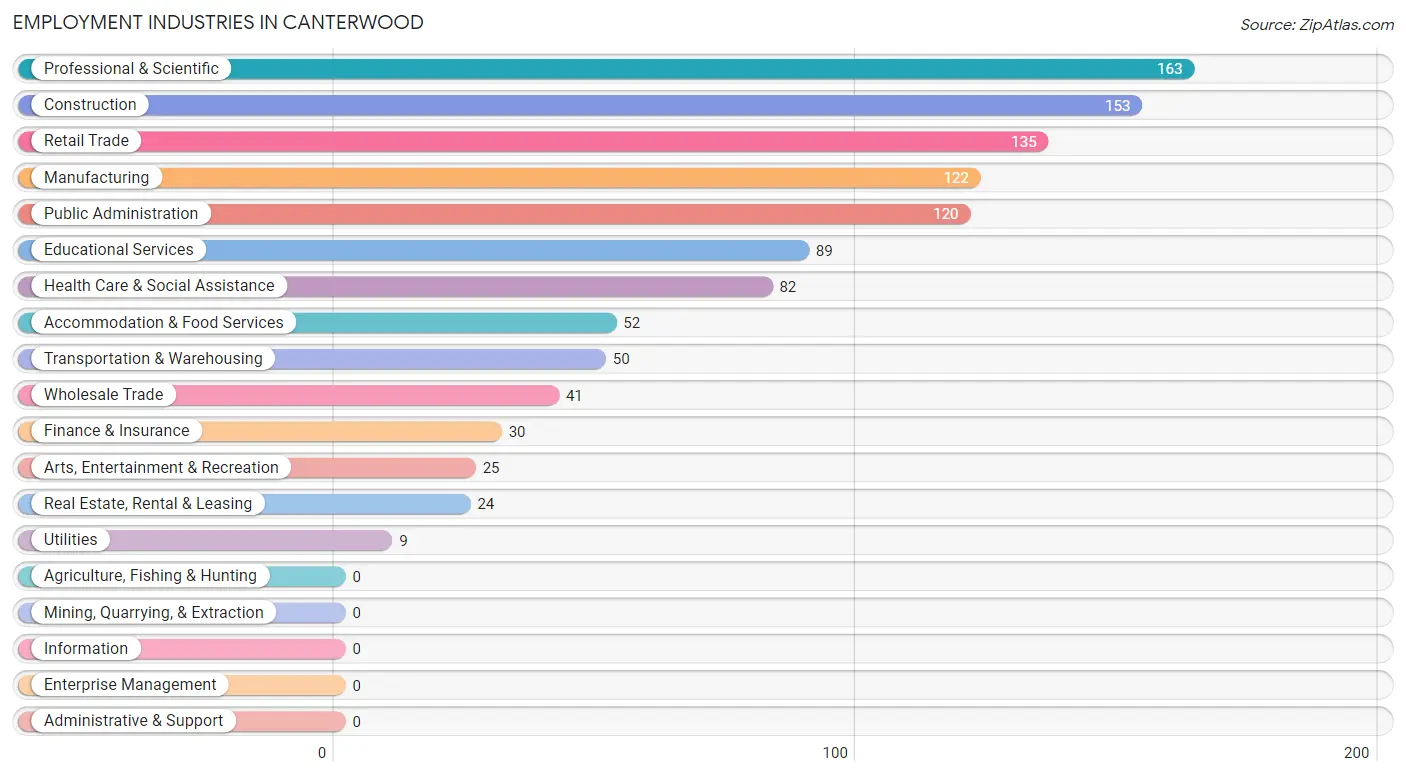
Employment Industries by Sex in Canterwood
Employment Industries in Canterwood
The major employment industries in Canterwood include Professional & Scientific (163 | 14.3%), Construction (153 | 13.4%), Retail Trade (135 | 11.8%), Manufacturing (122 | 10.7%), and Public Administration (120 | 10.5%).
Employment Industries by Sex in Canterwood
The Canterwood industries that see more men than women are Construction (100.0%), Utilities (100.0%), and Real Estate, Rental & Leasing (100.0%), whereas the industries that tend to have a higher number of women are Finance & Insurance (100.0%), Health Care & Social Assistance (100.0%), and Accommodation & Food Services (78.8%).
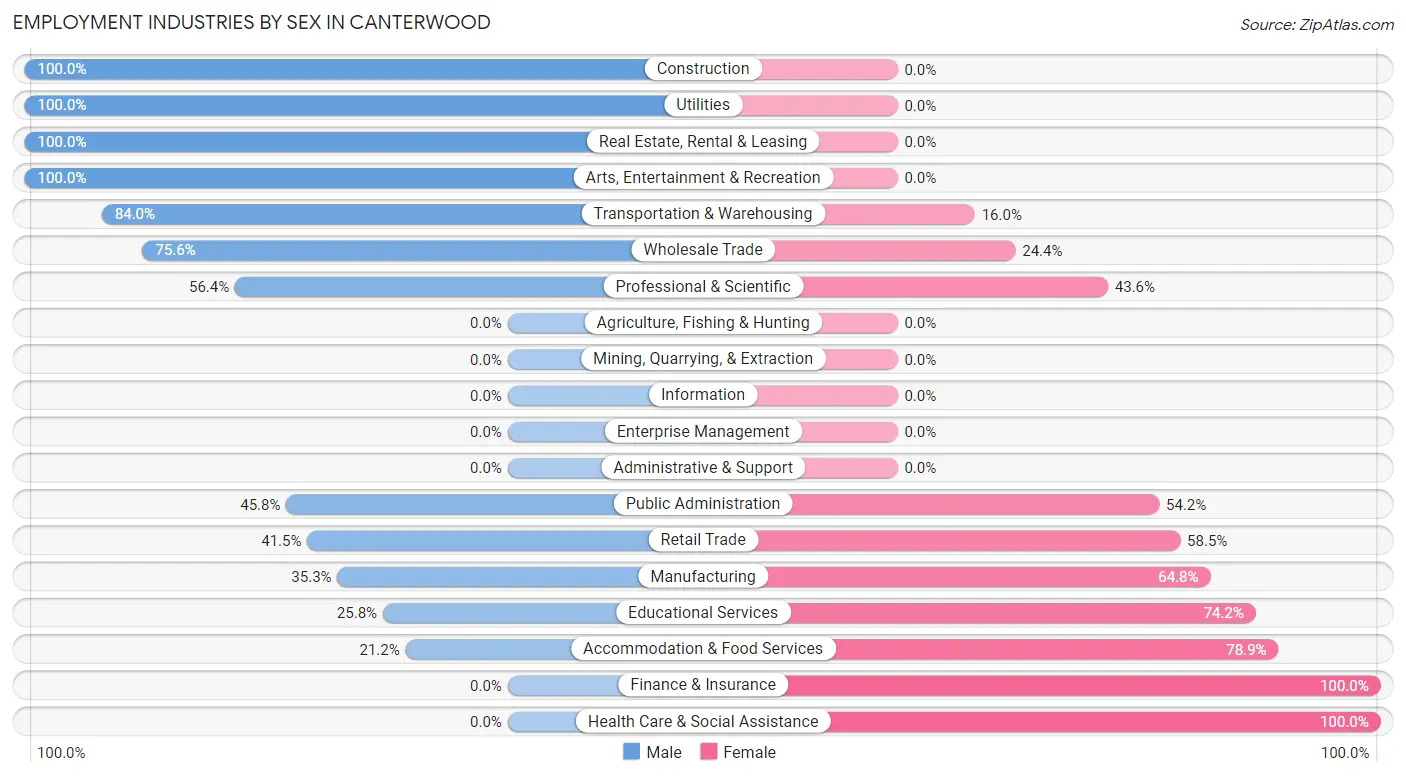
| Industry | Male | Female |
| Agriculture, Fishing & Hunting | 0 (0.0%) | 0 (0.0%) |
| Mining, Quarrying, & Extraction | 0 (0.0%) | 0 (0.0%) |
| Construction | 153 (100.0%) | 0 (0.0%) |
| Manufacturing | 43 (35.2%) | 79 (64.7%) |
| Wholesale Trade | 31 (75.6%) | 10 (24.4%) |
| Retail Trade | 56 (41.5%) | 79 (58.5%) |
| Transportation & Warehousing | 42 (84.0%) | 8 (16.0%) |
| Utilities | 9 (100.0%) | 0 (0.0%) |
| Information | 0 (0.0%) | 0 (0.0%) |
| Finance & Insurance | 0 (0.0%) | 30 (100.0%) |
| Real Estate, Rental & Leasing | 24 (100.0%) | 0 (0.0%) |
| Professional & Scientific | 92 (56.4%) | 71 (43.6%) |
| Enterprise Management | 0 (0.0%) | 0 (0.0%) |
| Administrative & Support | 0 (0.0%) | 0 (0.0%) |
| Educational Services | 23 (25.8%) | 66 (74.2%) |
| Health Care & Social Assistance | 0 (0.0%) | 82 (100.0%) |
| Arts, Entertainment & Recreation | 25 (100.0%) | 0 (0.0%) |
| Accommodation & Food Services | 11 (21.1%) | 41 (78.8%) |
| Public Administration | 55 (45.8%) | 65 (54.2%) |
| Total | 582 (51.0%) | 558 (48.9%) |
Education in Canterwood
School Enrollment in Canterwood
The most common levels of schooling among the 581 students in Canterwood are high school (185 | 31.8%), elementary school (164 | 28.2%), and kindergarten (94 | 16.2%).
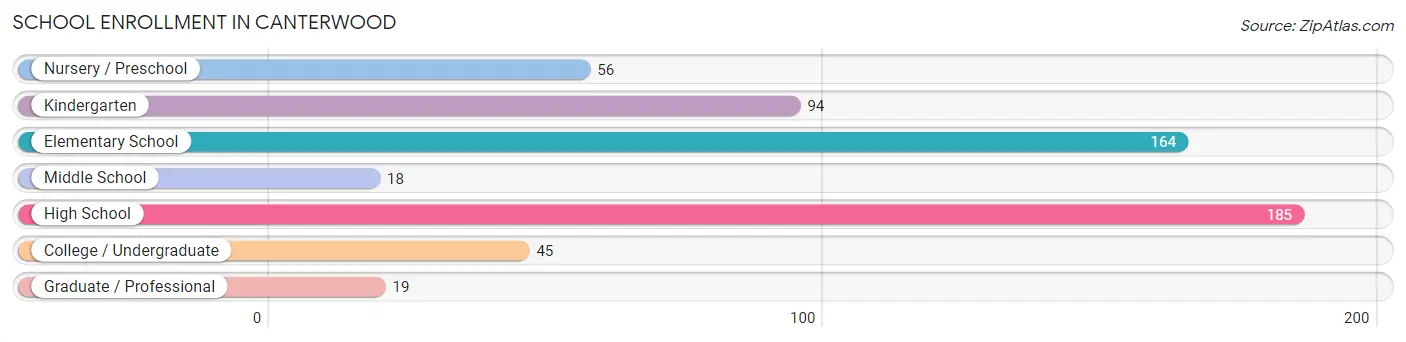
| School Level | # Students | % Students |
| Nursery / Preschool | 56 | 9.6% |
| Kindergarten | 94 | 16.2% |
| Elementary School | 164 | 28.2% |
| Middle School | 18 | 3.1% |
| High School | 185 | 31.8% |
| College / Undergraduate | 45 | 7.7% |
| Graduate / Professional | 19 | 3.3% |
| Total | 581 | 100.0% |
School Enrollment by Age by Funding Source in Canterwood
Out of a total of 581 students who are enrolled in schools in Canterwood, 143 (24.6%) attend a private institution, while the remaining 438 (75.4%) are enrolled in public schools. The age group of 3 to 4 year olds has the highest likelihood of being enrolled in private schools, with 19 (100.0% in the age bracket) enrolled. Conversely, the age group of 10 to 14 year olds has the lowest likelihood of being enrolled in a private school, with 93 (100.0% in the age bracket) attending a public institution.
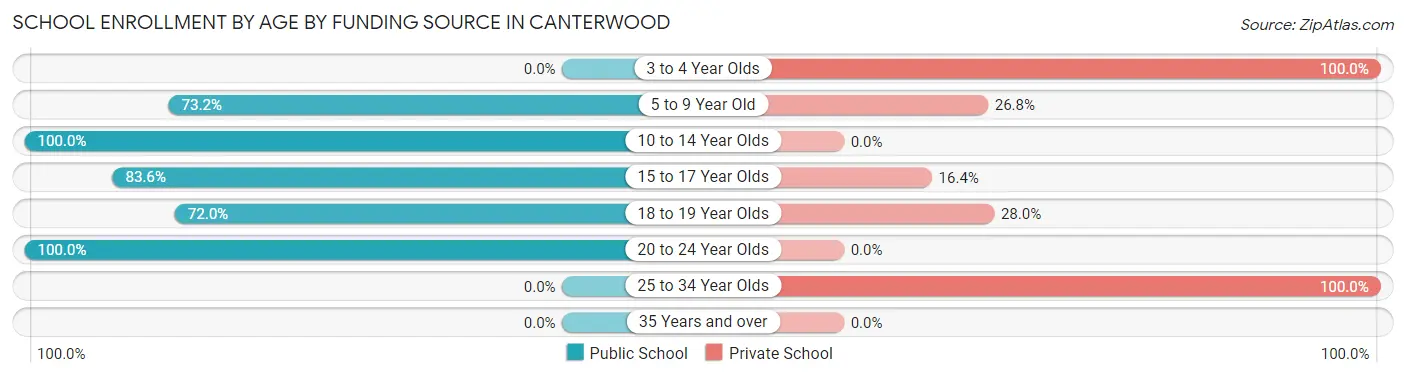
| Age Bracket | Public School | Private School |
| 3 to 4 Year Olds | 0 (0.0%) | 19 (100.0%) |
| 5 to 9 Year Old | 199 (73.2%) | 73 (26.8%) |
| 10 to 14 Year Olds | 93 (100.0%) | 0 (0.0%) |
| 15 to 17 Year Olds | 51 (83.6%) | 10 (16.4%) |
| 18 to 19 Year Olds | 72 (72.0%) | 28 (28.0%) |
| 20 to 24 Year Olds | 23 (100.0%) | 0 (0.0%) |
| 25 to 34 Year Olds | 0 (0.0%) | 13 (100.0%) |
| 35 Years and over | 0 (0.0%) | 0 (0.0%) |
| Total | 438 (75.4%) | 143 (24.6%) |
Educational Attainment by Field of Study in Canterwood
Business (303 | 24.4%), social sciences (181 | 14.5%), bio, nature & agricultural (157 | 12.6%), arts & humanities (92 | 7.4%), and engineering (86 | 6.9%) are the most common fields of study among 1,244 individuals in Canterwood who have obtained a bachelor's degree or higher.
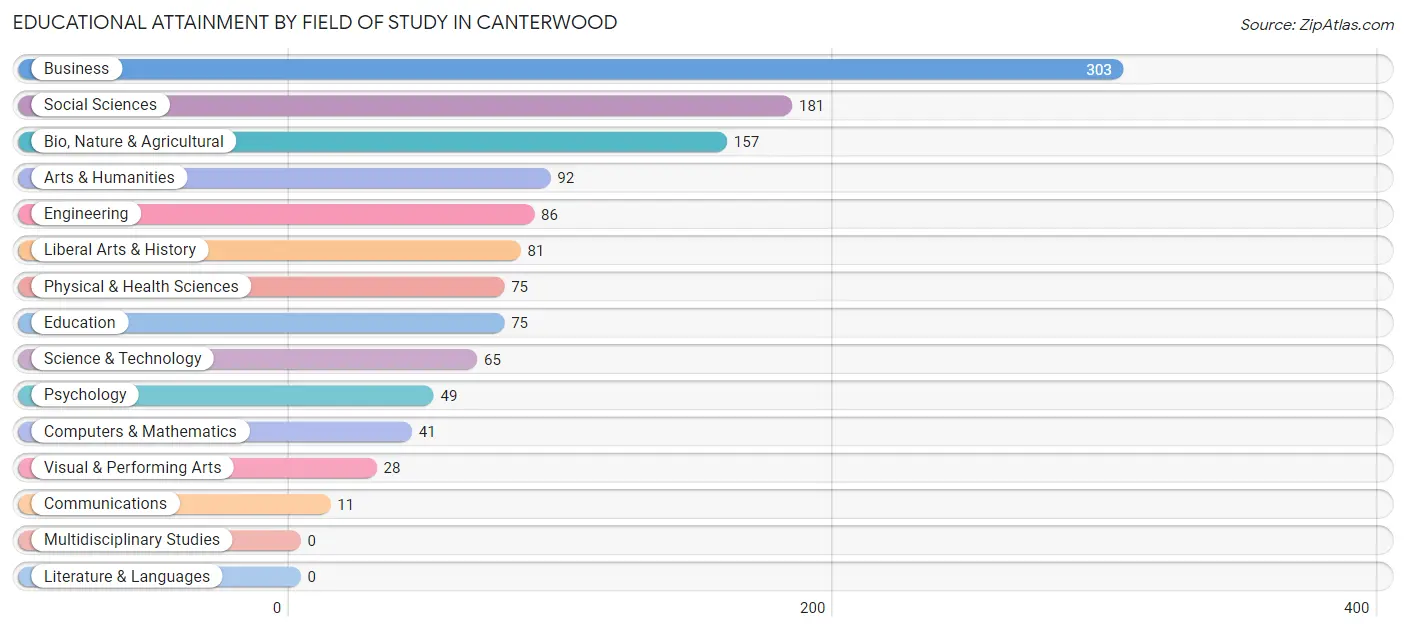
| Field of Study | # Graduates | % Graduates |
| Computers & Mathematics | 41 | 3.3% |
| Bio, Nature & Agricultural | 157 | 12.6% |
| Physical & Health Sciences | 75 | 6.0% |
| Psychology | 49 | 3.9% |
| Social Sciences | 181 | 14.5% |
| Engineering | 86 | 6.9% |
| Multidisciplinary Studies | 0 | 0.0% |
| Science & Technology | 65 | 5.2% |
| Business | 303 | 24.4% |
| Education | 75 | 6.0% |
| Literature & Languages | 0 | 0.0% |
| Liberal Arts & History | 81 | 6.5% |
| Visual & Performing Arts | 28 | 2.2% |
| Communications | 11 | 0.9% |
| Arts & Humanities | 92 | 7.4% |
| Total | 1,244 | 100.0% |
Transportation & Commute in Canterwood
Vehicle Availability by Sex in Canterwood
The most prevalent vehicle ownership categories in Canterwood are males with 2 vehicles (308, accounting for 50.1%) and females with 2 vehicles (136, making up 67.8%).
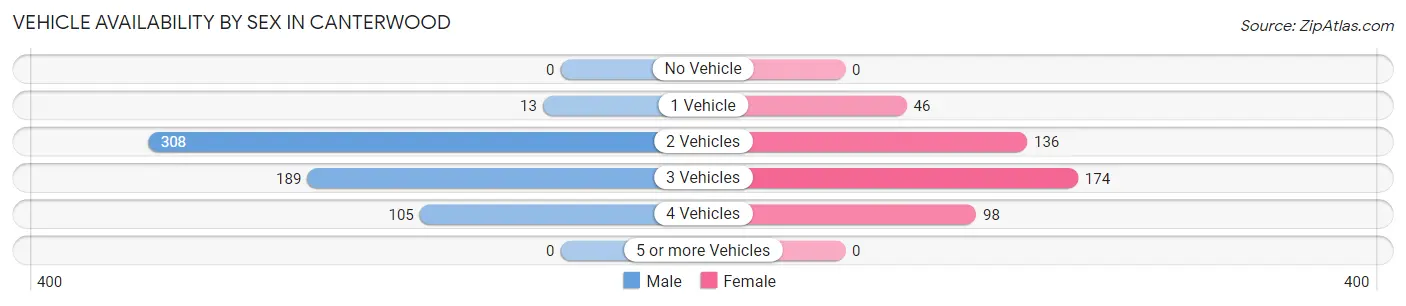
| Vehicles Available | Male | Female |
| No Vehicle | 0 (0.0%) | 0 (0.0%) |
| 1 Vehicle | 13 (2.1%) | 46 (10.1%) |
| 2 Vehicles | 308 (50.1%) | 136 (30.0%) |
| 3 Vehicles | 189 (30.7%) | 174 (38.3%) |
| 4 Vehicles | 105 (17.1%) | 98 (21.6%) |
| 5 or more Vehicles | 0 (0.0%) | 0 (0.0%) |
| Total | 615 (100.0%) | 454 (100.0%) |
Commute Time in Canterwood
The most frequently occuring commute durations in Canterwood are 20 to 24 minutes (156 commuters, 17.6%), 60 to 89 minutes (123 commuters, 13.9%), and 45 to 59 minutes (111 commuters, 12.5%).
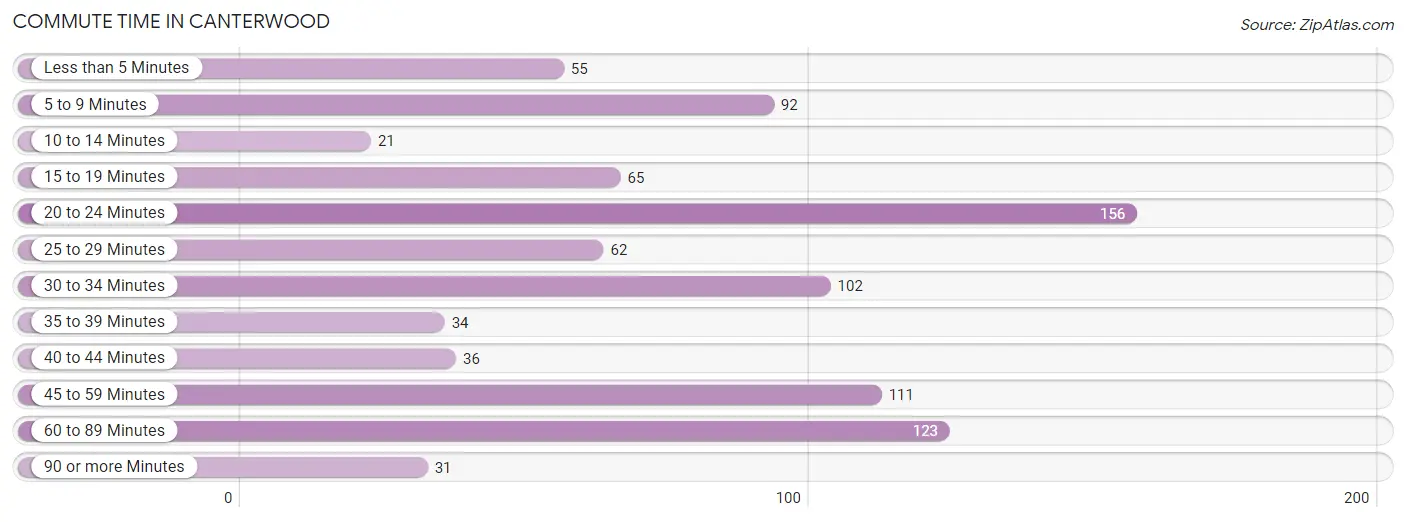
| Commute Time | # Commuters | % Commuters |
| Less than 5 Minutes | 55 | 6.2% |
| 5 to 9 Minutes | 92 | 10.4% |
| 10 to 14 Minutes | 21 | 2.4% |
| 15 to 19 Minutes | 65 | 7.3% |
| 20 to 24 Minutes | 156 | 17.6% |
| 25 to 29 Minutes | 62 | 7.0% |
| 30 to 34 Minutes | 102 | 11.5% |
| 35 to 39 Minutes | 34 | 3.8% |
| 40 to 44 Minutes | 36 | 4.1% |
| 45 to 59 Minutes | 111 | 12.5% |
| 60 to 89 Minutes | 123 | 13.9% |
| 90 or more Minutes | 31 | 3.5% |
Commute Time by Sex in Canterwood
The most common commute times in Canterwood are 45 to 59 minutes (99 commuters, 19.3%) for males and 20 to 24 minutes (83 commuters, 22.1%) for females.
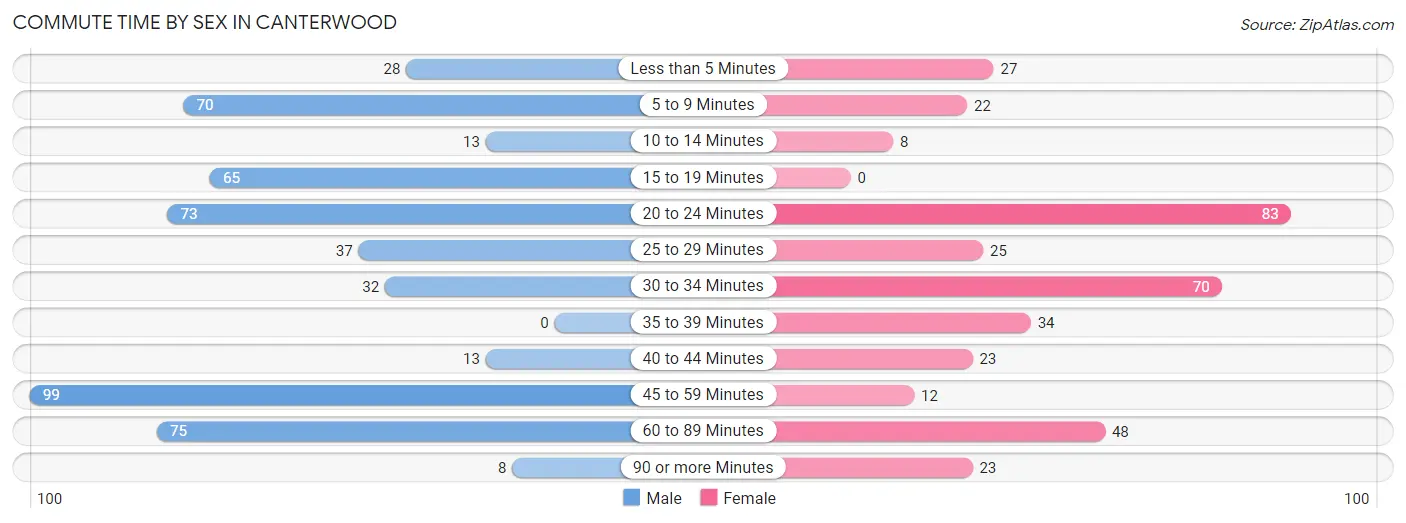
| Commute Time | Male | Female |
| Less than 5 Minutes | 28 (5.5%) | 27 (7.2%) |
| 5 to 9 Minutes | 70 (13.7%) | 22 (5.9%) |
| 10 to 14 Minutes | 13 (2.5%) | 8 (2.1%) |
| 15 to 19 Minutes | 65 (12.7%) | 0 (0.0%) |
| 20 to 24 Minutes | 73 (14.2%) | 83 (22.1%) |
| 25 to 29 Minutes | 37 (7.2%) | 25 (6.7%) |
| 30 to 34 Minutes | 32 (6.2%) | 70 (18.7%) |
| 35 to 39 Minutes | 0 (0.0%) | 34 (9.1%) |
| 40 to 44 Minutes | 13 (2.5%) | 23 (6.1%) |
| 45 to 59 Minutes | 99 (19.3%) | 12 (3.2%) |
| 60 to 89 Minutes | 75 (14.6%) | 48 (12.8%) |
| 90 or more Minutes | 8 (1.6%) | 23 (6.1%) |
Time of Departure to Work by Sex in Canterwood
The most frequent times of departure to work in Canterwood are 6:00 AM to 6:29 AM (100, 19.5%) for males and 7:30 AM to 7:59 AM (77, 20.5%) for females.
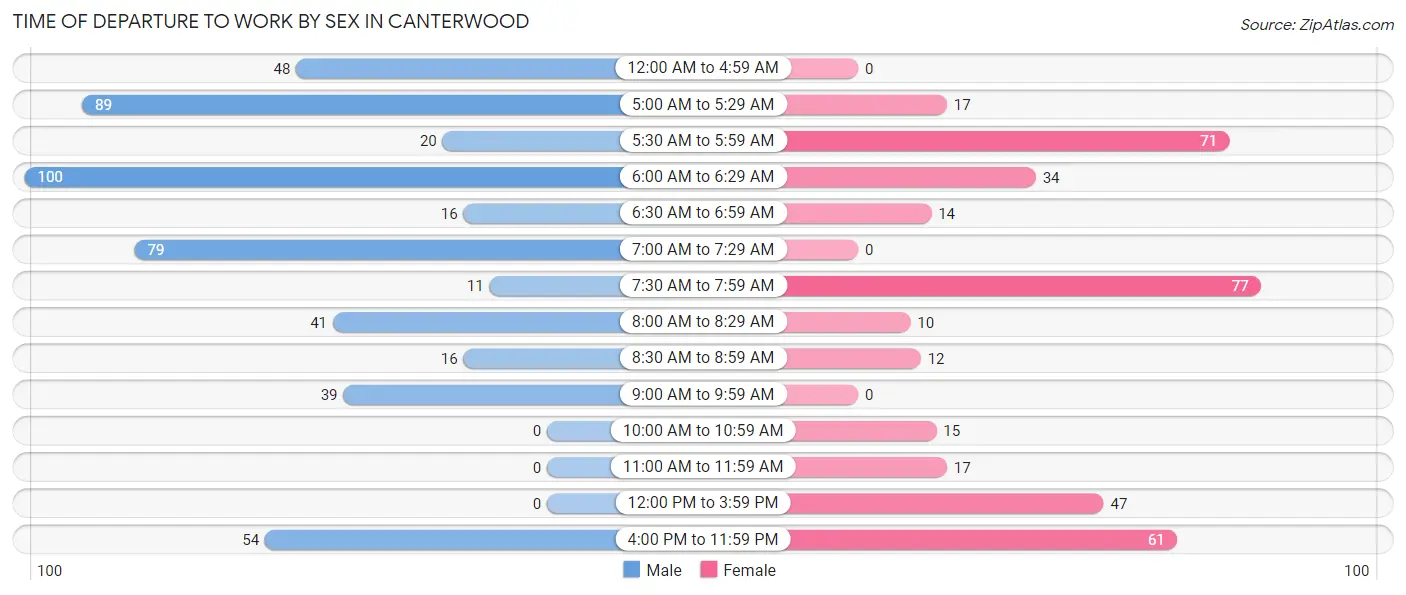
| Time of Departure | Male | Female |
| 12:00 AM to 4:59 AM | 48 (9.4%) | 0 (0.0%) |
| 5:00 AM to 5:29 AM | 89 (17.3%) | 17 (4.5%) |
| 5:30 AM to 5:59 AM | 20 (3.9%) | 71 (18.9%) |
| 6:00 AM to 6:29 AM | 100 (19.5%) | 34 (9.1%) |
| 6:30 AM to 6:59 AM | 16 (3.1%) | 14 (3.7%) |
| 7:00 AM to 7:29 AM | 79 (15.4%) | 0 (0.0%) |
| 7:30 AM to 7:59 AM | 11 (2.1%) | 77 (20.5%) |
| 8:00 AM to 8:29 AM | 41 (8.0%) | 10 (2.7%) |
| 8:30 AM to 8:59 AM | 16 (3.1%) | 12 (3.2%) |
| 9:00 AM to 9:59 AM | 39 (7.6%) | 0 (0.0%) |
| 10:00 AM to 10:59 AM | 0 (0.0%) | 15 (4.0%) |
| 11:00 AM to 11:59 AM | 0 (0.0%) | 17 (4.5%) |
| 12:00 PM to 3:59 PM | 0 (0.0%) | 47 (12.5%) |
| 4:00 PM to 11:59 PM | 54 (10.5%) | 61 (16.3%) |
| Total | 513 (100.0%) | 375 (100.0%) |
Housing Occupancy in Canterwood
Occupancy by Ownership in Canterwood
Of the total 1,150 dwellings in Canterwood, owner-occupied units account for 1,107 (96.3%), while renter-occupied units make up 43 (3.7%).
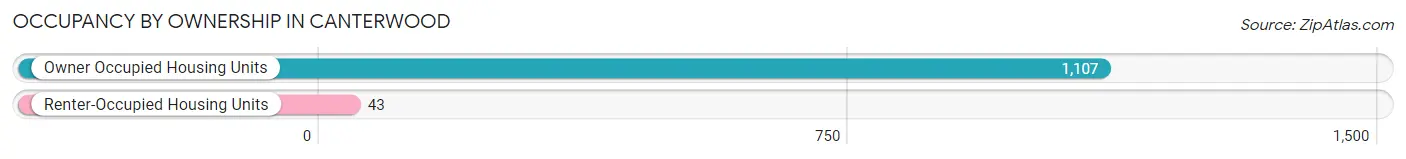
| Occupancy | # Housing Units | % Housing Units |
| Owner Occupied Housing Units | 1,107 | 96.3% |
| Renter-Occupied Housing Units | 43 | 3.7% |
| Total Occupied Housing Units | 1,150 | 100.0% |
Occupancy by Household Size in Canterwood
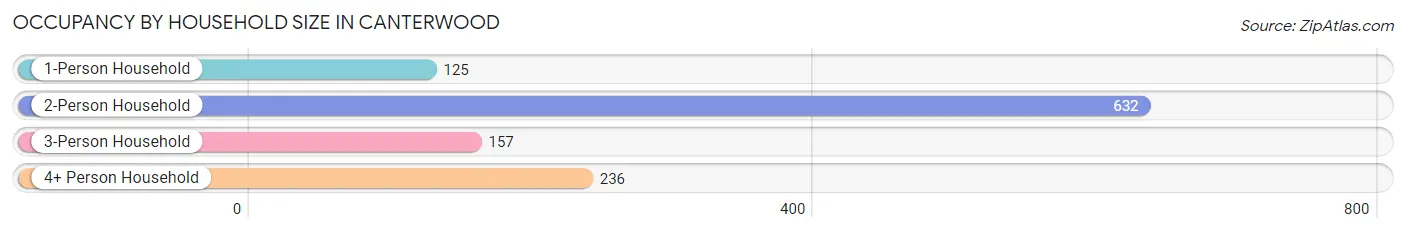
| Household Size | # Housing Units | % Housing Units |
| 1-Person Household | 125 | 10.9% |
| 2-Person Household | 632 | 55.0% |
| 3-Person Household | 157 | 13.7% |
| 4+ Person Household | 236 | 20.5% |
| Total Housing Units | 1,150 | 100.0% |
Occupancy by Ownership by Household Size in Canterwood
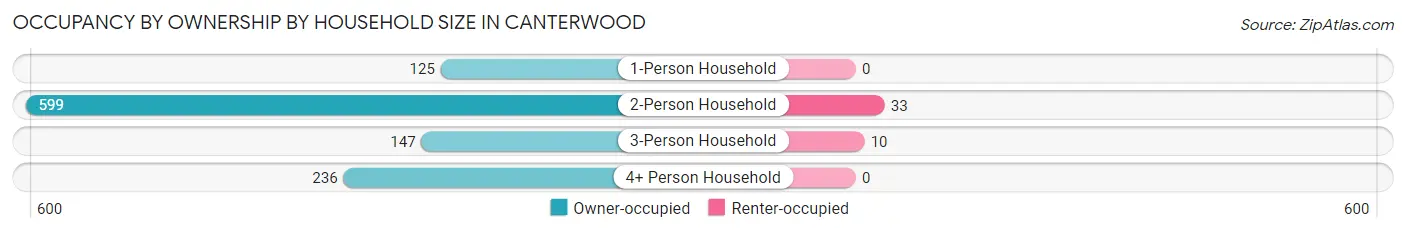
| Household Size | Owner-occupied | Renter-occupied |
| 1-Person Household | 125 (100.0%) | 0 (0.0%) |
| 2-Person Household | 599 (94.8%) | 33 (5.2%) |
| 3-Person Household | 147 (93.6%) | 10 (6.4%) |
| 4+ Person Household | 236 (100.0%) | 0 (0.0%) |
| Total Housing Units | 1,107 (96.3%) | 43 (3.7%) |
Occupancy by Educational Attainment in Canterwood
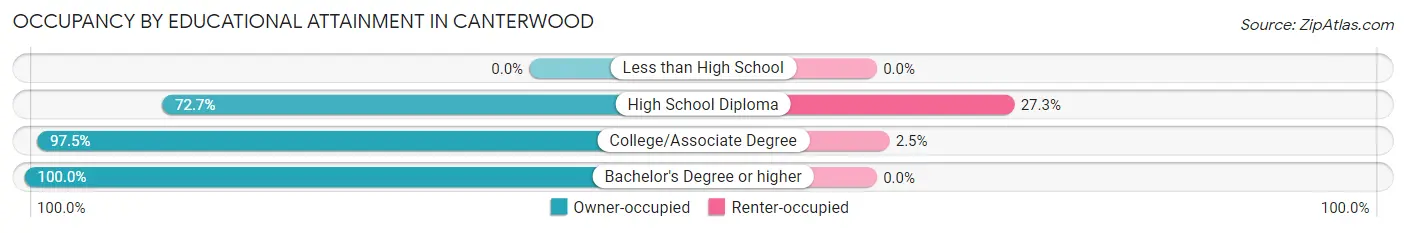
| Household Size | Owner-occupied | Renter-occupied |
| Less than High School | 0 (0.0%) | 0 (0.0%) |
| High School Diploma | 88 (72.7%) | 33 (27.3%) |
| College/Associate Degree | 390 (97.5%) | 10 (2.5%) |
| Bachelor's Degree or higher | 629 (100.0%) | 0 (0.0%) |
Occupancy by Age of Householder in Canterwood

| Age Bracket | # Households | % Households |
| Under 35 Years | 40 | 3.5% |
| 35 to 44 Years | 171 | 14.9% |
| 45 to 54 Years | 177 | 15.4% |
| 55 to 64 Years | 315 | 27.4% |
| 65 to 74 Years | 230 | 20.0% |
| 75 to 84 Years | 125 | 10.9% |
| 85 Years and Over | 92 | 8.0% |
| Total | 1,150 | 100.0% |
Housing Finances in Canterwood
Median Income by Occupancy in Canterwood
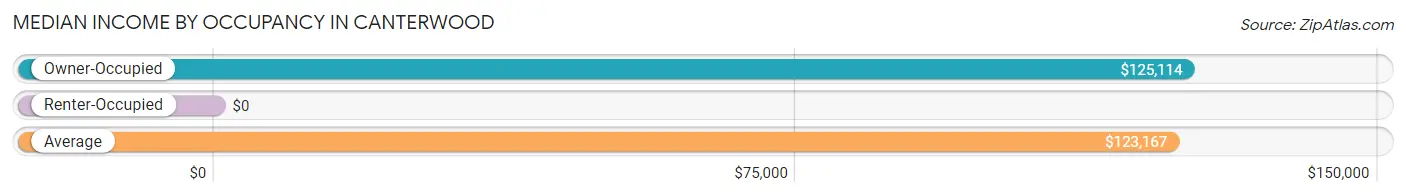
| Occupancy Type | # Households | Median Income |
| Owner-Occupied | 1,107 (96.3%) | $125,114 |
| Renter-Occupied | 43 (3.7%) | $0 |
| Average | 1,150 (100.0%) | $123,167 |
Occupancy by Householder Income Bracket in Canterwood
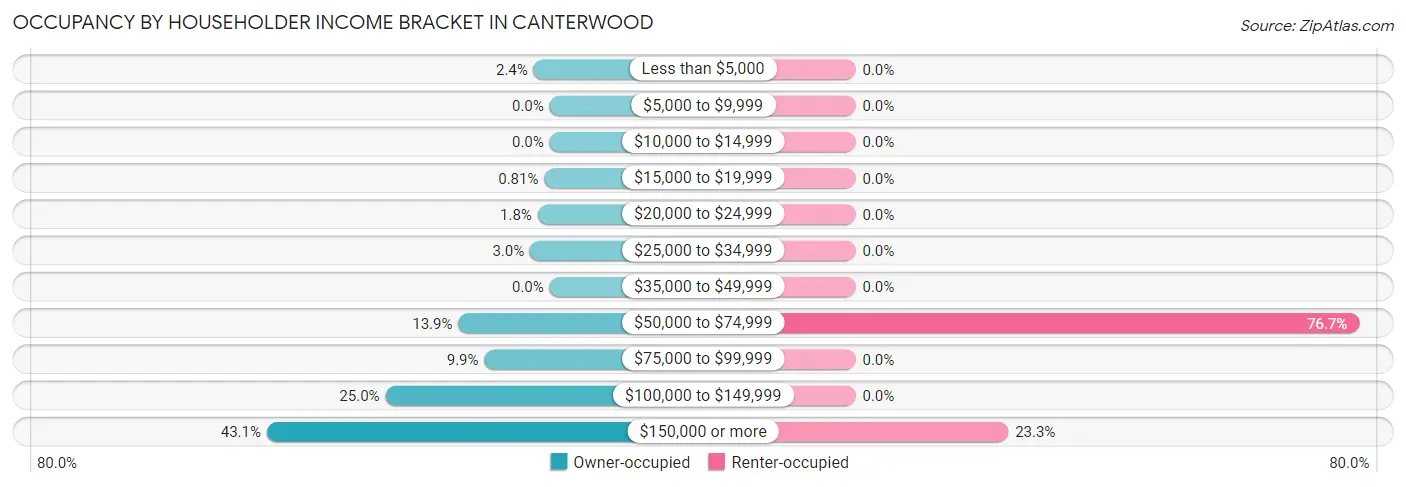
| Income Bracket | Owner-occupied | Renter-occupied |
| Less than $5,000 | 27 (2.4%) | 0 (0.0%) |
| $5,000 to $9,999 | 0 (0.0%) | 0 (0.0%) |
| $10,000 to $14,999 | 0 (0.0%) | 0 (0.0%) |
| $15,000 to $19,999 | 9 (0.8%) | 0 (0.0%) |
| $20,000 to $24,999 | 20 (1.8%) | 0 (0.0%) |
| $25,000 to $34,999 | 33 (3.0%) | 0 (0.0%) |
| $35,000 to $49,999 | 0 (0.0%) | 0 (0.0%) |
| $50,000 to $74,999 | 154 (13.9%) | 33 (76.7%) |
| $75,000 to $99,999 | 110 (9.9%) | 0 (0.0%) |
| $100,000 to $149,999 | 277 (25.0%) | 0 (0.0%) |
| $150,000 or more | 477 (43.1%) | 10 (23.3%) |
| Total | 1,107 (100.0%) | 43 (100.0%) |
Monthly Housing Cost Tiers in Canterwood
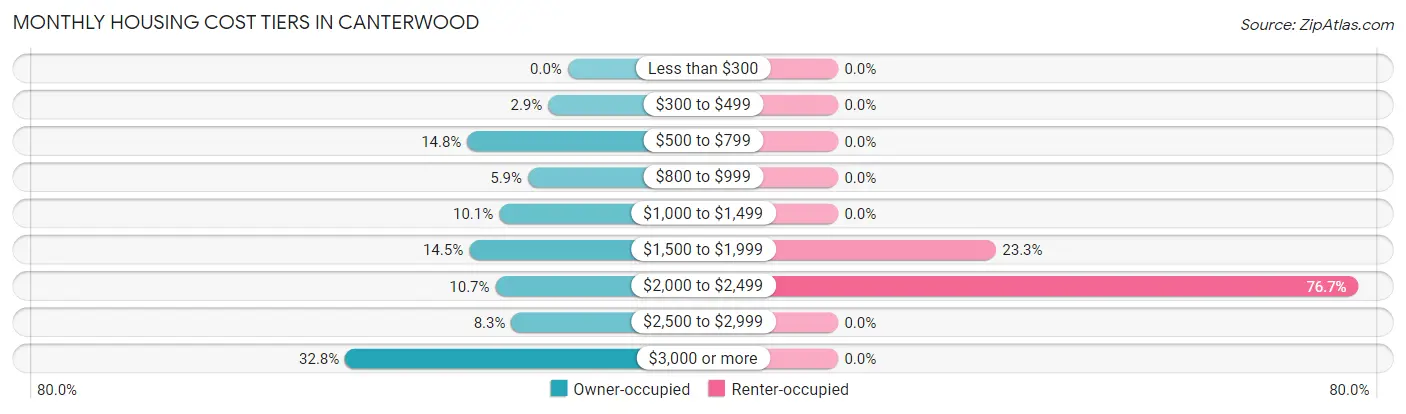
| Monthly Cost | Owner-occupied | Renter-occupied |
| Less than $300 | 0 (0.0%) | 0 (0.0%) |
| $300 to $499 | 32 (2.9%) | 0 (0.0%) |
| $500 to $799 | 164 (14.8%) | 0 (0.0%) |
| $800 to $999 | 65 (5.9%) | 0 (0.0%) |
| $1,000 to $1,499 | 112 (10.1%) | 0 (0.0%) |
| $1,500 to $1,999 | 161 (14.5%) | 10 (23.3%) |
| $2,000 to $2,499 | 118 (10.7%) | 33 (76.7%) |
| $2,500 to $2,999 | 92 (8.3%) | 0 (0.0%) |
| $3,000 or more | 363 (32.8%) | 0 (0.0%) |
| Total | 1,107 (100.0%) | 43 (100.0%) |
Physical Housing Characteristics in Canterwood
Housing Structures in Canterwood
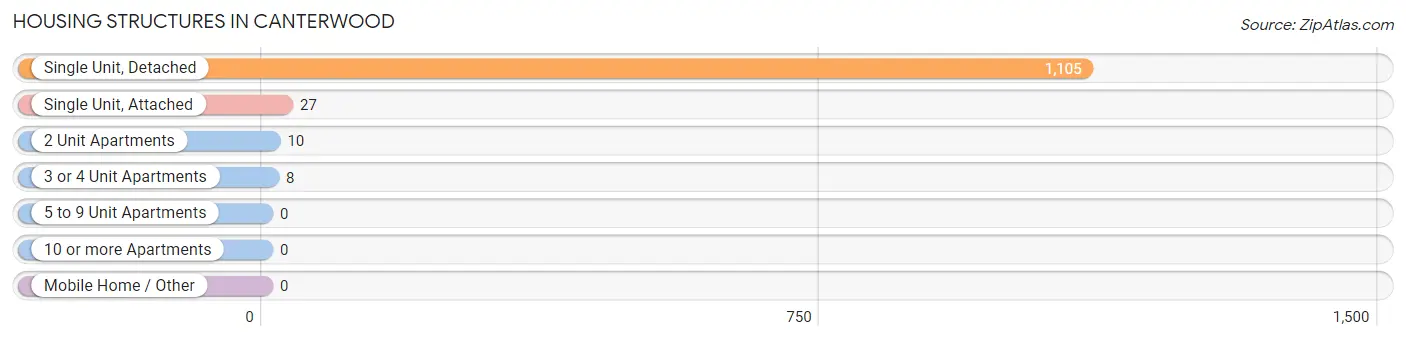
| Structure Type | # Housing Units | % Housing Units |
| Single Unit, Detached | 1,105 | 96.1% |
| Single Unit, Attached | 27 | 2.4% |
| 2 Unit Apartments | 10 | 0.9% |
| 3 or 4 Unit Apartments | 8 | 0.7% |
| 5 to 9 Unit Apartments | 0 | 0.0% |
| 10 or more Apartments | 0 | 0.0% |
| Mobile Home / Other | 0 | 0.0% |
| Total | 1,150 | 100.0% |
Housing Structures by Occupancy in Canterwood
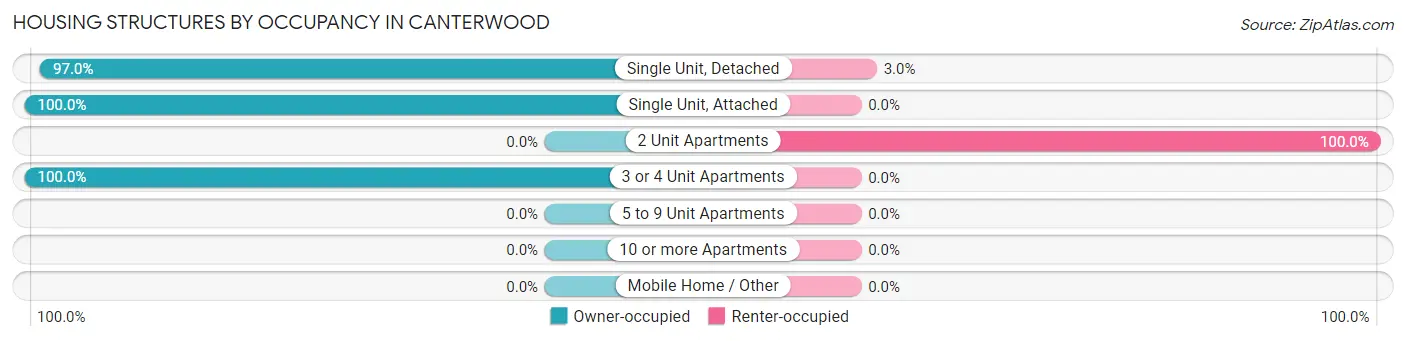
| Structure Type | Owner-occupied | Renter-occupied |
| Single Unit, Detached | 1,072 (97.0%) | 33 (3.0%) |
| Single Unit, Attached | 27 (100.0%) | 0 (0.0%) |
| 2 Unit Apartments | 0 (0.0%) | 10 (100.0%) |
| 3 or 4 Unit Apartments | 8 (100.0%) | 0 (0.0%) |
| 5 to 9 Unit Apartments | 0 (0.0%) | 0 (0.0%) |
| 10 or more Apartments | 0 (0.0%) | 0 (0.0%) |
| Mobile Home / Other | 0 (0.0%) | 0 (0.0%) |
| Total | 1,107 (96.3%) | 43 (3.7%) |
Housing Structures by Number of Rooms in Canterwood
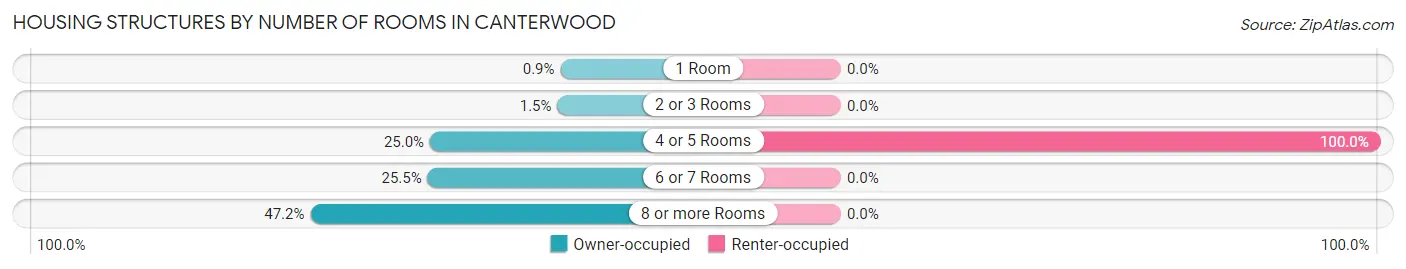
| Number of Rooms | Owner-occupied | Renter-occupied |
| 1 Room | 10 (0.9%) | 0 (0.0%) |
| 2 or 3 Rooms | 16 (1.5%) | 0 (0.0%) |
| 4 or 5 Rooms | 277 (25.0%) | 43 (100.0%) |
| 6 or 7 Rooms | 282 (25.5%) | 0 (0.0%) |
| 8 or more Rooms | 522 (47.1%) | 0 (0.0%) |
| Total | 1,107 (100.0%) | 43 (100.0%) |
Housing Structure by Heating Type in Canterwood
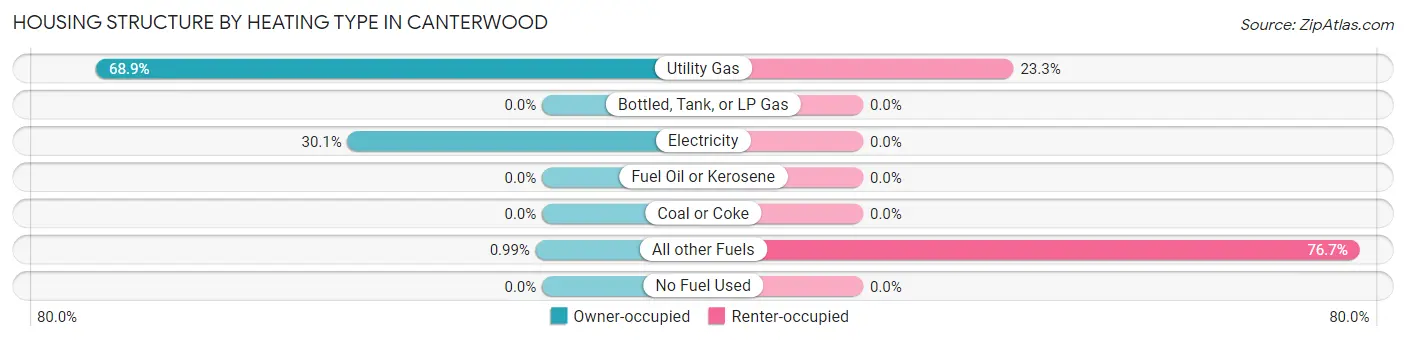
| Heating Type | Owner-occupied | Renter-occupied |
| Utility Gas | 763 (68.9%) | 10 (23.3%) |
| Bottled, Tank, or LP Gas | 0 (0.0%) | 0 (0.0%) |
| Electricity | 333 (30.1%) | 0 (0.0%) |
| Fuel Oil or Kerosene | 0 (0.0%) | 0 (0.0%) |
| Coal or Coke | 0 (0.0%) | 0 (0.0%) |
| All other Fuels | 11 (1.0%) | 33 (76.7%) |
| No Fuel Used | 0 (0.0%) | 0 (0.0%) |
| Total | 1,107 (100.0%) | 43 (100.0%) |
Household Vehicle Usage in Canterwood
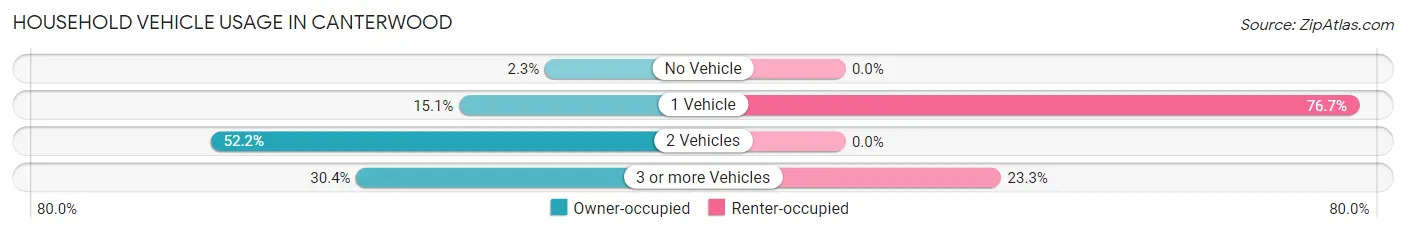
| Vehicles per Household | Owner-occupied | Renter-occupied |
| No Vehicle | 25 (2.3%) | 0 (0.0%) |
| 1 Vehicle | 167 (15.1%) | 33 (76.7%) |
| 2 Vehicles | 578 (52.2%) | 0 (0.0%) |
| 3 or more Vehicles | 337 (30.4%) | 10 (23.3%) |
| Total | 1,107 (100.0%) | 43 (100.0%) |
Real Estate & Mortgages in Canterwood
Real Estate and Mortgage Overview in Canterwood
| Characteristic | Without Mortgage | With Mortgage |
| Housing Units | 393 | 714 |
| Median Property Value | $816,300 | $706,700 |
| Median Household Income | $109,388 | $341 |
| Monthly Housing Costs | $1,074 | $363 |
| Real Estate Taxes | $8,192 | $13 |
Property Value by Mortgage Status in Canterwood
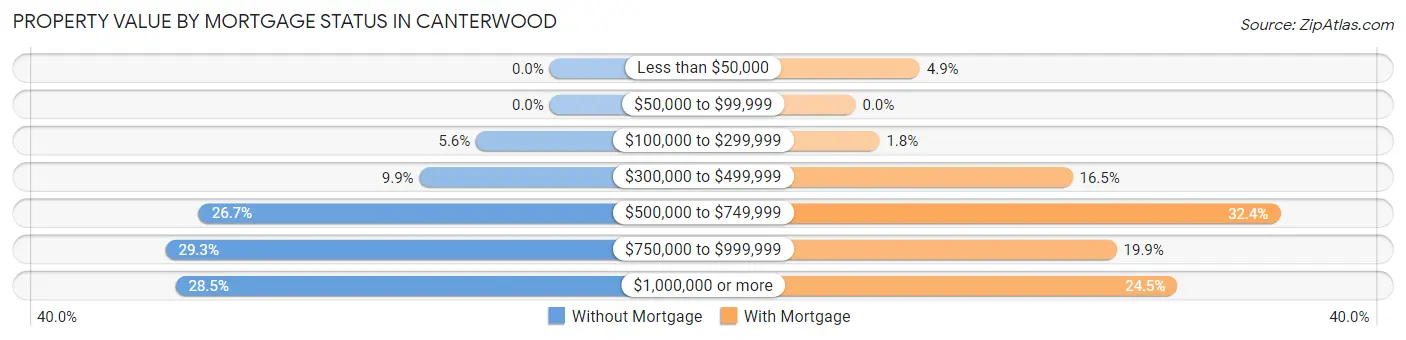
| Property Value | Without Mortgage | With Mortgage |
| Less than $50,000 | 0 (0.0%) | 35 (4.9%) |
| $50,000 to $99,999 | 0 (0.0%) | 0 (0.0%) |
| $100,000 to $299,999 | 22 (5.6%) | 13 (1.8%) |
| $300,000 to $499,999 | 39 (9.9%) | 118 (16.5%) |
| $500,000 to $749,999 | 105 (26.7%) | 231 (32.4%) |
| $750,000 to $999,999 | 115 (29.3%) | 142 (19.9%) |
| $1,000,000 or more | 112 (28.5%) | 175 (24.5%) |
| Total | 393 (100.0%) | 714 (100.0%) |
Household Income by Mortgage Status in Canterwood
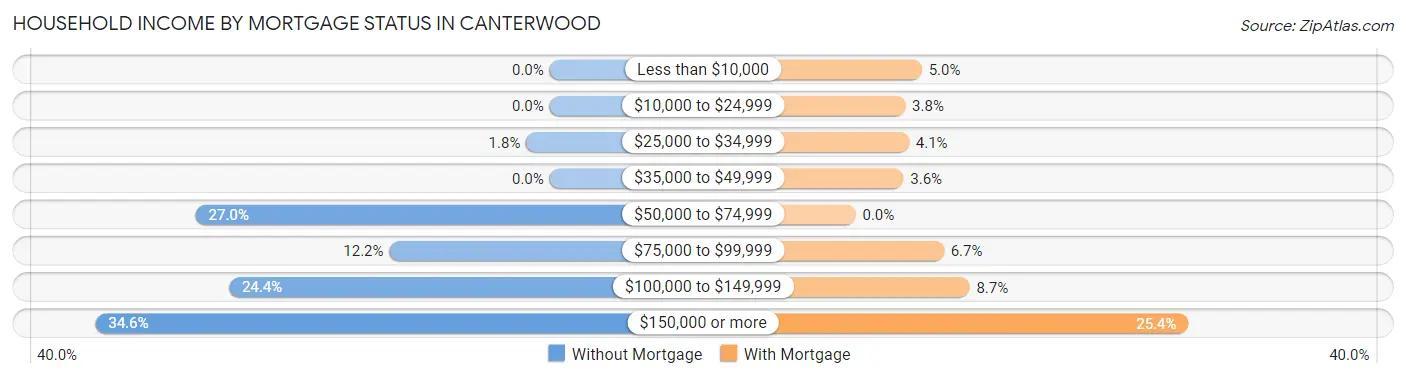
| Household Income | Without Mortgage | With Mortgage |
| Less than $10,000 | 0 (0.0%) | 36 (5.0%) |
| $10,000 to $24,999 | 0 (0.0%) | 27 (3.8%) |
| $25,000 to $34,999 | 7 (1.8%) | 29 (4.1%) |
| $35,000 to $49,999 | 0 (0.0%) | 26 (3.6%) |
| $50,000 to $74,999 | 106 (27.0%) | 0 (0.0%) |
| $75,000 to $99,999 | 48 (12.2%) | 48 (6.7%) |
| $100,000 to $149,999 | 96 (24.4%) | 62 (8.7%) |
| $150,000 or more | 136 (34.6%) | 181 (25.4%) |
| Total | 393 (100.0%) | 714 (100.0%) |
Property Value to Household Income Ratio in Canterwood
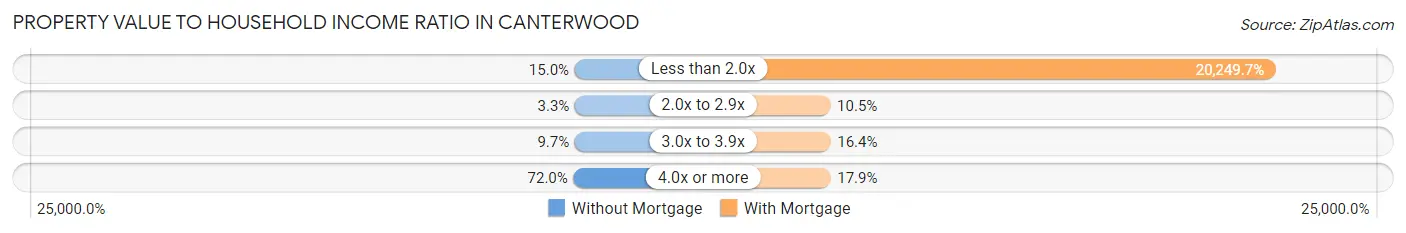
| Value-to-Income Ratio | Without Mortgage | With Mortgage |
| Less than 2.0x | 59 (15.0%) | 144,583 (20,249.7%) |
| 2.0x to 2.9x | 13 (3.3%) | 75 (10.5%) |
| 3.0x to 3.9x | 38 (9.7%) | 117 (16.4%) |
| 4.0x or more | 283 (72.0%) | 128 (17.9%) |
| Total | 393 (100.0%) | 714 (100.0%) |
Real Estate Taxes by Mortgage Status in Canterwood
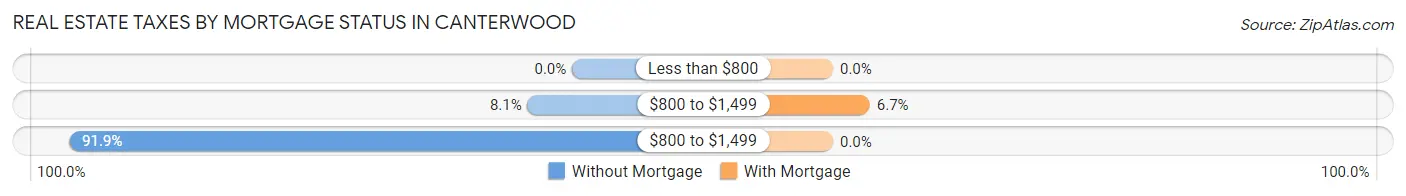
| Property Taxes | Without Mortgage | With Mortgage |
| Less than $800 | 0 (0.0%) | 0 (0.0%) |
| $800 to $1,499 | 32 (8.1%) | 48 (6.7%) |
| $800 to $1,499 | 361 (91.9%) | 0 (0.0%) |
| Total | 393 (100.0%) | 714 (100.0%) |
Health & Disability in Canterwood
Health Insurance Coverage by Age in Canterwood
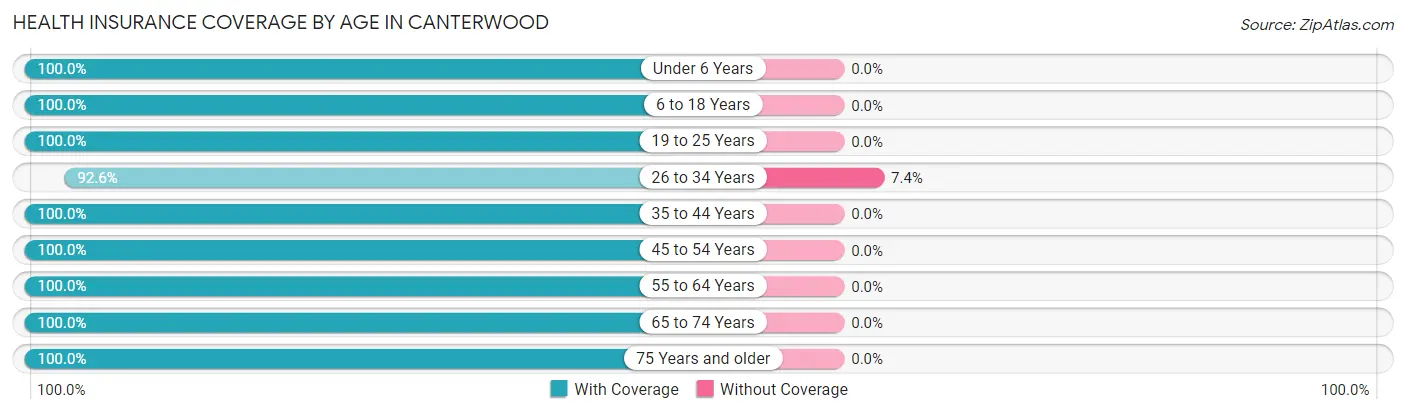
| Age Bracket | With Coverage | Without Coverage |
| Under 6 Years | 217 (100.0%) | 0 (0.0%) |
| 6 to 18 Years | 461 (100.0%) | 0 (0.0%) |
| 19 to 25 Years | 59 (100.0%) | 0 (0.0%) |
| 26 to 34 Years | 162 (92.6%) | 13 (7.4%) |
| 35 to 44 Years | 256 (100.0%) | 0 (0.0%) |
| 45 to 54 Years | 334 (100.0%) | 0 (0.0%) |
| 55 to 64 Years | 660 (100.0%) | 0 (0.0%) |
| 65 to 74 Years | 411 (100.0%) | 0 (0.0%) |
| 75 Years and older | 356 (100.0%) | 0 (0.0%) |
| Total | 2,916 (99.6%) | 13 (0.4%) |
Health Insurance Coverage by Citizenship Status in Canterwood
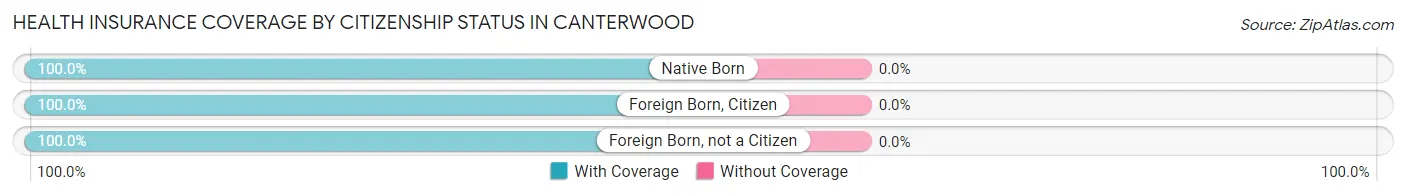
| Citizenship Status | With Coverage | Without Coverage |
| Native Born | 217 (100.0%) | 0 (0.0%) |
| Foreign Born, Citizen | 461 (100.0%) | 0 (0.0%) |
| Foreign Born, not a Citizen | 59 (100.0%) | 0 (0.0%) |
Health Insurance Coverage by Household Income in Canterwood
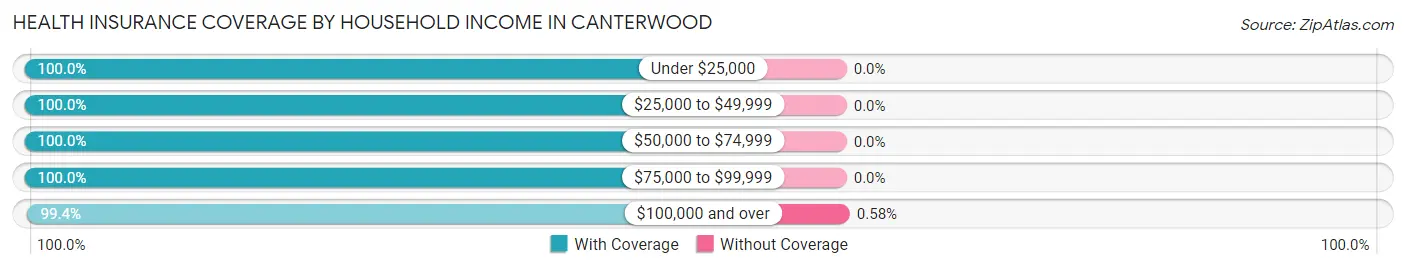
| Household Income | With Coverage | Without Coverage |
| Under $25,000 | 90 (100.0%) | 0 (0.0%) |
| $25,000 to $49,999 | 44 (100.0%) | 0 (0.0%) |
| $50,000 to $74,999 | 360 (100.0%) | 0 (0.0%) |
| $75,000 to $99,999 | 181 (100.0%) | 0 (0.0%) |
| $100,000 and over | 2,241 (99.4%) | 13 (0.6%) |
Public vs Private Health Insurance Coverage by Age in Canterwood
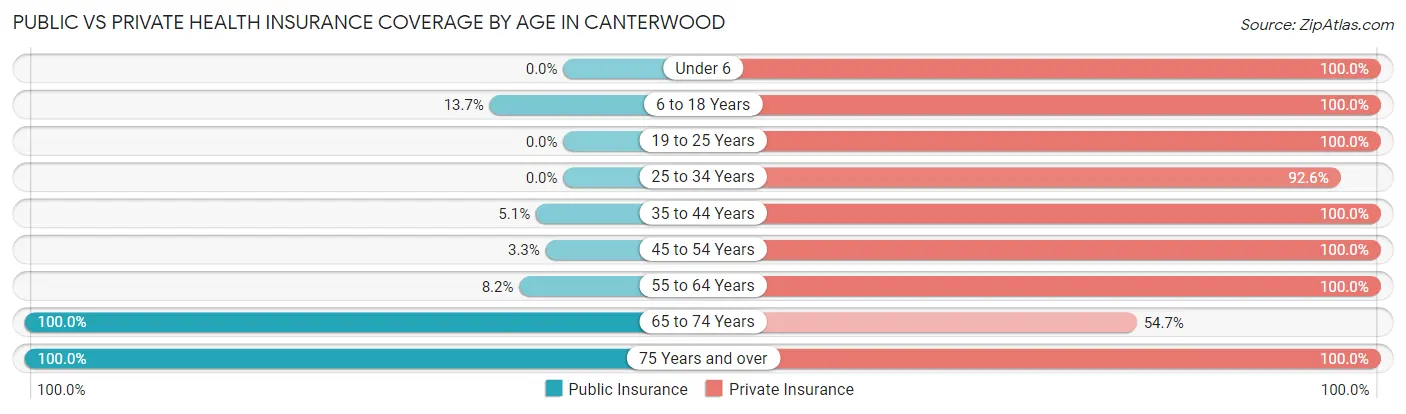
| Age Bracket | Public Insurance | Private Insurance |
| Under 6 | 0 (0.0%) | 217 (100.0%) |
| 6 to 18 Years | 63 (13.7%) | 461 (100.0%) |
| 19 to 25 Years | 0 (0.0%) | 59 (100.0%) |
| 25 to 34 Years | 0 (0.0%) | 162 (92.6%) |
| 35 to 44 Years | 13 (5.1%) | 256 (100.0%) |
| 45 to 54 Years | 11 (3.3%) | 334 (100.0%) |
| 55 to 64 Years | 54 (8.2%) | 660 (100.0%) |
| 65 to 74 Years | 411 (100.0%) | 225 (54.7%) |
| 75 Years and over | 356 (100.0%) | 356 (100.0%) |
| Total | 908 (31.0%) | 2,730 (93.2%) |
Disability Status by Sex by Age in Canterwood
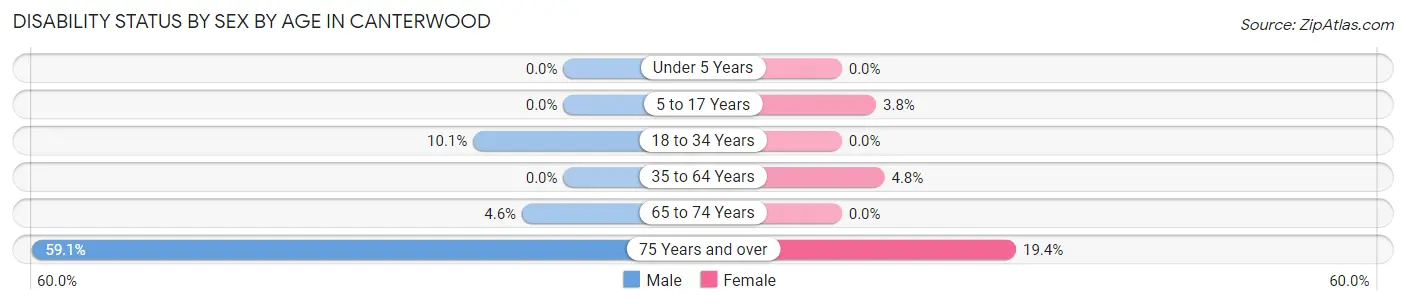
| Age Bracket | Male | Female |
| Under 5 Years | 0 (0.0%) | 0 (0.0%) |
| 5 to 17 Years | 0 (0.0%) | 12 (3.8%) |
| 18 to 34 Years | 19 (10.1%) | 0 (0.0%) |
| 35 to 64 Years | 0 (0.0%) | 34 (4.8%) |
| 65 to 74 Years | 10 (4.6%) | 0 (0.0%) |
| 75 Years and over | 110 (59.1%) | 33 (19.4%) |
Disability Class by Sex by Age in Canterwood
Disability Class: Hearing Difficulty
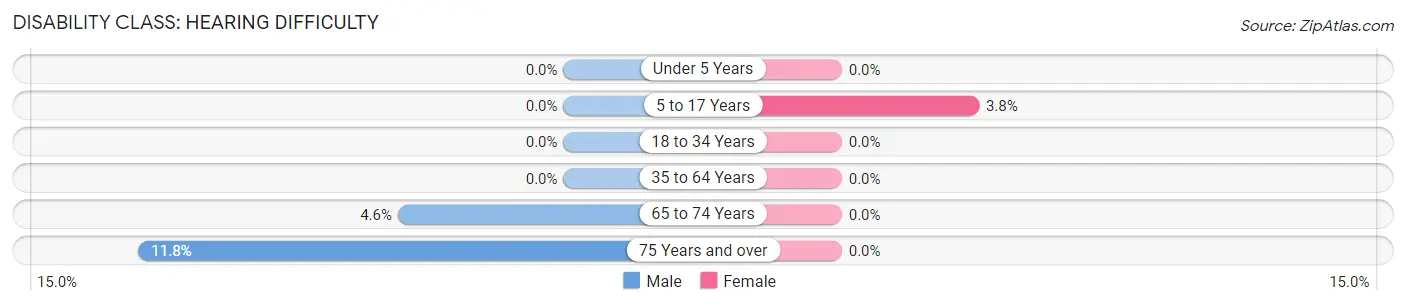
| Age Bracket | Male | Female |
| Under 5 Years | 0 (0.0%) | 0 (0.0%) |
| 5 to 17 Years | 0 (0.0%) | 12 (3.8%) |
| 18 to 34 Years | 0 (0.0%) | 0 (0.0%) |
| 35 to 64 Years | 0 (0.0%) | 0 (0.0%) |
| 65 to 74 Years | 10 (4.6%) | 0 (0.0%) |
| 75 Years and over | 22 (11.8%) | 0 (0.0%) |
Disability Class: Vision Difficulty
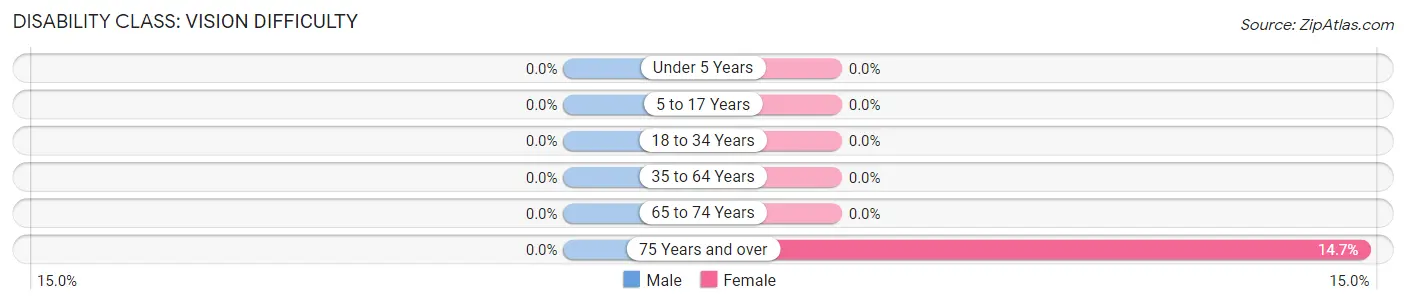
| Age Bracket | Male | Female |
| Under 5 Years | 0 (0.0%) | 0 (0.0%) |
| 5 to 17 Years | 0 (0.0%) | 0 (0.0%) |
| 18 to 34 Years | 0 (0.0%) | 0 (0.0%) |
| 35 to 64 Years | 0 (0.0%) | 0 (0.0%) |
| 65 to 74 Years | 0 (0.0%) | 0 (0.0%) |
| 75 Years and over | 0 (0.0%) | 25 (14.7%) |
Disability Class: Cognitive Difficulty
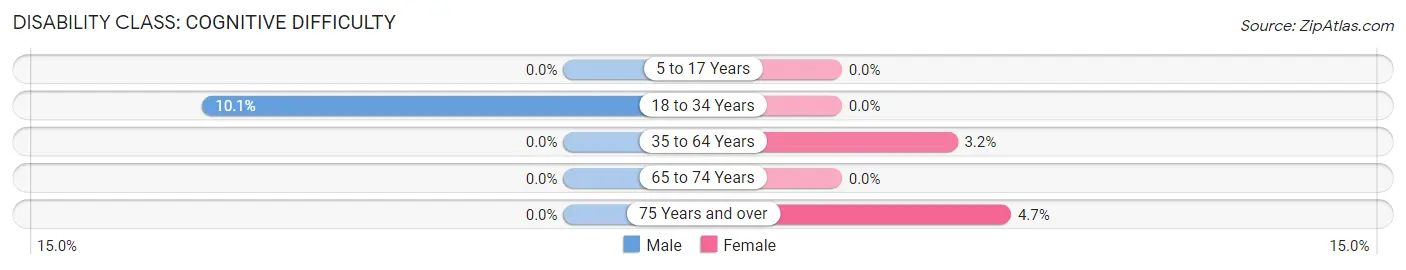
| Age Bracket | Male | Female |
| 5 to 17 Years | 0 (0.0%) | 0 (0.0%) |
| 18 to 34 Years | 19 (10.1%) | 0 (0.0%) |
| 35 to 64 Years | 0 (0.0%) | 23 (3.2%) |
| 65 to 74 Years | 0 (0.0%) | 0 (0.0%) |
| 75 Years and over | 0 (0.0%) | 8 (4.7%) |
Disability Class: Ambulatory Difficulty
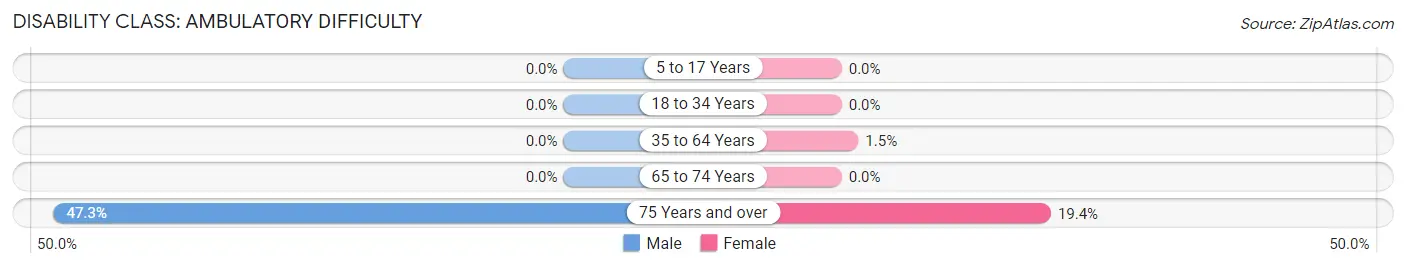
| Age Bracket | Male | Female |
| 5 to 17 Years | 0 (0.0%) | 0 (0.0%) |
| 18 to 34 Years | 0 (0.0%) | 0 (0.0%) |
| 35 to 64 Years | 0 (0.0%) | 11 (1.5%) |
| 65 to 74 Years | 0 (0.0%) | 0 (0.0%) |
| 75 Years and over | 88 (47.3%) | 33 (19.4%) |
Disability Class: Self-Care Difficulty
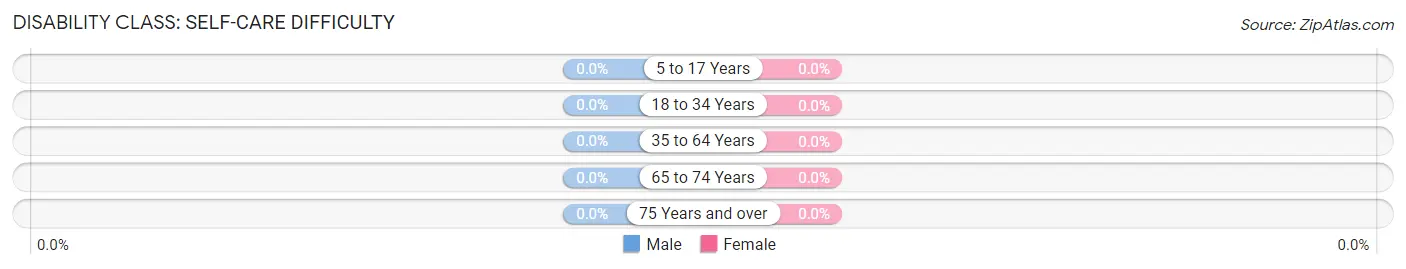
| Age Bracket | Male | Female |
| 5 to 17 Years | 0 (0.0%) | 0 (0.0%) |
| 18 to 34 Years | 0 (0.0%) | 0 (0.0%) |
| 35 to 64 Years | 0 (0.0%) | 0 (0.0%) |
| 65 to 74 Years | 0 (0.0%) | 0 (0.0%) |
| 75 Years and over | 0 (0.0%) | 0 (0.0%) |
Technology Access in Canterwood
Computing Device Access in Canterwood
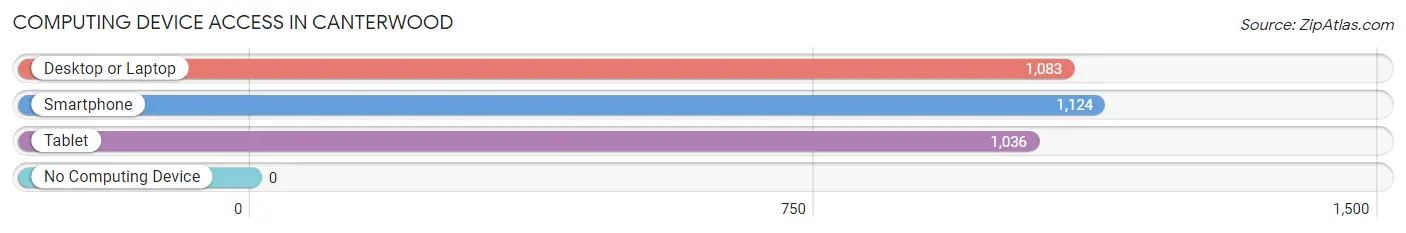
| Device Type | # Households | % Households |
| Desktop or Laptop | 1,083 | 94.2% |
| Smartphone | 1,124 | 97.7% |
| Tablet | 1,036 | 90.1% |
| No Computing Device | 0 | 0.0% |
| Total | 1,150 | 100.0% |
Internet Access in Canterwood
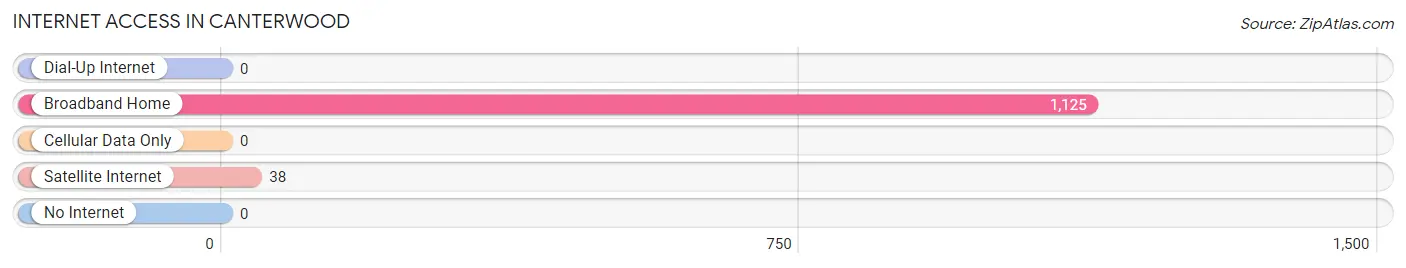
| Internet Type | # Households | % Households |
| Dial-Up Internet | 0 | 0.0% |
| Broadband Home | 1,125 | 97.8% |
| Cellular Data Only | 0 | 0.0% |
| Satellite Internet | 38 | 3.3% |
| No Internet | 0 | 0.0% |
| Total | 1,150 | 100.0% |
Canterwood Summary
Canterwood is a small city located in the state of Washington, United States. It is situated in the western part of the state, about 25 miles south of Seattle. The city has a population of approximately 8,000 people and is part of the Kitsap County.
History
Canterwood was founded in 1891 by a group of settlers from the Midwest. The settlers were looking for a place to settle and start a new life. They chose the area because of its proximity to the Puget Sound and the abundance of natural resources. The settlers named the town after the nearby creek, which was named after a local Native American chief.
The first settlers were mostly farmers and loggers, and the town quickly grew. By the early 1900s, the town had a population of over 1,000 people. The town was incorporated in 1909 and the first mayor was elected in 1910.
In the 1920s, the town began to experience a period of growth and prosperity. The population increased to over 2,000 people and the town was home to several businesses, including a sawmill, a cannery, and a lumber mill.
In the 1950s, the town experienced a decline in population as people moved away to larger cities. However, the town was able to maintain its small-town charm and many of the original buildings still stand today.
Geography
Canterwood is located in the western part of Washington state, about 25 miles south of Seattle. The city is situated in the Kitsap Peninsula, which is bordered by the Puget Sound to the west and the Hood Canal to the east. The city is surrounded by forests and mountains, and is home to several lakes and rivers.
The climate in Canterwood is mild and temperate, with warm summers and cool winters. The average temperature in the summer is around 70 degrees Fahrenheit, and the average temperature in the winter is around 40 degrees Fahrenheit.
Economy
Canterwood’s economy is largely based on tourism and agriculture. The city is home to several wineries, and the surrounding area is known for its apple orchards and other fruit farms. The city also has a thriving arts and culture scene, with several galleries and museums.
The city is also home to several businesses, including a sawmill, a cannery, and a lumber mill. The city is also home to several tech companies, including Microsoft and Amazon.
Demographics
As of the 2010 census, the population of Canterwood was 8,000 people. The racial makeup of the city was 87.3% White, 5.2% Hispanic or Latino, 2.2% Asian, 1.2% African American, and 0.3% Native American.
The median household income in Canterwood was $50,000, and the median family income was $60,000. The per capita income was $25,000. The unemployment rate was 4.2%.
Conclusion
Canterwood is a small city located in the western part of Washington state. The city has a population of 8,000 people and is part of the Kitsap County. The city is known for its mild climate, its abundance of natural resources, and its thriving economy. The city is home to several businesses, including a sawmill, a cannery, and a lumber mill. The city is also home to several tech companies, including Microsoft and Amazon. The population of Canterwood is largely White, with smaller percentages of Hispanic or Latino, Asian, African American, and Native American people. The median household income in Canterwood is $50,000, and the median family income is $60,000. The unemployment rate is 4.2%.
Common Questions
What is Per Capita Income in Canterwood?
Per Capita income in Canterwood is $71,541.
What is the Median Family Income in Canterwood?
Median Family Income in Canterwood is $144,292.
What is the Median Household income in Canterwood?
Median Household Income in Canterwood is $123,167.
What is Income or Wage Gap in Canterwood?
Income or Wage Gap in Canterwood is 67.5%.
Women in Canterwood earn 32.5 cents for every dollar earned by a man.
What is Inequality or Gini Index in Canterwood?
Inequality or Gini Index in Canterwood is 0.45.
What is the Total Population of Canterwood?
Total Population of Canterwood is 2,991.
What is the Total Male Population of Canterwood?
Total Male Population of Canterwood is 1,414.
What is the Total Female Population of Canterwood?
Total Female Population of Canterwood is 1,577.
What is the Ratio of Males per 100 Females in Canterwood?
There are 89.66 Males per 100 Females in Canterwood.
What is the Ratio of Females per 100 Males in Canterwood?
There are 111.53 Females per 100 Males in Canterwood.
What is the Median Population Age in Canterwood?
Median Population Age in Canterwood is 52.5 Years.
What is the Average Family Size in Canterwood
Average Family Size in Canterwood is 2.8 People.
What is the Average Household Size in Canterwood
Average Household Size in Canterwood is 2.6 People.
How Large is the Labor Force in Canterwood?
There are 1,250 People in the Labor Forcein in Canterwood.
What is the Percentage of People in the Labor Force in Canterwood?
51.6% of People are in the Labor Force in Canterwood.
What is the Unemployment Rate in Canterwood?
Unemployment Rate in Canterwood is 4.0%.