Zip Codes with the Highest Percentage of Population Employed in Computer, Engineering & Science in Tacoma, WA
RELATED REPORTS & OPTIONS
Computer, Engineering & Science
Tacoma
Compare Zip Codes
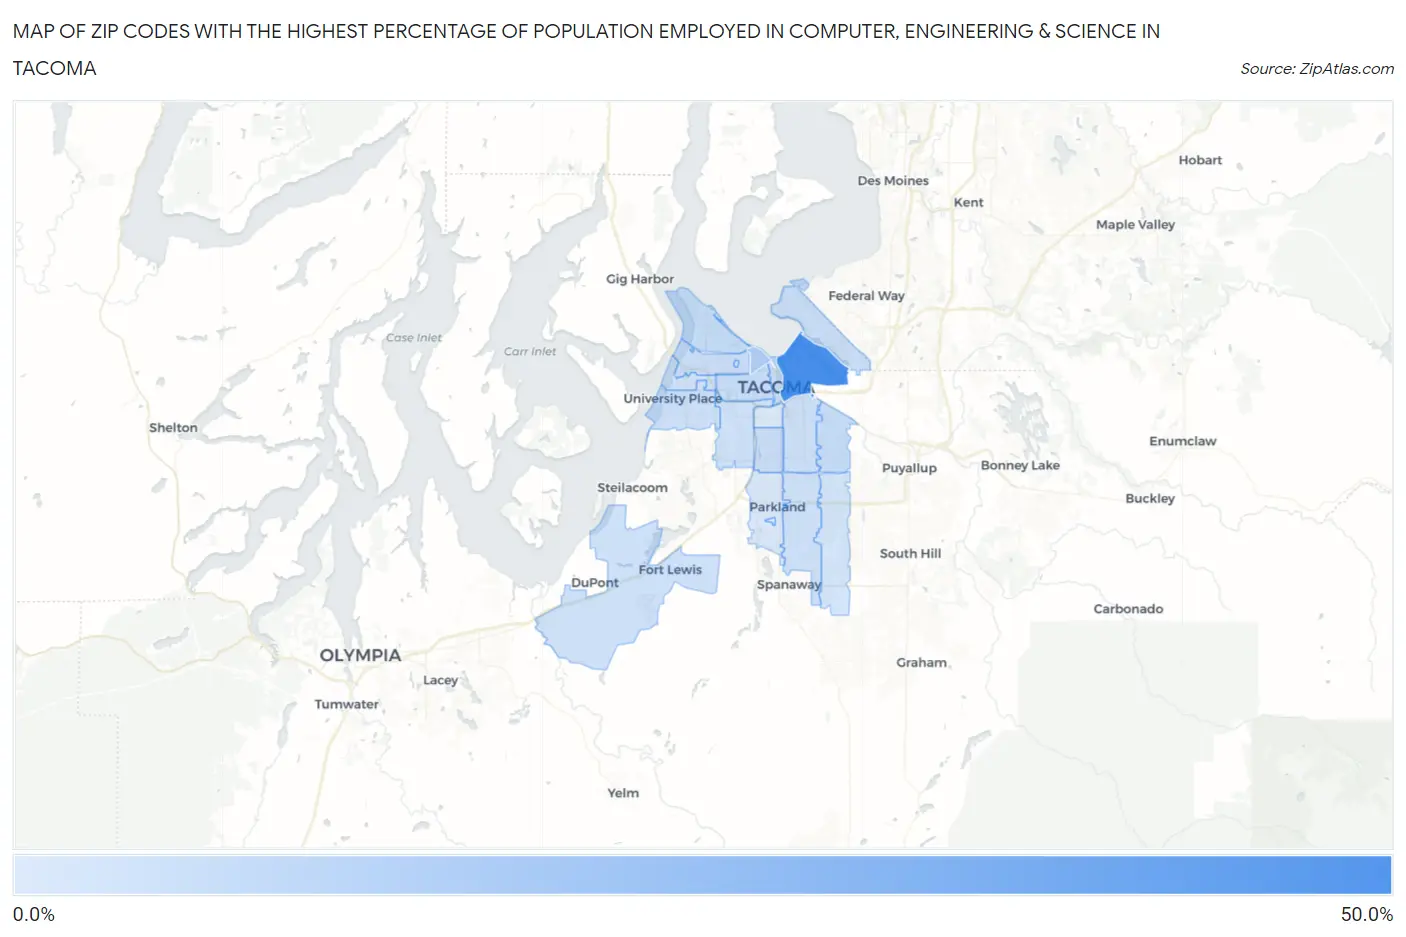
Map of Zip Codes with the Highest Percentage of Population Employed in Computer, Engineering & Science in Tacoma
1.4%
45.5%
Zip Codes with the Highest Percentage of Population Employed in Computer, Engineering & Science in Tacoma, WA
| Zip Code | % Employed | vs State | vs National | |
| 1. | 98421 | 45.5% | 10.2%(+35.3)#4 | 6.8%(+38.7)#55 |
| 2. | 98403 | 13.3% | 10.2%(+3.13)#73 | 6.8%(+6.52)#1,544 |
| 3. | 98443 | 7.4% | 10.2%(-2.71)#177 | 6.8%(+0.685)#6,078 |
| 4. | 98402 | 7.2% | 10.2%(-2.98)#190 | 6.8%(+0.416)#6,485 |
| 5. | 98407 | 6.9% | 10.2%(-3.23)#201 | 6.8%(+0.165)#6,915 |
| 6. | 98405 | 6.5% | 10.2%(-3.65)#222 | 6.8%(-0.259)#7,727 |
| 7. | 98422 | 5.8% | 10.2%(-4.31)#254 | 6.8%(-0.917)#9,198 |
| 8. | 98406 | 5.8% | 10.2%(-4.34)#258 | 6.8%(-0.942)#9,250 |
| 9. | 98408 | 5.7% | 10.2%(-4.42)#263 | 6.8%(-1.02)#9,439 |
| 10. | 98466 | 5.6% | 10.2%(-4.58)#273 | 6.8%(-1.18)#9,852 |
| 11. | 98404 | 5.1% | 10.2%(-5.01)#300 | 6.8%(-1.62)#10,946 |
| 12. | 98409 | 5.0% | 10.2%(-5.14)#308 | 6.8%(-1.75)#11,314 |
| 13. | 98433 | 5.0% | 10.2%(-5.16)#310 | 6.8%(-1.77)#11,388 |
| 14. | 98445 | 5.0% | 10.2%(-5.19)#312 | 6.8%(-1.80)#11,465 |
| 15. | 98465 | 4.3% | 10.2%(-5.85)#349 | 6.8%(-2.46)#13,470 |
| 16. | 98446 | 3.7% | 10.2%(-6.43)#379 | 6.8%(-3.04)#15,368 |
| 17. | 98416 | 2.8% | 10.2%(-7.41)#424 | 6.8%(-4.01)#19,027 |
| 18. | 98444 | 2.2% | 10.2%(-7.93)#440 | 6.8%(-4.53)#20,999 |
| 19. | 98447 | 2.0% | 10.2%(-8.13)#445 | 6.8%(-4.74)#21,765 |
| 20. | 98418 | 1.4% | 10.2%(-8.75)#469 | 6.8%(-5.36)#23,876 |
1
Common Questions
What are the Top 10 Zip Codes with the Highest Percentage of Population Employed in Computer, Engineering & Science in Tacoma, WA?
Top 10 Zip Codes with the Highest Percentage of Population Employed in Computer, Engineering & Science in Tacoma, WA are:
What zip code has the Highest Percentage of Population Employed in Computer, Engineering & Science in Tacoma, WA?
98421 has the Highest Percentage of Population Employed in Computer, Engineering & Science in Tacoma, WA with 45.5%.
What is the Percentage of Population Employed in Computer, Engineering & Science in Tacoma, WA?
Percentage of Population Employed in Computer, Engineering & Science in Tacoma is 5.9%.
What is the Percentage of Population Employed in Computer, Engineering & Science in Washington?
Percentage of Population Employed in Computer, Engineering & Science in Washington is 10.2%.
What is the Percentage of Population Employed in Computer, Engineering & Science in the United States?
Percentage of Population Employed in Computer, Engineering & Science in the United States is 6.8%.