Brier, WA Map & Demographics
Brier Map
Brier Overview
$57,268
PER CAPITA INCOME
$139,625
AVG FAMILY INCOME
$141,200
AVG HOUSEHOLD INCOME
6.6%
WAGE / INCOME GAP [ % ]
93.4¢/ $1
WAGE / INCOME GAP [ $ ]
0.36
INEQUALITY / GINI INDEX
6,539
TOTAL POPULATION
3,215
MALE POPULATION
3,324
FEMALE POPULATION
96.72
MALES / 100 FEMALES
103.39
FEMALES / 100 MALES
44.9
MEDIAN AGE
3.0
AVG FAMILY SIZE
2.8
AVG HOUSEHOLD SIZE
3,466
LABOR FORCE [ PEOPLE ]
65.7%
PERCENT IN LABOR FORCE
5.0%
UNEMPLOYMENT RATE
Brier Area Codes
Income in Brier
Income Overview in Brier
Per Capita Income in Brier is $57,268, while median incomes of families and households are $139,625 and $141,200 respectively.
| Characteristic | Number | Measure |
| Per Capita Income | 6,539 | $57,268 |
| Median Family Income | 1,927 | $139,625 |
| Mean Family Income | 1,927 | $163,928 |
| Median Household Income | 2,318 | $141,200 |
| Mean Household Income | 2,318 | $159,866 |
| Income Deficit | 1,927 | $0 |
| Wage / Income Gap (%) | 6,539 | 6.57% |
| Wage / Income Gap ($) | 6,539 | 93.43¢ per $1 |
| Gini / Inequality Index | 6,539 | 0.36 |
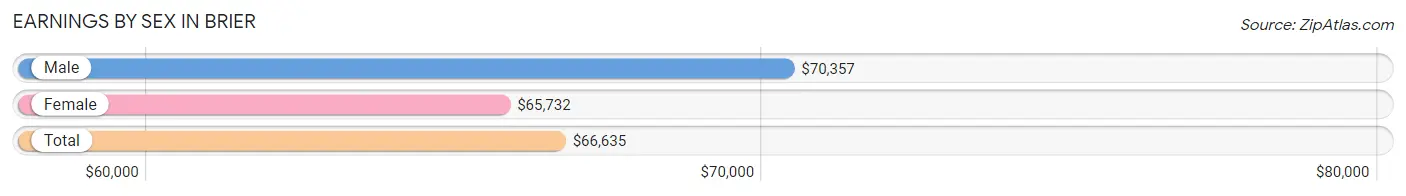
Earnings by Sex in Brier
Average Earnings in Brier are $66,635, $70,357 for men and $65,732 for women, a difference of 6.6%.
| Sex | Number | Average Earnings |
| Male | 1,970 (54.7%) | $70,357 |
| Female | 1,634 (45.3%) | $65,732 |
| Total | 3,604 (100.0%) | $66,635 |
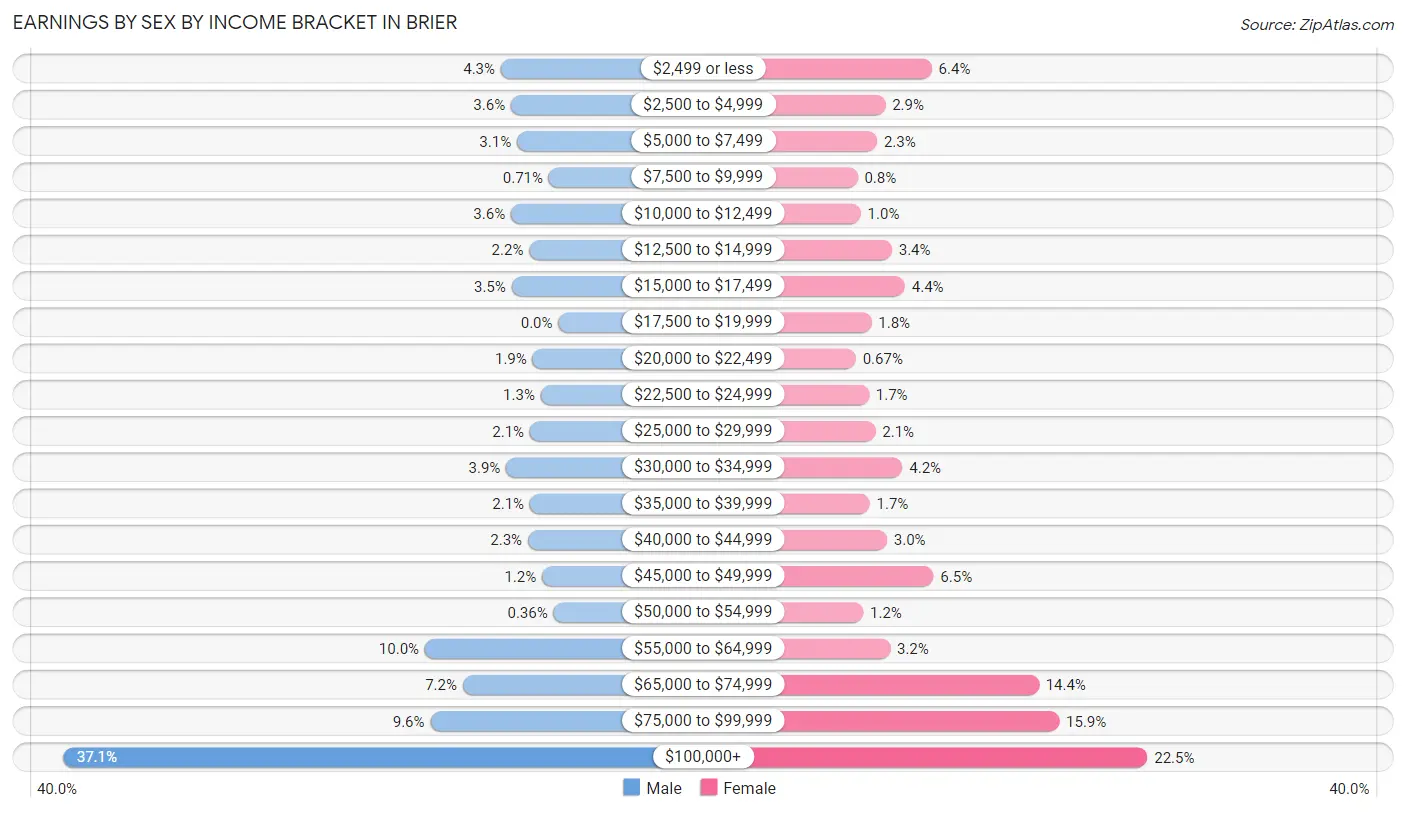
Earnings by Sex by Income Bracket in Brier
The most common earnings brackets in Brier are $100,000+ for men (730 | 37.1%) and $100,000+ for women (368 | 22.5%).
| Income | Male | Female |
| $2,499 or less | 85 (4.3%) | 104 (6.4%) |
| $2,500 to $4,999 | 70 (3.5%) | 47 (2.9%) |
| $5,000 to $7,499 | 61 (3.1%) | 37 (2.3%) |
| $7,500 to $9,999 | 14 (0.7%) | 13 (0.8%) |
| $10,000 to $12,499 | 70 (3.5%) | 17 (1.0%) |
| $12,500 to $14,999 | 43 (2.2%) | 55 (3.4%) |
| $15,000 to $17,499 | 69 (3.5%) | 71 (4.3%) |
| $17,500 to $19,999 | 0 (0.0%) | 30 (1.8%) |
| $20,000 to $22,499 | 38 (1.9%) | 11 (0.7%) |
| $22,500 to $24,999 | 26 (1.3%) | 27 (1.7%) |
| $25,000 to $29,999 | 42 (2.1%) | 35 (2.1%) |
| $30,000 to $34,999 | 77 (3.9%) | 68 (4.2%) |
| $35,000 to $39,999 | 42 (2.1%) | 28 (1.7%) |
| $40,000 to $44,999 | 45 (2.3%) | 49 (3.0%) |
| $45,000 to $49,999 | 24 (1.2%) | 106 (6.5%) |
| $50,000 to $54,999 | 7 (0.4%) | 20 (1.2%) |
| $55,000 to $64,999 | 197 (10.0%) | 53 (3.2%) |
| $65,000 to $74,999 | 141 (7.2%) | 235 (14.4%) |
| $75,000 to $99,999 | 189 (9.6%) | 260 (15.9%) |
| $100,000+ | 730 (37.1%) | 368 (22.5%) |
| Total | 1,970 (100.0%) | 1,634 (100.0%) |
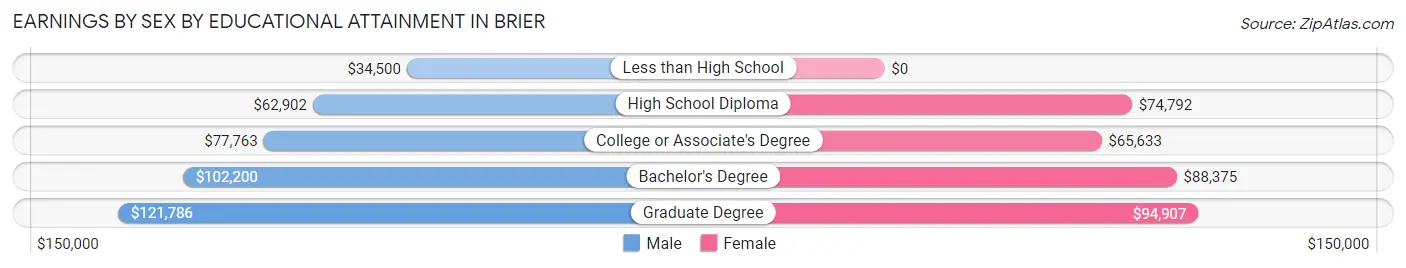
Earnings by Sex by Educational Attainment in Brier
Average earnings in Brier are $75,870 for men and $68,203 for women, a difference of 10.1%. Men with an educational attainment of graduate degree enjoy the highest average annual earnings of $121,786, while those with less than high school education earn the least with $34,500. Women with an educational attainment of graduate degree earn the most with the average annual earnings of $94,907, while those with college or associate's degree education have the smallest earnings of $65,633.
| Educational Attainment | Male Income | Female Income |
| Less than High School | $34,500 | $0 |
| High School Diploma | $62,902 | $74,792 |
| College or Associate's Degree | $77,763 | $65,633 |
| Bachelor's Degree | $102,200 | $88,375 |
| Graduate Degree | $121,786 | $94,907 |
| Total | $75,870 | $68,203 |
Family Income in Brier
Family Income Brackets in Brier
According to the Brier family income data, there are 489 families falling into the $200,000+ income range, which is the most common income bracket and makes up 25.4% of all families. Conversely, the $25,000 to $34,999 income bracket is the least frequent group with only 6 families (0.3%) belonging to this category.
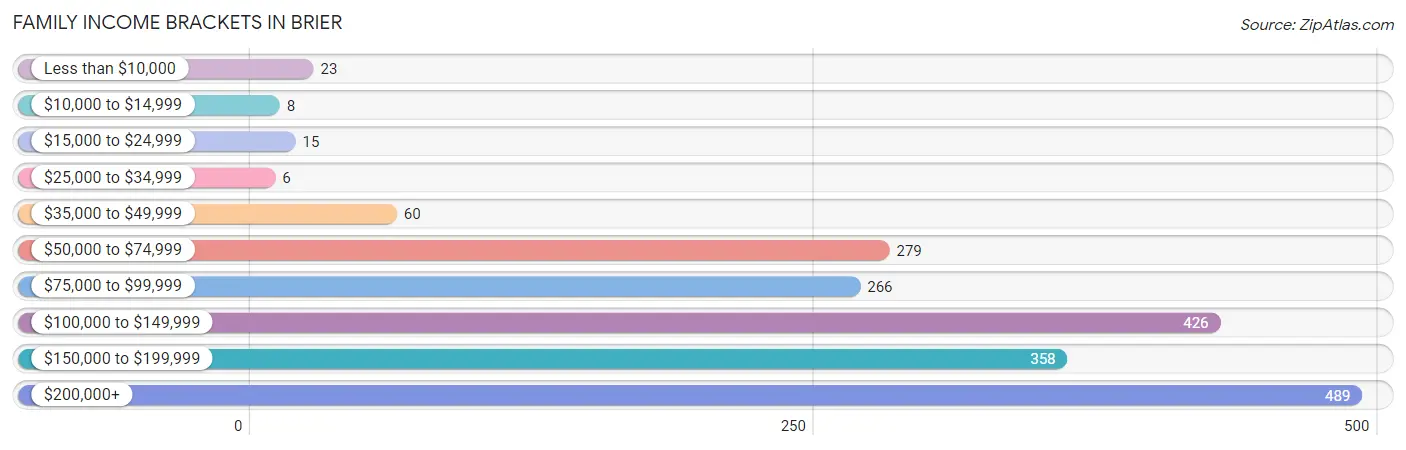
| Income Bracket | # Families | % Families |
| Less than $10,000 | 23 | 1.2% |
| $10,000 to $14,999 | 8 | 0.4% |
| $15,000 to $24,999 | 15 | 0.8% |
| $25,000 to $34,999 | 6 | 0.3% |
| $35,000 to $49,999 | 60 | 3.1% |
| $50,000 to $74,999 | 279 | 14.5% |
| $75,000 to $99,999 | 266 | 13.8% |
| $100,000 to $149,999 | 426 | 22.1% |
| $150,000 to $199,999 | 358 | 18.6% |
| $200,000+ | 489 | 25.4% |
Family Income by Famaliy Size in Brier
5-person families (149 | 7.7%) account for the highest median family income in Brier with $162,788 per family, while 2-person families (799 | 41.5%) have the highest median income of $61,020 per family member.
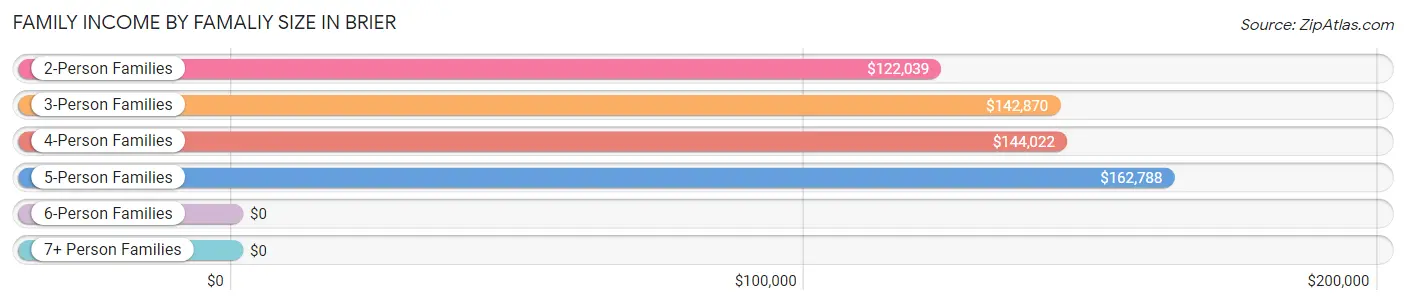
| Income Bracket | # Families | Median Income |
| 2-Person Families | 799 (41.5%) | $122,039 |
| 3-Person Families | 476 (24.7%) | $142,870 |
| 4-Person Families | 492 (25.5%) | $144,022 |
| 5-Person Families | 149 (7.7%) | $162,788 |
| 6-Person Families | 9 (0.5%) | $0 |
| 7+ Person Families | 2 (0.1%) | $0 |
| Total | 1,927 (100.0%) | $139,625 |
Family Income by Number of Earners in Brier
The median family income in Brier is $139,625, with families comprising 2 earners (805) having the highest median family income of $183,297, while families with 1 earner (523) have the lowest median family income of $83,651, accounting for 41.8% and 27.1% of families, respectively.
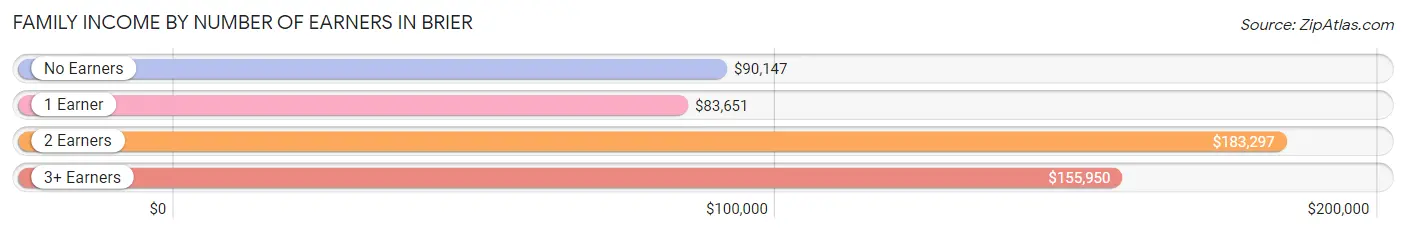
| Number of Earners | # Families | Median Income |
| No Earners | 354 (18.4%) | $90,147 |
| 1 Earner | 523 (27.1%) | $83,651 |
| 2 Earners | 805 (41.8%) | $183,297 |
| 3+ Earners | 245 (12.7%) | $155,950 |
| Total | 1,927 (100.0%) | $139,625 |
Household Income in Brier
Household Income Brackets in Brier
With 538 households falling in the category, the $200,000+ income range is the most frequent in Brier, accounting for 23.2% of all households. In contrast, only 7 households (0.3%) fall into the $10,000 to $14,999 income bracket, making it the least populous group.
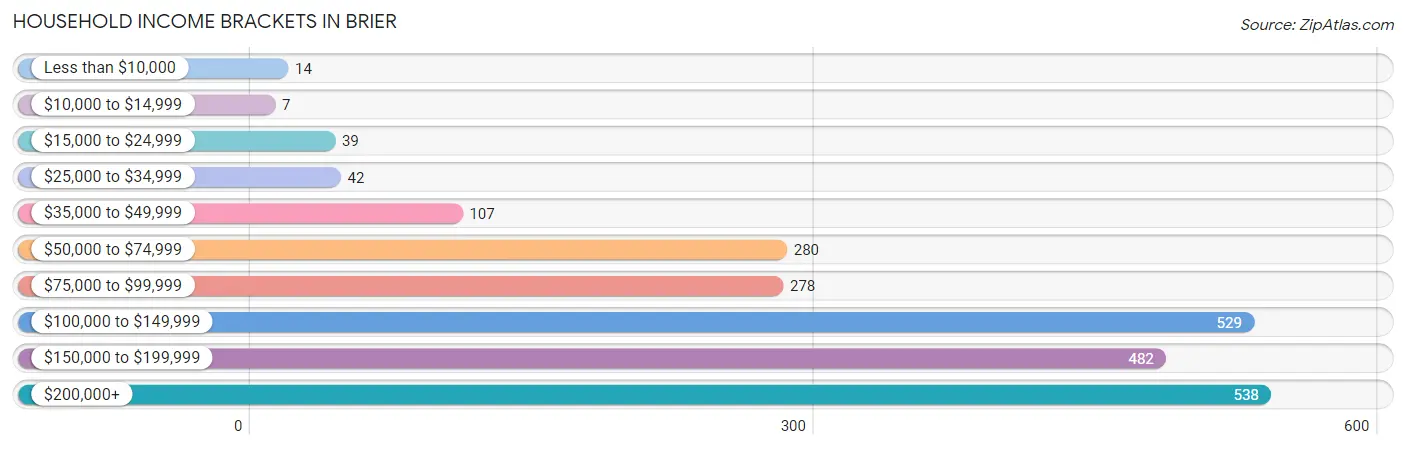
| Income Bracket | # Households | % Households |
| Less than $10,000 | 14 | 0.6% |
| $10,000 to $14,999 | 7 | 0.3% |
| $15,000 to $24,999 | 39 | 1.7% |
| $25,000 to $34,999 | 42 | 1.8% |
| $35,000 to $49,999 | 107 | 4.6% |
| $50,000 to $74,999 | 280 | 12.1% |
| $75,000 to $99,999 | 278 | 12.0% |
| $100,000 to $149,999 | 529 | 22.8% |
| $150,000 to $199,999 | 482 | 20.8% |
| $200,000+ | 538 | 23.2% |
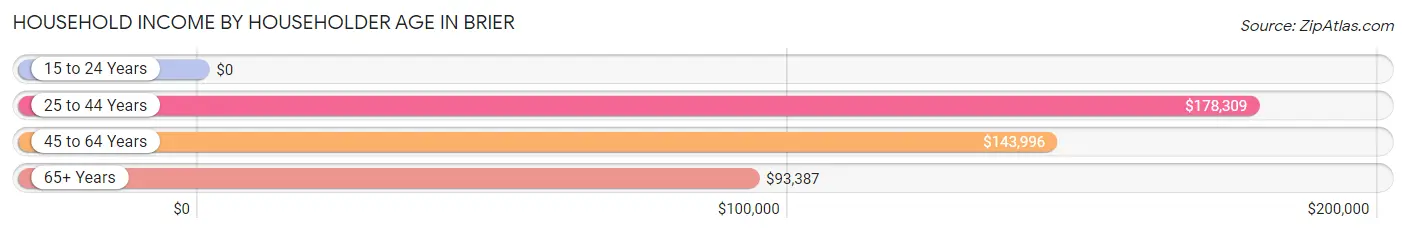
Household Income by Householder Age in Brier
The median household income in Brier is $141,200, with the highest median household income of $178,309 found in the 25 to 44 years age bracket for the primary householder. A total of 609 households (26.3%) fall into this category.
| Income Bracket | # Households | Median Income |
| 15 to 24 Years | 0 (0.0%) | $0 |
| 25 to 44 Years | 609 (26.3%) | $178,309 |
| 45 to 64 Years | 999 (43.1%) | $143,996 |
| 65+ Years | 710 (30.6%) | $93,387 |
| Total | 2,318 (100.0%) | $141,200 |
Poverty in Brier
Income Below Poverty by Sex and Age in Brier
With 4.0% poverty level for males and 3.2% for females among the residents of Brier, 16 and 17 year old males and 5 year old females are the most vulnerable to poverty, with 24 males (72.7%) and 6 females (54.5%) in their respective age groups living below the poverty level.
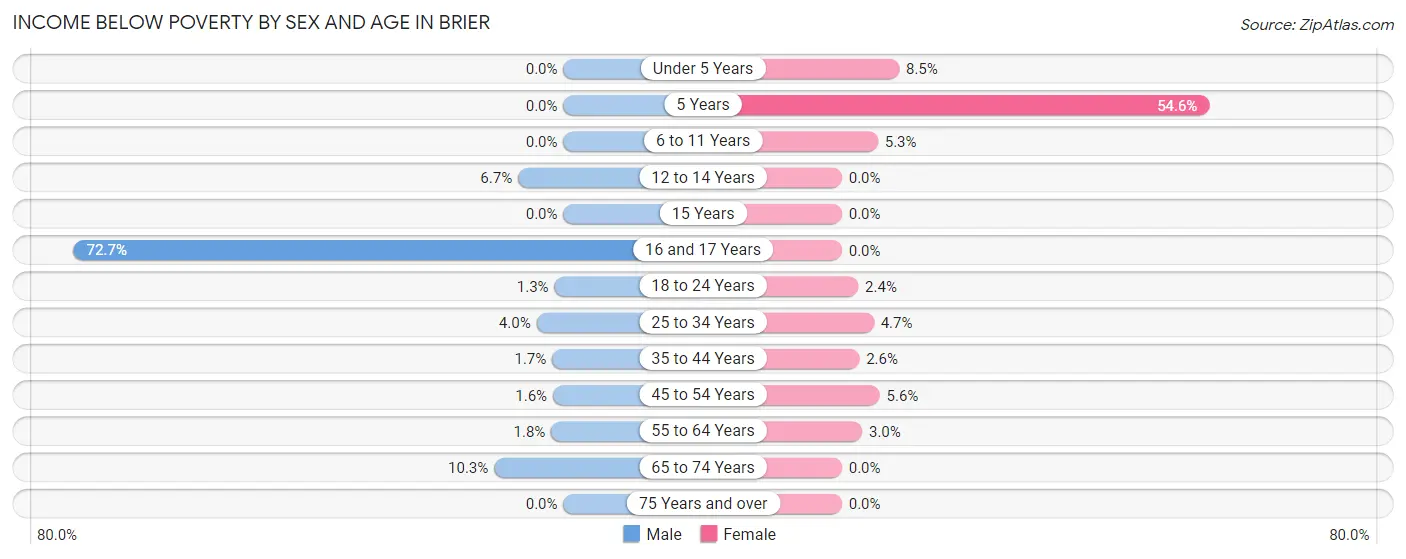
| Age Bracket | Male | Female |
| Under 5 Years | 0 (0.0%) | 17 (8.5%) |
| 5 Years | 0 (0.0%) | 6 (54.5%) |
| 6 to 11 Years | 0 (0.0%) | 11 (5.3%) |
| 12 to 14 Years | 6 (6.7%) | 0 (0.0%) |
| 15 Years | 0 (0.0%) | 0 (0.0%) |
| 16 and 17 Years | 24 (72.7%) | 0 (0.0%) |
| 18 to 24 Years | 2 (1.3%) | 6 (2.4%) |
| 25 to 34 Years | 12 (4.0%) | 9 (4.7%) |
| 35 to 44 Years | 10 (1.7%) | 11 (2.6%) |
| 45 to 54 Years | 5 (1.5%) | 30 (5.6%) |
| 55 to 64 Years | 10 (1.8%) | 15 (3.0%) |
| 65 to 74 Years | 59 (10.3%) | 0 (0.0%) |
| 75 Years and over | 0 (0.0%) | 0 (0.0%) |
| Total | 128 (4.0%) | 105 (3.2%) |
Income Above Poverty by Sex and Age in Brier
According to the poverty statistics in Brier, males aged under 5 years and females aged 12 to 14 years are the age groups that are most secure financially, with 100.0% of males and 100.0% of females in these age groups living above the poverty line.
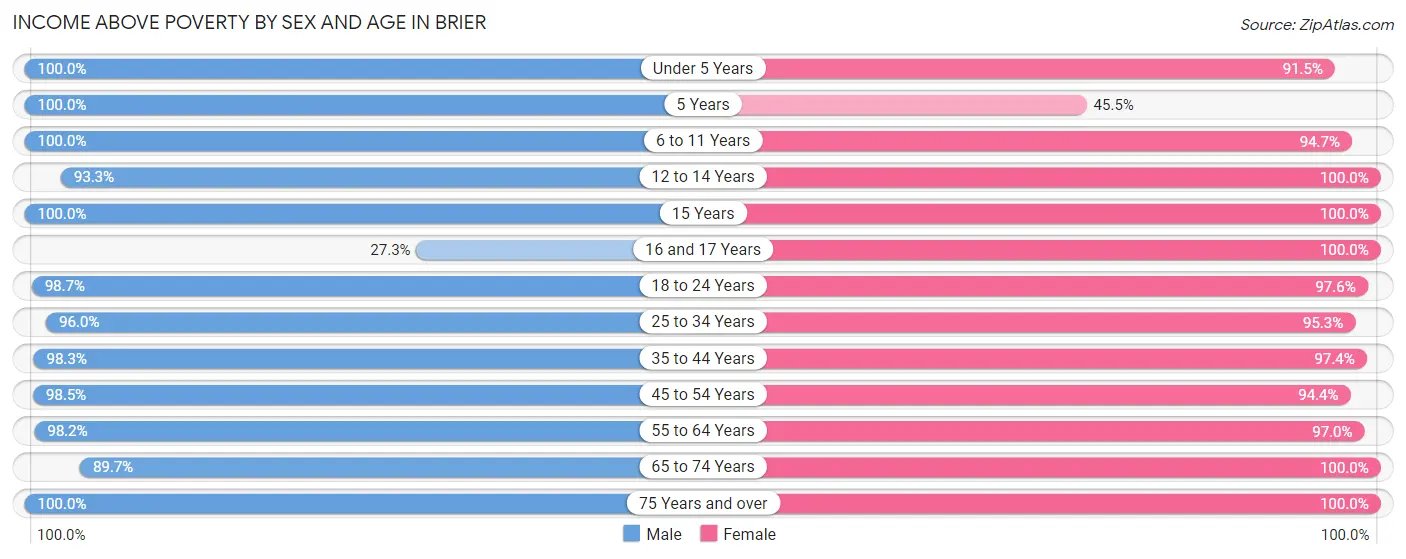
| Age Bracket | Male | Female |
| Under 5 Years | 174 (100.0%) | 183 (91.5%) |
| 5 Years | 37 (100.0%) | 5 (45.5%) |
| 6 to 11 Years | 278 (100.0%) | 195 (94.7%) |
| 12 to 14 Years | 83 (93.3%) | 217 (100.0%) |
| 15 Years | 13 (100.0%) | 30 (100.0%) |
| 16 and 17 Years | 9 (27.3%) | 72 (100.0%) |
| 18 to 24 Years | 149 (98.7%) | 241 (97.6%) |
| 25 to 34 Years | 289 (96.0%) | 181 (95.3%) |
| 35 to 44 Years | 588 (98.3%) | 413 (97.4%) |
| 45 to 54 Years | 317 (98.5%) | 505 (94.4%) |
| 55 to 64 Years | 543 (98.2%) | 483 (97.0%) |
| 65 to 74 Years | 515 (89.7%) | 425 (100.0%) |
| 75 Years and over | 86 (100.0%) | 251 (100.0%) |
| Total | 3,081 (96.0%) | 3,201 (96.8%) |
Income Below Poverty Among Married-Couple Families in Brier
The poverty statistics for married-couple families in Brier show that 1.3% or 21 of the total 1,604 families live below the poverty line. Families with 1 or 2 children have the highest poverty rate of 1.7%, comprising of 9 families. On the other hand, families with 3 or 4 children have the lowest poverty rate of 0.0%, which includes 0 families.
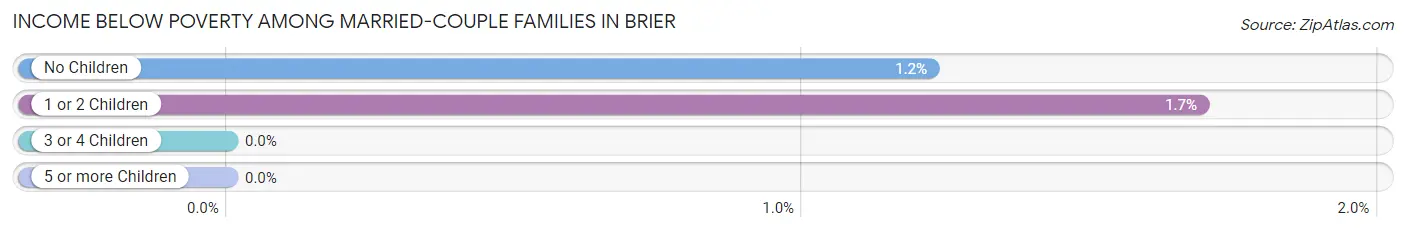
| Children | Above Poverty | Below Poverty |
| No Children | 970 (98.8%) | 12 (1.2%) |
| 1 or 2 Children | 523 (98.3%) | 9 (1.7%) |
| 3 or 4 Children | 88 (100.0%) | 0 (0.0%) |
| 5 or more Children | 2 (100.0%) | 0 (0.0%) |
| Total | 1,583 (98.7%) | 21 (1.3%) |
Income Below Poverty Among Single-Parent Households in Brier
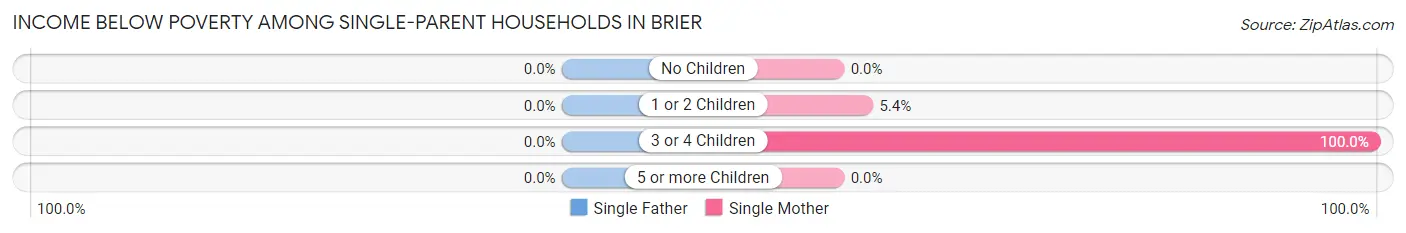
| Children | Single Father | Single Mother |
| No Children | 0 (0.0%) | 0 (0.0%) |
| 1 or 2 Children | 0 (0.0%) | 9 (5.4%) |
| 3 or 4 Children | 0 (0.0%) | 6 (100.0%) |
| 5 or more Children | 0 (0.0%) | 0 (0.0%) |
| Total | 0 (0.0%) | 15 (5.8%) |
Income Below Poverty Among Married-Couple vs Single-Parent Households in Brier
The poverty data for Brier shows that 21 of the married-couple family households (1.3%) and 15 of the single-parent households (4.6%) are living below the poverty level. Within the married-couple family households, those with 1 or 2 children have the highest poverty rate, with 9 households (1.7%) falling below the poverty line. Among the single-parent households, those with 3 or 4 children have the highest poverty rate, with 6 household (100.0%) living below poverty.
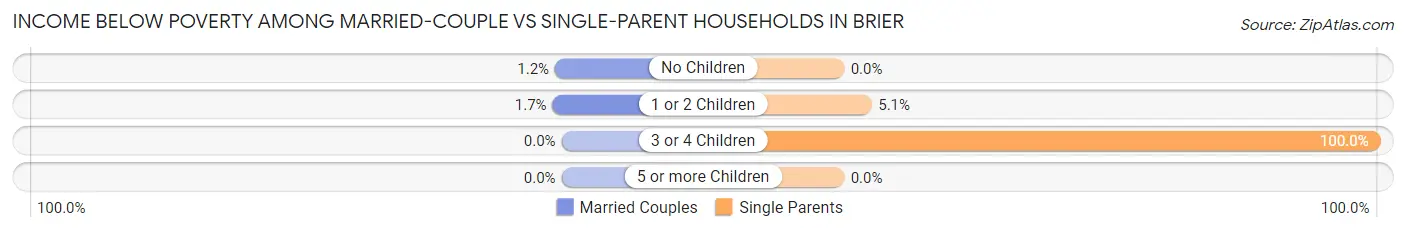
| Children | Married-Couple Families | Single-Parent Households |
| No Children | 12 (1.2%) | 0 (0.0%) |
| 1 or 2 Children | 9 (1.7%) | 9 (5.1%) |
| 3 or 4 Children | 0 (0.0%) | 6 (100.0%) |
| 5 or more Children | 0 (0.0%) | 0 (0.0%) |
| Total | 21 (1.3%) | 15 (4.6%) |
Race in Brier
The most populous races in Brier are White / Caucasian (5,245 | 80.2%), Asian (543 | 8.3%), and Black / African American (364 | 5.6%).
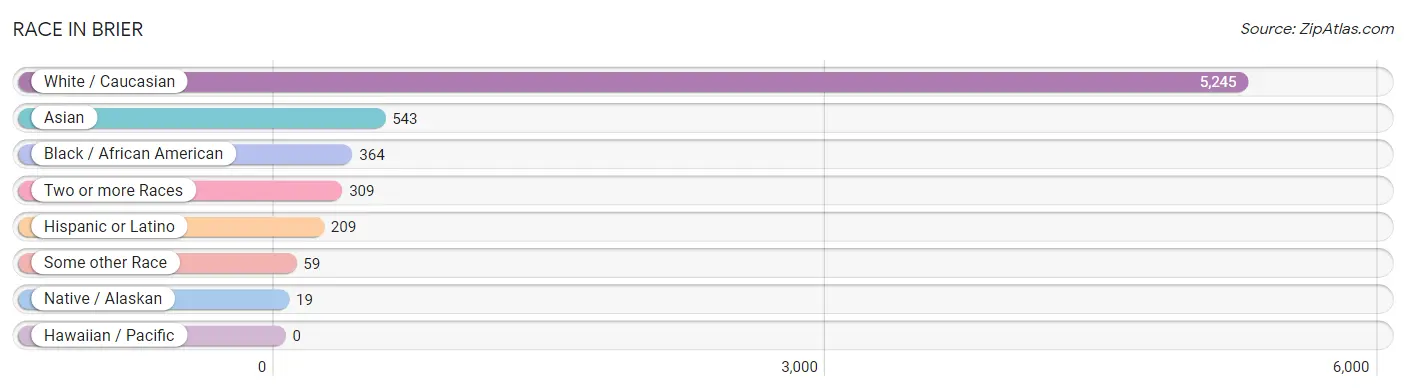
| Race | # Population | % Population |
| Asian | 543 | 8.3% |
| Black / African American | 364 | 5.6% |
| Hawaiian / Pacific | 0 | 0.0% |
| Hispanic or Latino | 209 | 3.2% |
| Native / Alaskan | 19 | 0.3% |
| White / Caucasian | 5,245 | 80.2% |
| Two or more Races | 309 | 4.7% |
| Some other Race | 59 | 0.9% |
| Total | 6,539 | 100.0% |
Ancestry in Brier
The most populous ancestries reported in Brier are German (1,306 | 20.0%), English (1,217 | 18.6%), Irish (585 | 8.9%), Norwegian (580 | 8.9%), and European (553 | 8.5%), together accounting for 64.9% of all Brier residents.
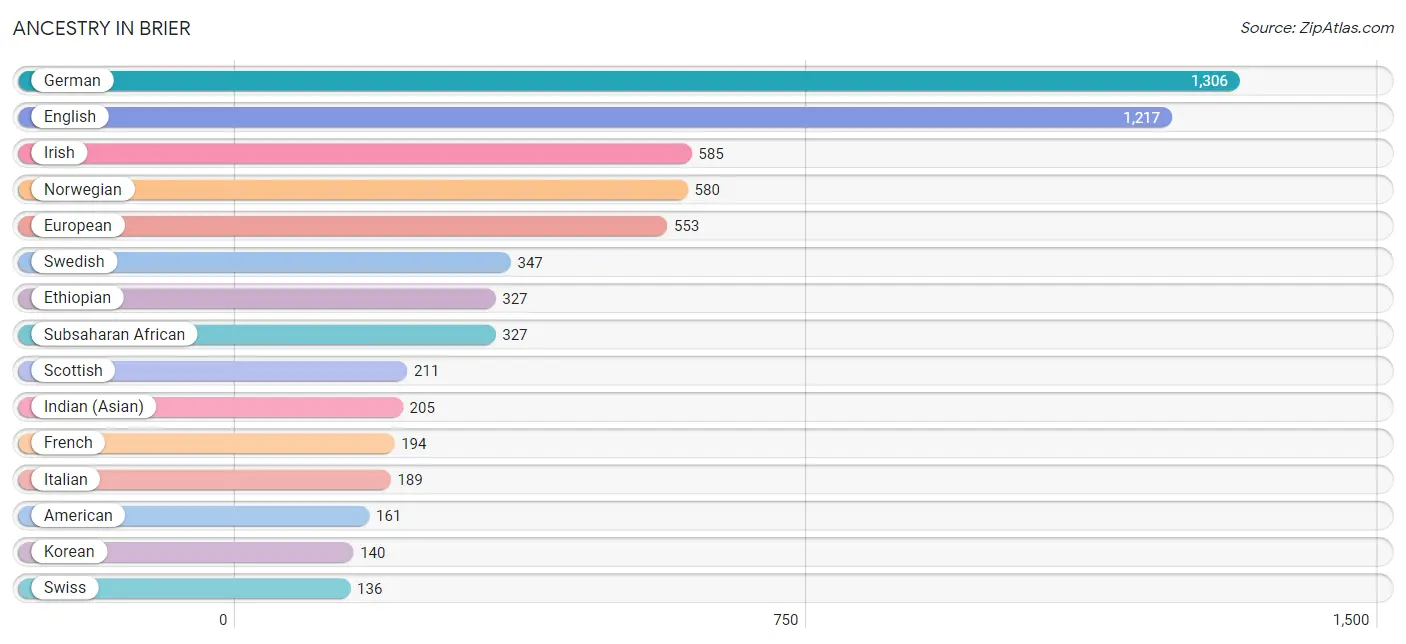
| Ancestry | # Population | % Population |
| American | 161 | 2.5% |
| Arab | 15 | 0.2% |
| Armenian | 12 | 0.2% |
| Austrian | 2 | 0.0% |
| Belgian | 35 | 0.5% |
| Bhutanese | 134 | 2.1% |
| British | 31 | 0.5% |
| Burmese | 105 | 1.6% |
| Canadian | 14 | 0.2% |
| Central American | 11 | 0.2% |
| Cherokee | 2 | 0.0% |
| Chippewa | 7 | 0.1% |
| Croatian | 10 | 0.2% |
| Danish | 10 | 0.2% |
| Dutch | 133 | 2.0% |
| Eastern European | 8 | 0.1% |
| English | 1,217 | 18.6% |
| Ethiopian | 327 | 5.0% |
| European | 553 | 8.5% |
| Filipino | 20 | 0.3% |
| Finnish | 38 | 0.6% |
| French | 194 | 3.0% |
| French American Indian | 6 | 0.1% |
| French Canadian | 7 | 0.1% |
| German | 1,306 | 20.0% |
| Greek | 73 | 1.1% |
| Hungarian | 24 | 0.4% |
| Icelander | 9 | 0.1% |
| Indian (Asian) | 205 | 3.1% |
| Irish | 585 | 8.9% |
| Italian | 189 | 2.9% |
| Jamaican | 1 | 0.0% |
| Korean | 140 | 2.1% |
| Lithuanian | 10 | 0.2% |
| Mexican | 115 | 1.8% |
| Mongolian | 30 | 0.5% |
| Native Hawaiian | 2 | 0.0% |
| Navajo | 3 | 0.1% |
| Northern European | 16 | 0.2% |
| Norwegian | 580 | 8.9% |
| Pennsylvania German | 11 | 0.2% |
| Polish | 72 | 1.1% |
| Portuguese | 10 | 0.2% |
| Puerto Rican | 2 | 0.0% |
| Russian | 103 | 1.6% |
| Salvadoran | 11 | 0.2% |
| Scandinavian | 109 | 1.7% |
| Scotch-Irish | 58 | 0.9% |
| Scottish | 211 | 3.2% |
| Serbian | 10 | 0.2% |
| Slovak | 8 | 0.1% |
| Spaniard | 73 | 1.1% |
| Spanish | 8 | 0.1% |
| Sri Lankan | 135 | 2.1% |
| Subsaharan African | 327 | 5.0% |
| Swedish | 347 | 5.3% |
| Swiss | 136 | 2.1% |
| Thai | 54 | 0.8% |
| Ukrainian | 32 | 0.5% |
| Welsh | 22 | 0.3% |
| Yakama | 3 | 0.1% | View All 61 Rows |
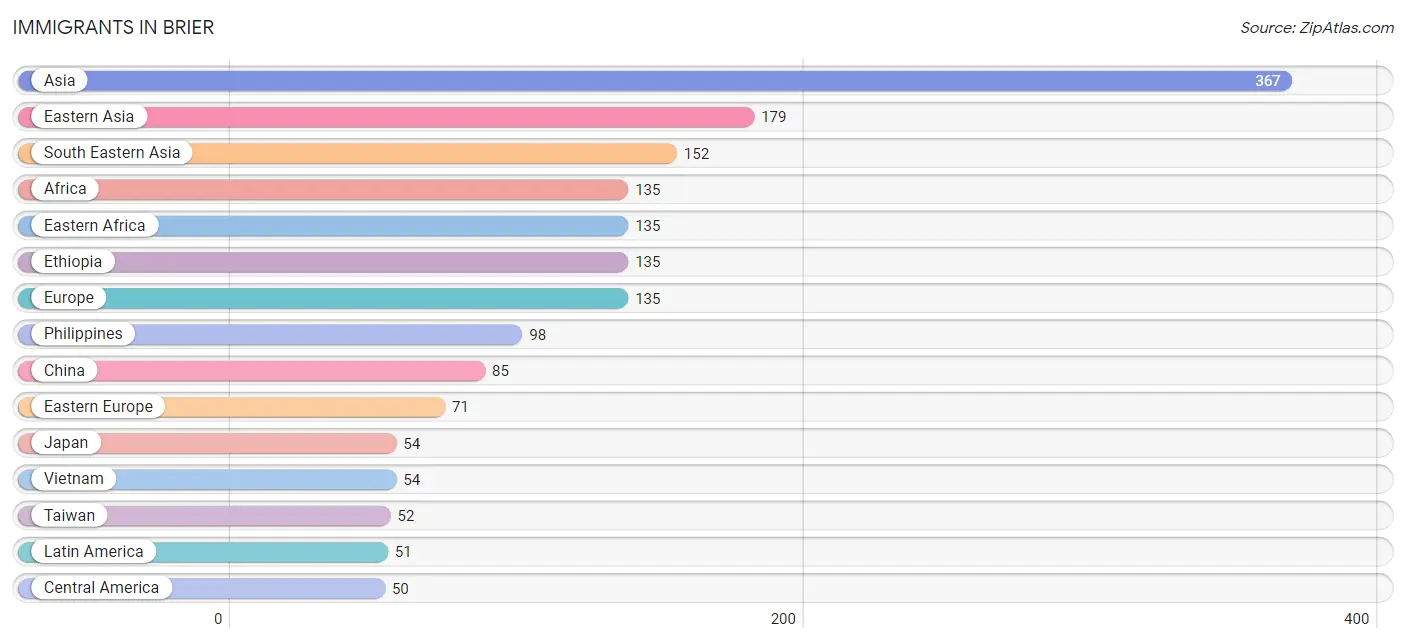
Immigrants in Brier
The most numerous immigrant groups reported in Brier came from Asia (367 | 5.6%), Eastern Asia (179 | 2.7%), South Eastern Asia (152 | 2.3%), Africa (135 | 2.1%), and Eastern Africa (135 | 2.1%), together accounting for 14.8% of all Brier residents.
| Immigration Origin | # Population | % Population |
| Africa | 135 | 2.1% |
| Asia | 367 | 5.6% |
| Canada | 6 | 0.1% |
| Caribbean | 1 | 0.0% |
| Central America | 50 | 0.8% |
| China | 85 | 1.3% |
| Denmark | 1 | 0.0% |
| Eastern Africa | 135 | 2.1% |
| Eastern Asia | 179 | 2.7% |
| Eastern Europe | 71 | 1.1% |
| El Salvador | 11 | 0.2% |
| England | 10 | 0.2% |
| Ethiopia | 135 | 2.1% |
| Europe | 135 | 2.1% |
| France | 15 | 0.2% |
| India | 36 | 0.5% |
| Ireland | 14 | 0.2% |
| Jamaica | 1 | 0.0% |
| Japan | 54 | 0.8% |
| Korea | 40 | 0.6% |
| Latin America | 51 | 0.8% |
| Mexico | 39 | 0.6% |
| Northern Europe | 49 | 0.7% |
| Philippines | 98 | 1.5% |
| Russia | 50 | 0.8% |
| South Central Asia | 36 | 0.5% |
| South Eastern Asia | 152 | 2.3% |
| Taiwan | 52 | 0.8% |
| Vietnam | 54 | 0.8% |
| Western Europe | 15 | 0.2% | View All 30 Rows |
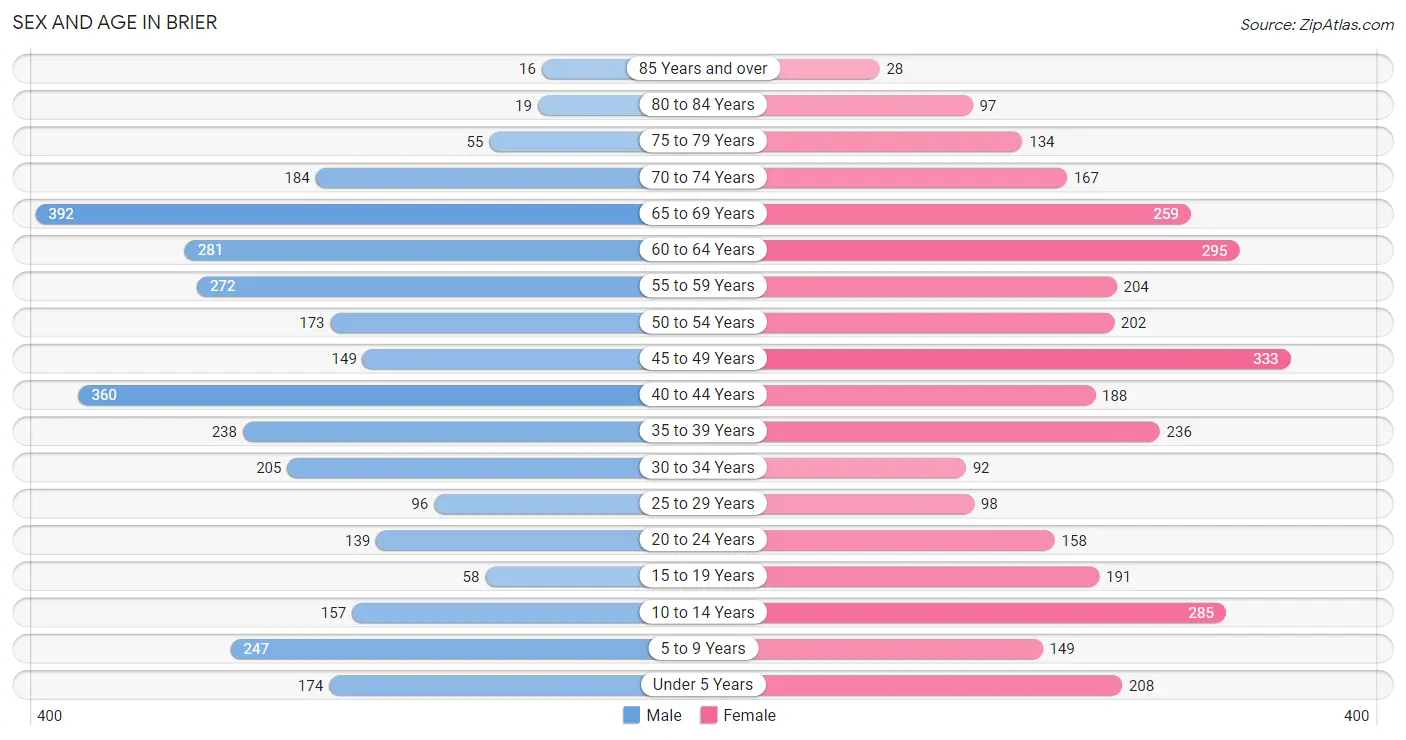
Sex and Age in Brier
Sex and Age in Brier
The most populous age groups in Brier are 65 to 69 Years (392 | 12.2%) for men and 45 to 49 Years (333 | 10.0%) for women.
| Age Bracket | Male | Female |
| Under 5 Years | 174 (5.4%) | 208 (6.3%) |
| 5 to 9 Years | 247 (7.7%) | 149 (4.5%) |
| 10 to 14 Years | 157 (4.9%) | 285 (8.6%) |
| 15 to 19 Years | 58 (1.8%) | 191 (5.8%) |
| 20 to 24 Years | 139 (4.3%) | 158 (4.8%) |
| 25 to 29 Years | 96 (3.0%) | 98 (2.9%) |
| 30 to 34 Years | 205 (6.4%) | 92 (2.8%) |
| 35 to 39 Years | 238 (7.4%) | 236 (7.1%) |
| 40 to 44 Years | 360 (11.2%) | 188 (5.7%) |
| 45 to 49 Years | 149 (4.6%) | 333 (10.0%) |
| 50 to 54 Years | 173 (5.4%) | 202 (6.1%) |
| 55 to 59 Years | 272 (8.5%) | 204 (6.1%) |
| 60 to 64 Years | 281 (8.7%) | 295 (8.9%) |
| 65 to 69 Years | 392 (12.2%) | 259 (7.8%) |
| 70 to 74 Years | 184 (5.7%) | 167 (5.0%) |
| 75 to 79 Years | 55 (1.7%) | 134 (4.0%) |
| 80 to 84 Years | 19 (0.6%) | 97 (2.9%) |
| 85 Years and over | 16 (0.5%) | 28 (0.8%) |
| Total | 3,215 (100.0%) | 3,324 (100.0%) |
Families and Households in Brier
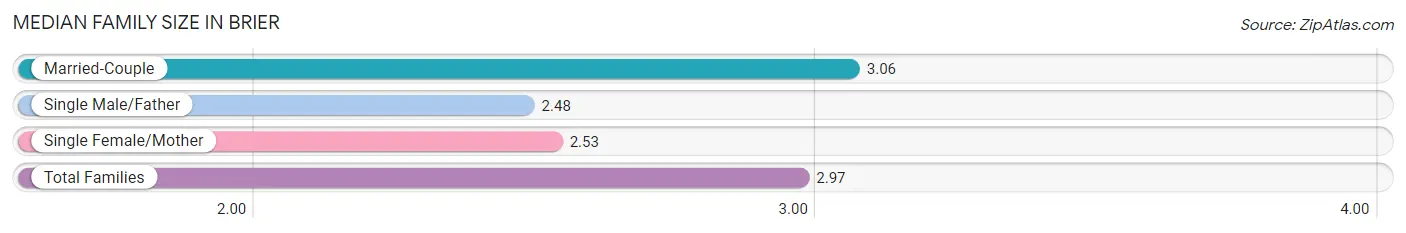
Median Family Size in Brier
The median family size in Brier is 2.97 persons per family, with married-couple families (1,604 | 83.2%) accounting for the largest median family size of 3.06 persons per family. On the other hand, single male/father families (64 | 3.3%) represent the smallest median family size with 2.48 persons per family.
| Family Type | # Families | Family Size |
| Married-Couple | 1,604 (83.2%) | 3.06 |
| Single Male/Father | 64 (3.3%) | 2.48 |
| Single Female/Mother | 259 (13.4%) | 2.53 |
| Total Families | 1,927 (100.0%) | 2.97 |
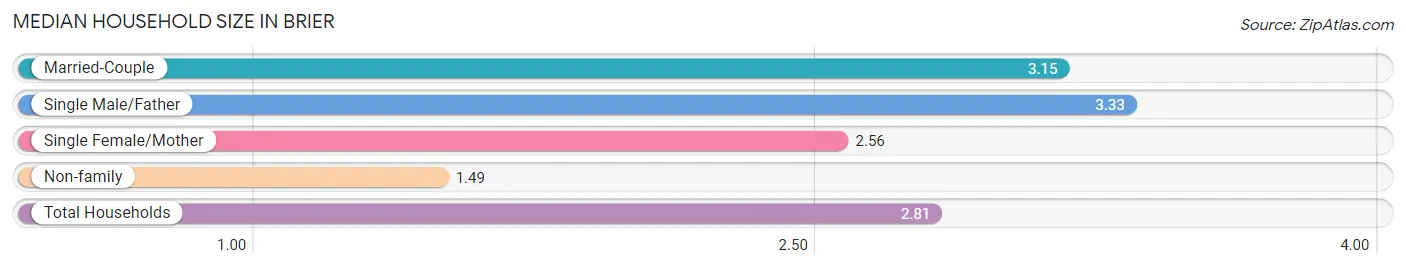
Median Household Size in Brier
The median household size in Brier is 2.81 persons per household, with single male/father households (64 | 2.8%) accounting for the largest median household size of 3.33 persons per household. non-family households (391 | 16.9%) represent the smallest median household size with 1.49 persons per household.
| Household Type | # Households | Household Size |
| Married-Couple | 1,604 (69.2%) | 3.15 |
| Single Male/Father | 64 (2.8%) | 3.33 |
| Single Female/Mother | 259 (11.2%) | 2.56 |
| Non-family | 391 (16.9%) | 1.49 |
| Total Households | 2,318 (100.0%) | 2.81 |
Household Size by Marriage Status in Brier
Out of a total of 2,318 households in Brier, 1,927 (83.1%) are family households, while 391 (16.9%) are nonfamily households. The most numerous type of family households are 2-person households, comprising 747, and the most common type of nonfamily households are 1-person households, comprising 233.
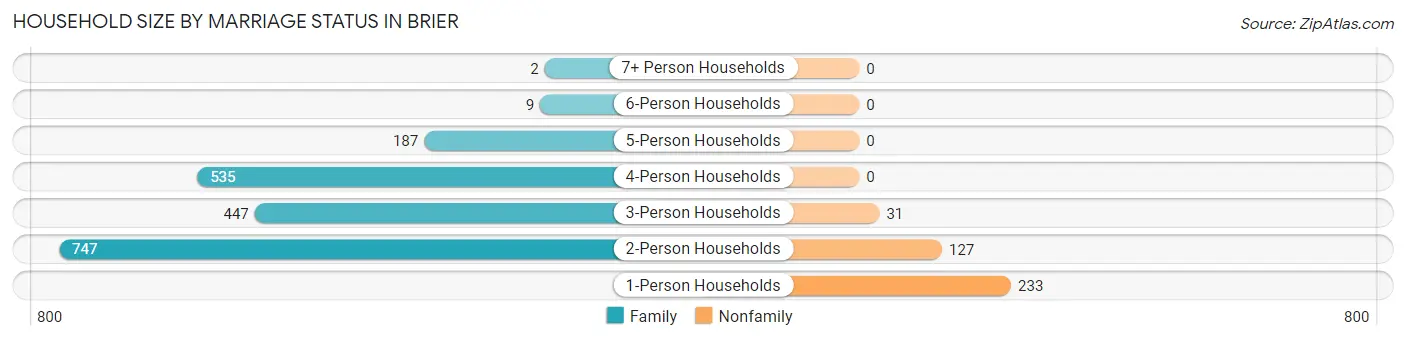
| Household Size | Family Households | Nonfamily Households |
| 1-Person Households | - | 233 (10.1%) |
| 2-Person Households | 747 (32.2%) | 127 (5.5%) |
| 3-Person Households | 447 (19.3%) | 31 (1.3%) |
| 4-Person Households | 535 (23.1%) | 0 (0.0%) |
| 5-Person Households | 187 (8.1%) | 0 (0.0%) |
| 6-Person Households | 9 (0.4%) | 0 (0.0%) |
| 7+ Person Households | 2 (0.1%) | 0 (0.0%) |
| Total | 1,927 (83.1%) | 391 (16.9%) |
Female Fertility in Brier
Fertility by Age in Brier
Average fertility rate in Brier is 34.0 births per 1,000 women. Women in the age bracket of 20 to 34 years have the highest fertility rate with 66.0 births per 1,000 women. Women in the age bracket of 20 to 34 years acount for 50.0% of all women with births.
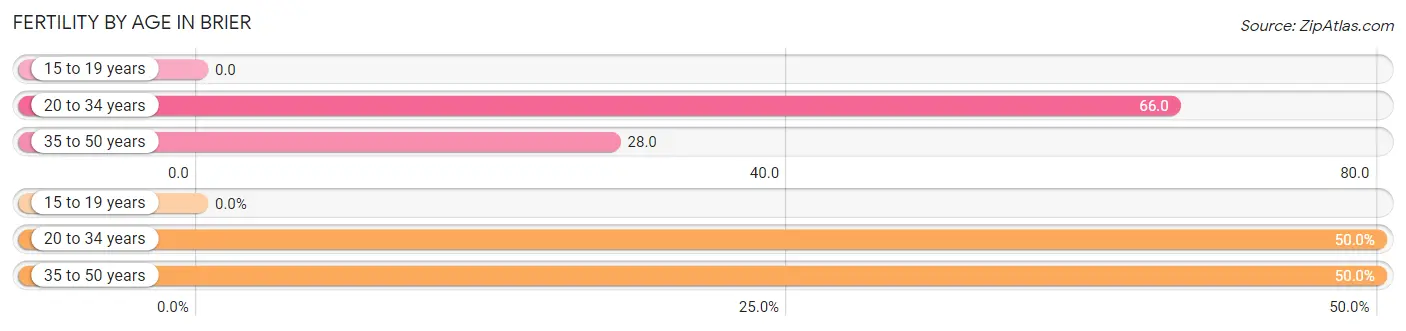
| Age Bracket | Women with Births | Births / 1,000 Women |
| 15 to 19 years | 0 (0.0%) | 0.0 |
| 20 to 34 years | 23 (50.0%) | 66.0 |
| 35 to 50 years | 23 (50.0%) | 28.0 |
| Total | 46 (100.0%) | 34.0 |
Fertility by Age by Marriage Status in Brier
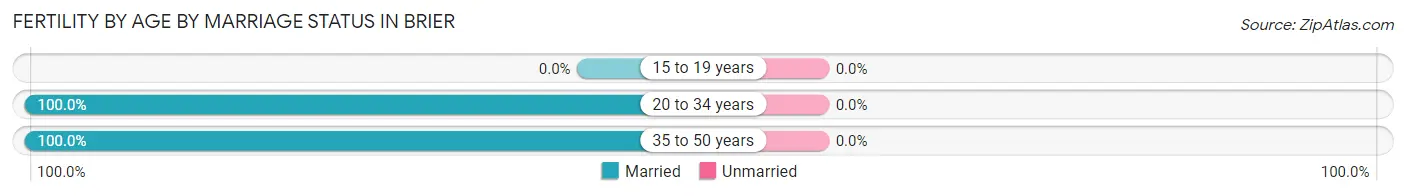
| Age Bracket | Married | Unmarried |
| 15 to 19 years | 0 (0.0%) | 0 (0.0%) |
| 20 to 34 years | 23 (100.0%) | 0 (0.0%) |
| 35 to 50 years | 23 (100.0%) | 0 (0.0%) |
| Total | 46 (100.0%) | 0 (0.0%) |
Fertility by Education in Brier
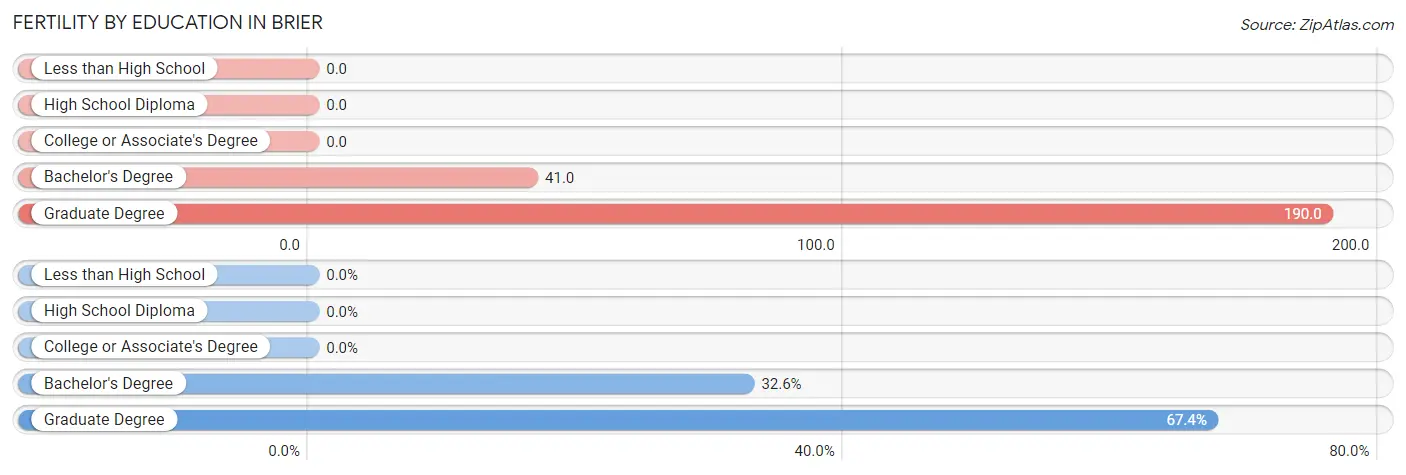
| Educational Attainment | Women with Births | Births / 1,000 Women |
| Less than High School | 0 (0.0%) | 0.0 |
| High School Diploma | 0 (0.0%) | 0.0 |
| College or Associate's Degree | 0 (0.0%) | 0.0 |
| Bachelor's Degree | 15 (32.6%) | 41.0 |
| Graduate Degree | 31 (67.4%) | 190.0 |
| Total | 46 (100.0%) | 34.0 |
Fertility by Education by Marriage Status in Brier
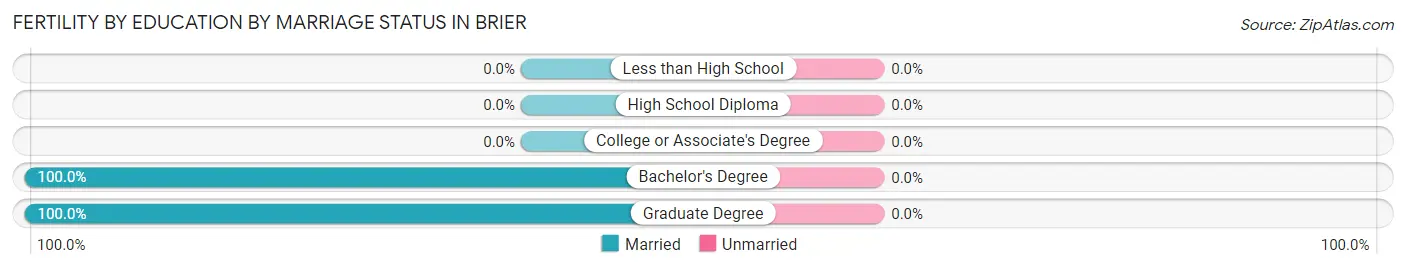
| Educational Attainment | Married | Unmarried |
| Less than High School | 0 (0.0%) | 0 (0.0%) |
| High School Diploma | 0 (0.0%) | 0 (0.0%) |
| College or Associate's Degree | 0 (0.0%) | 0 (0.0%) |
| Bachelor's Degree | 15 (100.0%) | 0 (0.0%) |
| Graduate Degree | 31 (100.0%) | 0 (0.0%) |
| Total | 46 (100.0%) | 0 (0.0%) |
Employment Characteristics in Brier
Employment by Class of Employer in Brier
Among the 3,255 employed individuals in Brier, private company employees (2,021 | 62.1%), not-for-profit organizations (321 | 9.9%), and state government employees (316 | 9.7%) make up the most common classes of employment.
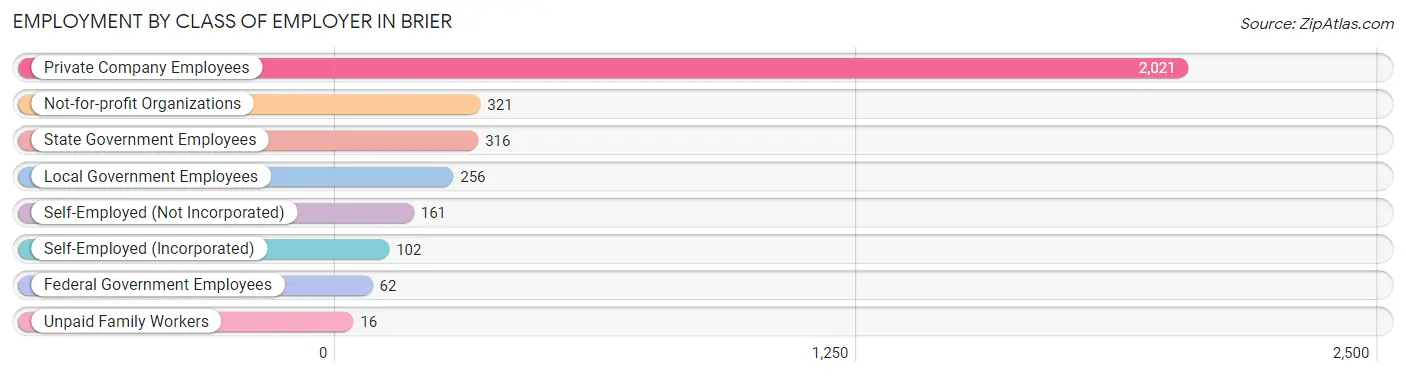
| Employer Class | # Employees | % Employees |
| Private Company Employees | 2,021 | 62.1% |
| Self-Employed (Incorporated) | 102 | 3.1% |
| Self-Employed (Not Incorporated) | 161 | 5.0% |
| Not-for-profit Organizations | 321 | 9.9% |
| Local Government Employees | 256 | 7.9% |
| State Government Employees | 316 | 9.7% |
| Federal Government Employees | 62 | 1.9% |
| Unpaid Family Workers | 16 | 0.5% |
| Total | 3,255 | 100.0% |
Employment Status by Age in Brier
According to the labor force statistics for Brier, out of the total population over 16 years of age (5,276), 65.7% or 3,466 individuals are in the labor force, with 5.0% or 173 of them unemployed. The age group with the highest labor force participation rate is 25 to 29 years, with 94.3% or 183 individuals in the labor force. Within the labor force, the 20 to 24 years age range has the highest percentage of unemployed individuals, with 22.9% or 57 of them being unemployed.
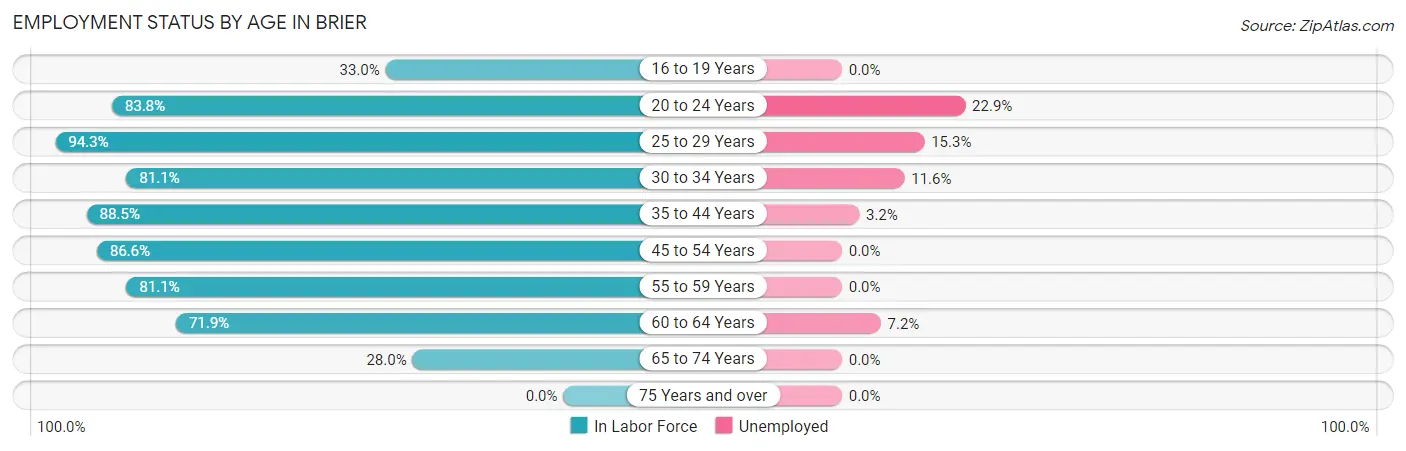
| Age Bracket | In Labor Force | Unemployed |
| 16 to 19 Years | 68 (33.0%) | 0 (0.0%) |
| 20 to 24 Years | 249 (83.8%) | 57 (22.9%) |
| 25 to 29 Years | 183 (94.3%) | 28 (15.3%) |
| 30 to 34 Years | 241 (81.1%) | 28 (11.6%) |
| 35 to 44 Years | 904 (88.5%) | 29 (3.2%) |
| 45 to 54 Years | 742 (86.6%) | 0 (0.0%) |
| 55 to 59 Years | 386 (81.1%) | 0 (0.0%) |
| 60 to 64 Years | 414 (71.9%) | 30 (7.2%) |
| 65 to 74 Years | 281 (28.0%) | 0 (0.0%) |
| 75 Years and over | 0 (0.0%) | 0 (0.0%) |
| Total | 3,466 (65.7%) | 173 (5.0%) |
Employment Status by Educational Attainment in Brier
According to labor force statistics for Brier, 83.9% of individuals (2,871) out of the total population between 25 and 64 years of age (3,422) are in the labor force, with 4.0% or 115 of them being unemployed. The group with the highest labor force participation rate are those with the educational attainment of bachelor's degree or higher, with 87.9% or 1,459 individuals in the labor force. Within the labor force, individuals with less than high school education have the highest percentage of unemployment, with 32.9% or 25 of them being unemployed.
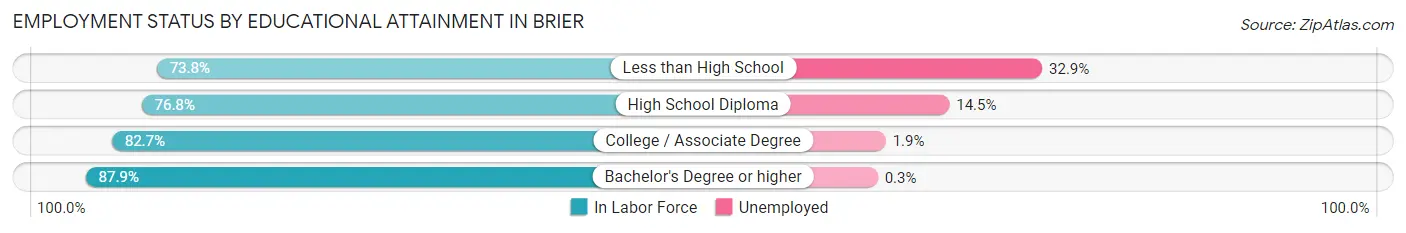
| Educational Attainment | In Labor Force | Unemployed |
| Less than High School | 76 (73.8%) | 34 (32.9%) |
| High School Diploma | 477 (76.8%) | 90 (14.5%) |
| College / Associate Degree | 858 (82.7%) | 20 (1.9%) |
| Bachelor's Degree or higher | 1,459 (87.9%) | 5 (0.3%) |
| Total | 2,871 (83.9%) | 137 (4.0%) |
Employment Occupations by Sex in Brier
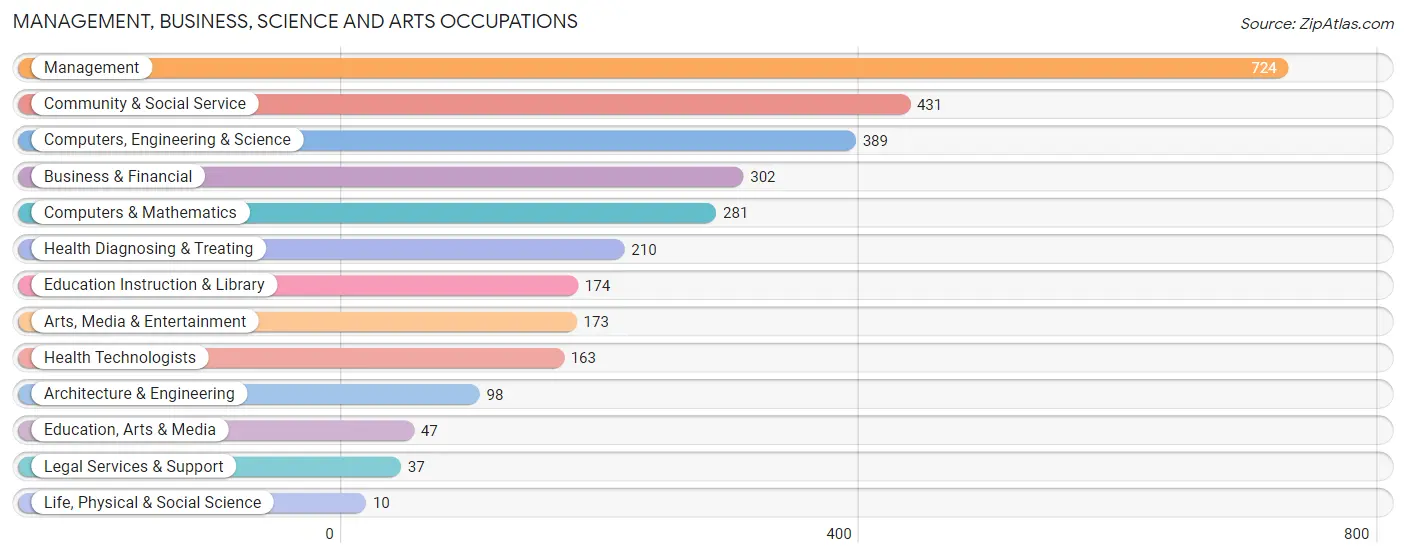
Management, Business, Science and Arts Occupations
The most common Management, Business, Science and Arts occupations in Brier are Management (724 | 22.0%), Community & Social Service (431 | 13.1%), Computers, Engineering & Science (389 | 11.8%), Business & Financial (302 | 9.2%), and Computers & Mathematics (281 | 8.5%).
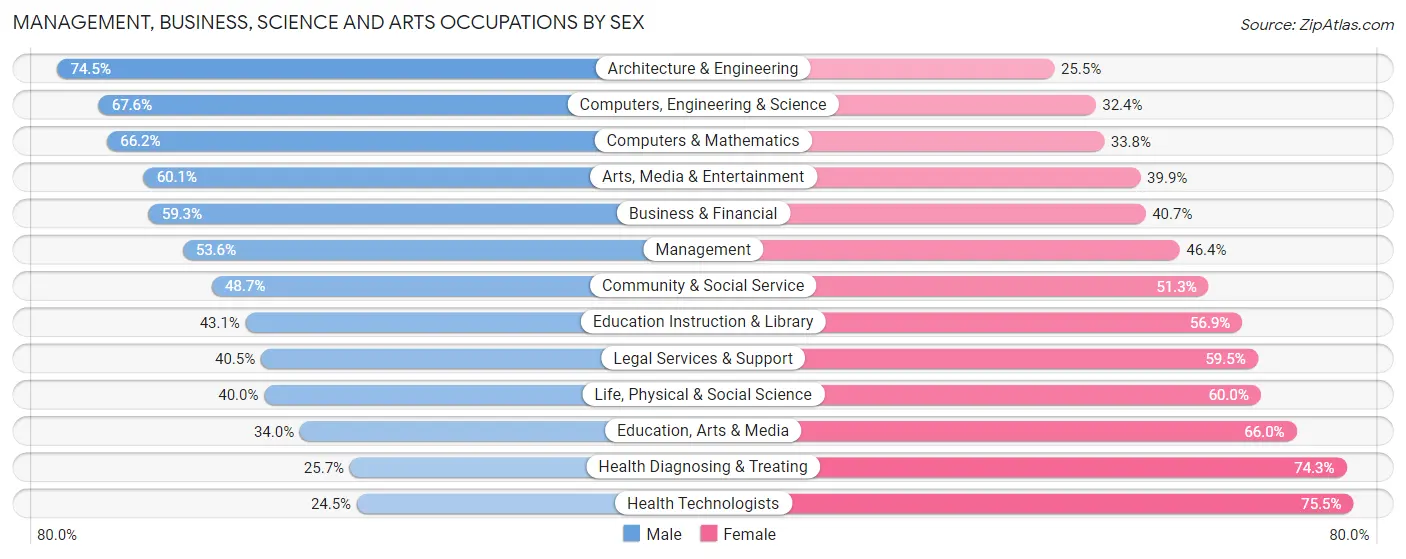
Management, Business, Science and Arts Occupations by Sex
Within the Management, Business, Science and Arts occupations in Brier, the most male-oriented occupations are Architecture & Engineering (74.5%), Computers, Engineering & Science (67.6%), and Computers & Mathematics (66.2%), while the most female-oriented occupations are Health Technologists (75.5%), Health Diagnosing & Treating (74.3%), and Education, Arts & Media (66.0%).
| Occupation | Male | Female |
| Management | 388 (53.6%) | 336 (46.4%) |
| Business & Financial | 179 (59.3%) | 123 (40.7%) |
| Computers, Engineering & Science | 263 (67.6%) | 126 (32.4%) |
| Computers & Mathematics | 186 (66.2%) | 95 (33.8%) |
| Architecture & Engineering | 73 (74.5%) | 25 (25.5%) |
| Life, Physical & Social Science | 4 (40.0%) | 6 (60.0%) |
| Community & Social Service | 210 (48.7%) | 221 (51.3%) |
| Education, Arts & Media | 16 (34.0%) | 31 (66.0%) |
| Legal Services & Support | 15 (40.5%) | 22 (59.5%) |
| Education Instruction & Library | 75 (43.1%) | 99 (56.9%) |
| Arts, Media & Entertainment | 104 (60.1%) | 69 (39.9%) |
| Health Diagnosing & Treating | 54 (25.7%) | 156 (74.3%) |
| Health Technologists | 40 (24.5%) | 123 (75.5%) |
| Total (Category) | 1,094 (53.2%) | 962 (46.8%) |
| Total (Overall) | 1,761 (53.4%) | 1,535 (46.6%) |
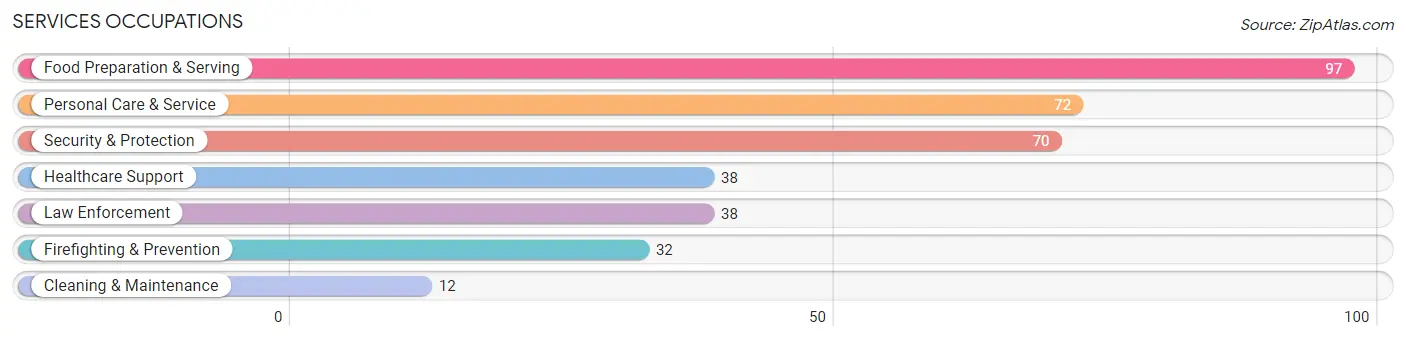
Services Occupations
The most common Services occupations in Brier are Food Preparation & Serving (97 | 2.9%), Personal Care & Service (72 | 2.2%), Security & Protection (70 | 2.1%), Healthcare Support (38 | 1.1%), and Law Enforcement (38 | 1.1%).
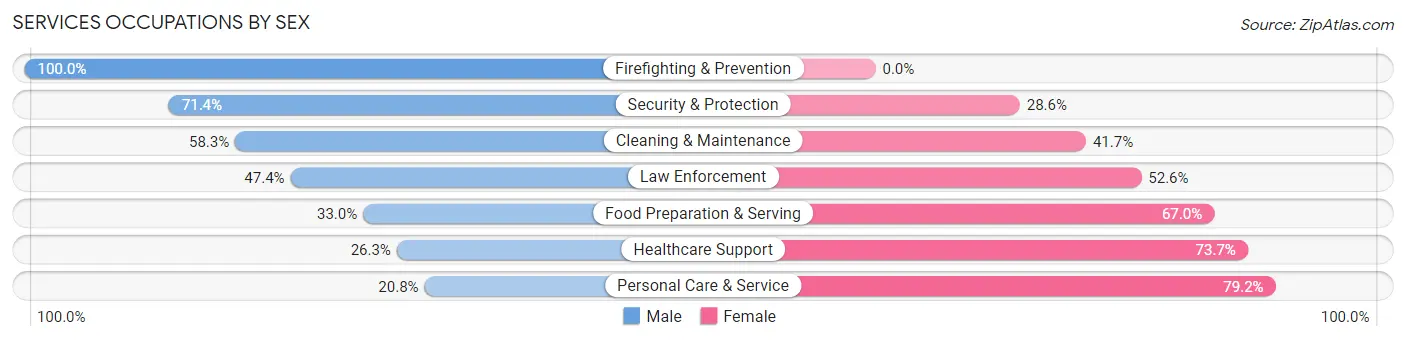
Services Occupations by Sex
Within the Services occupations in Brier, the most male-oriented occupations are Firefighting & Prevention (100.0%), Security & Protection (71.4%), and Cleaning & Maintenance (58.3%), while the most female-oriented occupations are Personal Care & Service (79.2%), Healthcare Support (73.7%), and Food Preparation & Serving (67.0%).
| Occupation | Male | Female |
| Healthcare Support | 10 (26.3%) | 28 (73.7%) |
| Security & Protection | 50 (71.4%) | 20 (28.6%) |
| Firefighting & Prevention | 32 (100.0%) | 0 (0.0%) |
| Law Enforcement | 18 (47.4%) | 20 (52.6%) |
| Food Preparation & Serving | 32 (33.0%) | 65 (67.0%) |
| Cleaning & Maintenance | 7 (58.3%) | 5 (41.7%) |
| Personal Care & Service | 15 (20.8%) | 57 (79.2%) |
| Total (Category) | 114 (39.5%) | 175 (60.6%) |
| Total (Overall) | 1,761 (53.4%) | 1,535 (46.6%) |
Sales and Office Occupations
The most common Sales and Office occupations in Brier are Sales & Related (310 | 9.4%), and Office & Administration (220 | 6.7%).
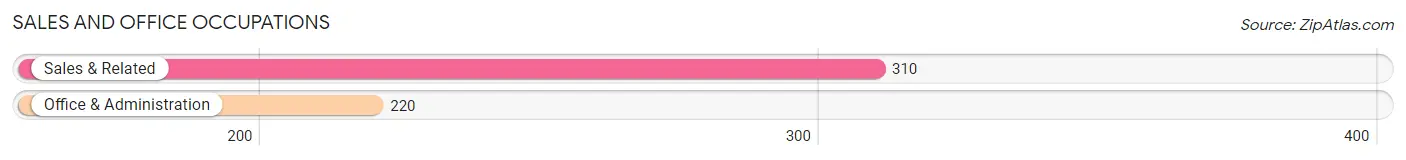
Sales and Office Occupations by Sex
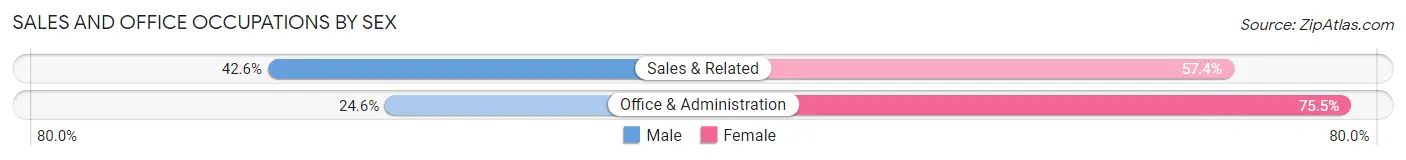
| Occupation | Male | Female |
| Sales & Related | 132 (42.6%) | 178 (57.4%) |
| Office & Administration | 54 (24.5%) | 166 (75.4%) |
| Total (Category) | 186 (35.1%) | 344 (64.9%) |
| Total (Overall) | 1,761 (53.4%) | 1,535 (46.6%) |
Natural Resources, Construction and Maintenance Occupations
The most common Natural Resources, Construction and Maintenance occupations in Brier are Construction & Extraction (96 | 2.9%), Installation, Maintenance & Repair (53 | 1.6%), and Farming, Fishing & Forestry (11 | 0.3%).
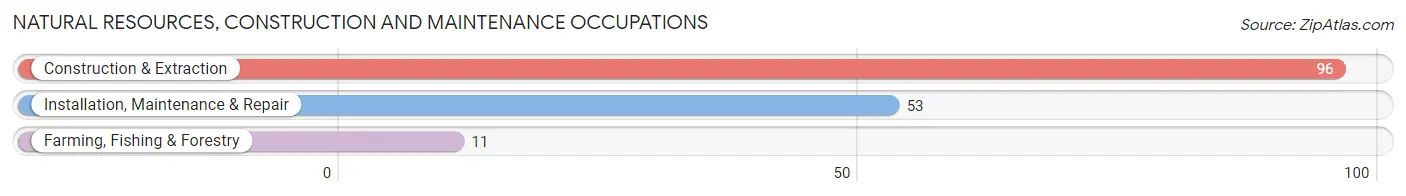
Natural Resources, Construction and Maintenance Occupations by Sex
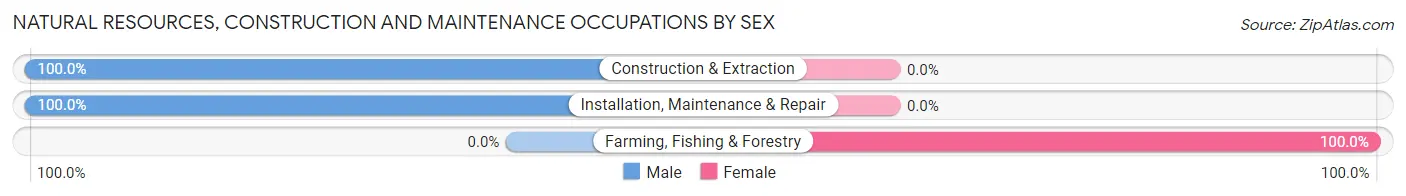
| Occupation | Male | Female |
| Farming, Fishing & Forestry | 0 (0.0%) | 11 (100.0%) |
| Construction & Extraction | 96 (100.0%) | 0 (0.0%) |
| Installation, Maintenance & Repair | 53 (100.0%) | 0 (0.0%) |
| Total (Category) | 149 (93.1%) | 11 (6.9%) |
| Total (Overall) | 1,761 (53.4%) | 1,535 (46.6%) |
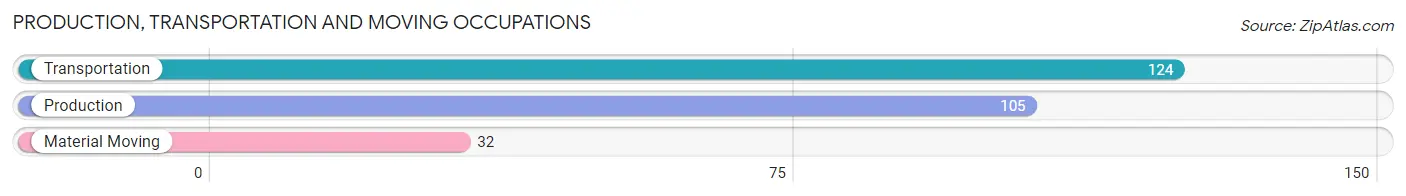
Production, Transportation and Moving Occupations
The most common Production, Transportation and Moving occupations in Brier are Transportation (124 | 3.8%), Production (105 | 3.2%), and Material Moving (32 | 1.0%).
Production, Transportation and Moving Occupations by Sex
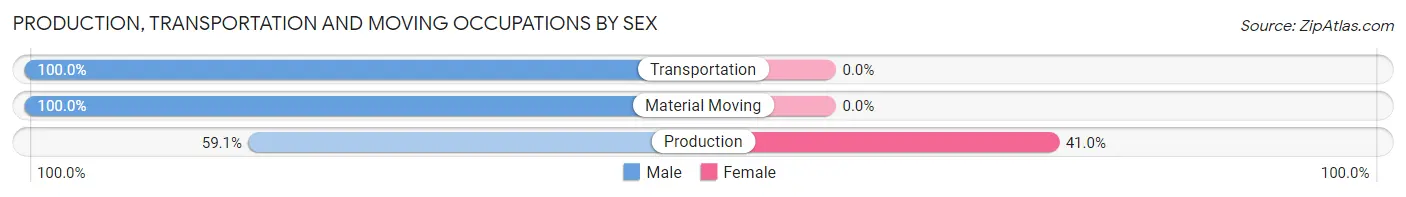
| Occupation | Male | Female |
| Production | 62 (59.1%) | 43 (40.9%) |
| Transportation | 124 (100.0%) | 0 (0.0%) |
| Material Moving | 32 (100.0%) | 0 (0.0%) |
| Total (Category) | 218 (83.5%) | 43 (16.5%) |
| Total (Overall) | 1,761 (53.4%) | 1,535 (46.6%) |
Employment Industries by Sex in Brier
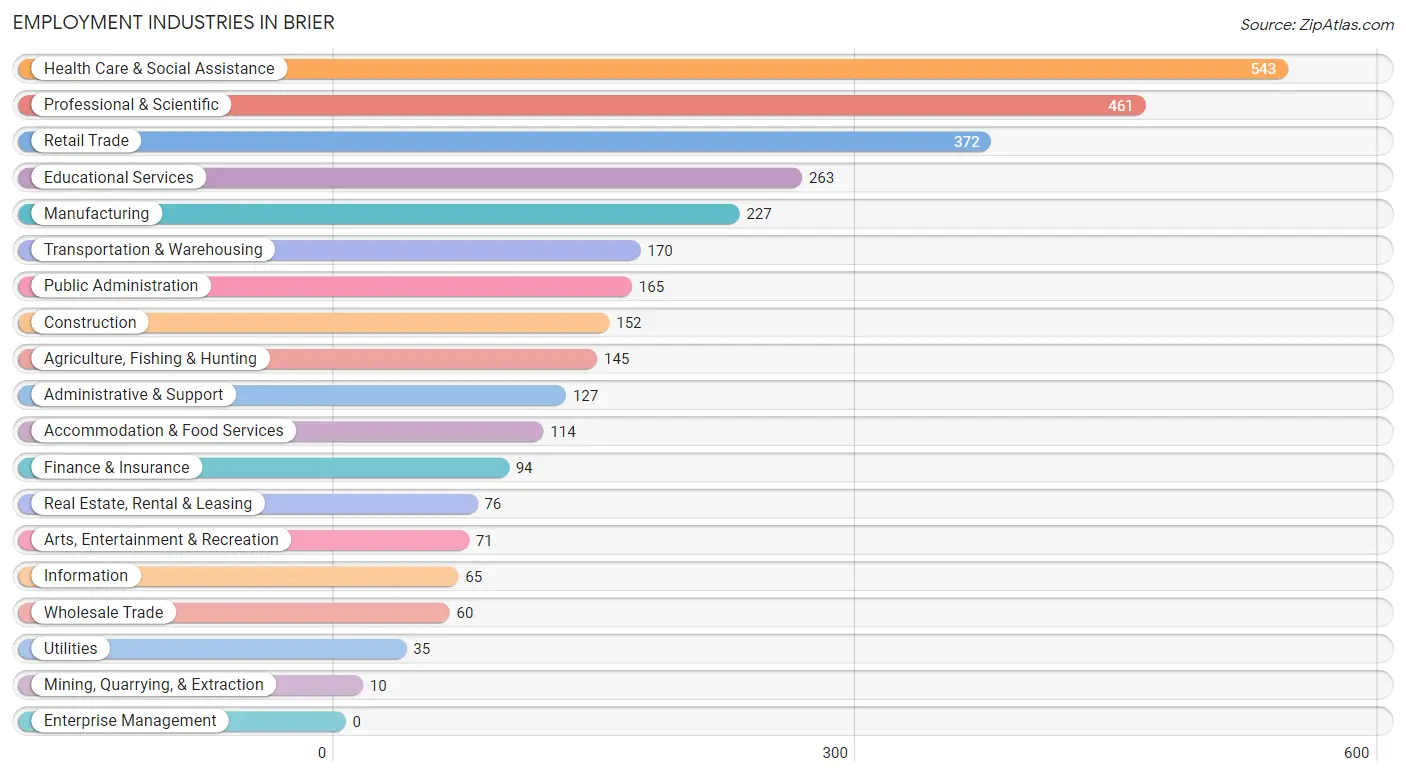
Employment Industries in Brier
The major employment industries in Brier include Health Care & Social Assistance (543 | 16.5%), Professional & Scientific (461 | 14.0%), Retail Trade (372 | 11.3%), Educational Services (263 | 8.0%), and Manufacturing (227 | 6.9%).
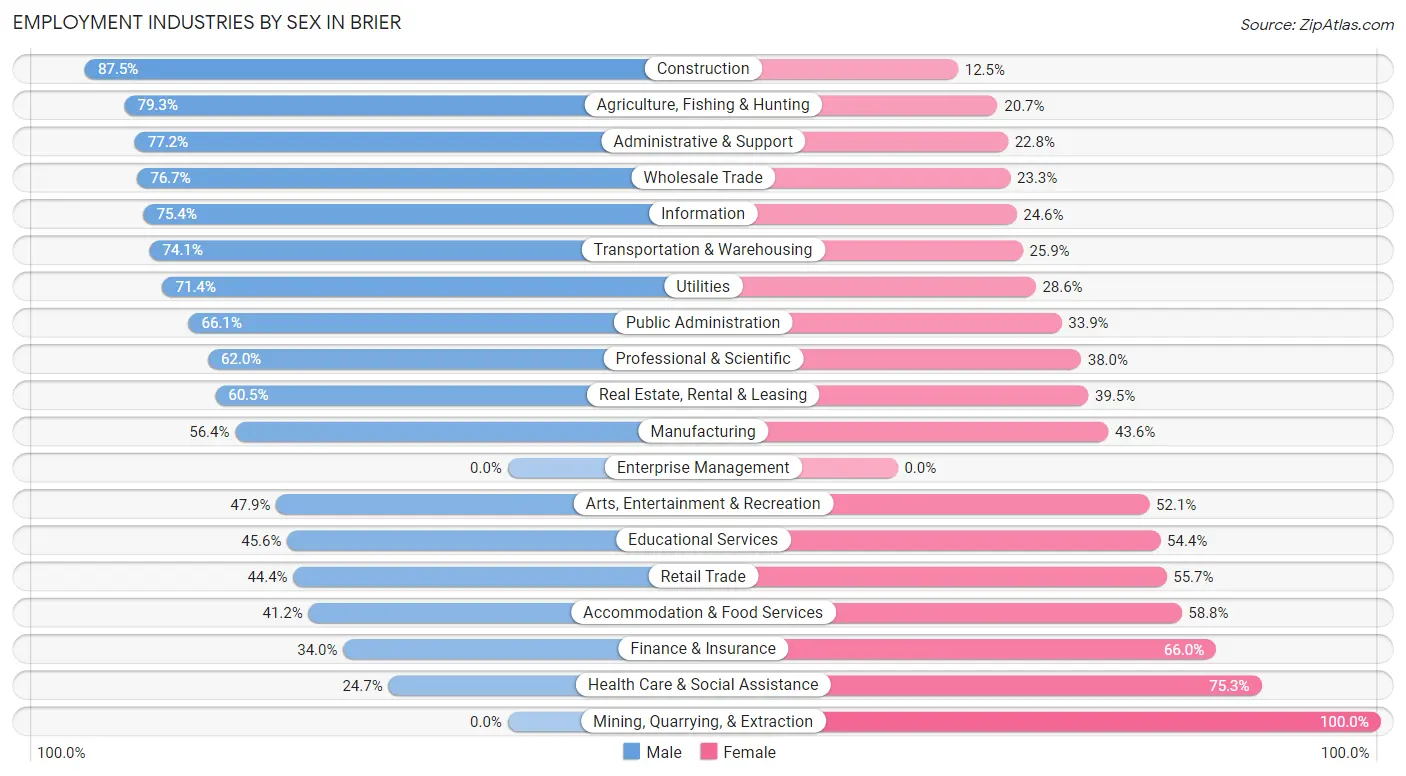
Employment Industries by Sex in Brier
The Brier industries that see more men than women are Construction (87.5%), Agriculture, Fishing & Hunting (79.3%), and Administrative & Support (77.2%), whereas the industries that tend to have a higher number of women are Mining, Quarrying, & Extraction (100.0%), Health Care & Social Assistance (75.3%), and Finance & Insurance (66.0%).
| Industry | Male | Female |
| Agriculture, Fishing & Hunting | 115 (79.3%) | 30 (20.7%) |
| Mining, Quarrying, & Extraction | 0 (0.0%) | 10 (100.0%) |
| Construction | 133 (87.5%) | 19 (12.5%) |
| Manufacturing | 128 (56.4%) | 99 (43.6%) |
| Wholesale Trade | 46 (76.7%) | 14 (23.3%) |
| Retail Trade | 165 (44.4%) | 207 (55.6%) |
| Transportation & Warehousing | 126 (74.1%) | 44 (25.9%) |
| Utilities | 25 (71.4%) | 10 (28.6%) |
| Information | 49 (75.4%) | 16 (24.6%) |
| Finance & Insurance | 32 (34.0%) | 62 (66.0%) |
| Real Estate, Rental & Leasing | 46 (60.5%) | 30 (39.5%) |
| Professional & Scientific | 286 (62.0%) | 175 (38.0%) |
| Enterprise Management | 0 (0.0%) | 0 (0.0%) |
| Administrative & Support | 98 (77.2%) | 29 (22.8%) |
| Educational Services | 120 (45.6%) | 143 (54.4%) |
| Health Care & Social Assistance | 134 (24.7%) | 409 (75.3%) |
| Arts, Entertainment & Recreation | 34 (47.9%) | 37 (52.1%) |
| Accommodation & Food Services | 47 (41.2%) | 67 (58.8%) |
| Public Administration | 109 (66.1%) | 56 (33.9%) |
| Total | 1,761 (53.4%) | 1,535 (46.6%) |
Education in Brier
School Enrollment in Brier
The most common levels of schooling among the 1,365 students in Brier are middle school (341 | 25.0%), elementary school (332 | 24.3%), and college / undergraduate (260 | 19.1%).
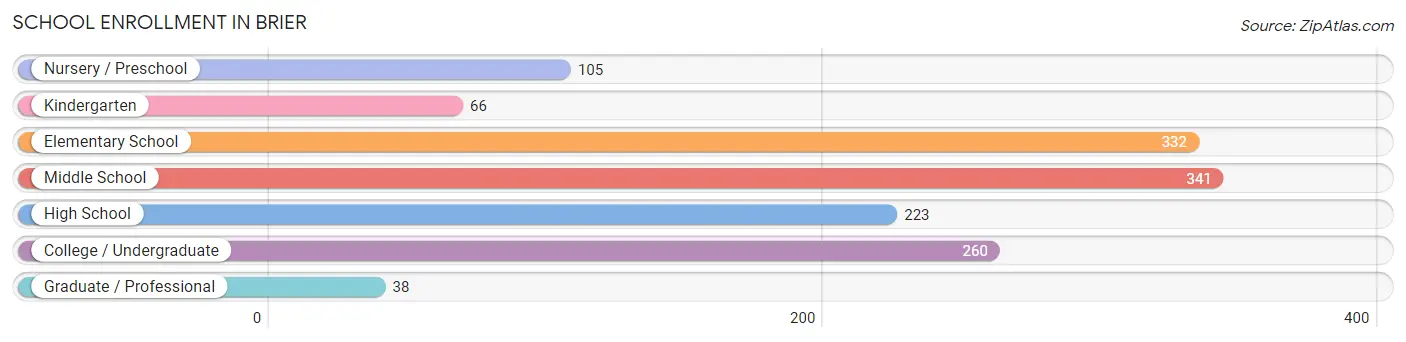
| School Level | # Students | % Students |
| Nursery / Preschool | 105 | 7.7% |
| Kindergarten | 66 | 4.8% |
| Elementary School | 332 | 24.3% |
| Middle School | 341 | 25.0% |
| High School | 223 | 16.3% |
| College / Undergraduate | 260 | 19.1% |
| Graduate / Professional | 38 | 2.8% |
| Total | 1,365 | 100.0% |
School Enrollment by Age by Funding Source in Brier
Out of a total of 1,365 students who are enrolled in schools in Brier, 207 (15.2%) attend a private institution, while the remaining 1,158 (84.8%) are enrolled in public schools. The age group of 3 to 4 year olds has the highest likelihood of being enrolled in private schools, with 50 (64.1% in the age bracket) enrolled. Conversely, the age group of 18 to 19 year olds has the lowest likelihood of being enrolled in a private school, with 91 (100.0% in the age bracket) attending a public institution.
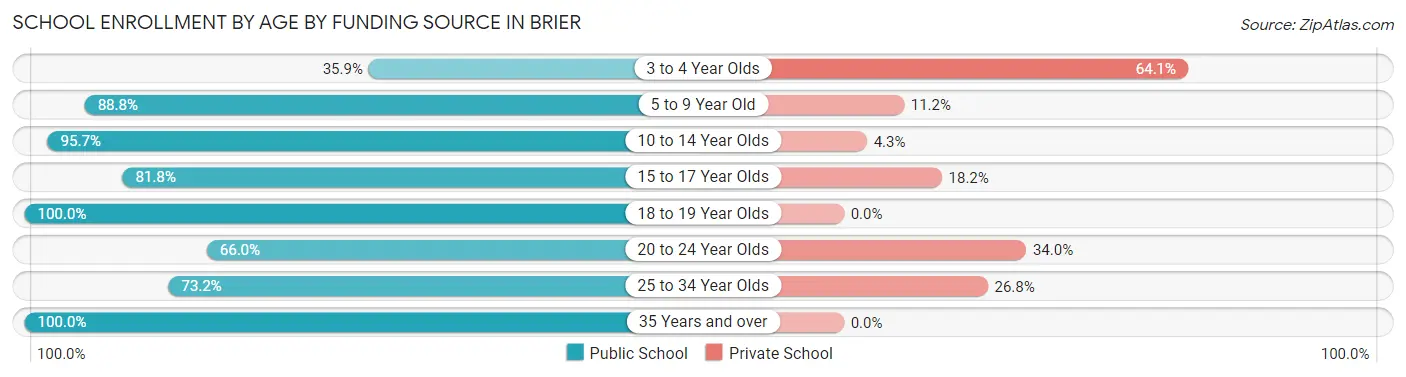
| Age Bracket | Public School | Private School |
| 3 to 4 Year Olds | 28 (35.9%) | 50 (64.1%) |
| 5 to 9 Year Old | 333 (88.8%) | 42 (11.2%) |
| 10 to 14 Year Olds | 423 (95.7%) | 19 (4.3%) |
| 15 to 17 Year Olds | 121 (81.8%) | 27 (18.2%) |
| 18 to 19 Year Olds | 91 (100.0%) | 0 (0.0%) |
| 20 to 24 Year Olds | 105 (66.0%) | 54 (34.0%) |
| 25 to 34 Year Olds | 41 (73.2%) | 15 (26.8%) |
| 35 Years and over | 16 (100.0%) | 0 (0.0%) |
| Total | 1,158 (84.8%) | 207 (15.2%) |
Educational Attainment by Field of Study in Brier
Business (458 | 18.7%), engineering (250 | 10.2%), science & technology (197 | 8.1%), social sciences (191 | 7.8%), and liberal arts & history (182 | 7.4%) are the most common fields of study among 2,448 individuals in Brier who have obtained a bachelor's degree or higher.
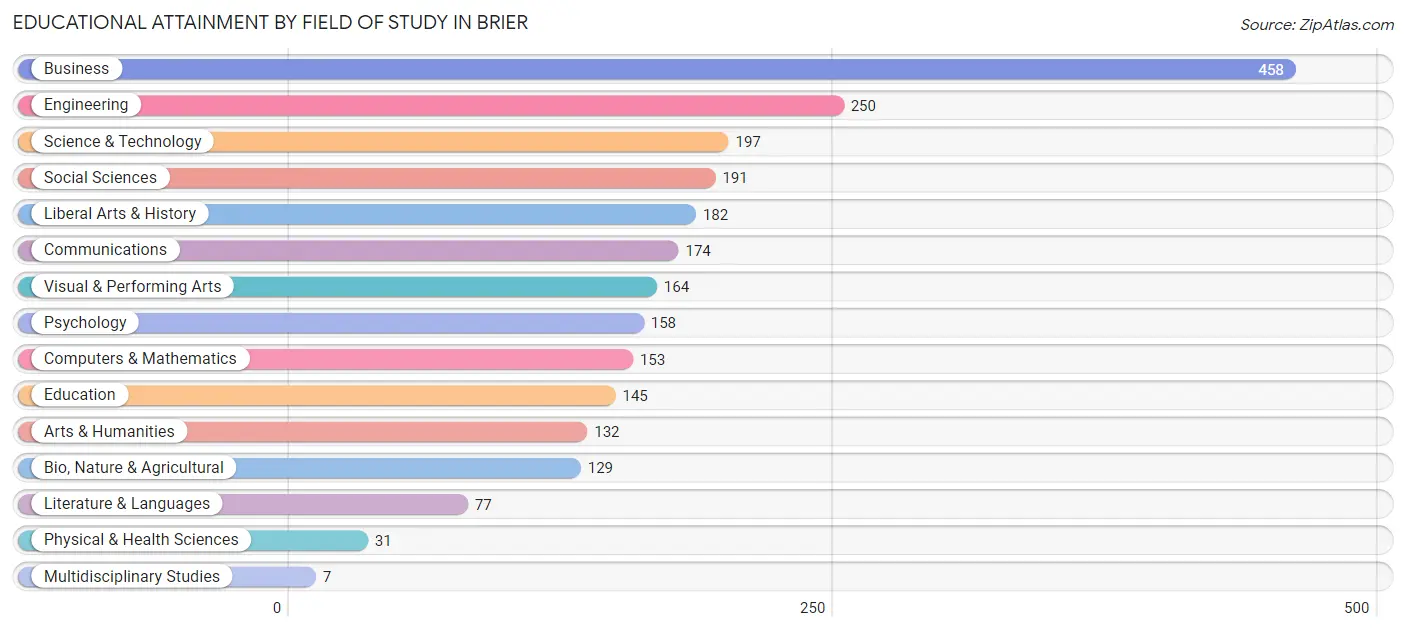
| Field of Study | # Graduates | % Graduates |
| Computers & Mathematics | 153 | 6.2% |
| Bio, Nature & Agricultural | 129 | 5.3% |
| Physical & Health Sciences | 31 | 1.3% |
| Psychology | 158 | 6.5% |
| Social Sciences | 191 | 7.8% |
| Engineering | 250 | 10.2% |
| Multidisciplinary Studies | 7 | 0.3% |
| Science & Technology | 197 | 8.1% |
| Business | 458 | 18.7% |
| Education | 145 | 5.9% |
| Literature & Languages | 77 | 3.2% |
| Liberal Arts & History | 182 | 7.4% |
| Visual & Performing Arts | 164 | 6.7% |
| Communications | 174 | 7.1% |
| Arts & Humanities | 132 | 5.4% |
| Total | 2,448 | 100.0% |
Transportation & Commute in Brier
Vehicle Availability by Sex in Brier
The most prevalent vehicle ownership categories in Brier are males with 2 vehicles (716, accounting for 40.7%) and females with 2 vehicles (484, making up 48.1%).
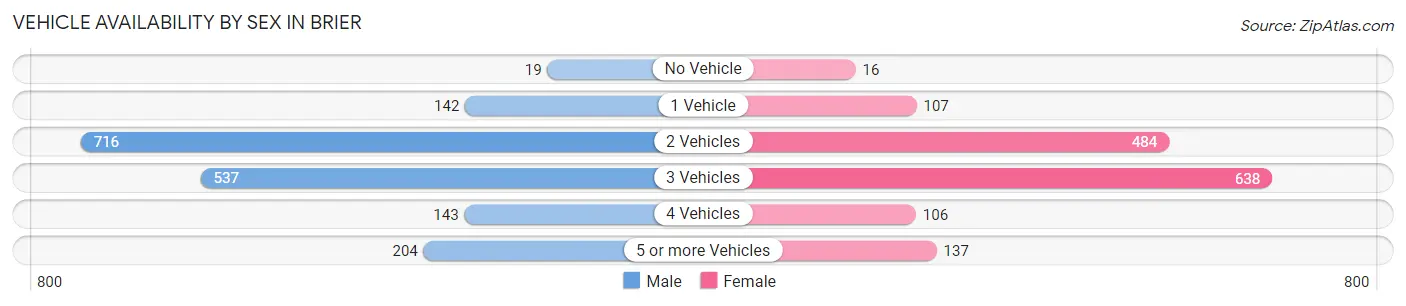
| Vehicles Available | Male | Female |
| No Vehicle | 19 (1.1%) | 16 (1.1%) |
| 1 Vehicle | 142 (8.1%) | 107 (7.2%) |
| 2 Vehicles | 716 (40.7%) | 484 (32.5%) |
| 3 Vehicles | 537 (30.5%) | 638 (42.9%) |
| 4 Vehicles | 143 (8.1%) | 106 (7.1%) |
| 5 or more Vehicles | 204 (11.6%) | 137 (9.2%) |
| Total | 1,761 (100.0%) | 1,488 (100.0%) |
Commute Time in Brier
The most frequently occuring commute durations in Brier are 30 to 34 minutes (484 commuters, 18.7%), 20 to 24 minutes (456 commuters, 17.6%), and 15 to 19 minutes (361 commuters, 14.0%).
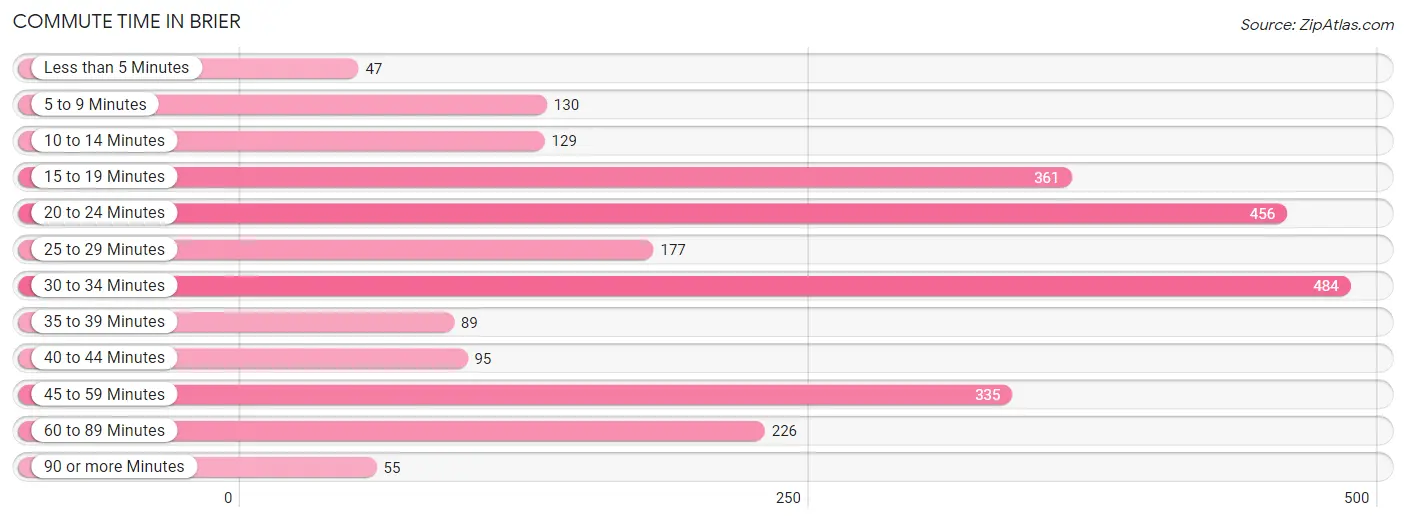
| Commute Time | # Commuters | % Commuters |
| Less than 5 Minutes | 47 | 1.8% |
| 5 to 9 Minutes | 130 | 5.0% |
| 10 to 14 Minutes | 129 | 5.0% |
| 15 to 19 Minutes | 361 | 14.0% |
| 20 to 24 Minutes | 456 | 17.6% |
| 25 to 29 Minutes | 177 | 6.9% |
| 30 to 34 Minutes | 484 | 18.7% |
| 35 to 39 Minutes | 89 | 3.4% |
| 40 to 44 Minutes | 95 | 3.7% |
| 45 to 59 Minutes | 335 | 13.0% |
| 60 to 89 Minutes | 226 | 8.7% |
| 90 or more Minutes | 55 | 2.1% |
Commute Time by Sex in Brier
The most common commute times in Brier are 45 to 59 minutes (237 commuters, 17.6%) for males and 30 to 34 minutes (286 commuters, 23.1%) for females.
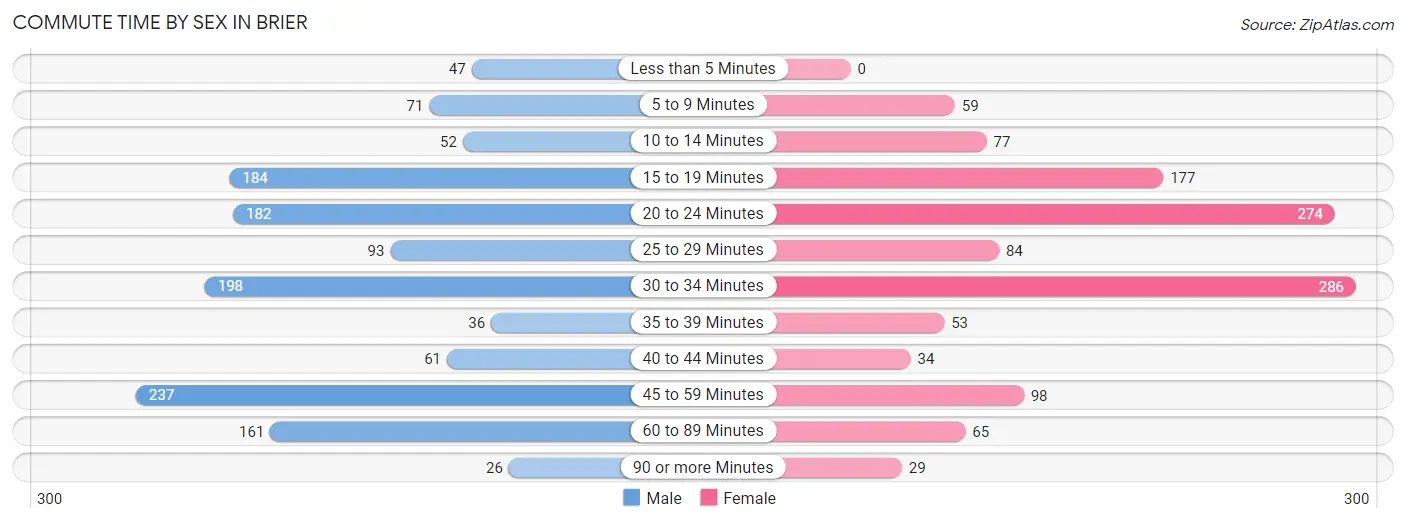
| Commute Time | Male | Female |
| Less than 5 Minutes | 47 (3.5%) | 0 (0.0%) |
| 5 to 9 Minutes | 71 (5.3%) | 59 (4.8%) |
| 10 to 14 Minutes | 52 (3.9%) | 77 (6.2%) |
| 15 to 19 Minutes | 184 (13.7%) | 177 (14.3%) |
| 20 to 24 Minutes | 182 (13.5%) | 274 (22.2%) |
| 25 to 29 Minutes | 93 (6.9%) | 84 (6.8%) |
| 30 to 34 Minutes | 198 (14.7%) | 286 (23.1%) |
| 35 to 39 Minutes | 36 (2.7%) | 53 (4.3%) |
| 40 to 44 Minutes | 61 (4.5%) | 34 (2.8%) |
| 45 to 59 Minutes | 237 (17.6%) | 98 (7.9%) |
| 60 to 89 Minutes | 161 (11.9%) | 65 (5.3%) |
| 90 or more Minutes | 26 (1.9%) | 29 (2.4%) |
Time of Departure to Work by Sex in Brier
The most frequent times of departure to work in Brier are 7:30 AM to 7:59 AM (194, 14.4%) for males and 8:00 AM to 8:29 AM (274, 22.2%) for females.
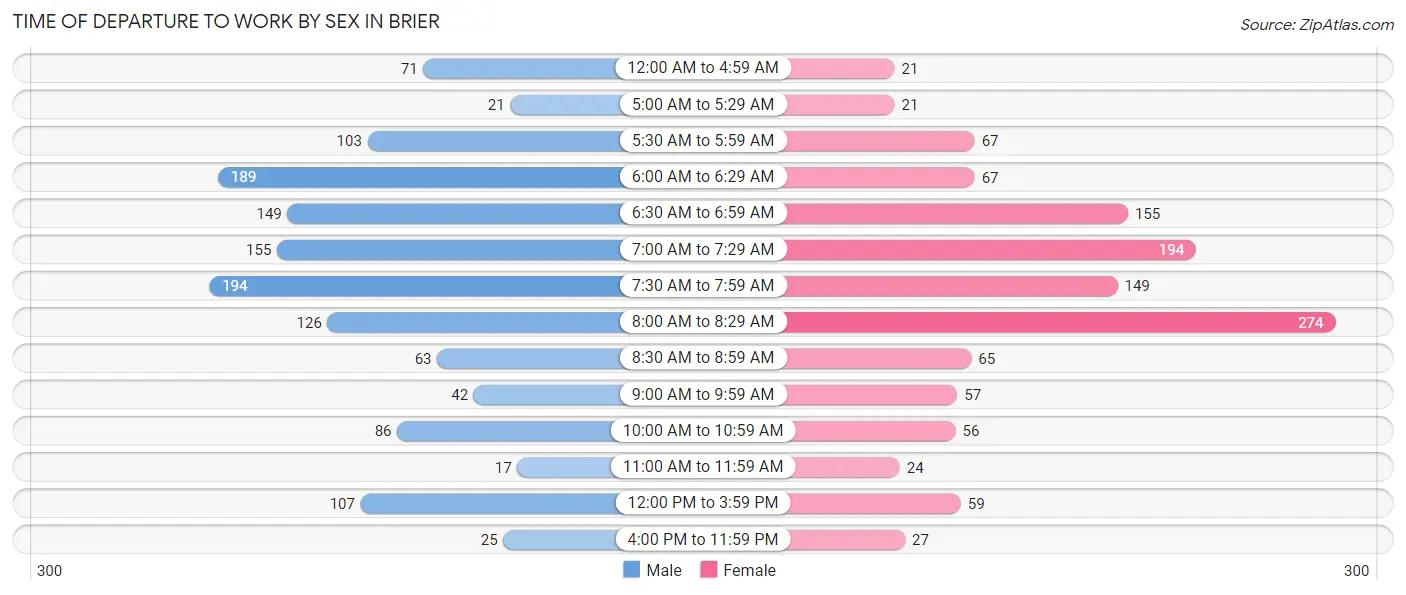
| Time of Departure | Male | Female |
| 12:00 AM to 4:59 AM | 71 (5.3%) | 21 (1.7%) |
| 5:00 AM to 5:29 AM | 21 (1.6%) | 21 (1.7%) |
| 5:30 AM to 5:59 AM | 103 (7.6%) | 67 (5.4%) |
| 6:00 AM to 6:29 AM | 189 (14.0%) | 67 (5.4%) |
| 6:30 AM to 6:59 AM | 149 (11.1%) | 155 (12.5%) |
| 7:00 AM to 7:29 AM | 155 (11.5%) | 194 (15.7%) |
| 7:30 AM to 7:59 AM | 194 (14.4%) | 149 (12.1%) |
| 8:00 AM to 8:29 AM | 126 (9.3%) | 274 (22.2%) |
| 8:30 AM to 8:59 AM | 63 (4.7%) | 65 (5.3%) |
| 9:00 AM to 9:59 AM | 42 (3.1%) | 57 (4.6%) |
| 10:00 AM to 10:59 AM | 86 (6.4%) | 56 (4.5%) |
| 11:00 AM to 11:59 AM | 17 (1.3%) | 24 (1.9%) |
| 12:00 PM to 3:59 PM | 107 (7.9%) | 59 (4.8%) |
| 4:00 PM to 11:59 PM | 25 (1.8%) | 27 (2.2%) |
| Total | 1,348 (100.0%) | 1,236 (100.0%) |
Housing Occupancy in Brier
Occupancy by Ownership in Brier
Of the total 2,318 dwellings in Brier, owner-occupied units account for 2,132 (92.0%), while renter-occupied units make up 186 (8.0%).
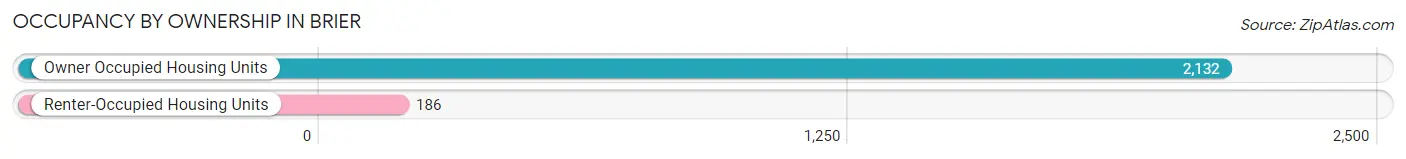
| Occupancy | # Housing Units | % Housing Units |
| Owner Occupied Housing Units | 2,132 | 92.0% |
| Renter-Occupied Housing Units | 186 | 8.0% |
| Total Occupied Housing Units | 2,318 | 100.0% |
Occupancy by Household Size in Brier
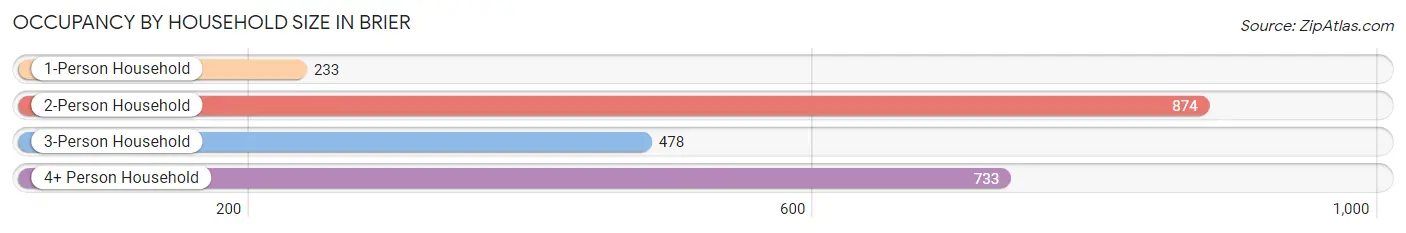
| Household Size | # Housing Units | % Housing Units |
| 1-Person Household | 233 | 10.1% |
| 2-Person Household | 874 | 37.7% |
| 3-Person Household | 478 | 20.6% |
| 4+ Person Household | 733 | 31.6% |
| Total Housing Units | 2,318 | 100.0% |
Occupancy by Ownership by Household Size in Brier
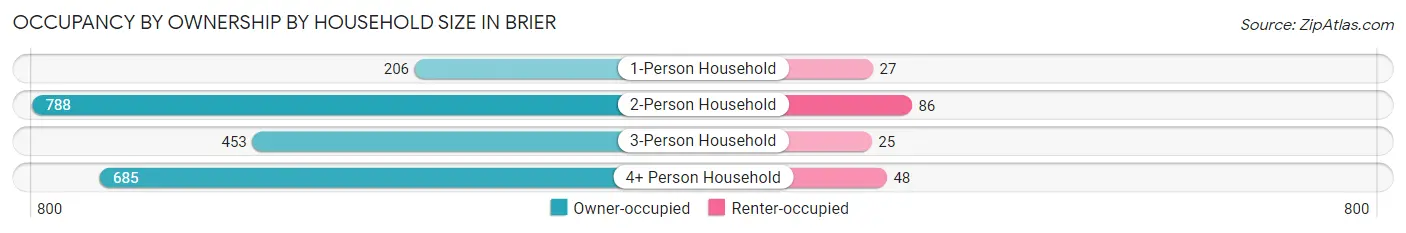
| Household Size | Owner-occupied | Renter-occupied |
| 1-Person Household | 206 (88.4%) | 27 (11.6%) |
| 2-Person Household | 788 (90.2%) | 86 (9.8%) |
| 3-Person Household | 453 (94.8%) | 25 (5.2%) |
| 4+ Person Household | 685 (93.4%) | 48 (6.6%) |
| Total Housing Units | 2,132 (92.0%) | 186 (8.0%) |
Occupancy by Educational Attainment in Brier
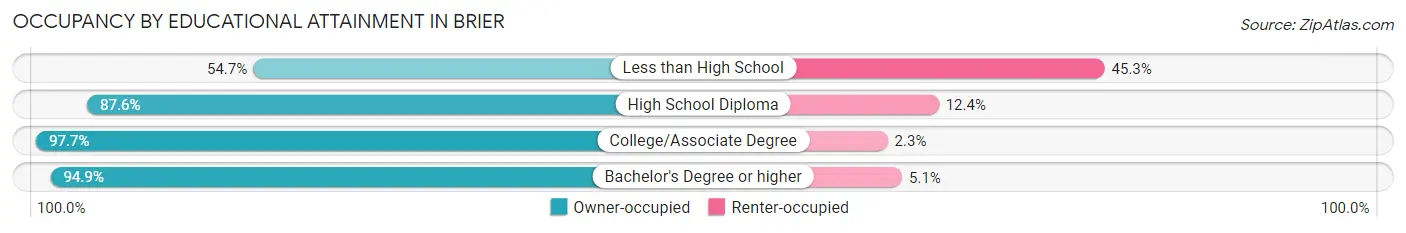
| Household Size | Owner-occupied | Renter-occupied |
| Less than High School | 93 (54.7%) | 77 (45.3%) |
| High School Diploma | 226 (87.6%) | 32 (12.4%) |
| College/Associate Degree | 687 (97.7%) | 16 (2.3%) |
| Bachelor's Degree or higher | 1,126 (94.9%) | 61 (5.1%) |
Occupancy by Age of Householder in Brier
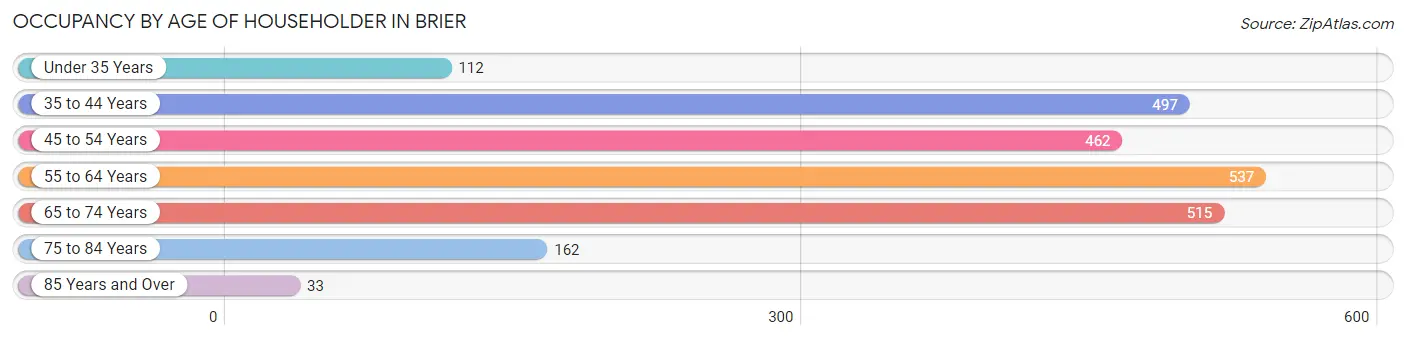
| Age Bracket | # Households | % Households |
| Under 35 Years | 112 | 4.8% |
| 35 to 44 Years | 497 | 21.4% |
| 45 to 54 Years | 462 | 19.9% |
| 55 to 64 Years | 537 | 23.2% |
| 65 to 74 Years | 515 | 22.2% |
| 75 to 84 Years | 162 | 7.0% |
| 85 Years and Over | 33 | 1.4% |
| Total | 2,318 | 100.0% |
Housing Finances in Brier
Median Income by Occupancy in Brier
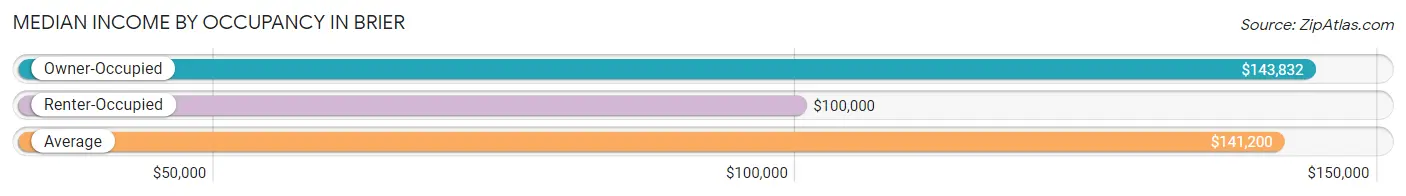
| Occupancy Type | # Households | Median Income |
| Owner-Occupied | 2,132 (92.0%) | $143,832 |
| Renter-Occupied | 186 (8.0%) | $100,000 |
| Average | 2,318 (100.0%) | $141,200 |
Occupancy by Householder Income Bracket in Brier
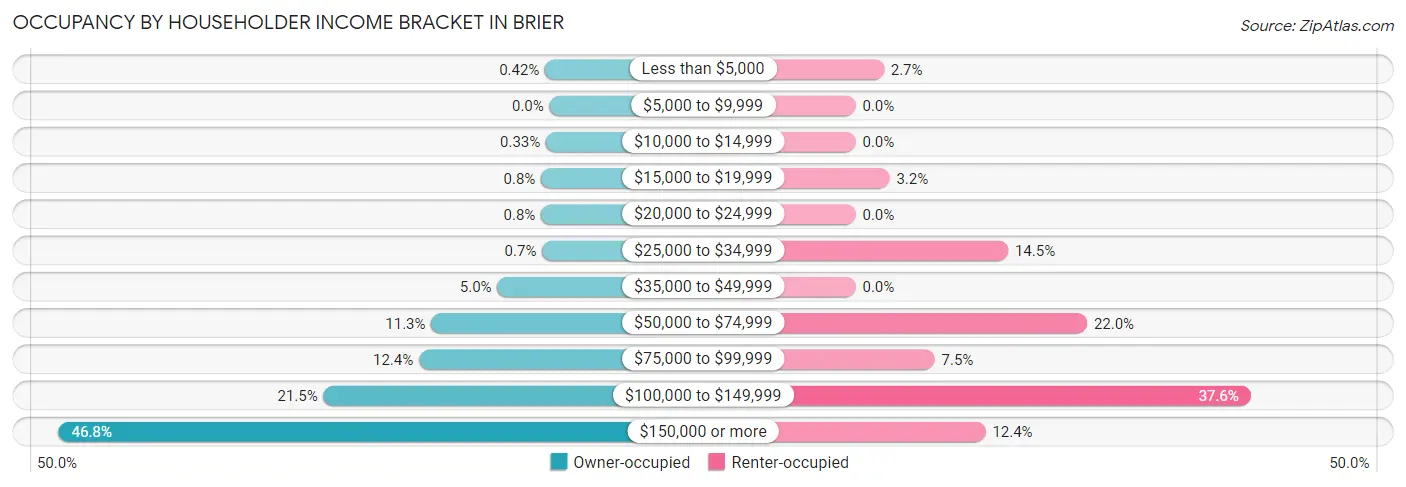
| Income Bracket | Owner-occupied | Renter-occupied |
| Less than $5,000 | 9 (0.4%) | 5 (2.7%) |
| $5,000 to $9,999 | 0 (0.0%) | 0 (0.0%) |
| $10,000 to $14,999 | 7 (0.3%) | 0 (0.0%) |
| $15,000 to $19,999 | 17 (0.8%) | 6 (3.2%) |
| $20,000 to $24,999 | 17 (0.8%) | 0 (0.0%) |
| $25,000 to $34,999 | 15 (0.7%) | 27 (14.5%) |
| $35,000 to $49,999 | 106 (5.0%) | 0 (0.0%) |
| $50,000 to $74,999 | 240 (11.3%) | 41 (22.0%) |
| $75,000 to $99,999 | 265 (12.4%) | 14 (7.5%) |
| $100,000 to $149,999 | 459 (21.5%) | 70 (37.6%) |
| $150,000 or more | 997 (46.8%) | 23 (12.4%) |
| Total | 2,132 (100.0%) | 186 (100.0%) |
Monthly Housing Cost Tiers in Brier
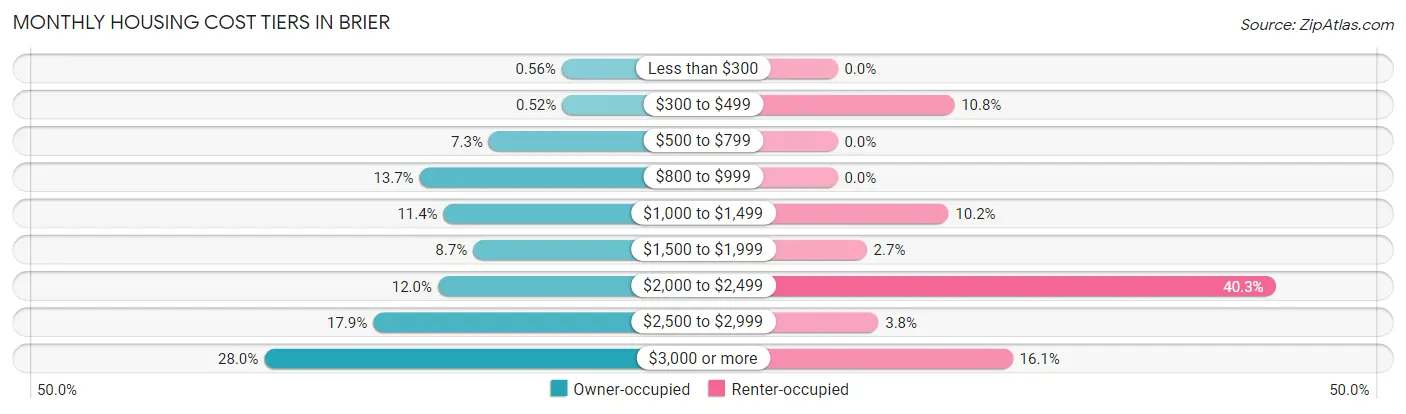
| Monthly Cost | Owner-occupied | Renter-occupied |
| Less than $300 | 12 (0.6%) | 0 (0.0%) |
| $300 to $499 | 11 (0.5%) | 20 (10.7%) |
| $500 to $799 | 155 (7.3%) | 0 (0.0%) |
| $800 to $999 | 291 (13.7%) | 0 (0.0%) |
| $1,000 to $1,499 | 244 (11.4%) | 19 (10.2%) |
| $1,500 to $1,999 | 186 (8.7%) | 5 (2.7%) |
| $2,000 to $2,499 | 255 (12.0%) | 75 (40.3%) |
| $2,500 to $2,999 | 382 (17.9%) | 7 (3.8%) |
| $3,000 or more | 596 (28.0%) | 30 (16.1%) |
| Total | 2,132 (100.0%) | 186 (100.0%) |
Physical Housing Characteristics in Brier
Housing Structures in Brier
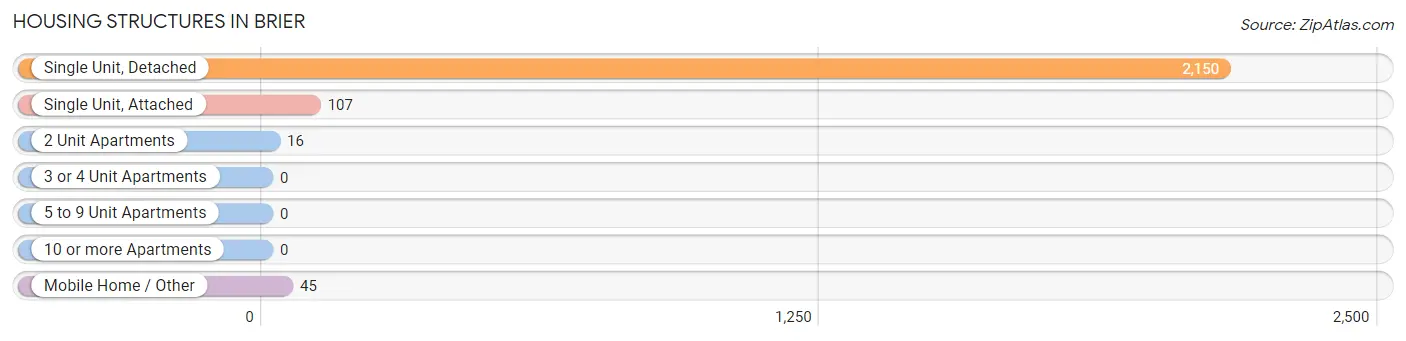
| Structure Type | # Housing Units | % Housing Units |
| Single Unit, Detached | 2,150 | 92.7% |
| Single Unit, Attached | 107 | 4.6% |
| 2 Unit Apartments | 16 | 0.7% |
| 3 or 4 Unit Apartments | 0 | 0.0% |
| 5 to 9 Unit Apartments | 0 | 0.0% |
| 10 or more Apartments | 0 | 0.0% |
| Mobile Home / Other | 45 | 1.9% |
| Total | 2,318 | 100.0% |
Housing Structures by Occupancy in Brier
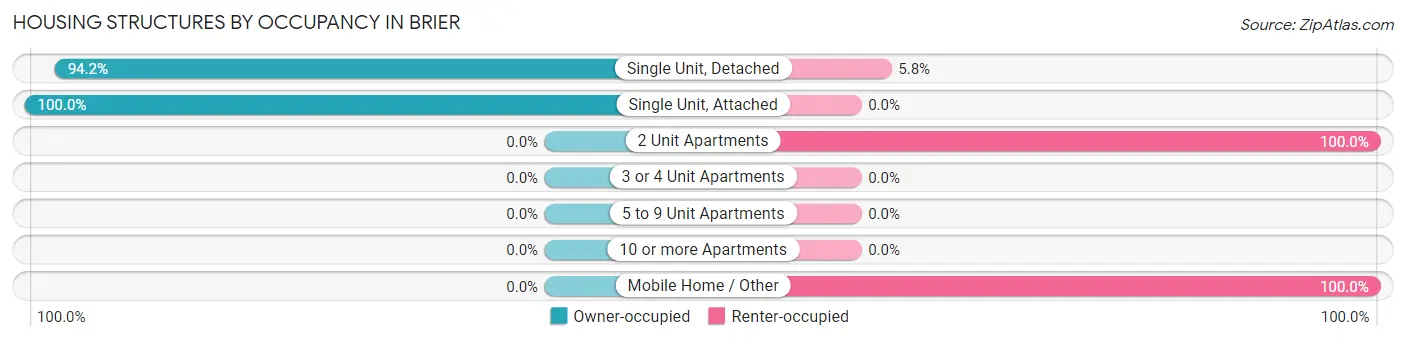
| Structure Type | Owner-occupied | Renter-occupied |
| Single Unit, Detached | 2,025 (94.2%) | 125 (5.8%) |
| Single Unit, Attached | 107 (100.0%) | 0 (0.0%) |
| 2 Unit Apartments | 0 (0.0%) | 16 (100.0%) |
| 3 or 4 Unit Apartments | 0 (0.0%) | 0 (0.0%) |
| 5 to 9 Unit Apartments | 0 (0.0%) | 0 (0.0%) |
| 10 or more Apartments | 0 (0.0%) | 0 (0.0%) |
| Mobile Home / Other | 0 (0.0%) | 45 (100.0%) |
| Total | 2,132 (92.0%) | 186 (8.0%) |
Housing Structures by Number of Rooms in Brier
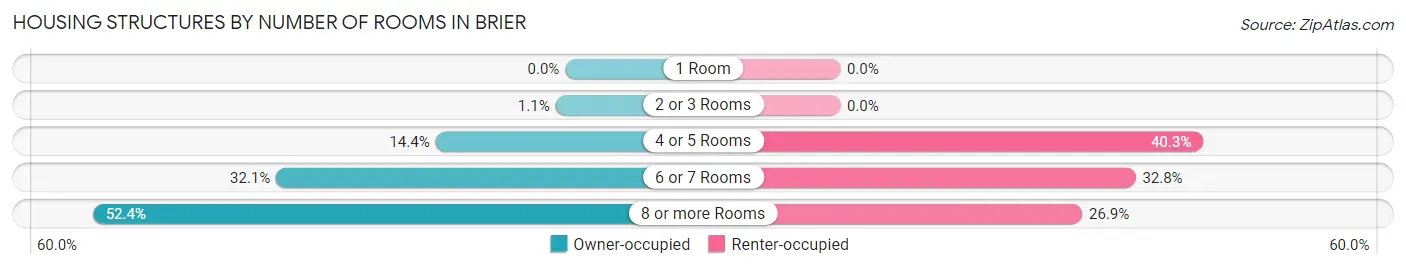
| Number of Rooms | Owner-occupied | Renter-occupied |
| 1 Room | 0 (0.0%) | 0 (0.0%) |
| 2 or 3 Rooms | 23 (1.1%) | 0 (0.0%) |
| 4 or 5 Rooms | 307 (14.4%) | 75 (40.3%) |
| 6 or 7 Rooms | 684 (32.1%) | 61 (32.8%) |
| 8 or more Rooms | 1,118 (52.4%) | 50 (26.9%) |
| Total | 2,132 (100.0%) | 186 (100.0%) |
Housing Structure by Heating Type in Brier
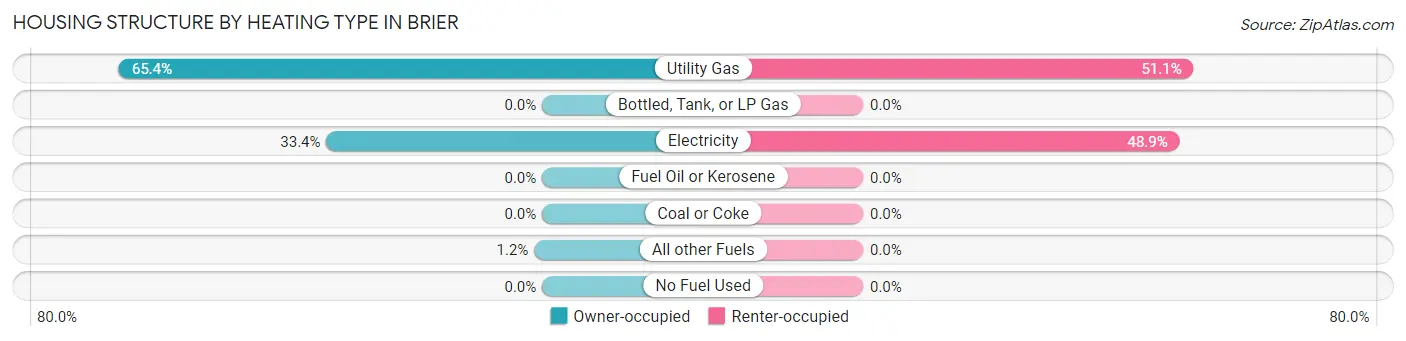
| Heating Type | Owner-occupied | Renter-occupied |
| Utility Gas | 1,395 (65.4%) | 95 (51.1%) |
| Bottled, Tank, or LP Gas | 0 (0.0%) | 0 (0.0%) |
| Electricity | 711 (33.4%) | 91 (48.9%) |
| Fuel Oil or Kerosene | 0 (0.0%) | 0 (0.0%) |
| Coal or Coke | 0 (0.0%) | 0 (0.0%) |
| All other Fuels | 26 (1.2%) | 0 (0.0%) |
| No Fuel Used | 0 (0.0%) | 0 (0.0%) |
| Total | 2,132 (100.0%) | 186 (100.0%) |
Household Vehicle Usage in Brier
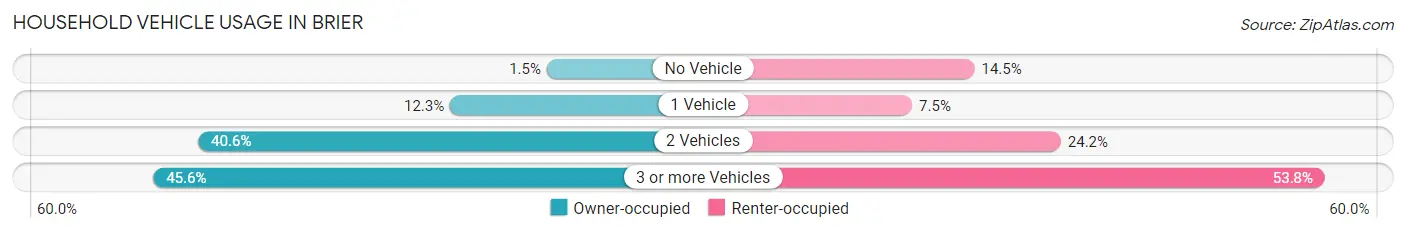
| Vehicles per Household | Owner-occupied | Renter-occupied |
| No Vehicle | 32 (1.5%) | 27 (14.5%) |
| 1 Vehicle | 263 (12.3%) | 14 (7.5%) |
| 2 Vehicles | 865 (40.6%) | 45 (24.2%) |
| 3 or more Vehicles | 972 (45.6%) | 100 (53.8%) |
| Total | 2,132 (100.0%) | 186 (100.0%) |
Real Estate & Mortgages in Brier
Real Estate and Mortgage Overview in Brier
| Characteristic | Without Mortgage | With Mortgage |
| Housing Units | 662 | 1,470 |
| Median Property Value | $734,900 | $812,100 |
| Median Household Income | $129,250 | $753 |
| Monthly Housing Costs | $881 | $596 |
| Real Estate Taxes | $6,117 | $0 |
Property Value by Mortgage Status in Brier
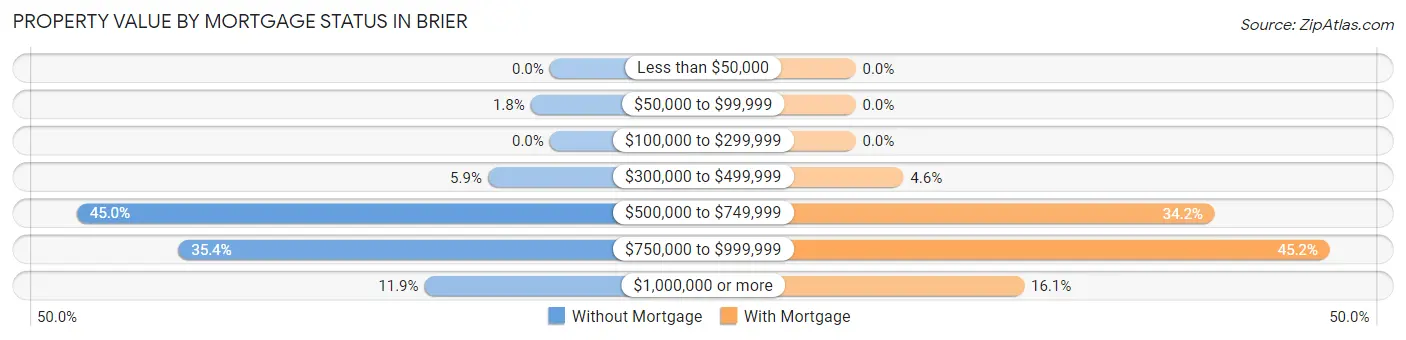
| Property Value | Without Mortgage | With Mortgage |
| Less than $50,000 | 0 (0.0%) | 0 (0.0%) |
| $50,000 to $99,999 | 12 (1.8%) | 0 (0.0%) |
| $100,000 to $299,999 | 0 (0.0%) | 0 (0.0%) |
| $300,000 to $499,999 | 39 (5.9%) | 67 (4.6%) |
| $500,000 to $749,999 | 298 (45.0%) | 503 (34.2%) |
| $750,000 to $999,999 | 234 (35.3%) | 664 (45.2%) |
| $1,000,000 or more | 79 (11.9%) | 236 (16.1%) |
| Total | 662 (100.0%) | 1,470 (100.0%) |
Household Income by Mortgage Status in Brier
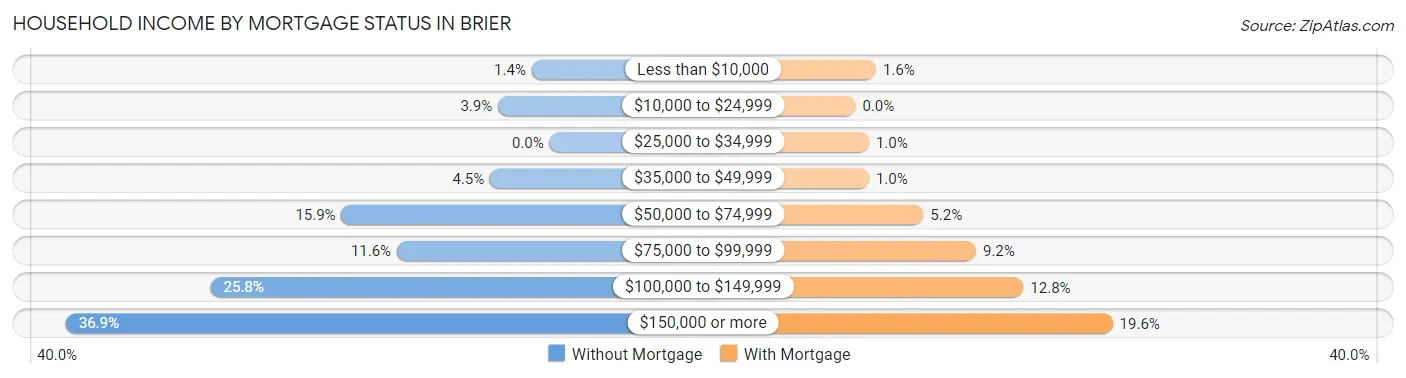
| Household Income | Without Mortgage | With Mortgage |
| Less than $10,000 | 9 (1.4%) | 23 (1.6%) |
| $10,000 to $24,999 | 26 (3.9%) | 0 (0.0%) |
| $25,000 to $34,999 | 0 (0.0%) | 15 (1.0%) |
| $35,000 to $49,999 | 30 (4.5%) | 15 (1.0%) |
| $50,000 to $74,999 | 105 (15.9%) | 76 (5.2%) |
| $75,000 to $99,999 | 77 (11.6%) | 135 (9.2%) |
| $100,000 to $149,999 | 171 (25.8%) | 188 (12.8%) |
| $150,000 or more | 244 (36.9%) | 288 (19.6%) |
| Total | 662 (100.0%) | 1,470 (100.0%) |
Property Value to Household Income Ratio in Brier
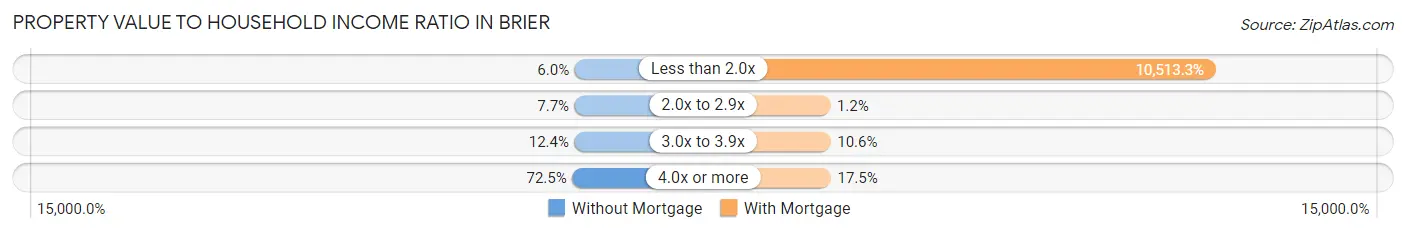
| Value-to-Income Ratio | Without Mortgage | With Mortgage |
| Less than 2.0x | 40 (6.0%) | 154,545 (10,513.3%) |
| 2.0x to 2.9x | 51 (7.7%) | 17 (1.2%) |
| 3.0x to 3.9x | 82 (12.4%) | 156 (10.6%) |
| 4.0x or more | 480 (72.5%) | 257 (17.5%) |
| Total | 662 (100.0%) | 1,470 (100.0%) |
Real Estate Taxes by Mortgage Status in Brier
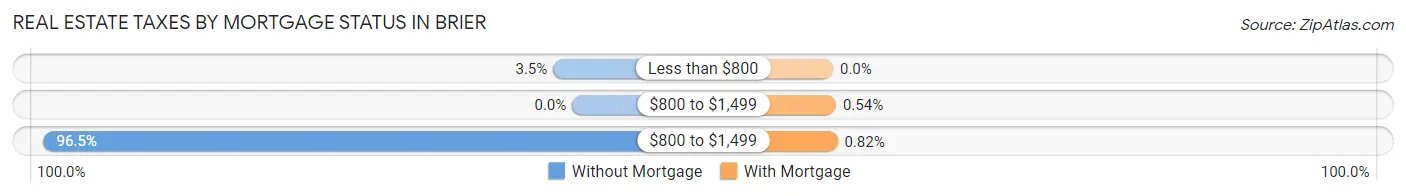
| Property Taxes | Without Mortgage | With Mortgage |
| Less than $800 | 23 (3.5%) | 0 (0.0%) |
| $800 to $1,499 | 0 (0.0%) | 8 (0.5%) |
| $800 to $1,499 | 639 (96.5%) | 12 (0.8%) |
| Total | 662 (100.0%) | 1,470 (100.0%) |
Health & Disability in Brier
Health Insurance Coverage by Age in Brier
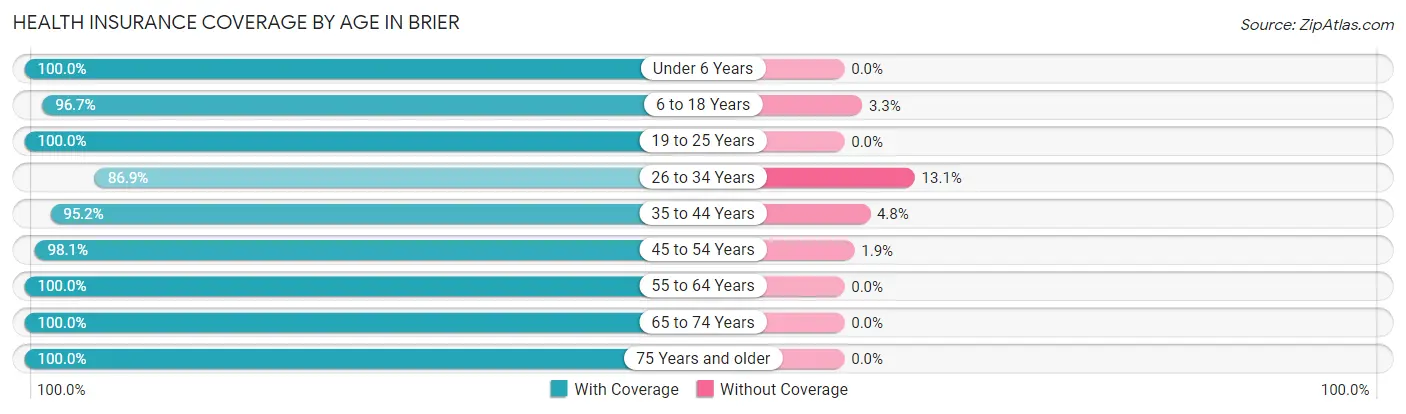
| Age Bracket | With Coverage | Without Coverage |
| Under 6 Years | 430 (100.0%) | 0 (0.0%) |
| 6 to 18 Years | 938 (96.7%) | 32 (3.3%) |
| 19 to 25 Years | 415 (100.0%) | 0 (0.0%) |
| 26 to 34 Years | 384 (86.9%) | 58 (13.1%) |
| 35 to 44 Years | 973 (95.2%) | 49 (4.8%) |
| 45 to 54 Years | 841 (98.1%) | 16 (1.9%) |
| 55 to 64 Years | 1,051 (100.0%) | 0 (0.0%) |
| 65 to 74 Years | 999 (100.0%) | 0 (0.0%) |
| 75 Years and older | 337 (100.0%) | 0 (0.0%) |
| Total | 6,368 (97.6%) | 155 (2.4%) |
Health Insurance Coverage by Citizenship Status in Brier
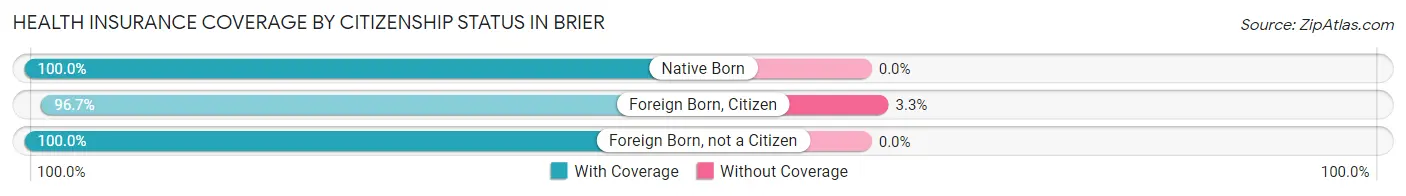
| Citizenship Status | With Coverage | Without Coverage |
| Native Born | 430 (100.0%) | 0 (0.0%) |
| Foreign Born, Citizen | 938 (96.7%) | 32 (3.3%) |
| Foreign Born, not a Citizen | 415 (100.0%) | 0 (0.0%) |
Health Insurance Coverage by Household Income in Brier
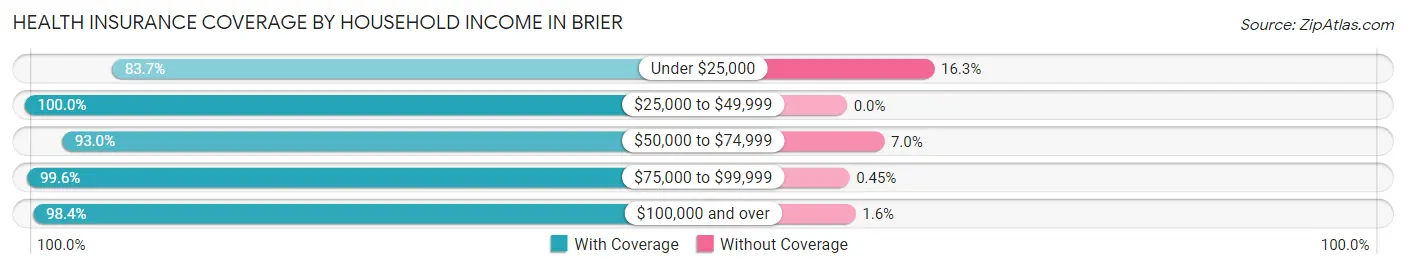
| Household Income | With Coverage | Without Coverage |
| Under $25,000 | 128 (83.7%) | 25 (16.3%) |
| $25,000 to $49,999 | 250 (100.0%) | 0 (0.0%) |
| $50,000 to $74,999 | 667 (93.0%) | 50 (7.0%) |
| $75,000 to $99,999 | 666 (99.6%) | 3 (0.4%) |
| $100,000 and over | 4,652 (98.4%) | 76 (1.6%) |
Public vs Private Health Insurance Coverage by Age in Brier
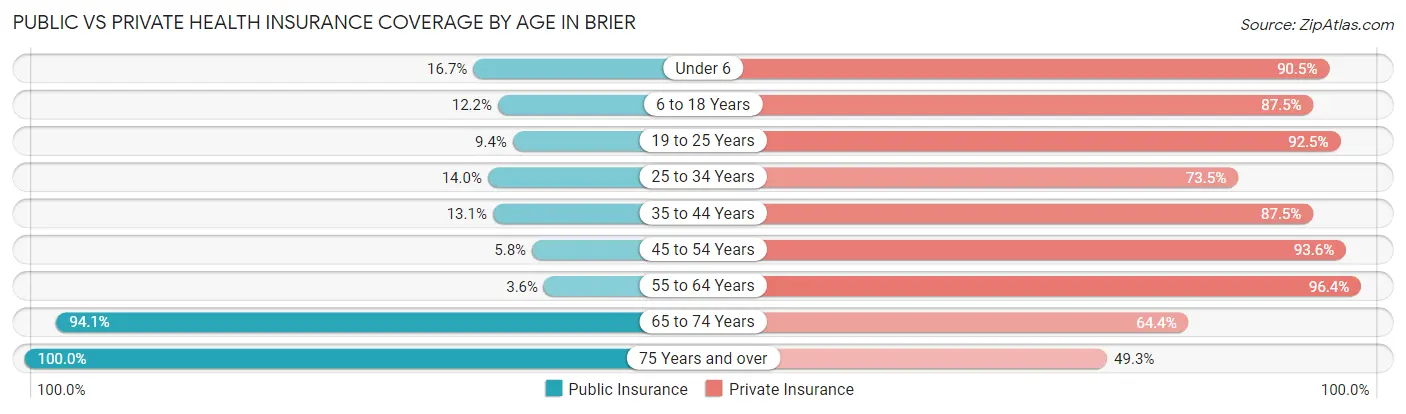
| Age Bracket | Public Insurance | Private Insurance |
| Under 6 | 72 (16.7%) | 389 (90.5%) |
| 6 to 18 Years | 118 (12.2%) | 849 (87.5%) |
| 19 to 25 Years | 39 (9.4%) | 384 (92.5%) |
| 25 to 34 Years | 62 (14.0%) | 325 (73.5%) |
| 35 to 44 Years | 134 (13.1%) | 894 (87.5%) |
| 45 to 54 Years | 50 (5.8%) | 802 (93.6%) |
| 55 to 64 Years | 38 (3.6%) | 1,013 (96.4%) |
| 65 to 74 Years | 940 (94.1%) | 643 (64.4%) |
| 75 Years and over | 337 (100.0%) | 166 (49.3%) |
| Total | 1,790 (27.4%) | 5,465 (83.8%) |
Disability Status by Sex by Age in Brier
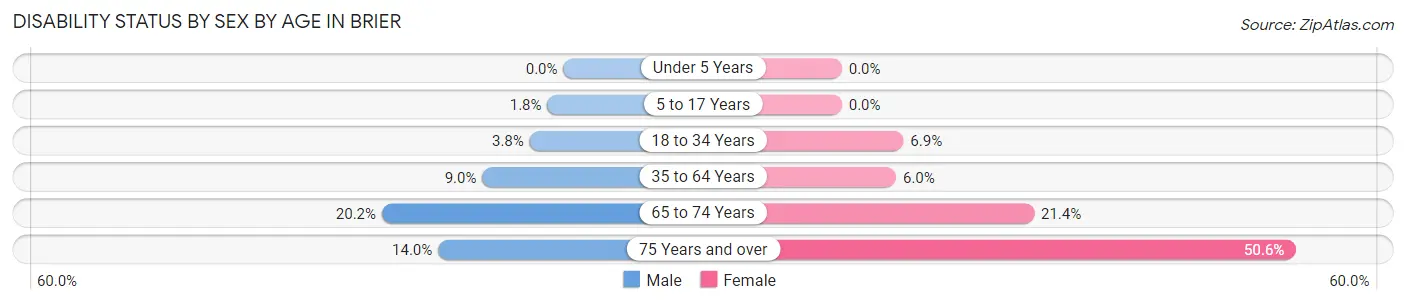
| Age Bracket | Male | Female |
| Under 5 Years | 0 (0.0%) | 0 (0.0%) |
| 5 to 17 Years | 8 (1.8%) | 0 (0.0%) |
| 18 to 34 Years | 17 (3.8%) | 30 (6.9%) |
| 35 to 64 Years | 133 (9.0%) | 88 (6.0%) |
| 65 to 74 Years | 116 (20.2%) | 91 (21.4%) |
| 75 Years and over | 12 (14.0%) | 127 (50.6%) |
Disability Class by Sex by Age in Brier
Disability Class: Hearing Difficulty
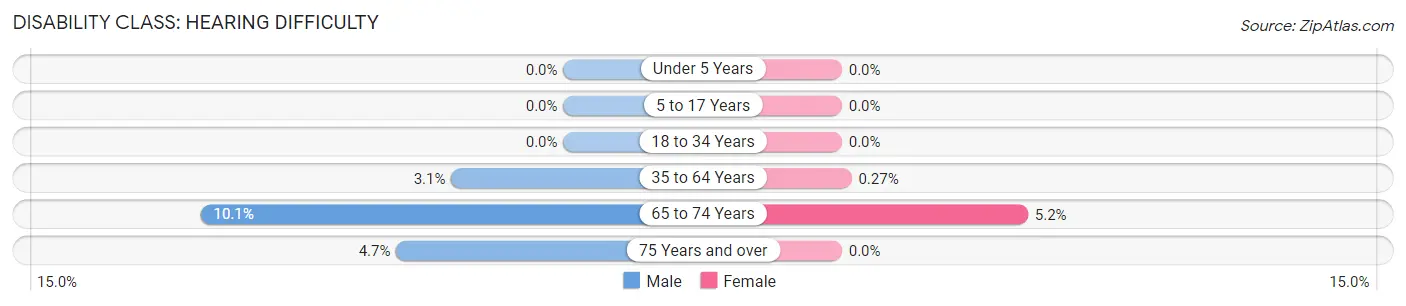
| Age Bracket | Male | Female |
| Under 5 Years | 0 (0.0%) | 0 (0.0%) |
| 5 to 17 Years | 0 (0.0%) | 0 (0.0%) |
| 18 to 34 Years | 0 (0.0%) | 0 (0.0%) |
| 35 to 64 Years | 46 (3.1%) | 4 (0.3%) |
| 65 to 74 Years | 58 (10.1%) | 22 (5.2%) |
| 75 Years and over | 4 (4.6%) | 0 (0.0%) |
Disability Class: Vision Difficulty
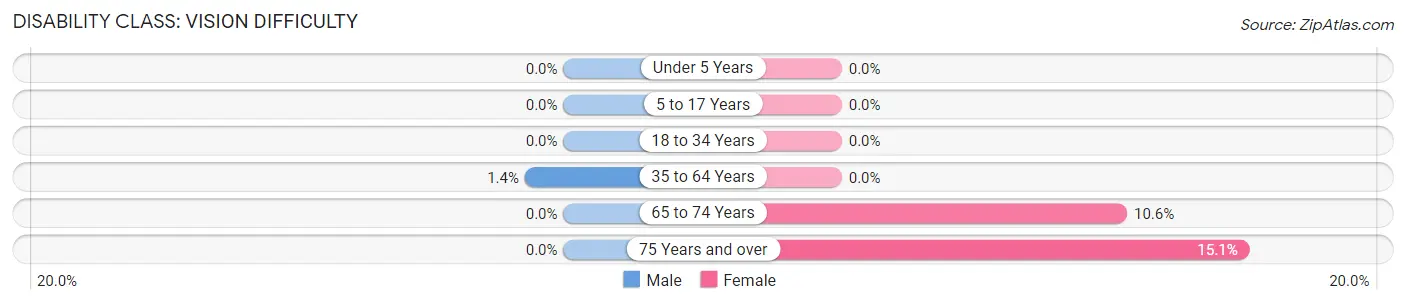
| Age Bracket | Male | Female |
| Under 5 Years | 0 (0.0%) | 0 (0.0%) |
| 5 to 17 Years | 0 (0.0%) | 0 (0.0%) |
| 18 to 34 Years | 0 (0.0%) | 0 (0.0%) |
| 35 to 64 Years | 21 (1.4%) | 0 (0.0%) |
| 65 to 74 Years | 0 (0.0%) | 45 (10.6%) |
| 75 Years and over | 0 (0.0%) | 38 (15.1%) |
Disability Class: Cognitive Difficulty
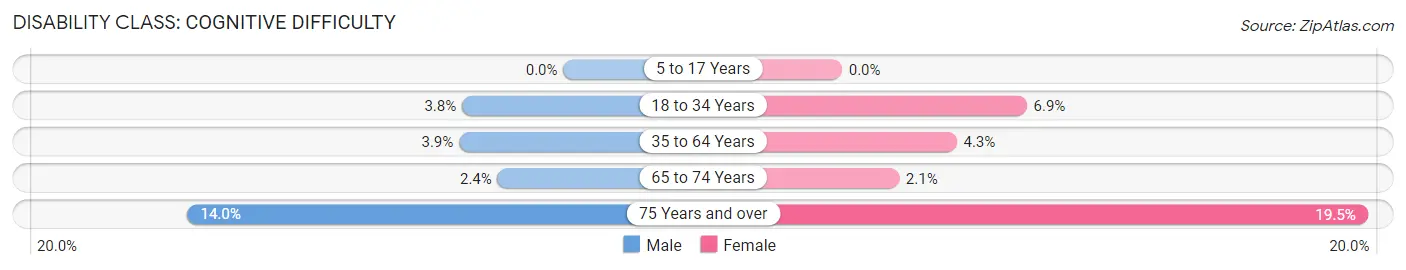
| Age Bracket | Male | Female |
| 5 to 17 Years | 0 (0.0%) | 0 (0.0%) |
| 18 to 34 Years | 17 (3.8%) | 30 (6.9%) |
| 35 to 64 Years | 57 (3.9%) | 62 (4.3%) |
| 65 to 74 Years | 14 (2.4%) | 9 (2.1%) |
| 75 Years and over | 12 (14.0%) | 49 (19.5%) |
Disability Class: Ambulatory Difficulty
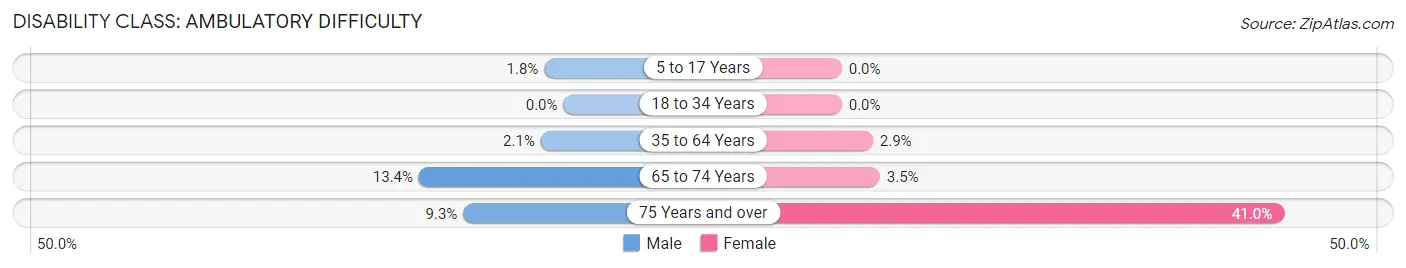
| Age Bracket | Male | Female |
| 5 to 17 Years | 8 (1.8%) | 0 (0.0%) |
| 18 to 34 Years | 0 (0.0%) | 0 (0.0%) |
| 35 to 64 Years | 31 (2.1%) | 42 (2.9%) |
| 65 to 74 Years | 77 (13.4%) | 15 (3.5%) |
| 75 Years and over | 8 (9.3%) | 103 (41.0%) |
Disability Class: Self-Care Difficulty
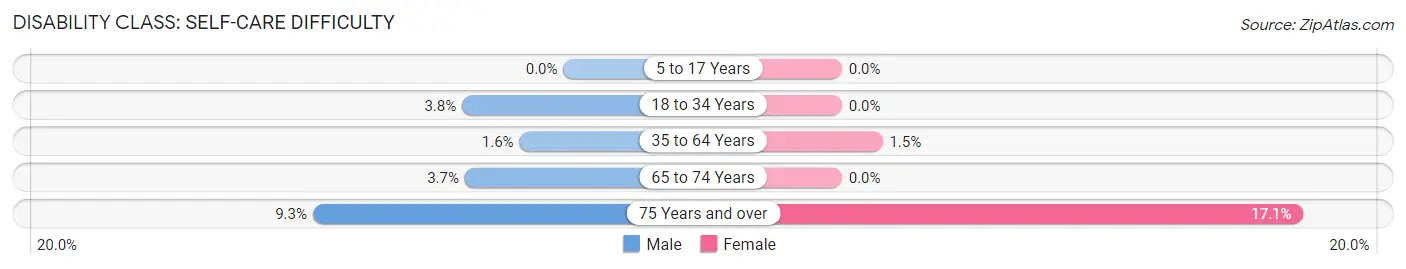
| Age Bracket | Male | Female |
| 5 to 17 Years | 0 (0.0%) | 0 (0.0%) |
| 18 to 34 Years | 17 (3.8%) | 0 (0.0%) |
| 35 to 64 Years | 24 (1.6%) | 22 (1.5%) |
| 65 to 74 Years | 21 (3.7%) | 0 (0.0%) |
| 75 Years and over | 8 (9.3%) | 43 (17.1%) |
Technology Access in Brier
Computing Device Access in Brier
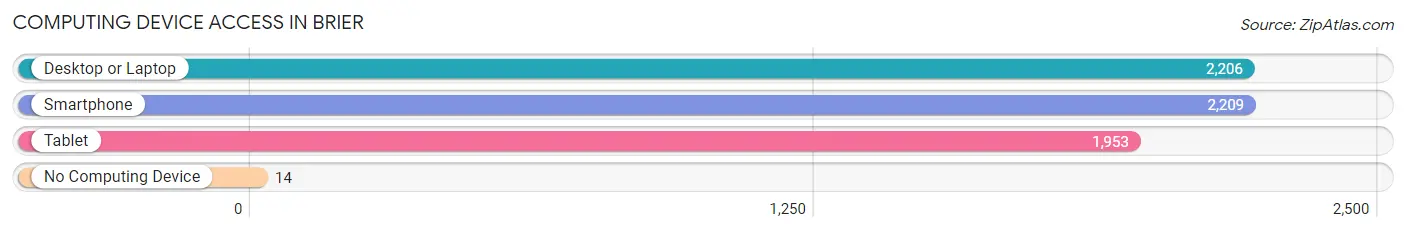
| Device Type | # Households | % Households |
| Desktop or Laptop | 2,206 | 95.2% |
| Smartphone | 2,209 | 95.3% |
| Tablet | 1,953 | 84.3% |
| No Computing Device | 14 | 0.6% |
| Total | 2,318 | 100.0% |
Internet Access in Brier
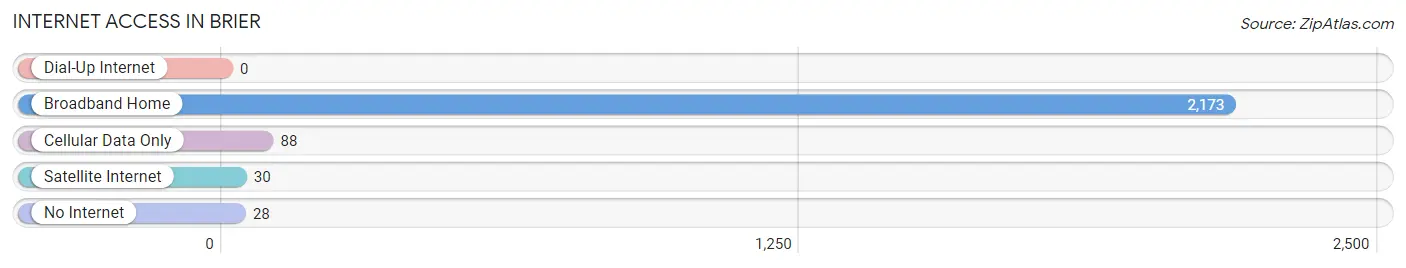
| Internet Type | # Households | % Households |
| Dial-Up Internet | 0 | 0.0% |
| Broadband Home | 2,173 | 93.7% |
| Cellular Data Only | 88 | 3.8% |
| Satellite Internet | 30 | 1.3% |
| No Internet | 28 | 1.2% |
| Total | 2,318 | 100.0% |
Brier Summary
Brier is a small city located in Snohomish County, Washington, United States. It is situated in the Seattle metropolitan area, approximately 20 miles north of Seattle. The population of Brier was 6,087 at the 2010 census.
History
The area that is now Brier was first settled in the late 1800s by homesteaders. The first post office was established in 1891 and the town was officially incorporated in 1909. The name Brier was chosen by the first postmaster, who named it after a brier bush that grew near his home.
In the early 1900s, Brier was a logging and farming community. The logging industry was the main source of income for the town, and the local economy was largely dependent on the timber industry.
In the 1950s, the timber industry began to decline and the local economy shifted to a more suburban focus. The population of Brier began to grow as people moved to the area for its proximity to Seattle and the Puget Sound.
Geography
Brier is located in Snohomish County, Washington, approximately 20 miles north of Seattle. It is situated in the Seattle metropolitan area, and is bordered by the cities of Mountlake Terrace, Lynnwood, and Bothell.
The city has a total area of 4.2 square miles, all of which is land. The terrain is mostly flat, with some rolling hills. The city is located in the foothills of the Cascade Mountains, and is surrounded by forests and wetlands.
Economy
The economy of Brier is largely based on the service industry. The city is home to a variety of businesses, including restaurants, retail stores, and professional services. The city is also home to several technology companies, including Microsoft and Amazon.
The city is also home to a number of manufacturing companies, including Boeing and Lockheed Martin. The city is also home to a number of medical facilities, including the Swedish Medical Center and the Evergreen Hospital Medical Center.
Demographics
As of the 2010 census, the population of Brier was 6,087. The racial makeup of the city was 79.3% White, 8.2% Asian, 6.2% Hispanic or Latino, 4.2% African American, and 2.1% from other races.
The median household income in Brier was $76,845 in 2017. The median age of the population was 38.7 years. The city has a higher percentage of college-educated residents than the national average.
Conclusion
Brier is a small city located in Snohomish County, Washington, United States. It is situated in the Seattle metropolitan area, approximately 20 miles north of Seattle. The population of Brier was 6,087 at the 2010 census. The economy of Brier is largely based on the service industry, and the city is home to a variety of businesses, including restaurants, retail stores, and professional services. The racial makeup of the city was 79.3% White, 8.2% Asian, 6.2% Hispanic or Latino, 4.2% African American, and 2.1% from other races. The median household income in Brier was $76,845 in 2017. The city has a higher percentage of college-educated residents than the national average.
Common Questions
What is Per Capita Income in Brier?
Per Capita income in Brier is $57,268.
What is the Median Family Income in Brier?
Median Family Income in Brier is $139,625.
What is the Median Household income in Brier?
Median Household Income in Brier is $141,200.
What is Income or Wage Gap in Brier?
Income or Wage Gap in Brier is 6.6%.
Women in Brier earn 93.4 cents for every dollar earned by a man.
What is Inequality or Gini Index in Brier?
Inequality or Gini Index in Brier is 0.36.
What is the Total Population of Brier?
Total Population of Brier is 6,539.
What is the Total Male Population of Brier?
Total Male Population of Brier is 3,215.
What is the Total Female Population of Brier?
Total Female Population of Brier is 3,324.
What is the Ratio of Males per 100 Females in Brier?
There are 96.72 Males per 100 Females in Brier.
What is the Ratio of Females per 100 Males in Brier?
There are 103.39 Females per 100 Males in Brier.
What is the Median Population Age in Brier?
Median Population Age in Brier is 44.9 Years.
What is the Average Family Size in Brier
Average Family Size in Brier is 3.0 People.
What is the Average Household Size in Brier
Average Household Size in Brier is 2.8 People.
How Large is the Labor Force in Brier?
There are 3,466 People in the Labor Forcein in Brier.
What is the Percentage of People in the Labor Force in Brier?
65.7% of People are in the Labor Force in Brier.
What is the Unemployment Rate in Brier?
Unemployment Rate in Brier is 5.0%.