Zip Codes with the Highest Percentage of Population Employed in Computer, Engineering & Science in Seattle, WA
RELATED REPORTS & OPTIONS
Computer, Engineering & Science
Seattle
Compare Zip Codes
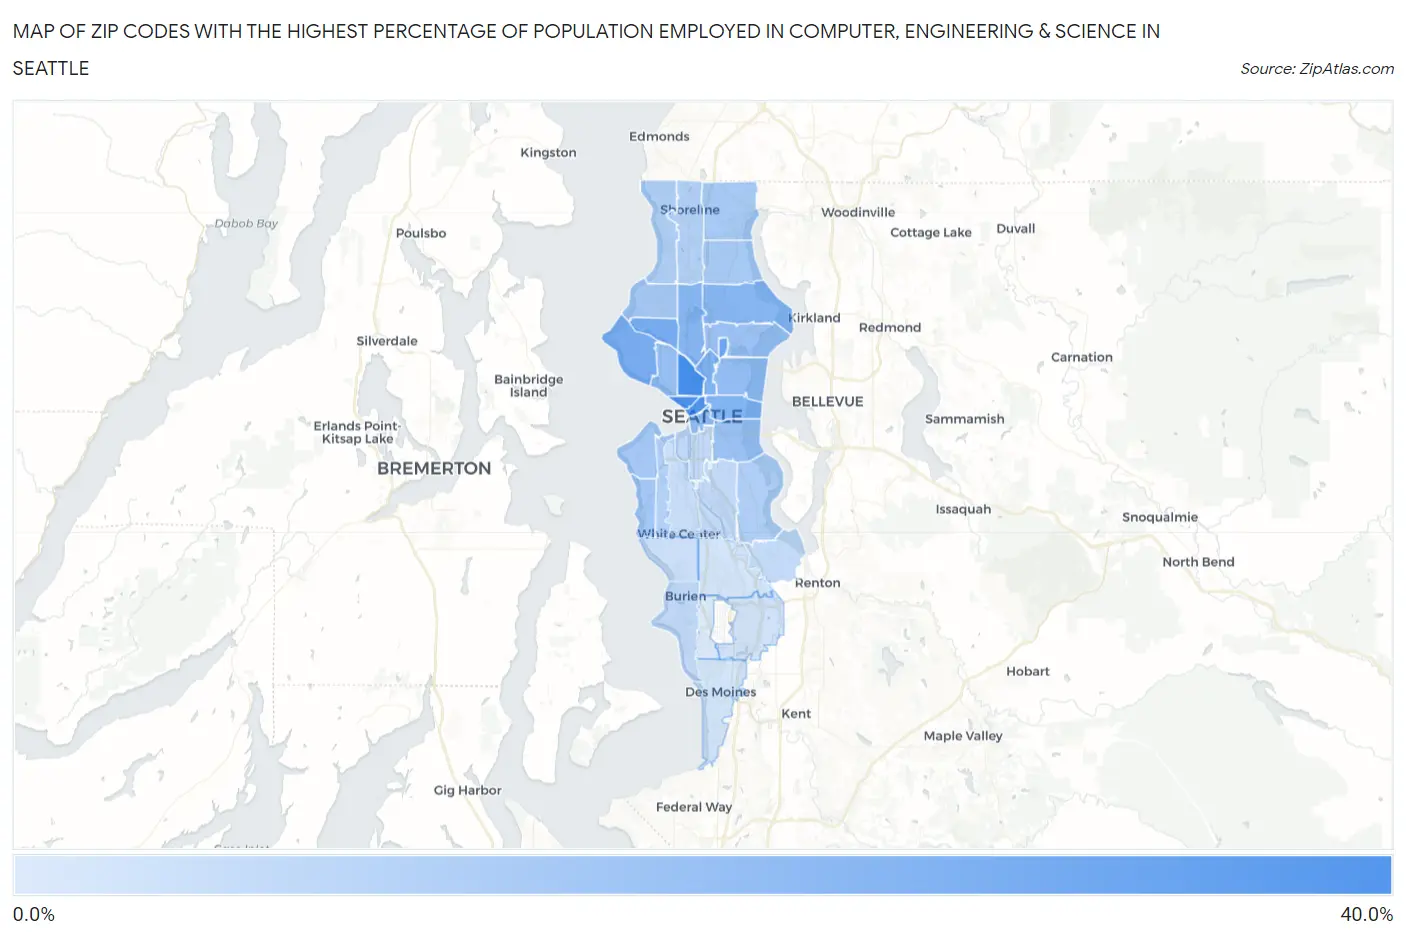
Map of Zip Codes with the Highest Percentage of Population Employed in Computer, Engineering & Science in Seattle
4.7%
36.2%
Zip Codes with the Highest Percentage of Population Employed in Computer, Engineering & Science in Seattle, WA
| Zip Code | % Employed | vs State | vs National | |
| 1. | 98109 | 36.2% | 10.2%(+26.0)#7 | 6.8%(+29.4)#123 |
| 2. | 98121 | 34.4% | 10.2%(+24.3)#9 | 6.8%(+27.7)#136 |
| 3. | 98101 | 33.3% | 10.2%(+23.2)#11 | 6.8%(+26.6)#141 |
| 4. | 98195 | 26.9% | 10.2%(+16.7)#16 | 6.8%(+20.1)#233 |
| 5. | 98107 | 24.9% | 10.2%(+14.7)#18 | 6.8%(+18.1)#280 |
| 6. | 98199 | 24.5% | 10.2%(+14.3)#19 | 6.8%(+17.7)#289 |
| 7. | 98102 | 23.0% | 10.2%(+12.9)#23 | 6.8%(+16.3)#343 |
| 8. | 98122 | 22.5% | 10.2%(+12.3)#24 | 6.8%(+15.7)#371 |
| 9. | 98164 | 22.3% | 10.2%(+12.2)#26 | 6.8%(+15.6)#374 |
| 10. | 98115 | 21.7% | 10.2%(+11.5)#28 | 6.8%(+14.9)#400 |
| 11. | 98103 | 21.5% | 10.2%(+11.3)#29 | 6.8%(+14.7)#407 |
| 12. | 98104 | 19.7% | 10.2%(+9.56)#39 | 6.8%(+13.0)#532 |
| 13. | 98112 | 19.0% | 10.2%(+8.86)#44 | 6.8%(+12.3)#591 |
| 14. | 98119 | 18.0% | 10.2%(+7.86)#47 | 6.8%(+11.3)#679 |
| 15. | 98105 | 17.6% | 10.2%(+7.42)#50 | 6.8%(+10.8)#741 |
| 16. | 98144 | 17.2% | 10.2%(+7.06)#51 | 6.8%(+10.5)#789 |
| 17. | 98136 | 15.7% | 10.2%(+5.53)#57 | 6.8%(+8.93)#1,005 |
| 18. | 98117 | 15.4% | 10.2%(+5.23)#58 | 6.8%(+8.63)#1,047 |
| 19. | 98116 | 15.2% | 10.2%(+5.07)#59 | 6.8%(+8.47)#1,082 |
| 20. | 98125 | 15.0% | 10.2%(+4.85)#60 | 6.8%(+8.24)#1,120 |
| 21. | 98155 | 14.8% | 10.2%(+4.66)#61 | 6.8%(+8.06)#1,147 |
| 22. | 98177 | 13.1% | 10.2%(+2.95)#76 | 6.8%(+6.34)#1,602 |
| 23. | 98118 | 13.1% | 10.2%(+2.93)#77 | 6.8%(+6.32)#1,614 |
| 24. | 98133 | 12.8% | 10.2%(+2.62)#80 | 6.8%(+6.01)#1,721 |
| 25. | 98126 | 12.5% | 10.2%(+2.32)#85 | 6.8%(+5.72)#1,832 |
| 26. | 98134 | 9.9% | 10.2%(-0.227)#115 | 6.8%(+3.17)#3,273 |
| 27. | 98166 | 9.8% | 10.2%(-0.344)#119 | 6.8%(+3.05)#3,362 |
| 28. | 98108 | 9.8% | 10.2%(-0.400)#122 | 6.8%(+3.00)#3,397 |
| 29. | 98178 | 9.2% | 10.2%(-0.929)#131 | 6.8%(+2.47)#3,836 |
| 30. | 98106 | 8.7% | 10.2%(-1.50)#141 | 6.8%(+1.90)#4,410 |
| 31. | 98146 | 7.7% | 10.2%(-2.42)#167 | 6.8%(+0.973)#5,635 |
| 32. | 98188 | 6.7% | 10.2%(-3.49)#210 | 6.8%(-0.089)#7,398 |
| 33. | 98198 | 6.6% | 10.2%(-3.59)#217 | 6.8%(-0.193)#7,588 |
| 34. | 98168 | 6.3% | 10.2%(-3.83)#233 | 6.8%(-0.438)#8,079 |
| 35. | 98148 | 4.7% | 10.2%(-5.50)#329 | 6.8%(-2.11)#12,339 |
1
Common Questions
What are the Top 10 Zip Codes with the Highest Percentage of Population Employed in Computer, Engineering & Science in Seattle, WA?
Top 10 Zip Codes with the Highest Percentage of Population Employed in Computer, Engineering & Science in Seattle, WA are:
What zip code has the Highest Percentage of Population Employed in Computer, Engineering & Science in Seattle, WA?
98109 has the Highest Percentage of Population Employed in Computer, Engineering & Science in Seattle, WA with 36.2%.
What is the Percentage of Population Employed in Computer, Engineering & Science in Seattle, WA?
Percentage of Population Employed in Computer, Engineering & Science in Seattle is 19.7%.
What is the Percentage of Population Employed in Computer, Engineering & Science in Washington?
Percentage of Population Employed in Computer, Engineering & Science in Washington is 10.2%.
What is the Percentage of Population Employed in Computer, Engineering & Science in the United States?
Percentage of Population Employed in Computer, Engineering & Science in the United States is 6.8%.