Medina, WA Map & Demographics
Medina Map
Medina Overview
$156,124
PER CAPITA INCOME
$250,001
AVG FAMILY INCOME
$244,740
AVG HOUSEHOLD INCOME
55.0%
WAGE / INCOME GAP [ % ]
45.0¢/ $1
WAGE / INCOME GAP [ $ ]
0.51
INEQUALITY / GINI INDEX
2,923
TOTAL POPULATION
1,419
MALE POPULATION
1,504
FEMALE POPULATION
94.35
MALES / 100 FEMALES
105.99
FEMALES / 100 MALES
47.4
MEDIAN AGE
3.1
AVG FAMILY SIZE
2.9
AVG HOUSEHOLD SIZE
1,252
LABOR FORCE [ PEOPLE ]
55.4%
PERCENT IN LABOR FORCE
2.2%
UNEMPLOYMENT RATE
Medina Zip Codes
Income in Medina
Income Overview in Medina
Per Capita Income in Medina is $156,124, while median incomes of families and households are $250,001 and $244,740 respectively.
| Characteristic | Number | Measure |
| Per Capita Income | 2,923 | $156,124 |
| Median Family Income | 857 | $250,001 |
| Mean Family Income | 857 | $465,328 |
| Median Household Income | 1,027 | $244,740 |
| Mean Household Income | 1,027 | $439,677 |
| Income Deficit | 857 | $0 |
| Wage / Income Gap (%) | 2,923 | 54.98% |
| Wage / Income Gap ($) | 2,923 | 45.02¢ per $1 |
| Gini / Inequality Index | 2,923 | 0.51 |
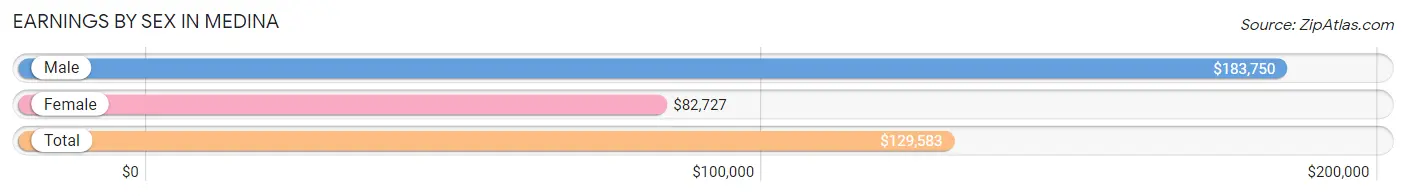
Earnings by Sex in Medina
Average Earnings in Medina are $129,583, $183,750 for men and $82,727 for women, a difference of 55.0%.
| Sex | Number | Average Earnings |
| Male | 808 (60.2%) | $183,750 |
| Female | 534 (39.8%) | $82,727 |
| Total | 1,342 (100.0%) | $129,583 |
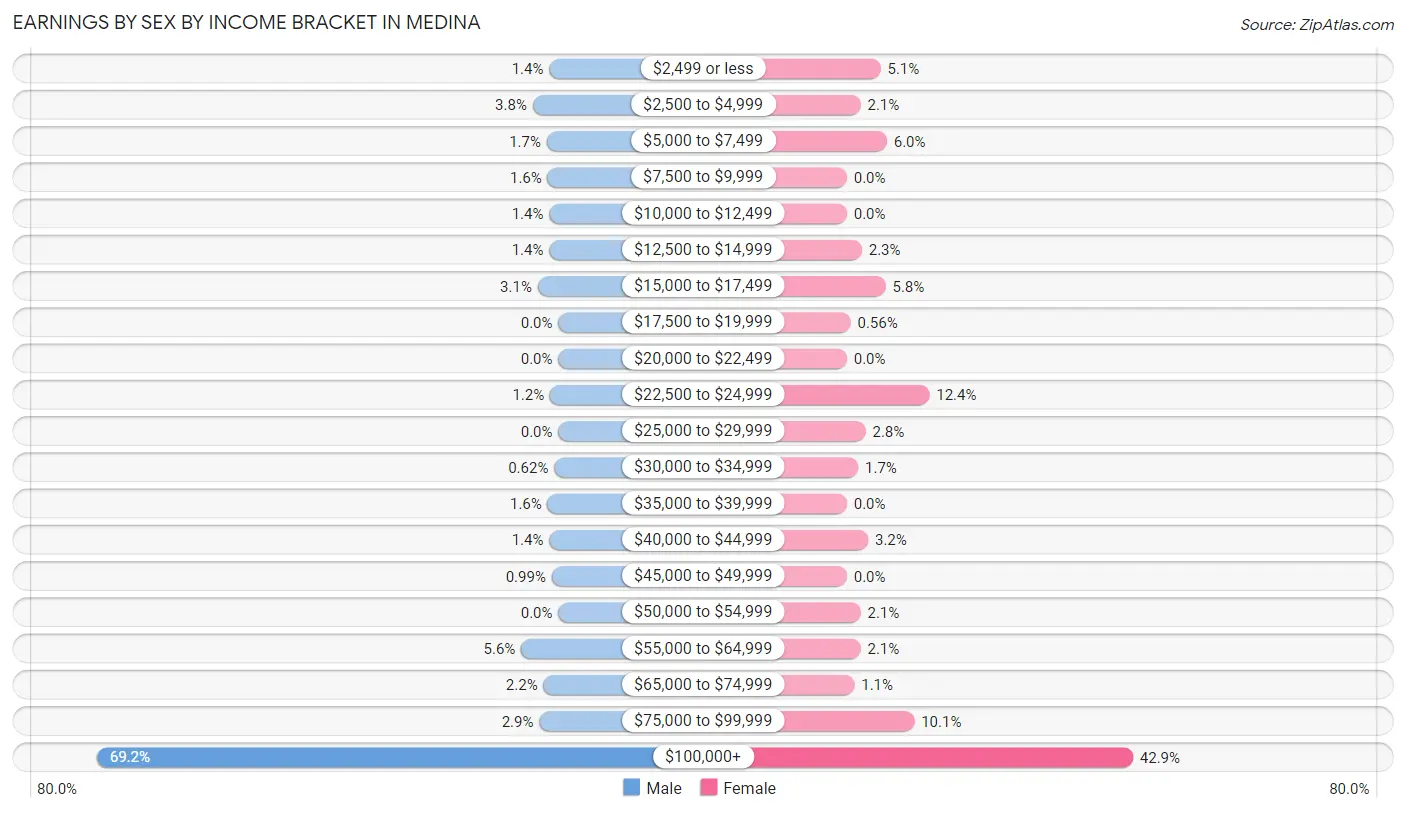
Earnings by Sex by Income Bracket in Medina
The most common earnings brackets in Medina are $100,000+ for men (559 | 69.2%) and $100,000+ for women (229 | 42.9%).
| Income | Male | Female |
| $2,499 or less | 11 (1.4%) | 27 (5.1%) |
| $2,500 to $4,999 | 31 (3.8%) | 11 (2.1%) |
| $5,000 to $7,499 | 14 (1.7%) | 32 (6.0%) |
| $7,500 to $9,999 | 13 (1.6%) | 0 (0.0%) |
| $10,000 to $12,499 | 11 (1.4%) | 0 (0.0%) |
| $12,500 to $14,999 | 11 (1.4%) | 12 (2.2%) |
| $15,000 to $17,499 | 25 (3.1%) | 31 (5.8%) |
| $17,500 to $19,999 | 0 (0.0%) | 3 (0.6%) |
| $20,000 to $22,499 | 0 (0.0%) | 0 (0.0%) |
| $22,500 to $24,999 | 10 (1.2%) | 66 (12.4%) |
| $25,000 to $29,999 | 0 (0.0%) | 15 (2.8%) |
| $30,000 to $34,999 | 5 (0.6%) | 9 (1.7%) |
| $35,000 to $39,999 | 13 (1.6%) | 0 (0.0%) |
| $40,000 to $44,999 | 11 (1.4%) | 17 (3.2%) |
| $45,000 to $49,999 | 8 (1.0%) | 0 (0.0%) |
| $50,000 to $54,999 | 0 (0.0%) | 11 (2.1%) |
| $55,000 to $64,999 | 45 (5.6%) | 11 (2.1%) |
| $65,000 to $74,999 | 18 (2.2%) | 6 (1.1%) |
| $75,000 to $99,999 | 23 (2.9%) | 54 (10.1%) |
| $100,000+ | 559 (69.2%) | 229 (42.9%) |
| Total | 808 (100.0%) | 534 (100.0%) |
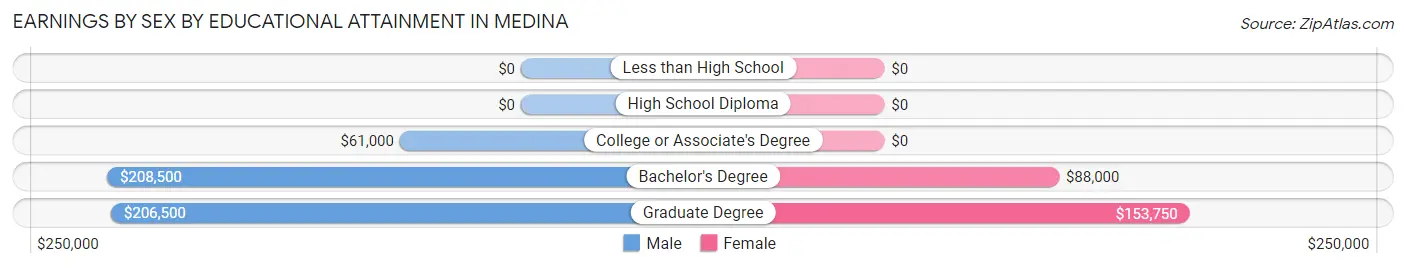
Earnings by Sex by Educational Attainment in Medina
Average earnings in Medina are $203,036 for men and $120,694 for women, a difference of 40.6%. Men with an educational attainment of bachelor's degree enjoy the highest average annual earnings of $208,500, while those with college or associate's degree education earn the least with $61,000. Women with an educational attainment of graduate degree earn the most with the average annual earnings of $153,750, while those with bachelor's degree education have the smallest earnings of $88,000.
| Educational Attainment | Male Income | Female Income |
| Less than High School | - | - |
| High School Diploma | - | - |
| College or Associate's Degree | $61,000 | $0 |
| Bachelor's Degree | $208,500 | $88,000 |
| Graduate Degree | $206,500 | $153,750 |
| Total | $203,036 | $120,694 |
Family Income in Medina
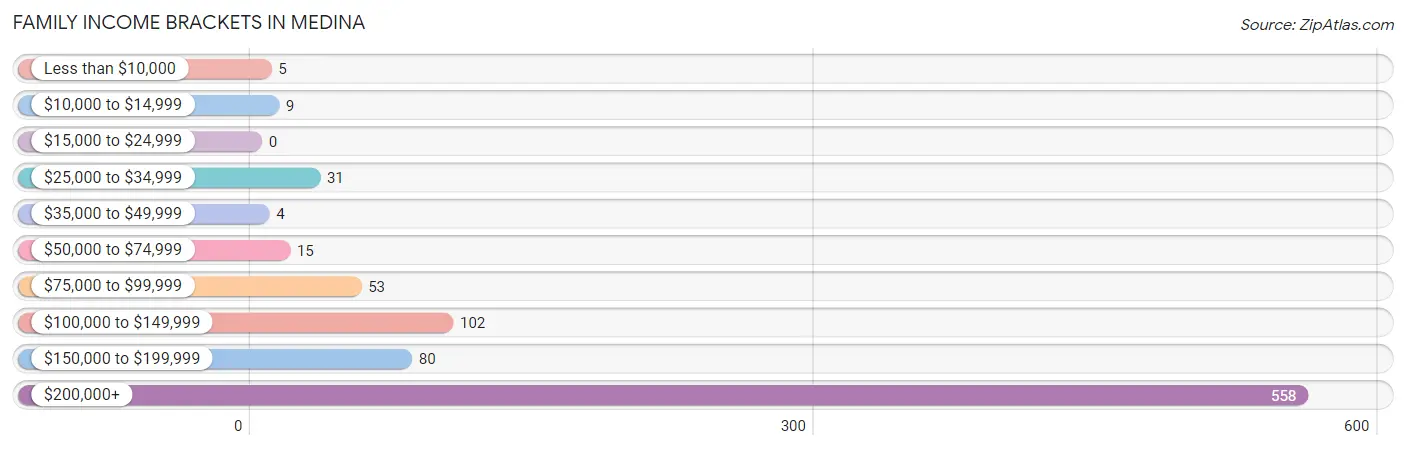
Family Income Brackets in Medina
According to the Medina family income data, there are 558 families falling into the $200,000+ income range, which is the most common income bracket and makes up 65.1% of all families.
| Income Bracket | # Families | % Families |
| Less than $10,000 | 5 | 0.6% |
| $10,000 to $14,999 | 9 | 1.1% |
| $15,000 to $24,999 | 0 | 0.0% |
| $25,000 to $34,999 | 31 | 3.6% |
| $35,000 to $49,999 | 4 | 0.5% |
| $50,000 to $74,999 | 15 | 1.8% |
| $75,000 to $99,999 | 53 | 6.2% |
| $100,000 to $149,999 | 102 | 11.9% |
| $150,000 to $199,999 | 80 | 9.3% |
| $200,000+ | 558 | 65.1% |
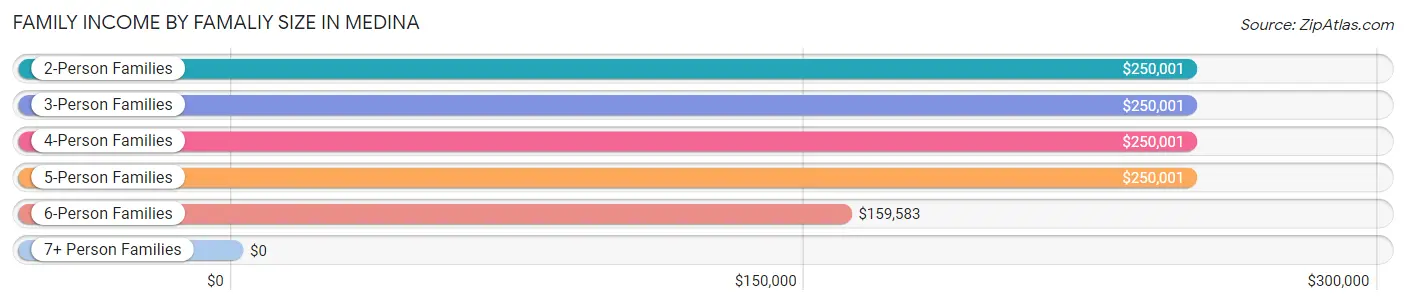
Family Income by Famaliy Size in Medina
2-person families (321 | 37.5%) account for the highest median family income in Medina with $250,001 per family, while 2-person families (321 | 37.5%) have the highest median income of $125,000 per family member.
| Income Bracket | # Families | Median Income |
| 2-Person Families | 321 (37.5%) | $250,001 |
| 3-Person Families | 168 (19.6%) | $250,001 |
| 4-Person Families | 301 (35.1%) | $250,001 |
| 5-Person Families | 52 (6.1%) | $250,001 |
| 6-Person Families | 15 (1.8%) | $159,583 |
| 7+ Person Families | 0 (0.0%) | $0 |
| Total | 857 (100.0%) | $250,001 |
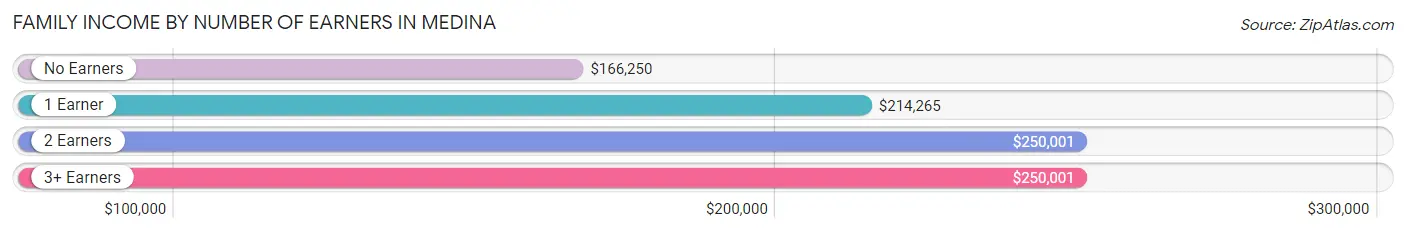
Family Income by Number of Earners in Medina
The median family income in Medina is $250,001, with families comprising 2 earners (286) having the highest median family income of $250,001, while families with no earners (115) have the lowest median family income of $166,250, accounting for 33.4% and 13.4% of families, respectively.
| Number of Earners | # Families | Median Income |
| No Earners | 115 (13.4%) | $166,250 |
| 1 Earner | 396 (46.2%) | $214,265 |
| 2 Earners | 286 (33.4%) | $250,001 |
| 3+ Earners | 60 (7.0%) | $250,001 |
| Total | 857 (100.0%) | $250,001 |
Household Income in Medina
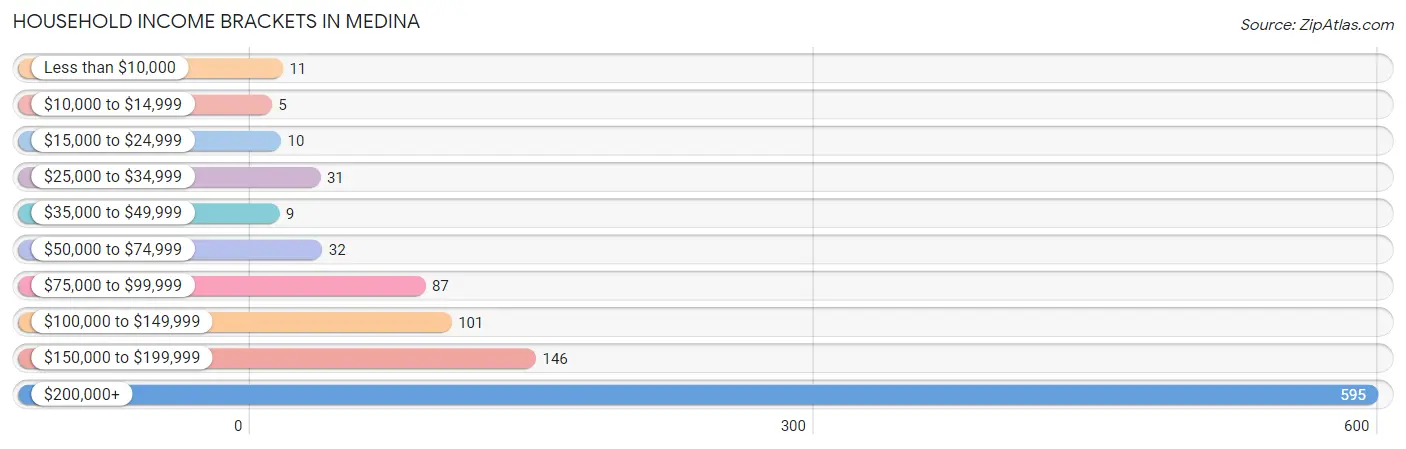
Household Income Brackets in Medina
With 595 households falling in the category, the $200,000+ income range is the most frequent in Medina, accounting for 57.9% of all households. In contrast, only 5 households (0.5%) fall into the $10,000 to $14,999 income bracket, making it the least populous group.
| Income Bracket | # Households | % Households |
| Less than $10,000 | 11 | 1.1% |
| $10,000 to $14,999 | 5 | 0.5% |
| $15,000 to $24,999 | 10 | 1.0% |
| $25,000 to $34,999 | 31 | 3.0% |
| $35,000 to $49,999 | 9 | 0.9% |
| $50,000 to $74,999 | 32 | 3.1% |
| $75,000 to $99,999 | 87 | 8.5% |
| $100,000 to $149,999 | 101 | 9.8% |
| $150,000 to $199,999 | 146 | 14.2% |
| $200,000+ | 595 | 57.9% |
Household Income by Householder Age in Medina
The median household income in Medina is $244,740, with the highest median household income of $250,001 found in the 45 to 64 years age bracket for the primary householder. A total of 517 households (50.3%) fall into this category. Meanwhile, the 15 to 24 years age bracket for the primary householder has the lowest median household income of $0, with 5 households (0.5%) in this group.
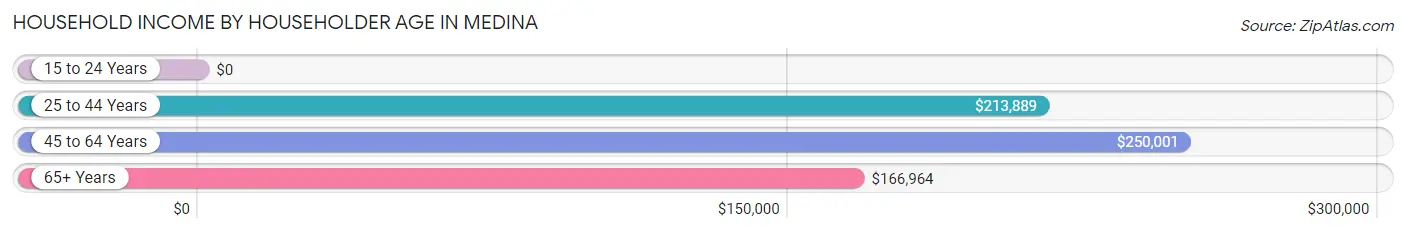
| Income Bracket | # Households | Median Income |
| 15 to 24 Years | 5 (0.5%) | $0 |
| 25 to 44 Years | 182 (17.7%) | $213,889 |
| 45 to 64 Years | 517 (50.3%) | $250,001 |
| 65+ Years | 323 (31.5%) | $166,964 |
| Total | 1,027 (100.0%) | $244,740 |
Poverty in Medina
Income Below Poverty by Sex and Age in Medina
With 2.0% poverty level for males and 3.3% for females among the residents of Medina, under 5 year old males and 16 and 17 year old females are the most vulnerable to poverty, with 12 males (19.7%) and 4 females (9.3%) in their respective age groups living below the poverty level.
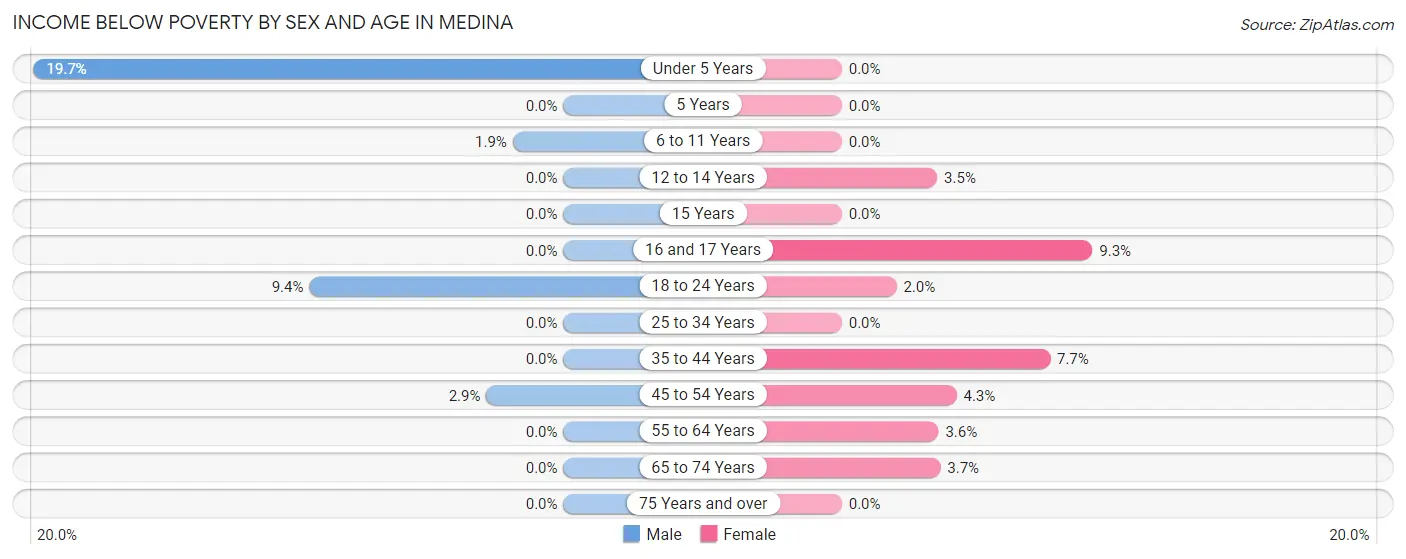
| Age Bracket | Male | Female |
| Under 5 Years | 12 (19.7%) | 0 (0.0%) |
| 5 Years | 0 (0.0%) | 0 (0.0%) |
| 6 to 11 Years | 3 (1.9%) | 0 (0.0%) |
| 12 to 14 Years | 0 (0.0%) | 4 (3.5%) |
| 15 Years | 0 (0.0%) | 0 (0.0%) |
| 16 and 17 Years | 0 (0.0%) | 4 (9.3%) |
| 18 to 24 Years | 5 (9.4%) | 3 (2.0%) |
| 25 to 34 Years | 0 (0.0%) | 0 (0.0%) |
| 35 to 44 Years | 0 (0.0%) | 14 (7.7%) |
| 45 to 54 Years | 9 (2.9%) | 13 (4.3%) |
| 55 to 64 Years | 0 (0.0%) | 6 (3.6%) |
| 65 to 74 Years | 0 (0.0%) | 6 (3.7%) |
| 75 Years and over | 0 (0.0%) | 0 (0.0%) |
| Total | 29 (2.0%) | 50 (3.3%) |
Income Above Poverty by Sex and Age in Medina
According to the poverty statistics in Medina, males aged 5 years and females aged under 5 years are the age groups that are most secure financially, with 100.0% of males and 100.0% of females in these age groups living above the poverty line.
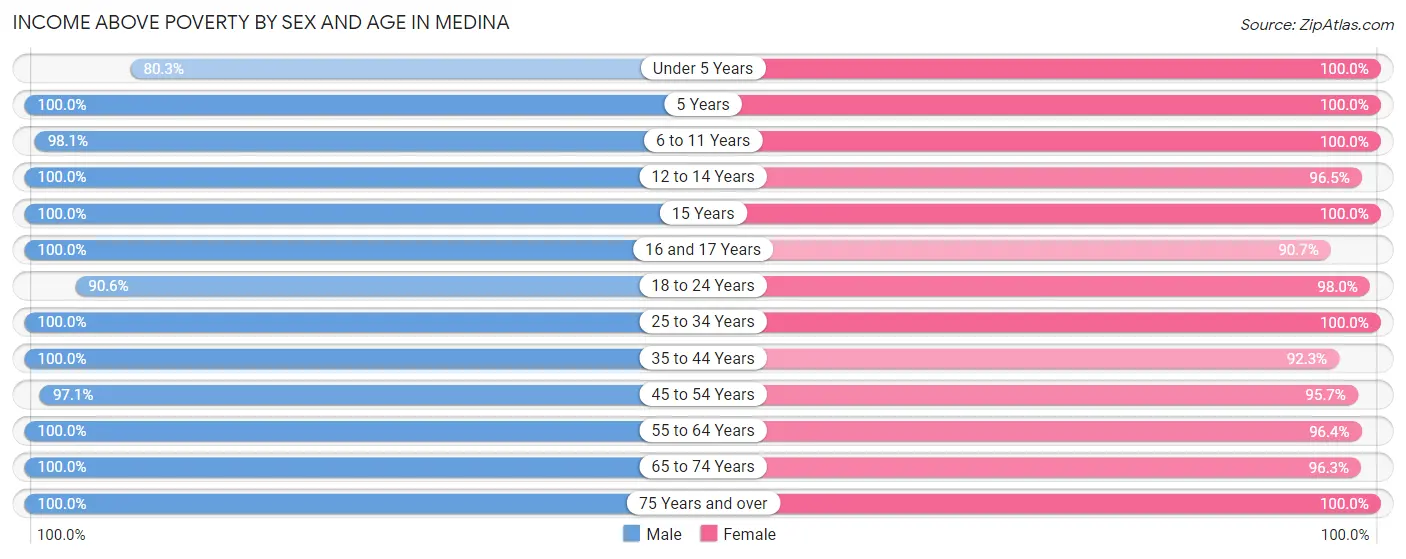
| Age Bracket | Male | Female |
| Under 5 Years | 49 (80.3%) | 54 (100.0%) |
| 5 Years | 3 (100.0%) | 8 (100.0%) |
| 6 to 11 Years | 157 (98.1%) | 125 (100.0%) |
| 12 to 14 Years | 87 (100.0%) | 109 (96.5%) |
| 15 Years | 20 (100.0%) | 32 (100.0%) |
| 16 and 17 Years | 50 (100.0%) | 39 (90.7%) |
| 18 to 24 Years | 48 (90.6%) | 145 (98.0%) |
| 25 to 34 Years | 63 (100.0%) | 42 (100.0%) |
| 35 to 44 Years | 131 (100.0%) | 167 (92.3%) |
| 45 to 54 Years | 306 (97.1%) | 292 (95.7%) |
| 55 to 64 Years | 228 (100.0%) | 161 (96.4%) |
| 65 to 74 Years | 174 (100.0%) | 158 (96.3%) |
| 75 Years and over | 74 (100.0%) | 122 (100.0%) |
| Total | 1,390 (98.0%) | 1,454 (96.7%) |
Income Below Poverty Among Married-Couple Families in Medina
The poverty statistics for married-couple families in Medina show that 1.1% or 9 of the total 793 families live below the poverty line. Families with 3 or 4 children have the highest poverty rate of 10.6%, comprising of 5 families. On the other hand, families with no children have the lowest poverty rate of 0.0%, which includes 0 families.
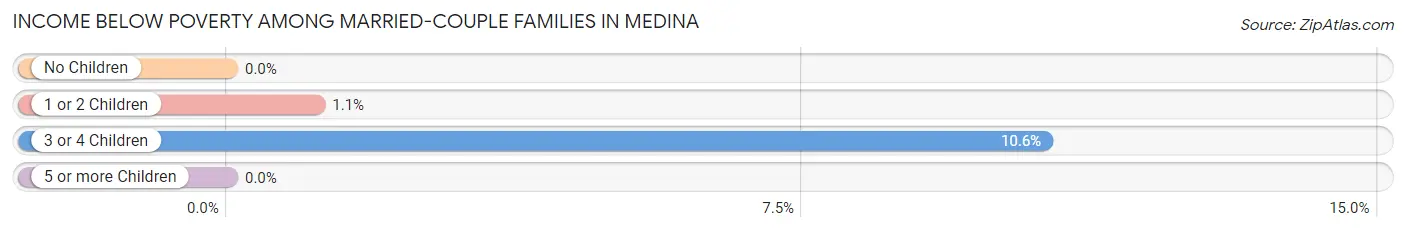
| Children | Above Poverty | Below Poverty |
| No Children | 394 (100.0%) | 0 (0.0%) |
| 1 or 2 Children | 348 (98.9%) | 4 (1.1%) |
| 3 or 4 Children | 42 (89.4%) | 5 (10.6%) |
| 5 or more Children | 0 (0.0%) | 0 (0.0%) |
| Total | 784 (98.9%) | 9 (1.1%) |
Income Below Poverty Among Single-Parent Households in Medina
According to the poverty data in Medina, 9.3% or 5 single-father households and 40.0% or 4 single-mother households are living below the poverty line. Among single-father households, those with no children have the highest poverty rate, with 5 households (25.0%) experiencing poverty. Likewise, among single-mother households, those with 1 or 2 children have the highest poverty rate, with 4 households (40.0%) falling below the poverty line.
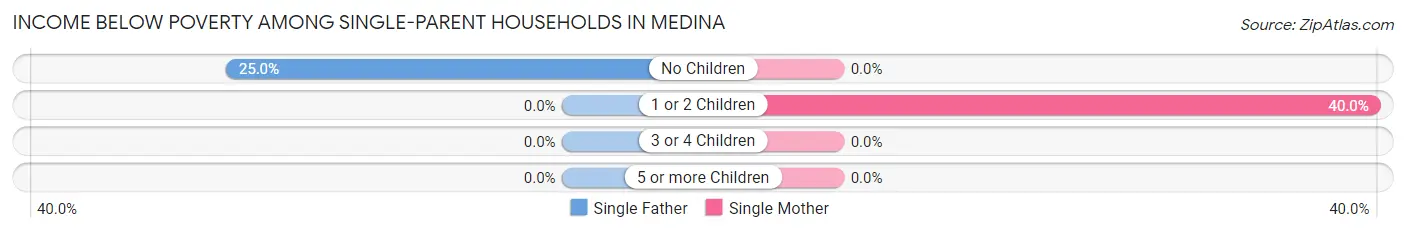
| Children | Single Father | Single Mother |
| No Children | 5 (25.0%) | 0 (0.0%) |
| 1 or 2 Children | 0 (0.0%) | 4 (40.0%) |
| 3 or 4 Children | 0 (0.0%) | 0 (0.0%) |
| 5 or more Children | 0 (0.0%) | 0 (0.0%) |
| Total | 5 (9.3%) | 4 (40.0%) |
Income Below Poverty Among Married-Couple vs Single-Parent Households in Medina
The poverty data for Medina shows that 9 of the married-couple family households (1.1%) and 9 of the single-parent households (14.1%) are living below the poverty level. Within the married-couple family households, those with 3 or 4 children have the highest poverty rate, with 5 households (10.6%) falling below the poverty line. Among the single-parent households, those with no children have the highest poverty rate, with 5 household (25.0%) living below poverty.
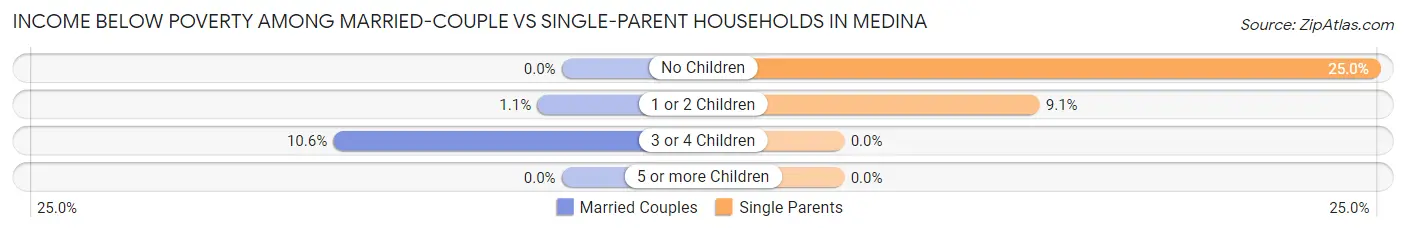
| Children | Married-Couple Families | Single-Parent Households |
| No Children | 0 (0.0%) | 5 (25.0%) |
| 1 or 2 Children | 4 (1.1%) | 4 (9.1%) |
| 3 or 4 Children | 5 (10.6%) | 0 (0.0%) |
| 5 or more Children | 0 (0.0%) | 0 (0.0%) |
| Total | 9 (1.1%) | 9 (14.1%) |
Race in Medina
The most populous races in Medina are White / Caucasian (1,809 | 61.9%), Asian (797 | 27.3%), and Two or more Races (290 | 9.9%).
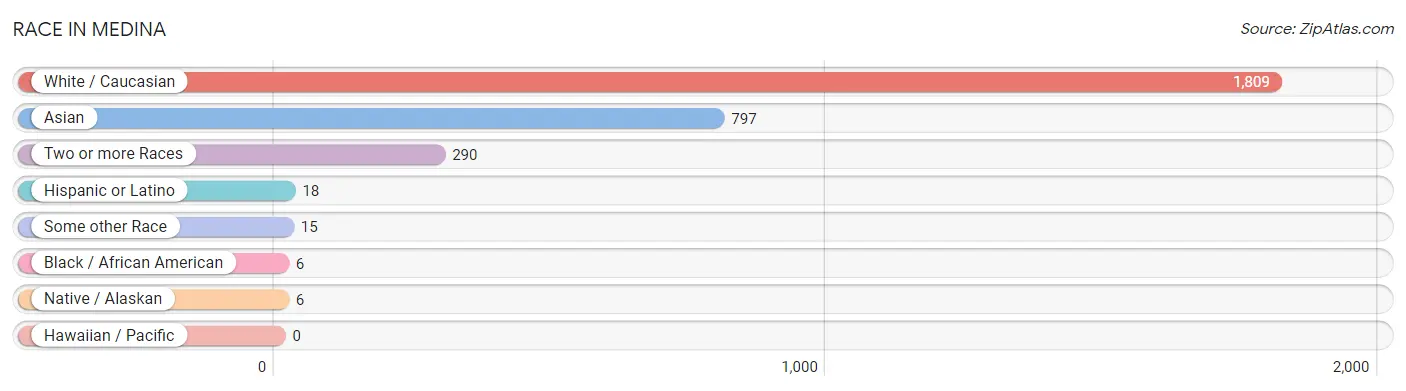
| Race | # Population | % Population |
| Asian | 797 | 27.3% |
| Black / African American | 6 | 0.2% |
| Hawaiian / Pacific | 0 | 0.0% |
| Hispanic or Latino | 18 | 0.6% |
| Native / Alaskan | 6 | 0.2% |
| White / Caucasian | 1,809 | 61.9% |
| Two or more Races | 290 | 9.9% |
| Some other Race | 15 | 0.5% |
| Total | 2,923 | 100.0% |
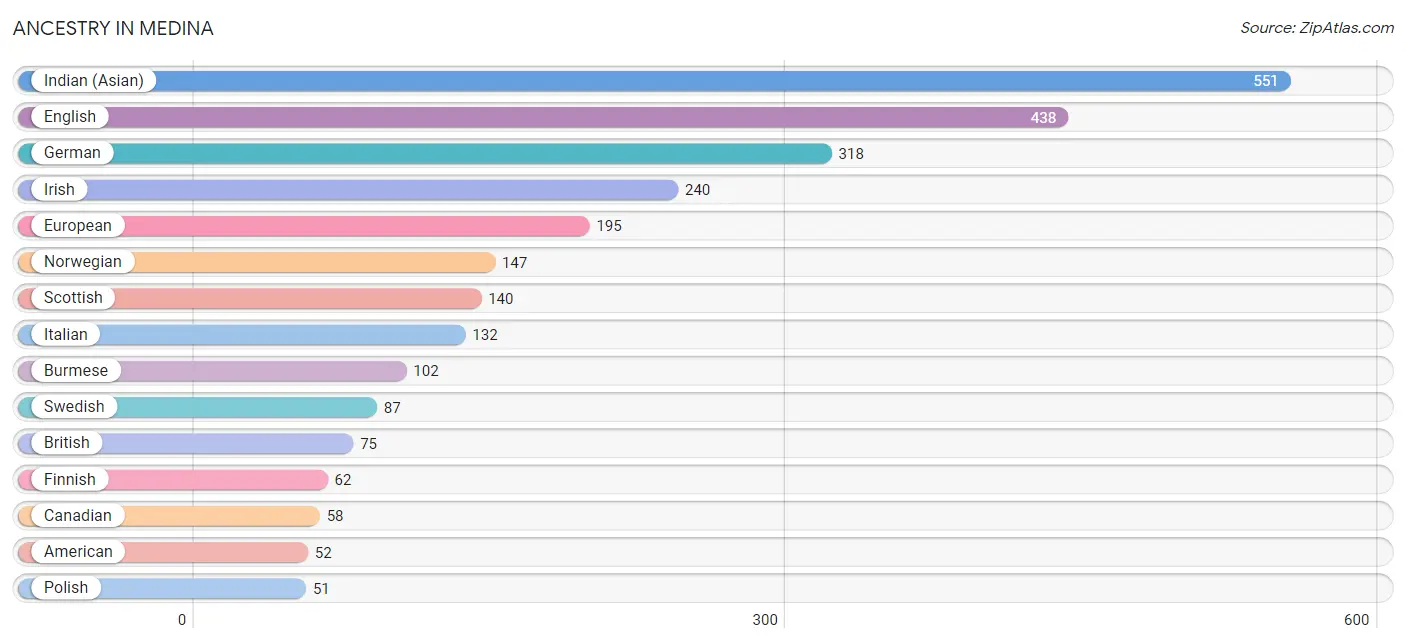
Ancestry in Medina
The most populous ancestries reported in Medina are Indian (Asian) (551 | 18.9%), English (438 | 15.0%), German (318 | 10.9%), Irish (240 | 8.2%), and European (195 | 6.7%), together accounting for 59.6% of all Medina residents.
| Ancestry | # Population | % Population |
| American | 52 | 1.8% |
| Arab | 9 | 0.3% |
| Armenian | 10 | 0.3% |
| Austrian | 4 | 0.1% |
| Belgian | 7 | 0.2% |
| Bhutanese | 36 | 1.2% |
| British | 75 | 2.6% |
| Burmese | 102 | 3.5% |
| Canadian | 58 | 2.0% |
| Central American Indian | 5 | 0.2% |
| Cherokee | 12 | 0.4% |
| Chippewa | 8 | 0.3% |
| Colombian | 5 | 0.2% |
| Croatian | 3 | 0.1% |
| Czech | 9 | 0.3% |
| Danish | 11 | 0.4% |
| Dutch | 11 | 0.4% |
| Eastern European | 4 | 0.1% |
| English | 438 | 15.0% |
| European | 195 | 6.7% |
| Filipino | 27 | 0.9% |
| Finnish | 62 | 2.1% |
| French | 21 | 0.7% |
| French Canadian | 5 | 0.2% |
| German | 318 | 10.9% |
| Greek | 11 | 0.4% |
| Hungarian | 4 | 0.1% |
| Indian (Asian) | 551 | 18.9% |
| Iranian | 13 | 0.4% |
| Irish | 240 | 8.2% |
| Italian | 132 | 4.5% |
| Japanese | 4 | 0.1% |
| Korean | 14 | 0.5% |
| Latvian | 6 | 0.2% |
| Lebanese | 4 | 0.1% |
| Lithuanian | 5 | 0.2% |
| Mexican | 5 | 0.2% |
| Moroccan | 5 | 0.2% |
| Native Hawaiian | 14 | 0.5% |
| Northern European | 46 | 1.6% |
| Norwegian | 147 | 5.0% |
| Polish | 51 | 1.7% |
| Puerto Rican | 3 | 0.1% |
| Russian | 18 | 0.6% |
| Scandinavian | 18 | 0.6% |
| Scotch-Irish | 25 | 0.9% |
| Scottish | 140 | 4.8% |
| Serbian | 3 | 0.1% |
| South American | 5 | 0.2% |
| Spanish | 5 | 0.2% |
| Sri Lankan | 6 | 0.2% |
| Swedish | 87 | 3.0% |
| Swiss | 19 | 0.6% |
| Thai | 42 | 1.4% |
| Ukrainian | 34 | 1.2% |
| Welsh | 11 | 0.4% |
| Yaqui | 5 | 0.2% | View All 57 Rows |
Immigrants in Medina
The most numerous immigrant groups reported in Medina came from Asia (552 | 18.9%), Eastern Asia (459 | 15.7%), China (370 | 12.7%), Europe (196 | 6.7%), and Northern Europe (144 | 4.9%), together accounting for 58.9% of all Medina residents.
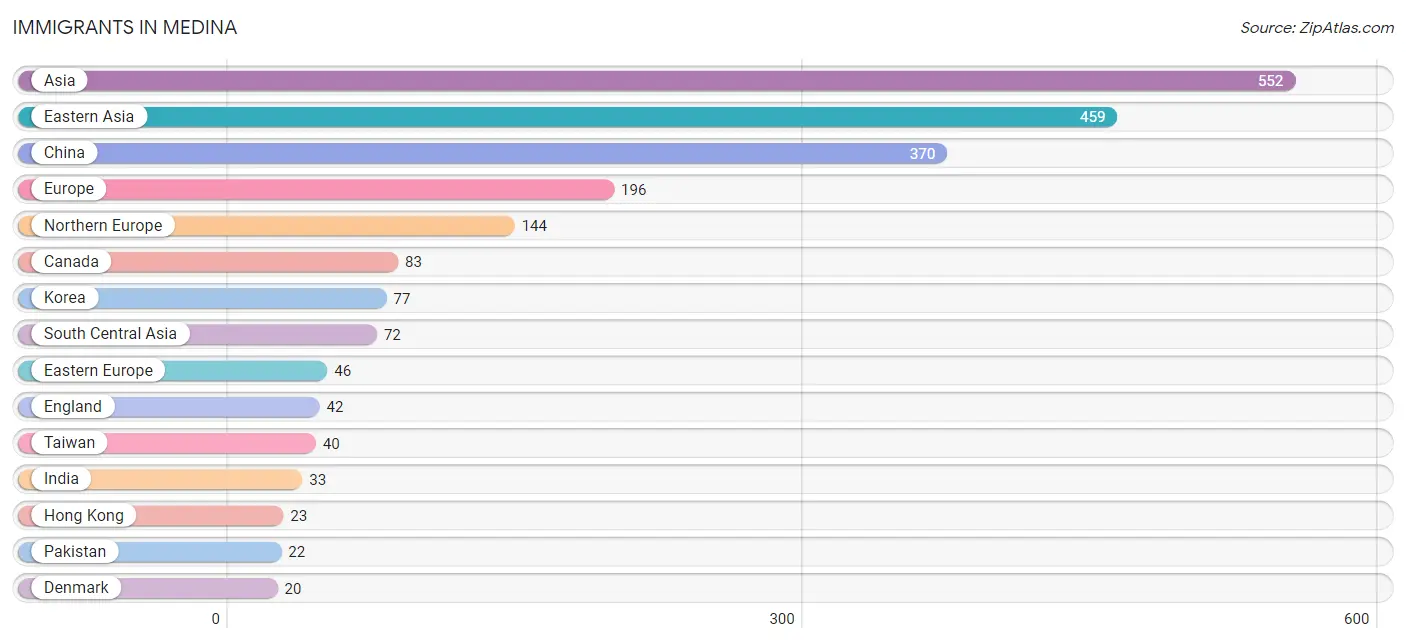
| Immigration Origin | # Population | % Population |
| Africa | 4 | 0.1% |
| Asia | 552 | 18.9% |
| Australia | 8 | 0.3% |
| Cambodia | 4 | 0.1% |
| Canada | 83 | 2.8% |
| China | 370 | 12.7% |
| Colombia | 5 | 0.2% |
| Czechoslovakia | 4 | 0.1% |
| Denmark | 20 | 0.7% |
| Eastern Africa | 4 | 0.1% |
| Eastern Asia | 459 | 15.7% |
| Eastern Europe | 46 | 1.6% |
| England | 42 | 1.4% |
| Europe | 196 | 6.7% |
| Hong Kong | 23 | 0.8% |
| India | 33 | 1.1% |
| Iran | 13 | 0.4% |
| Italy | 6 | 0.2% |
| Japan | 12 | 0.4% |
| Kenya | 4 | 0.1% |
| Korea | 77 | 2.6% |
| Latin America | 5 | 0.2% |
| Nepal | 4 | 0.1% |
| Northern Europe | 144 | 4.9% |
| Norway | 6 | 0.2% |
| Oceania | 8 | 0.3% |
| Pakistan | 22 | 0.7% |
| Philippines | 6 | 0.2% |
| South America | 5 | 0.2% |
| South Central Asia | 72 | 2.5% |
| South Eastern Asia | 16 | 0.5% |
| Southern Europe | 6 | 0.2% |
| Taiwan | 40 | 1.4% |
| Vietnam | 6 | 0.2% | View All 34 Rows |
Sex and Age in Medina
Sex and Age in Medina
The most populous age groups in Medina are 50 to 54 Years (202 | 14.2%) for men and 10 to 14 Years (186 | 12.4%) for women.
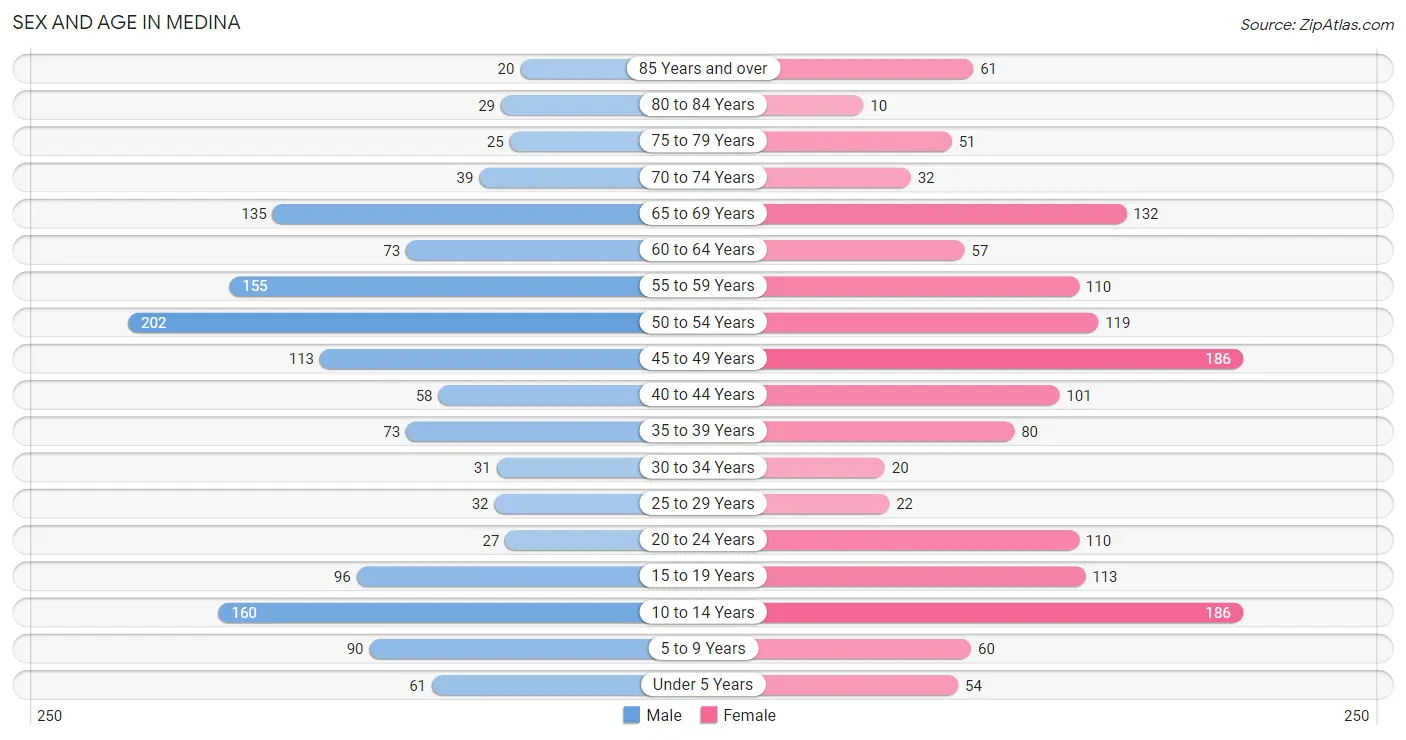
| Age Bracket | Male | Female |
| Under 5 Years | 61 (4.3%) | 54 (3.6%) |
| 5 to 9 Years | 90 (6.3%) | 60 (4.0%) |
| 10 to 14 Years | 160 (11.3%) | 186 (12.4%) |
| 15 to 19 Years | 96 (6.8%) | 113 (7.5%) |
| 20 to 24 Years | 27 (1.9%) | 110 (7.3%) |
| 25 to 29 Years | 32 (2.3%) | 22 (1.5%) |
| 30 to 34 Years | 31 (2.2%) | 20 (1.3%) |
| 35 to 39 Years | 73 (5.1%) | 80 (5.3%) |
| 40 to 44 Years | 58 (4.1%) | 101 (6.7%) |
| 45 to 49 Years | 113 (8.0%) | 186 (12.4%) |
| 50 to 54 Years | 202 (14.2%) | 119 (7.9%) |
| 55 to 59 Years | 155 (10.9%) | 110 (7.3%) |
| 60 to 64 Years | 73 (5.1%) | 57 (3.8%) |
| 65 to 69 Years | 135 (9.5%) | 132 (8.8%) |
| 70 to 74 Years | 39 (2.8%) | 32 (2.1%) |
| 75 to 79 Years | 25 (1.8%) | 51 (3.4%) |
| 80 to 84 Years | 29 (2.0%) | 10 (0.7%) |
| 85 Years and over | 20 (1.4%) | 61 (4.1%) |
| Total | 1,419 (100.0%) | 1,504 (100.0%) |
Families and Households in Medina
Median Family Size in Medina
The median family size in Medina is 3.08 persons per family, with married-couple families (793 | 92.5%) accounting for the largest median family size of 3.11 persons per family. On the other hand, single female/mother families (10 | 1.2%) represent the smallest median family size with 2.40 persons per family.
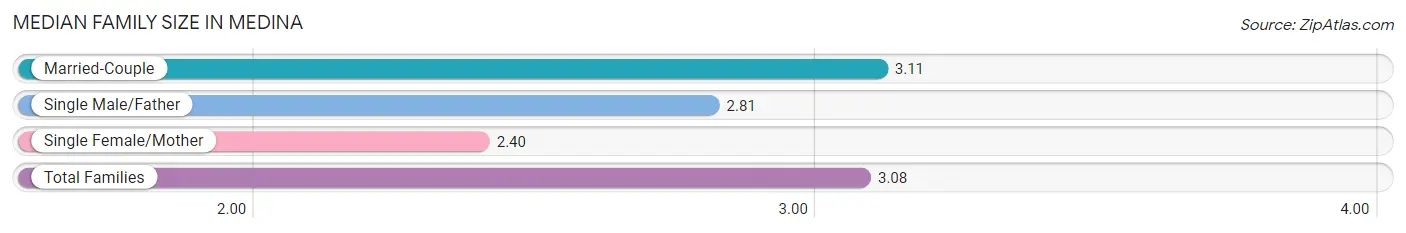
| Family Type | # Families | Family Size |
| Married-Couple | 793 (92.5%) | 3.11 |
| Single Male/Father | 54 (6.3%) | 2.81 |
| Single Female/Mother | 10 (1.2%) | 2.40 |
| Total Families | 857 (100.0%) | 3.08 |
Median Household Size in Medina
The median household size in Medina is 2.85 persons per household, with married-couple households (793 | 77.2%) accounting for the largest median household size of 3.21 persons per household. non-family households (170 | 16.6%) represent the smallest median household size with 1.14 persons per household.
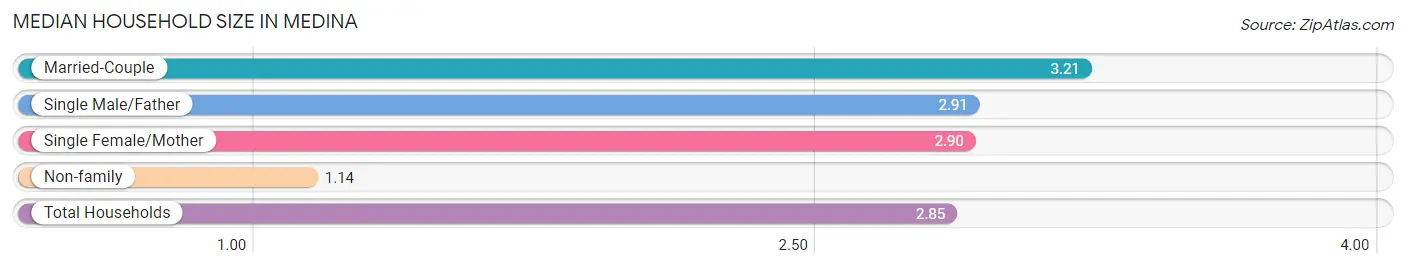
| Household Type | # Households | Household Size |
| Married-Couple | 793 (77.2%) | 3.21 |
| Single Male/Father | 54 (5.3%) | 2.91 |
| Single Female/Mother | 10 (1.0%) | 2.90 |
| Non-family | 170 (16.6%) | 1.14 |
| Total Households | 1,027 (100.0%) | 2.85 |
Household Size by Marriage Status in Medina
Out of a total of 1,027 households in Medina, 857 (83.5%) are family households, while 170 (16.6%) are nonfamily households. The most numerous type of family households are 2-person households, comprising 316, and the most common type of nonfamily households are 1-person households, comprising 147.
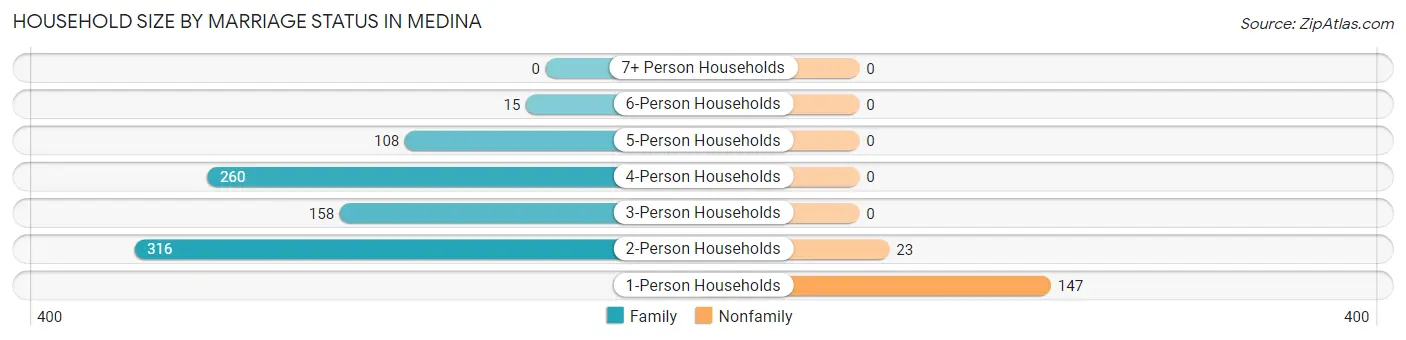
| Household Size | Family Households | Nonfamily Households |
| 1-Person Households | - | 147 (14.3%) |
| 2-Person Households | 316 (30.8%) | 23 (2.2%) |
| 3-Person Households | 158 (15.4%) | 0 (0.0%) |
| 4-Person Households | 260 (25.3%) | 0 (0.0%) |
| 5-Person Households | 108 (10.5%) | 0 (0.0%) |
| 6-Person Households | 15 (1.5%) | 0 (0.0%) |
| 7+ Person Households | 0 (0.0%) | 0 (0.0%) |
| Total | 857 (83.5%) | 170 (16.6%) |
Female Fertility in Medina
Fertility by Age in Medina
Average fertility rate in Medina is 9.0 births per 1,000 women. Women in the age bracket of 35 to 50 years have the highest fertility rate with 15.0 births per 1,000 women. Women in the age bracket of 35 to 50 years acount for 100.0% of all women with births.
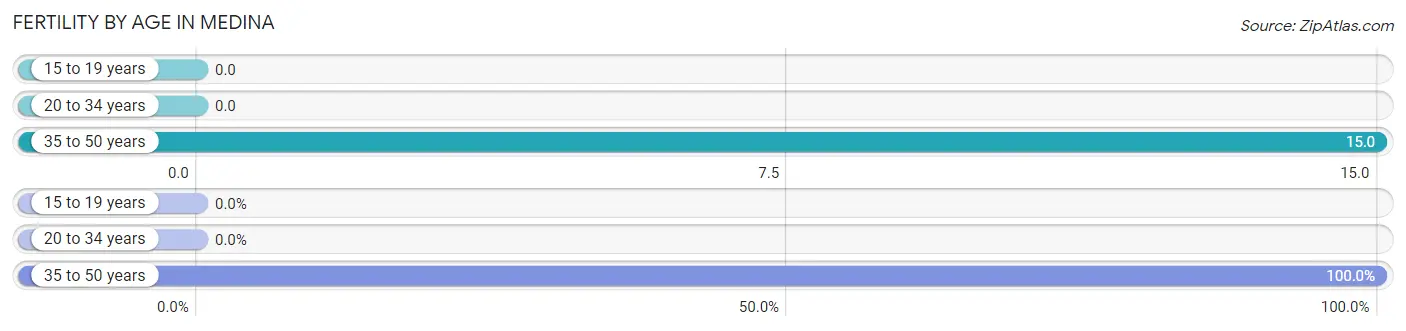
| Age Bracket | Women with Births | Births / 1,000 Women |
| 15 to 19 years | 0 (0.0%) | 0.0 |
| 20 to 34 years | 0 (0.0%) | 0.0 |
| 35 to 50 years | 6 (100.0%) | 15.0 |
| Total | 6 (100.0%) | 9.0 |
Fertility by Age by Marriage Status in Medina
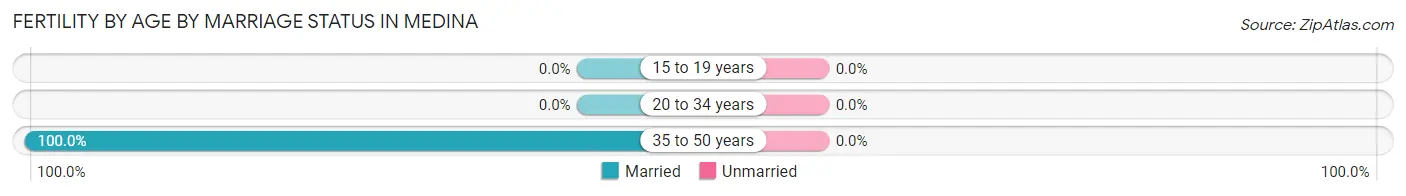
| Age Bracket | Married | Unmarried |
| 15 to 19 years | 0 (0.0%) | 0 (0.0%) |
| 20 to 34 years | 0 (0.0%) | 0 (0.0%) |
| 35 to 50 years | 6 (100.0%) | 0 (0.0%) |
| Total | 6 (100.0%) | 0 (0.0%) |
Fertility by Education in Medina
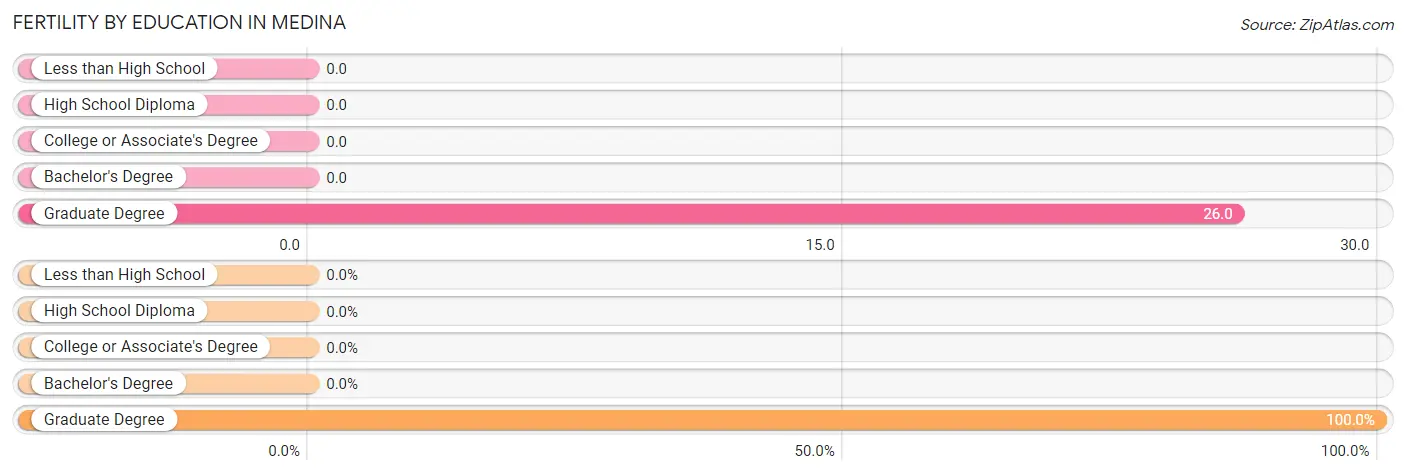
| Educational Attainment | Women with Births | Births / 1,000 Women |
| Less than High School | 0 (0.0%) | 0.0 |
| High School Diploma | 0 (0.0%) | 0.0 |
| College or Associate's Degree | 0 (0.0%) | 0.0 |
| Bachelor's Degree | 0 (0.0%) | 0.0 |
| Graduate Degree | 6 (100.0%) | 26.0 |
| Total | 6 (100.0%) | 9.0 |
Fertility by Education by Marriage Status in Medina
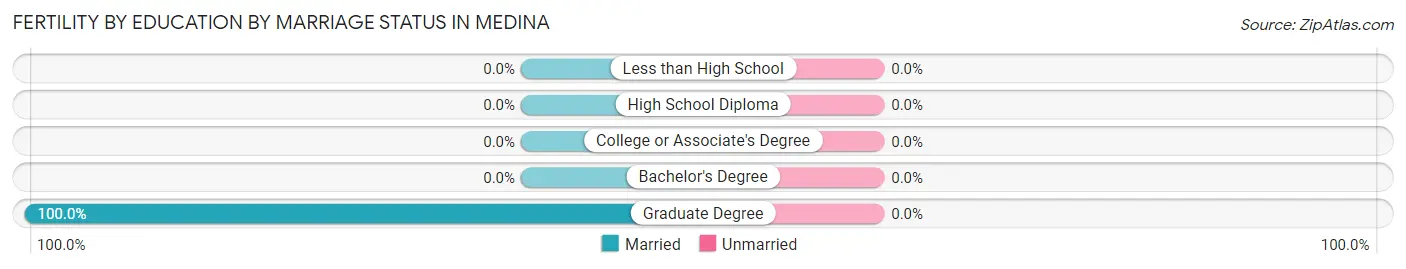
| Educational Attainment | Married | Unmarried |
| Less than High School | 0 (0.0%) | 0 (0.0%) |
| High School Diploma | 0 (0.0%) | 0 (0.0%) |
| College or Associate's Degree | 0 (0.0%) | 0 (0.0%) |
| Bachelor's Degree | 0 (0.0%) | 0 (0.0%) |
| Graduate Degree | 6 (100.0%) | 0 (0.0%) |
| Total | 6 (100.0%) | 0 (0.0%) |
Employment Characteristics in Medina
Employment by Class of Employer in Medina
Among the 1,202 employed individuals in Medina, private company employees (867 | 72.1%), self-employed (not incorporated) (148 | 12.3%), and self-employed (incorporated) (107 | 8.9%) make up the most common classes of employment.
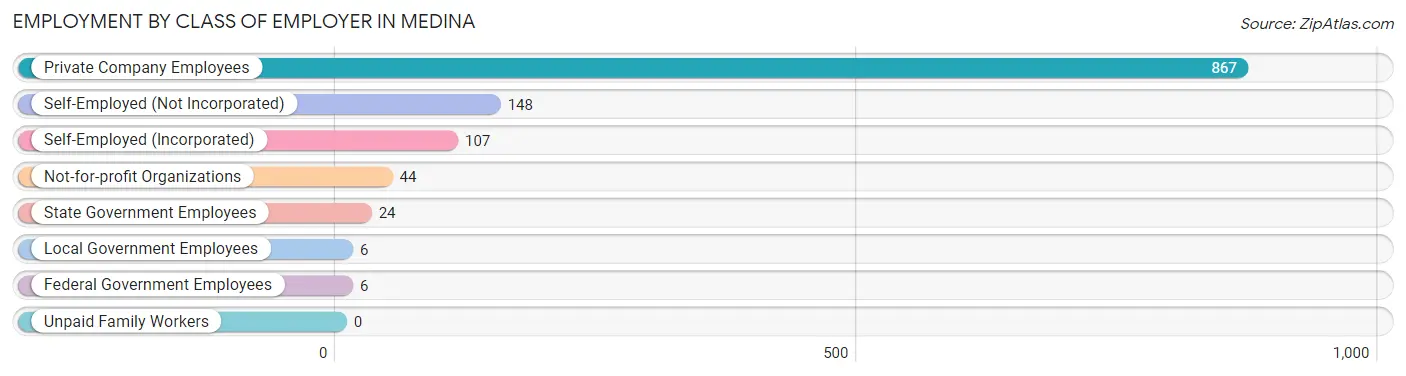
| Employer Class | # Employees | % Employees |
| Private Company Employees | 867 | 72.1% |
| Self-Employed (Incorporated) | 107 | 8.9% |
| Self-Employed (Not Incorporated) | 148 | 12.3% |
| Not-for-profit Organizations | 44 | 3.7% |
| Local Government Employees | 6 | 0.5% |
| State Government Employees | 24 | 2.0% |
| Federal Government Employees | 6 | 0.5% |
| Unpaid Family Workers | 0 | 0.0% |
| Total | 1,202 | 100.0% |
Employment Status by Age in Medina
According to the labor force statistics for Medina, out of the total population over 16 years of age (2,260), 55.4% or 1,252 individuals are in the labor force, with 2.2% or 28 of them unemployed. The age group with the highest labor force participation rate is 25 to 29 years, with 100.0% or 54 individuals in the labor force. Within the labor force, the 65 to 74 years age range has the highest percentage of unemployed individuals, with 15.5% or 18 of them being unemployed.
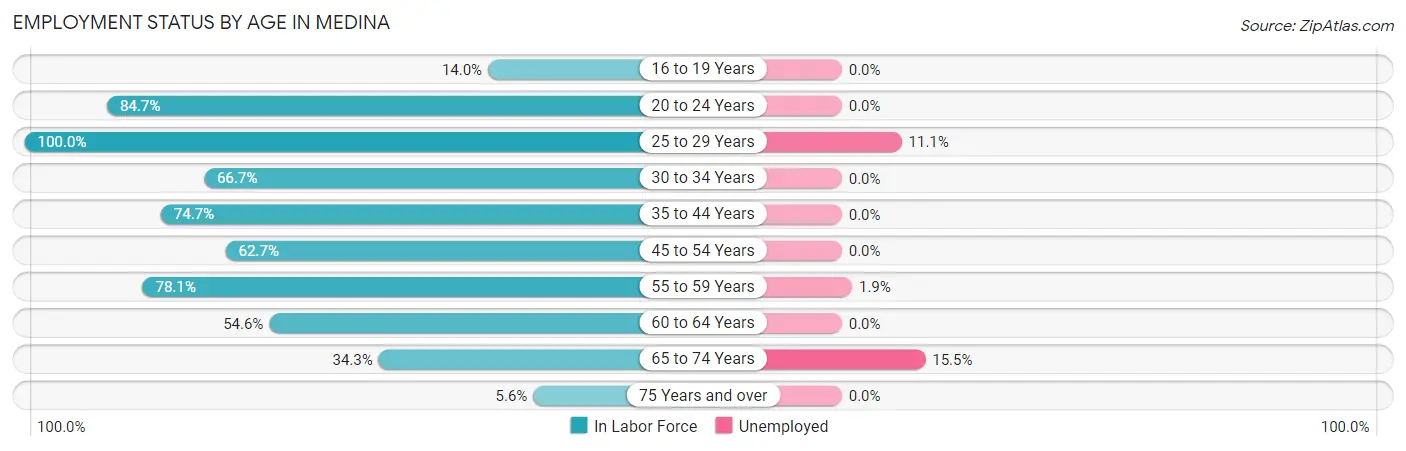
| Age Bracket | In Labor Force | Unemployed |
| 16 to 19 Years | 22 (14.0%) | 0 (0.0%) |
| 20 to 24 Years | 116 (84.7%) | 0 (0.0%) |
| 25 to 29 Years | 54 (100.0%) | 6 (11.1%) |
| 30 to 34 Years | 34 (66.7%) | 0 (0.0%) |
| 35 to 44 Years | 233 (74.7%) | 0 (0.0%) |
| 45 to 54 Years | 389 (62.7%) | 0 (0.0%) |
| 55 to 59 Years | 207 (78.1%) | 4 (1.9%) |
| 60 to 64 Years | 71 (54.6%) | 0 (0.0%) |
| 65 to 74 Years | 116 (34.3%) | 18 (15.5%) |
| 75 Years and over | 11 (5.6%) | 0 (0.0%) |
| Total | 1,252 (55.4%) | 28 (2.2%) |
Employment Status by Educational Attainment in Medina
According to labor force statistics for Medina, 69.0% of individuals (988) out of the total population between 25 and 64 years of age (1,432) are in the labor force, with 1.0% or 10 of them being unemployed. The group with the highest labor force participation rate are those with the educational attainment of less than high school, with 78.9% or 15 individuals in the labor force. Within the labor force, individuals with bachelor's degree or higher education have the highest percentage of unemployment, with 1.1% or 10 of them being unemployed.
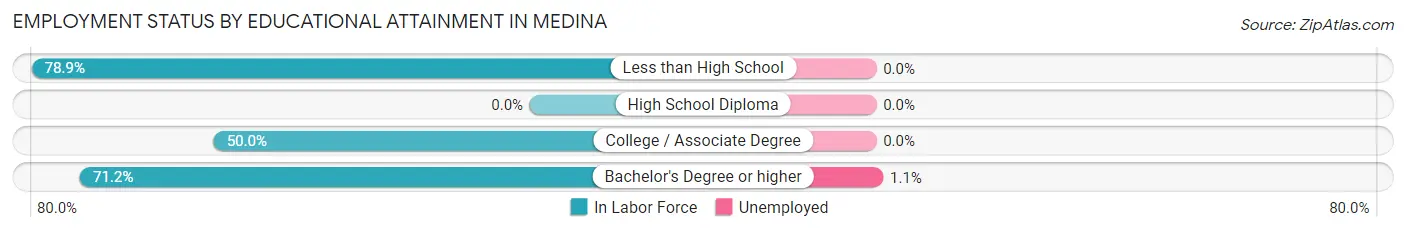
| Educational Attainment | In Labor Force | Unemployed |
| Less than High School | 15 (78.9%) | 0 (0.0%) |
| High School Diploma | 0 (0.0%) | 0 (0.0%) |
| College / Associate Degree | 48 (50.0%) | 0 (0.0%) |
| Bachelor's Degree or higher | 925 (71.2%) | 14 (1.1%) |
| Total | 988 (69.0%) | 14 (1.0%) |
Employment Occupations by Sex in Medina
Management, Business, Science and Arts Occupations
The most common Management, Business, Science and Arts occupations in Medina are Management (453 | 37.0%), Computers, Engineering & Science (164 | 13.4%), Computers & Mathematics (129 | 10.5%), Business & Financial (122 | 10.0%), and Health Diagnosing & Treating (84 | 6.9%).

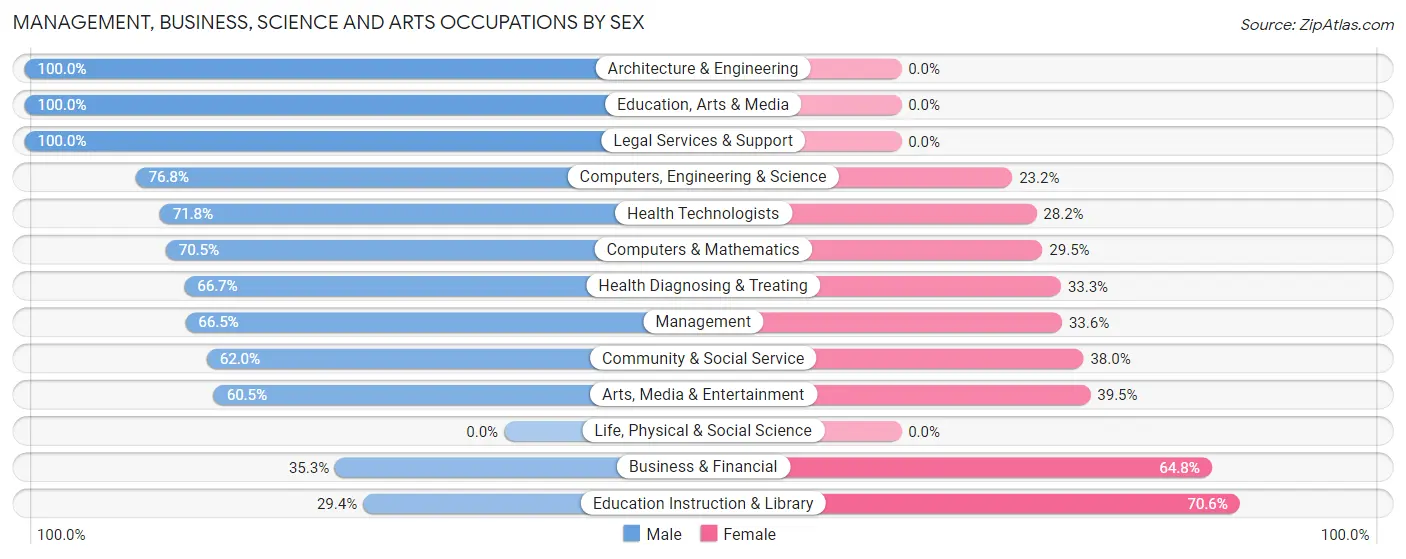
Management, Business, Science and Arts Occupations by Sex
Within the Management, Business, Science and Arts occupations in Medina, the most male-oriented occupations are Architecture & Engineering (100.0%), Education, Arts & Media (100.0%), and Legal Services & Support (100.0%), while the most female-oriented occupations are Education Instruction & Library (70.6%), Business & Financial (64.7%), and Arts, Media & Entertainment (39.5%).
| Occupation | Male | Female |
| Management | 301 (66.4%) | 152 (33.6%) |
| Business & Financial | 43 (35.2%) | 79 (64.7%) |
| Computers, Engineering & Science | 126 (76.8%) | 38 (23.2%) |
| Computers & Mathematics | 91 (70.5%) | 38 (29.5%) |
| Architecture & Engineering | 35 (100.0%) | 0 (0.0%) |
| Life, Physical & Social Science | 0 (0.0%) | 0 (0.0%) |
| Community & Social Service | 44 (62.0%) | 27 (38.0%) |
| Education, Arts & Media | 4 (100.0%) | 0 (0.0%) |
| Legal Services & Support | 12 (100.0%) | 0 (0.0%) |
| Education Instruction & Library | 5 (29.4%) | 12 (70.6%) |
| Arts, Media & Entertainment | 23 (60.5%) | 15 (39.5%) |
| Health Diagnosing & Treating | 56 (66.7%) | 28 (33.3%) |
| Health Technologists | 56 (71.8%) | 22 (28.2%) |
| Total (Category) | 570 (63.8%) | 324 (36.2%) |
| Total (Overall) | 735 (60.0%) | 490 (40.0%) |
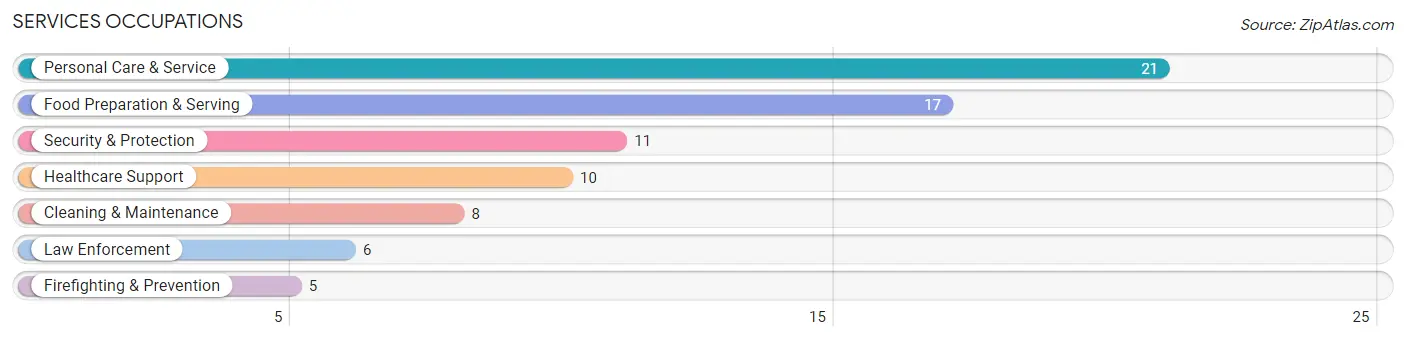
Services Occupations
The most common Services occupations in Medina are Personal Care & Service (21 | 1.7%), Food Preparation & Serving (17 | 1.4%), Security & Protection (11 | 0.9%), Healthcare Support (10 | 0.8%), and Cleaning & Maintenance (8 | 0.6%).
Services Occupations by Sex
Within the Services occupations in Medina, the most male-oriented occupations are Law Enforcement (100.0%), Security & Protection (54.5%), and Cleaning & Maintenance (50.0%), while the most female-oriented occupations are Healthcare Support (100.0%), Firefighting & Prevention (100.0%), and Personal Care & Service (100.0%).
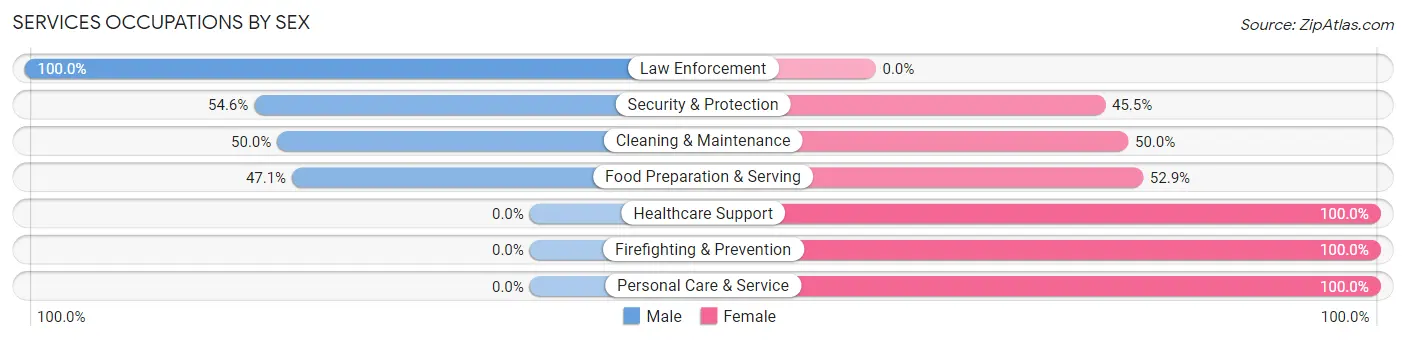
| Occupation | Male | Female |
| Healthcare Support | 0 (0.0%) | 10 (100.0%) |
| Security & Protection | 6 (54.5%) | 5 (45.5%) |
| Firefighting & Prevention | 0 (0.0%) | 5 (100.0%) |
| Law Enforcement | 6 (100.0%) | 0 (0.0%) |
| Food Preparation & Serving | 8 (47.1%) | 9 (52.9%) |
| Cleaning & Maintenance | 4 (50.0%) | 4 (50.0%) |
| Personal Care & Service | 0 (0.0%) | 21 (100.0%) |
| Total (Category) | 18 (26.9%) | 49 (73.1%) |
| Total (Overall) | 735 (60.0%) | 490 (40.0%) |
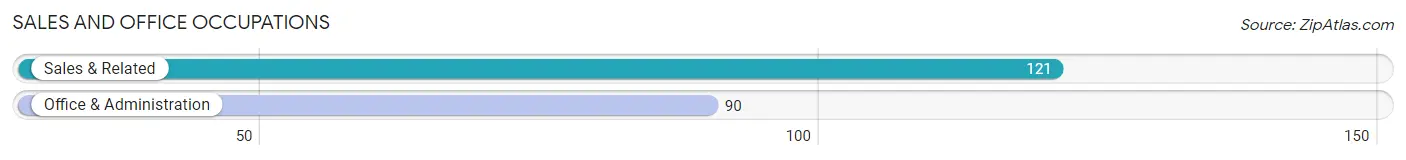
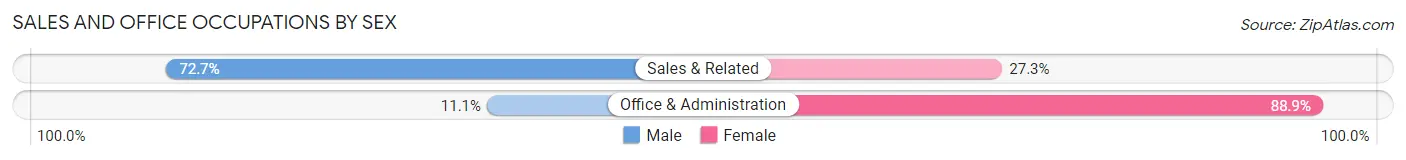
Sales and Office Occupations
The most common Sales and Office occupations in Medina are Sales & Related (121 | 9.9%), and Office & Administration (90 | 7.3%).
Sales and Office Occupations by Sex
| Occupation | Male | Female |
| Sales & Related | 88 (72.7%) | 33 (27.3%) |
| Office & Administration | 10 (11.1%) | 80 (88.9%) |
| Total (Category) | 98 (46.5%) | 113 (53.5%) |
| Total (Overall) | 735 (60.0%) | 490 (40.0%) |
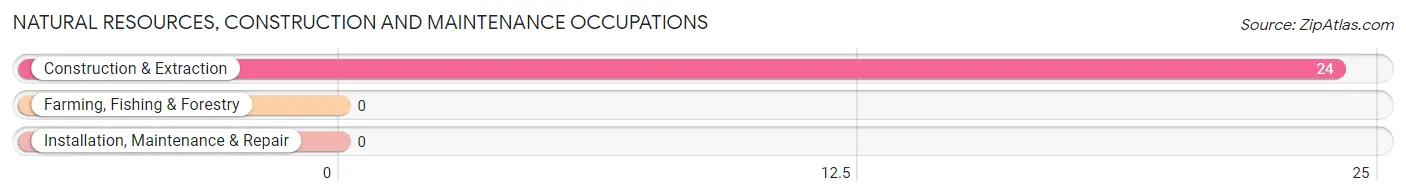
Natural Resources, Construction and Maintenance Occupations
The most common Natural Resources, Construction and Maintenance occupations in Medina are , and Construction & Extraction (24 | 2.0%).
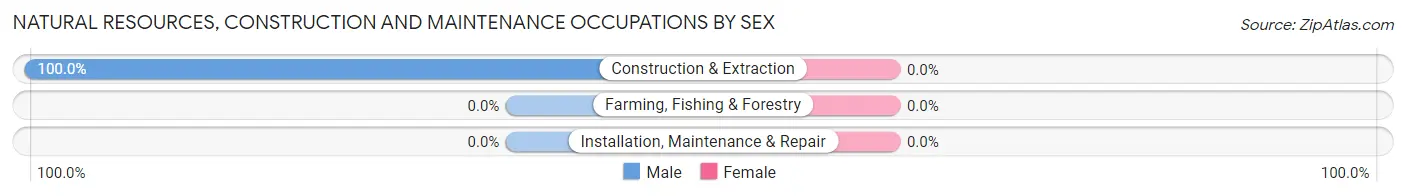
Natural Resources, Construction and Maintenance Occupations by Sex
| Occupation | Male | Female |
| Farming, Fishing & Forestry | 0 (0.0%) | 0 (0.0%) |
| Construction & Extraction | 24 (100.0%) | 0 (0.0%) |
| Installation, Maintenance & Repair | 0 (0.0%) | 0 (0.0%) |
| Total (Category) | 24 (100.0%) | 0 (0.0%) |
| Total (Overall) | 735 (60.0%) | 490 (40.0%) |
Production, Transportation and Moving Occupations
The most common Production, Transportation and Moving occupations in Medina are Material Moving (16 | 1.3%), Transportation (8 | 0.6%), and Production (5 | 0.4%).
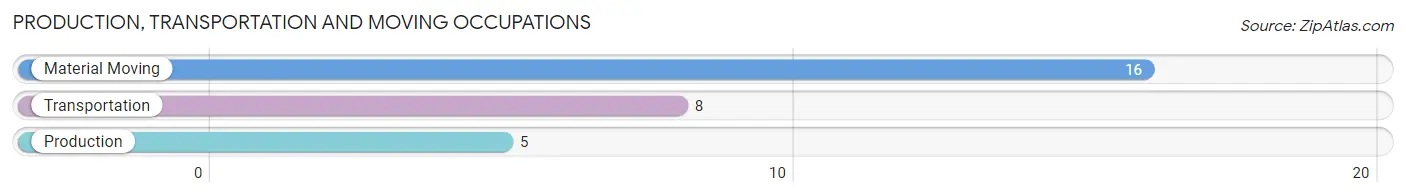
Production, Transportation and Moving Occupations by Sex
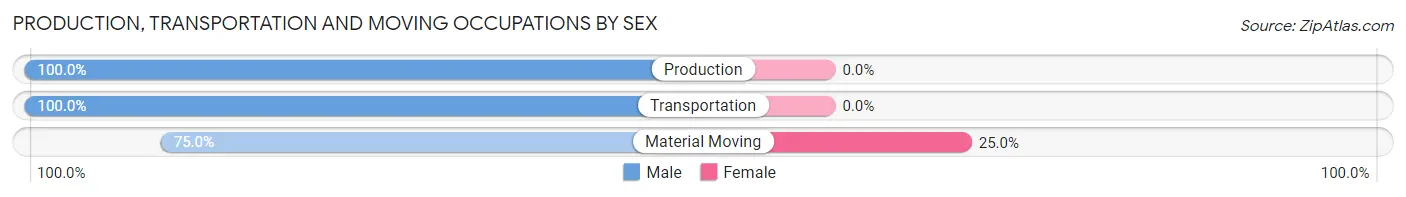
| Occupation | Male | Female |
| Production | 5 (100.0%) | 0 (0.0%) |
| Transportation | 8 (100.0%) | 0 (0.0%) |
| Material Moving | 12 (75.0%) | 4 (25.0%) |
| Total (Category) | 25 (86.2%) | 4 (13.8%) |
| Total (Overall) | 735 (60.0%) | 490 (40.0%) |
Employment Industries by Sex in Medina
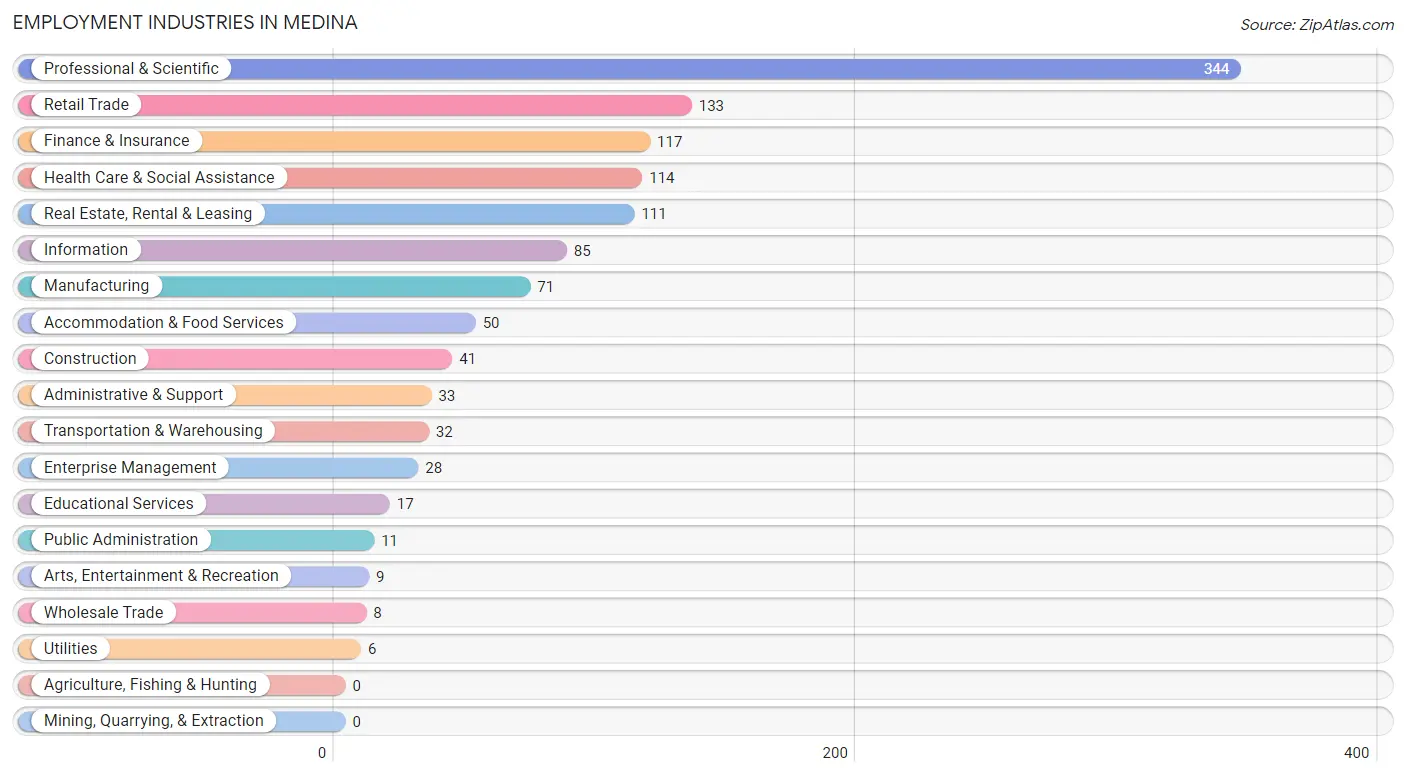
Employment Industries in Medina
The major employment industries in Medina include Professional & Scientific (344 | 28.1%), Retail Trade (133 | 10.9%), Finance & Insurance (117 | 9.6%), Health Care & Social Assistance (114 | 9.3%), and Real Estate, Rental & Leasing (111 | 9.1%).
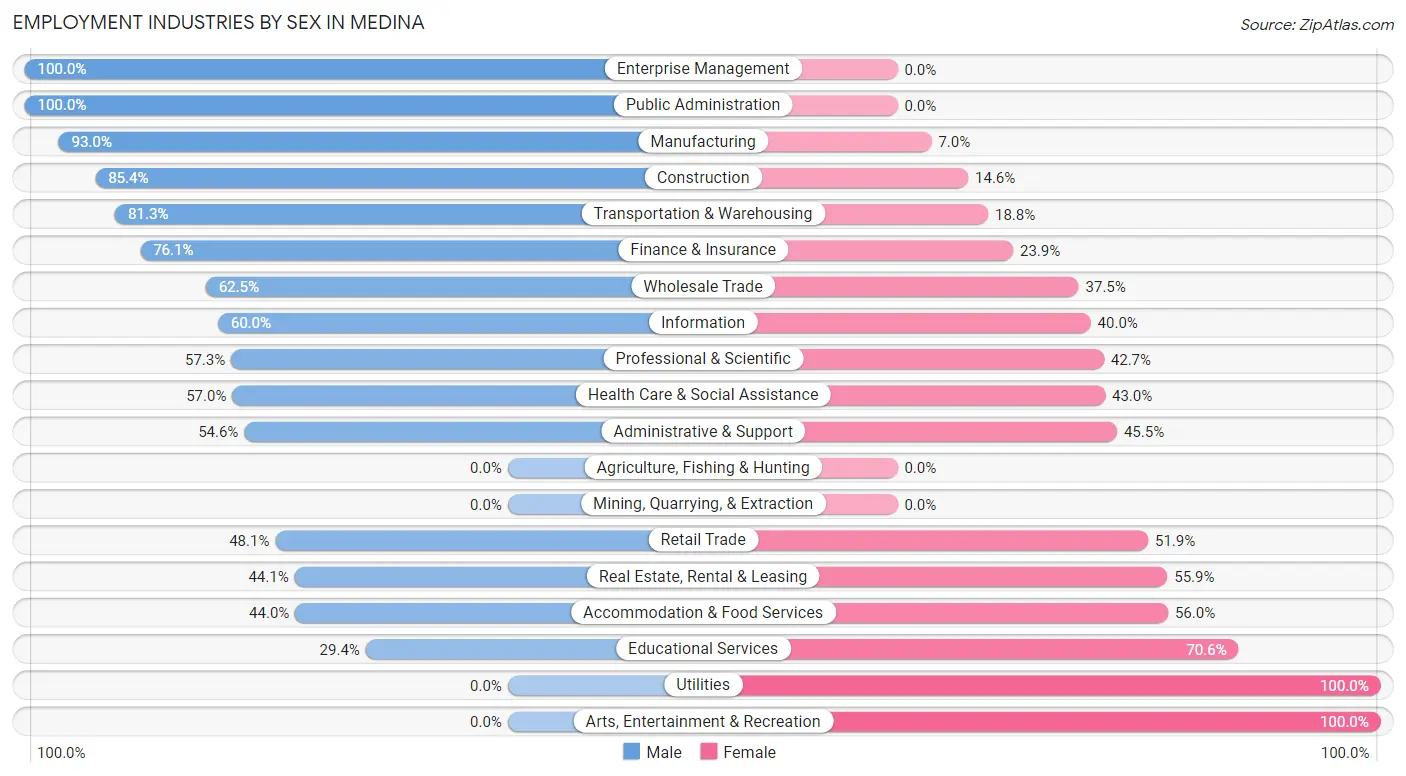
Employment Industries by Sex in Medina
The Medina industries that see more men than women are Enterprise Management (100.0%), Public Administration (100.0%), and Manufacturing (93.0%), whereas the industries that tend to have a higher number of women are Utilities (100.0%), Arts, Entertainment & Recreation (100.0%), and Educational Services (70.6%).
| Industry | Male | Female |
| Agriculture, Fishing & Hunting | 0 (0.0%) | 0 (0.0%) |
| Mining, Quarrying, & Extraction | 0 (0.0%) | 0 (0.0%) |
| Construction | 35 (85.4%) | 6 (14.6%) |
| Manufacturing | 66 (93.0%) | 5 (7.0%) |
| Wholesale Trade | 5 (62.5%) | 3 (37.5%) |
| Retail Trade | 64 (48.1%) | 69 (51.9%) |
| Transportation & Warehousing | 26 (81.2%) | 6 (18.8%) |
| Utilities | 0 (0.0%) | 6 (100.0%) |
| Information | 51 (60.0%) | 34 (40.0%) |
| Finance & Insurance | 89 (76.1%) | 28 (23.9%) |
| Real Estate, Rental & Leasing | 49 (44.1%) | 62 (55.9%) |
| Professional & Scientific | 197 (57.3%) | 147 (42.7%) |
| Enterprise Management | 28 (100.0%) | 0 (0.0%) |
| Administrative & Support | 18 (54.5%) | 15 (45.5%) |
| Educational Services | 5 (29.4%) | 12 (70.6%) |
| Health Care & Social Assistance | 65 (57.0%) | 49 (43.0%) |
| Arts, Entertainment & Recreation | 0 (0.0%) | 9 (100.0%) |
| Accommodation & Food Services | 22 (44.0%) | 28 (56.0%) |
| Public Administration | 11 (100.0%) | 0 (0.0%) |
| Total | 735 (60.0%) | 490 (40.0%) |
Education in Medina
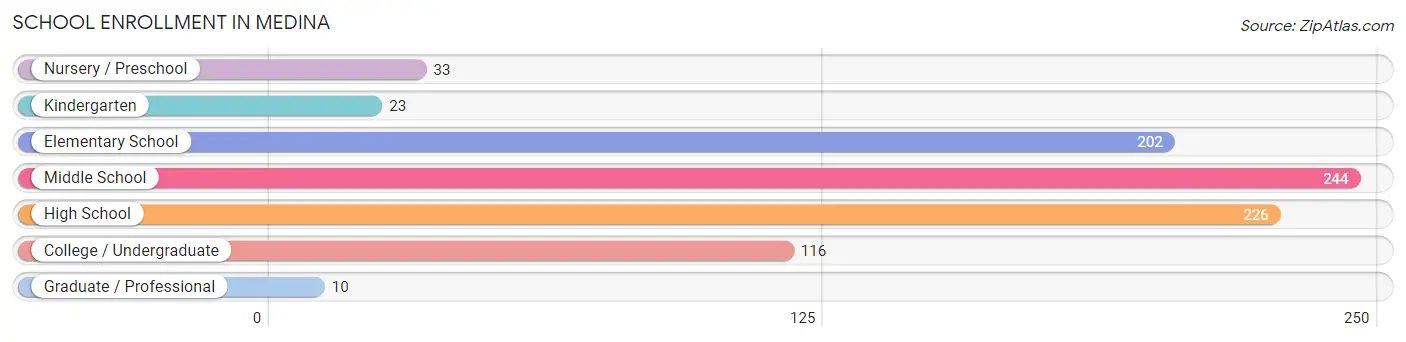
School Enrollment in Medina
The most common levels of schooling among the 854 students in Medina are middle school (244 | 28.6%), high school (226 | 26.5%), and elementary school (202 | 23.6%).
| School Level | # Students | % Students |
| Nursery / Preschool | 33 | 3.9% |
| Kindergarten | 23 | 2.7% |
| Elementary School | 202 | 23.6% |
| Middle School | 244 | 28.6% |
| High School | 226 | 26.5% |
| College / Undergraduate | 116 | 13.6% |
| Graduate / Professional | 10 | 1.2% |
| Total | 854 | 100.0% |
School Enrollment by Age by Funding Source in Medina
Out of a total of 854 students who are enrolled in schools in Medina, 353 (41.3%) attend a private institution, while the remaining 501 (58.7%) are enrolled in public schools. The age group of 35 years and over has the highest likelihood of being enrolled in private schools, with 12 (100.0% in the age bracket) enrolled. Conversely, the age group of 25 to 34 year olds has the lowest likelihood of being enrolled in a private school, with 5 (100.0% in the age bracket) attending a public institution.
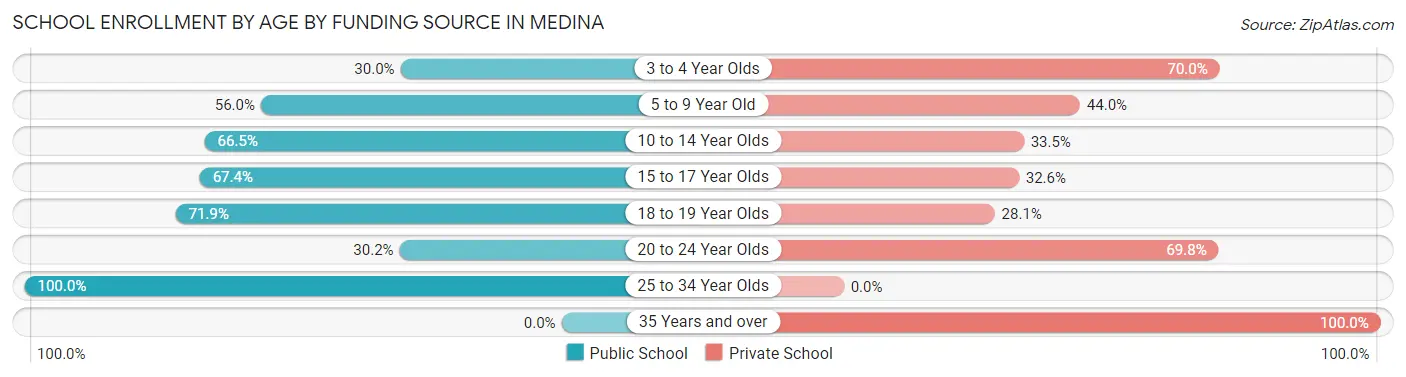
| Age Bracket | Public School | Private School |
| 3 to 4 Year Olds | 9 (30.0%) | 21 (70.0%) |
| 5 to 9 Year Old | 84 (56.0%) | 66 (44.0%) |
| 10 to 14 Year Olds | 230 (66.5%) | 116 (33.5%) |
| 15 to 17 Year Olds | 95 (67.4%) | 46 (32.6%) |
| 18 to 19 Year Olds | 46 (71.9%) | 18 (28.1%) |
| 20 to 24 Year Olds | 32 (30.2%) | 74 (69.8%) |
| 25 to 34 Year Olds | 5 (100.0%) | 0 (0.0%) |
| 35 Years and over | 0 (0.0%) | 12 (100.0%) |
| Total | 501 (58.7%) | 353 (41.3%) |
Educational Attainment by Field of Study in Medina
Business (471 | 25.5%), engineering (209 | 11.3%), computers & mathematics (183 | 9.9%), bio, nature & agricultural (166 | 9.0%), and social sciences (159 | 8.6%) are the most common fields of study among 1,851 individuals in Medina who have obtained a bachelor's degree or higher.
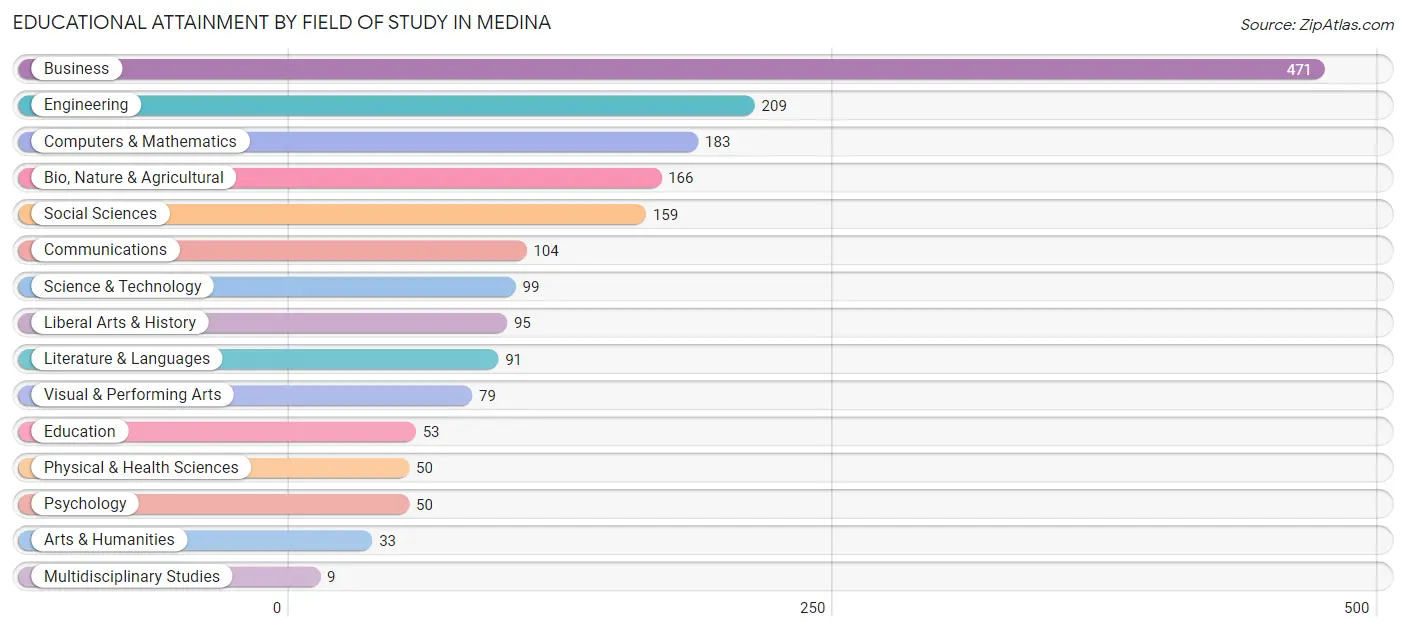
| Field of Study | # Graduates | % Graduates |
| Computers & Mathematics | 183 | 9.9% |
| Bio, Nature & Agricultural | 166 | 9.0% |
| Physical & Health Sciences | 50 | 2.7% |
| Psychology | 50 | 2.7% |
| Social Sciences | 159 | 8.6% |
| Engineering | 209 | 11.3% |
| Multidisciplinary Studies | 9 | 0.5% |
| Science & Technology | 99 | 5.3% |
| Business | 471 | 25.5% |
| Education | 53 | 2.9% |
| Literature & Languages | 91 | 4.9% |
| Liberal Arts & History | 95 | 5.1% |
| Visual & Performing Arts | 79 | 4.3% |
| Communications | 104 | 5.6% |
| Arts & Humanities | 33 | 1.8% |
| Total | 1,851 | 100.0% |
Transportation & Commute in Medina
Vehicle Availability by Sex in Medina
The most prevalent vehicle ownership categories in Medina are males with 2 vehicles (345, accounting for 48.5%) and females with 2 vehicles (223, making up 70.4%).
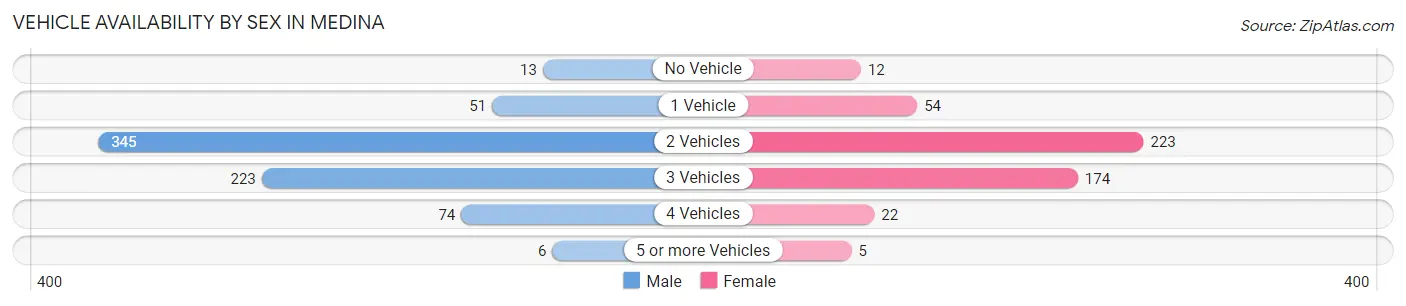
| Vehicles Available | Male | Female |
| No Vehicle | 13 (1.8%) | 12 (2.5%) |
| 1 Vehicle | 51 (7.2%) | 54 (11.0%) |
| 2 Vehicles | 345 (48.5%) | 223 (45.5%) |
| 3 Vehicles | 223 (31.3%) | 174 (35.5%) |
| 4 Vehicles | 74 (10.4%) | 22 (4.5%) |
| 5 or more Vehicles | 6 (0.8%) | 5 (1.0%) |
| Total | 712 (100.0%) | 490 (100.0%) |
Commute Time in Medina
The most frequently occuring commute durations in Medina are 15 to 19 minutes (150 commuters, 18.6%), 20 to 24 minutes (150 commuters, 18.6%), and 10 to 14 minutes (143 commuters, 17.7%).
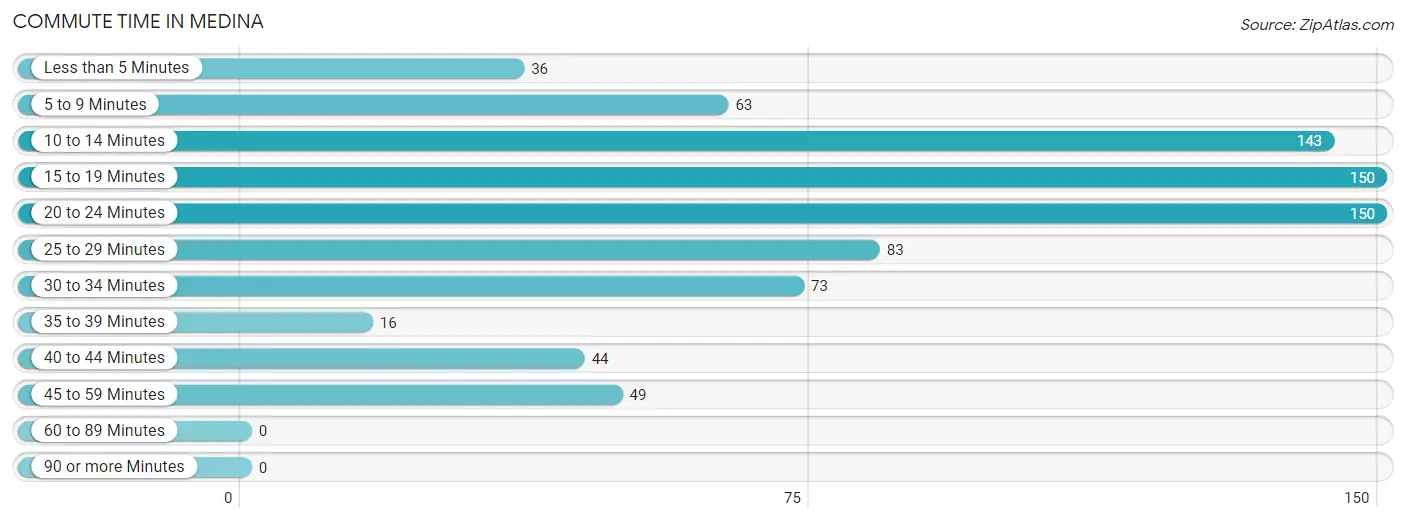
| Commute Time | # Commuters | % Commuters |
| Less than 5 Minutes | 36 | 4.5% |
| 5 to 9 Minutes | 63 | 7.8% |
| 10 to 14 Minutes | 143 | 17.7% |
| 15 to 19 Minutes | 150 | 18.6% |
| 20 to 24 Minutes | 150 | 18.6% |
| 25 to 29 Minutes | 83 | 10.3% |
| 30 to 34 Minutes | 73 | 9.0% |
| 35 to 39 Minutes | 16 | 2.0% |
| 40 to 44 Minutes | 44 | 5.4% |
| 45 to 59 Minutes | 49 | 6.1% |
| 60 to 89 Minutes | 0 | 0.0% |
| 90 or more Minutes | 0 | 0.0% |
Commute Time by Sex in Medina
The most common commute times in Medina are 15 to 19 minutes (106 commuters, 20.3%) for males and 20 to 24 minutes (54 commuters, 19.0%) for females.
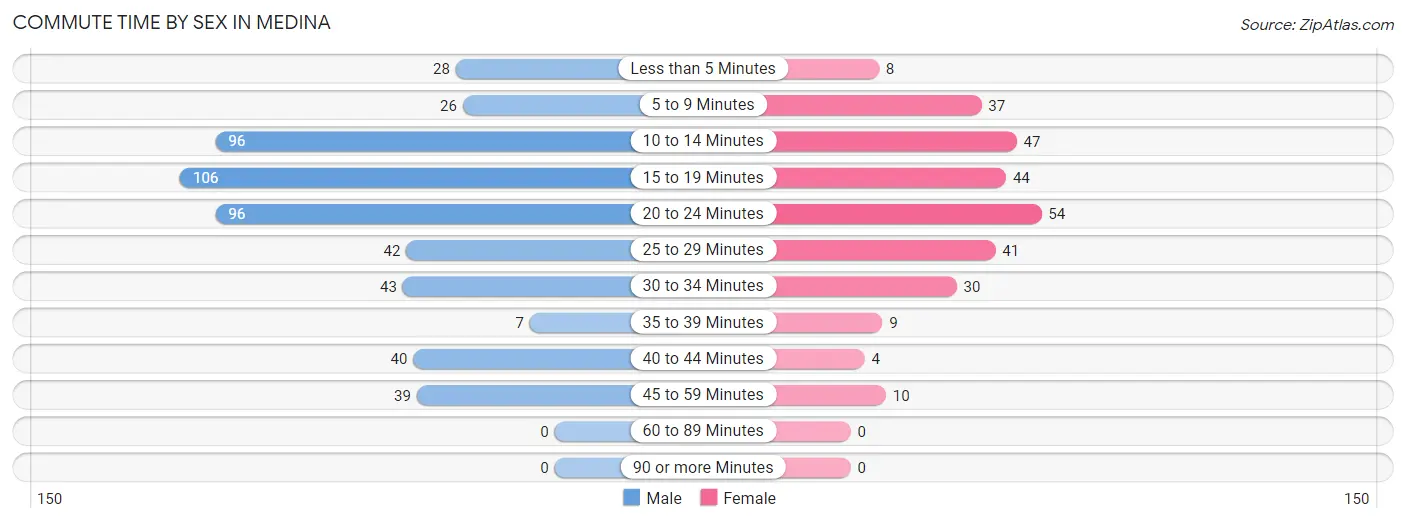
| Commute Time | Male | Female |
| Less than 5 Minutes | 28 (5.3%) | 8 (2.8%) |
| 5 to 9 Minutes | 26 (5.0%) | 37 (13.0%) |
| 10 to 14 Minutes | 96 (18.4%) | 47 (16.6%) |
| 15 to 19 Minutes | 106 (20.3%) | 44 (15.5%) |
| 20 to 24 Minutes | 96 (18.4%) | 54 (19.0%) |
| 25 to 29 Minutes | 42 (8.0%) | 41 (14.4%) |
| 30 to 34 Minutes | 43 (8.2%) | 30 (10.6%) |
| 35 to 39 Minutes | 7 (1.3%) | 9 (3.2%) |
| 40 to 44 Minutes | 40 (7.6%) | 4 (1.4%) |
| 45 to 59 Minutes | 39 (7.5%) | 10 (3.5%) |
| 60 to 89 Minutes | 0 (0.0%) | 0 (0.0%) |
| 90 or more Minutes | 0 (0.0%) | 0 (0.0%) |
Time of Departure to Work by Sex in Medina
The most frequent times of departure to work in Medina are 7:30 AM to 7:59 AM (122, 23.3%) for males and 7:30 AM to 7:59 AM (79, 27.8%) for females.
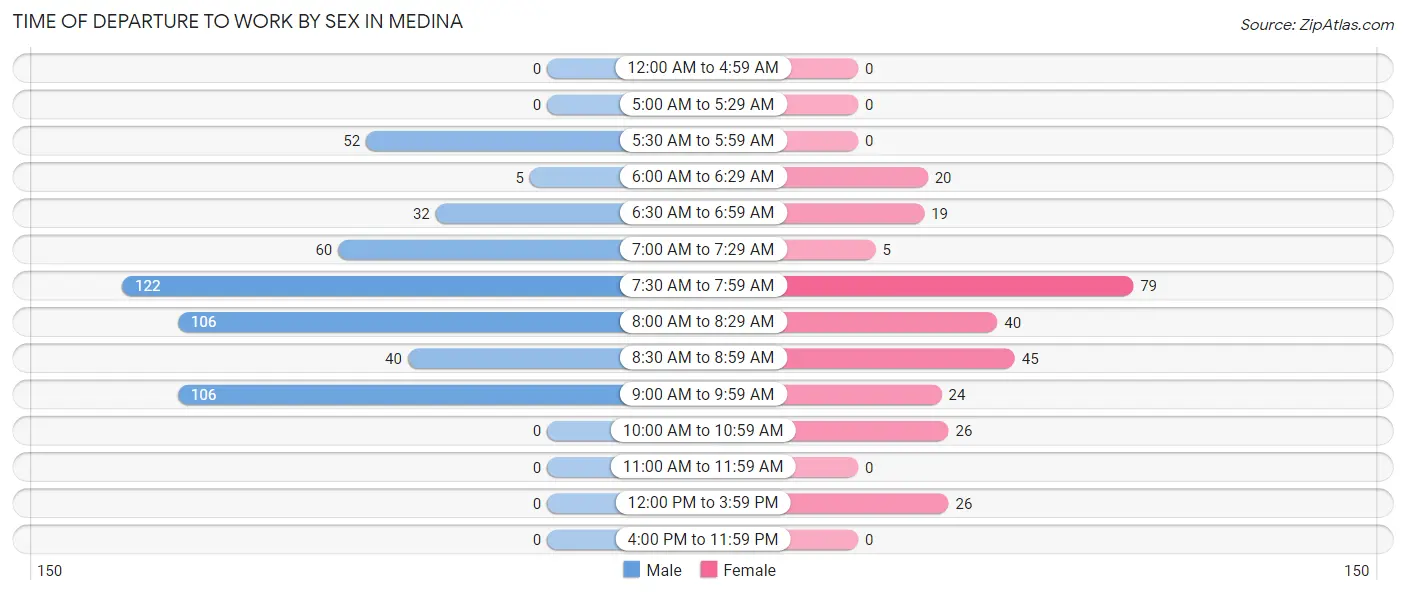
| Time of Departure | Male | Female |
| 12:00 AM to 4:59 AM | 0 (0.0%) | 0 (0.0%) |
| 5:00 AM to 5:29 AM | 0 (0.0%) | 0 (0.0%) |
| 5:30 AM to 5:59 AM | 52 (9.9%) | 0 (0.0%) |
| 6:00 AM to 6:29 AM | 5 (1.0%) | 20 (7.0%) |
| 6:30 AM to 6:59 AM | 32 (6.1%) | 19 (6.7%) |
| 7:00 AM to 7:29 AM | 60 (11.5%) | 5 (1.8%) |
| 7:30 AM to 7:59 AM | 122 (23.3%) | 79 (27.8%) |
| 8:00 AM to 8:29 AM | 106 (20.3%) | 40 (14.1%) |
| 8:30 AM to 8:59 AM | 40 (7.6%) | 45 (15.9%) |
| 9:00 AM to 9:59 AM | 106 (20.3%) | 24 (8.5%) |
| 10:00 AM to 10:59 AM | 0 (0.0%) | 26 (9.1%) |
| 11:00 AM to 11:59 AM | 0 (0.0%) | 0 (0.0%) |
| 12:00 PM to 3:59 PM | 0 (0.0%) | 26 (9.1%) |
| 4:00 PM to 11:59 PM | 0 (0.0%) | 0 (0.0%) |
| Total | 523 (100.0%) | 284 (100.0%) |
Housing Occupancy in Medina
Occupancy by Ownership in Medina
Of the total 1,027 dwellings in Medina, owner-occupied units account for 840 (81.8%), while renter-occupied units make up 187 (18.2%).
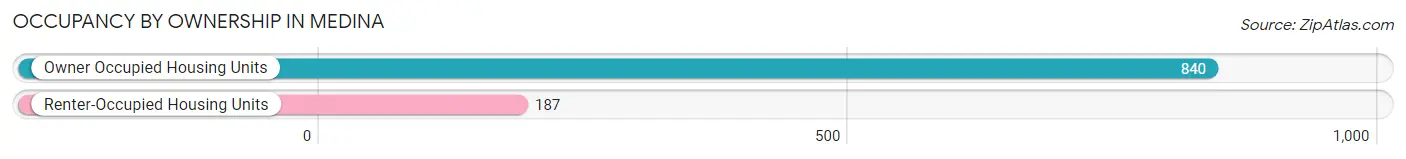
| Occupancy | # Housing Units | % Housing Units |
| Owner Occupied Housing Units | 840 | 81.8% |
| Renter-Occupied Housing Units | 187 | 18.2% |
| Total Occupied Housing Units | 1,027 | 100.0% |
Occupancy by Household Size in Medina
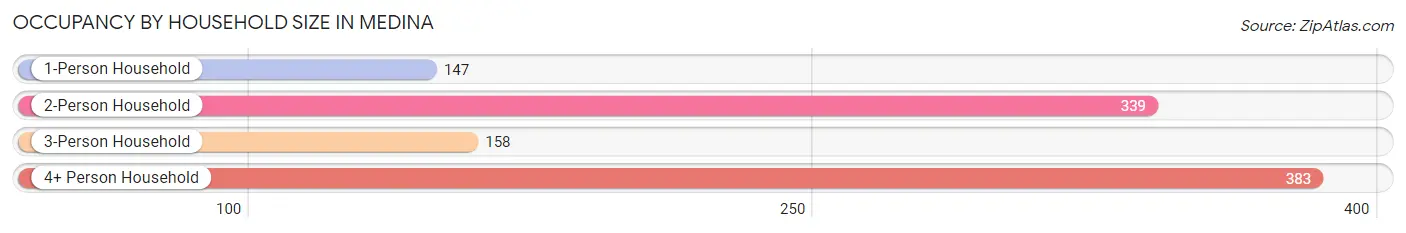
| Household Size | # Housing Units | % Housing Units |
| 1-Person Household | 147 | 14.3% |
| 2-Person Household | 339 | 33.0% |
| 3-Person Household | 158 | 15.4% |
| 4+ Person Household | 383 | 37.3% |
| Total Housing Units | 1,027 | 100.0% |
Occupancy by Ownership by Household Size in Medina
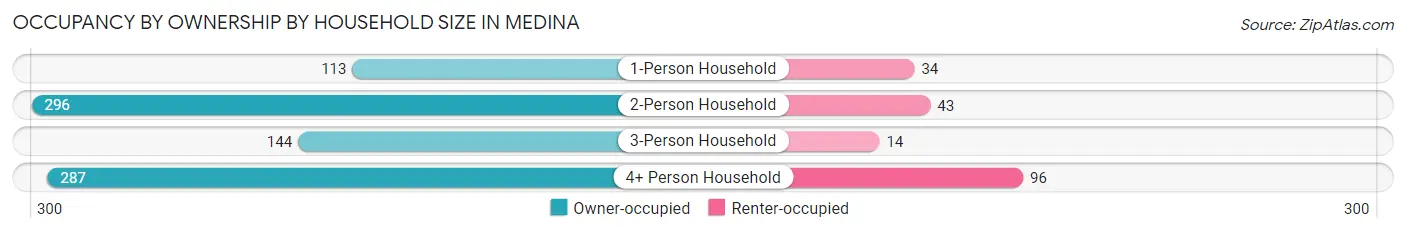
| Household Size | Owner-occupied | Renter-occupied |
| 1-Person Household | 113 (76.9%) | 34 (23.1%) |
| 2-Person Household | 296 (87.3%) | 43 (12.7%) |
| 3-Person Household | 144 (91.1%) | 14 (8.9%) |
| 4+ Person Household | 287 (74.9%) | 96 (25.1%) |
| Total Housing Units | 840 (81.8%) | 187 (18.2%) |
Occupancy by Educational Attainment in Medina
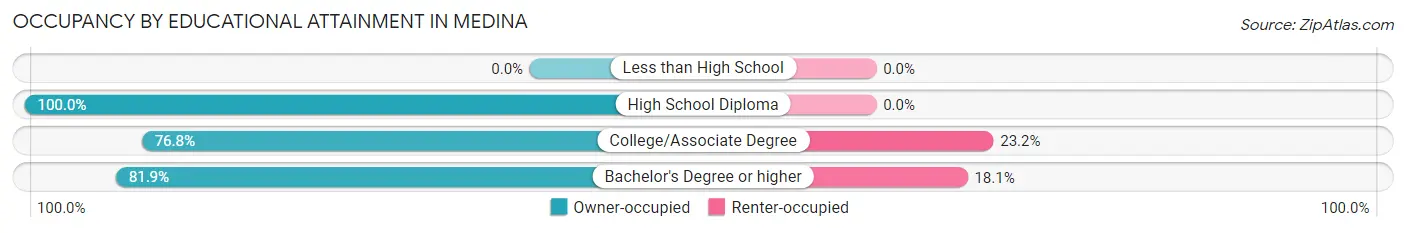
| Household Size | Owner-occupied | Renter-occupied |
| Less than High School | 0 (0.0%) | 0 (0.0%) |
| High School Diploma | 22 (100.0%) | 0 (0.0%) |
| College/Associate Degree | 76 (76.8%) | 23 (23.2%) |
| Bachelor's Degree or higher | 742 (81.9%) | 164 (18.1%) |
Occupancy by Age of Householder in Medina
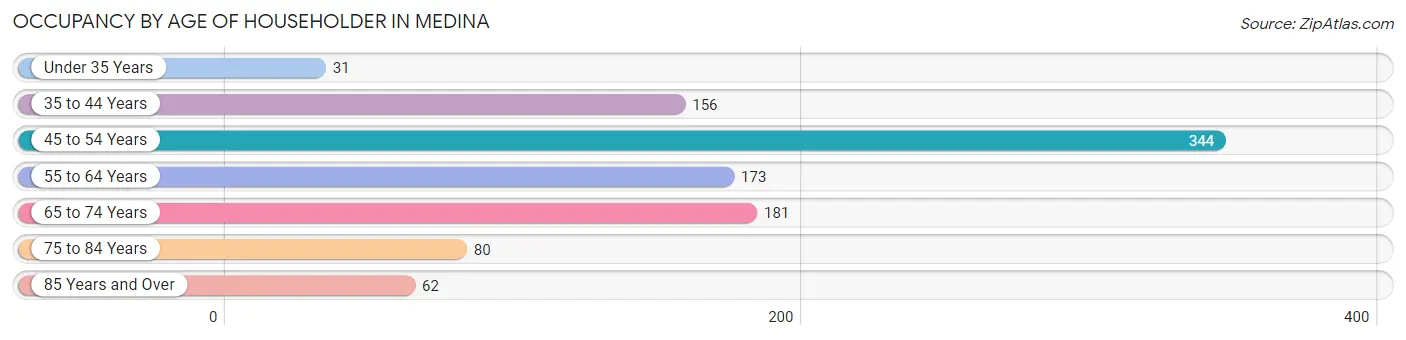
| Age Bracket | # Households | % Households |
| Under 35 Years | 31 | 3.0% |
| 35 to 44 Years | 156 | 15.2% |
| 45 to 54 Years | 344 | 33.5% |
| 55 to 64 Years | 173 | 16.9% |
| 65 to 74 Years | 181 | 17.6% |
| 75 to 84 Years | 80 | 7.8% |
| 85 Years and Over | 62 | 6.0% |
| Total | 1,027 | 100.0% |
Housing Finances in Medina
Median Income by Occupancy in Medina
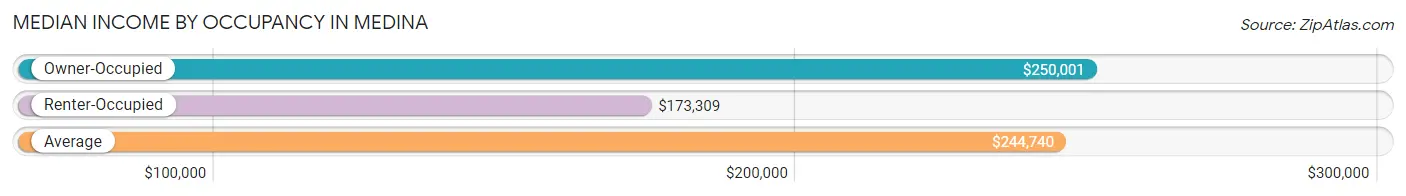
| Occupancy Type | # Households | Median Income |
| Owner-Occupied | 840 (81.8%) | $250,001 |
| Renter-Occupied | 187 (18.2%) | $173,309 |
| Average | 1,027 (100.0%) | $244,740 |
Occupancy by Householder Income Bracket in Medina
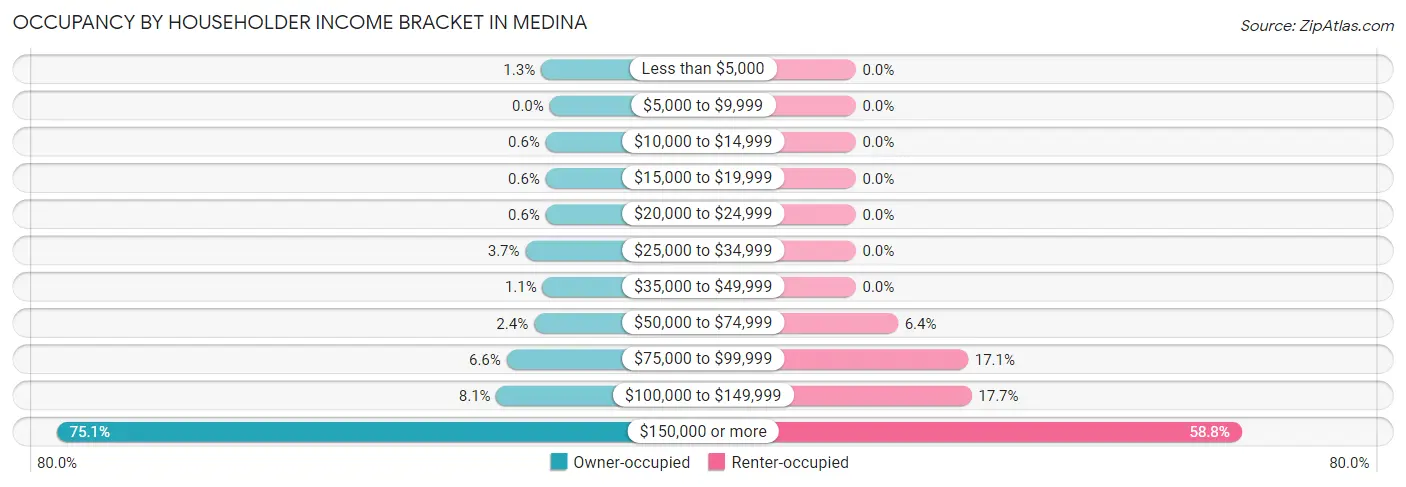
| Income Bracket | Owner-occupied | Renter-occupied |
| Less than $5,000 | 11 (1.3%) | 0 (0.0%) |
| $5,000 to $9,999 | 0 (0.0%) | 0 (0.0%) |
| $10,000 to $14,999 | 5 (0.6%) | 0 (0.0%) |
| $15,000 to $19,999 | 5 (0.6%) | 0 (0.0%) |
| $20,000 to $24,999 | 5 (0.6%) | 0 (0.0%) |
| $25,000 to $34,999 | 31 (3.7%) | 0 (0.0%) |
| $35,000 to $49,999 | 9 (1.1%) | 0 (0.0%) |
| $50,000 to $74,999 | 20 (2.4%) | 12 (6.4%) |
| $75,000 to $99,999 | 55 (6.6%) | 32 (17.1%) |
| $100,000 to $149,999 | 68 (8.1%) | 33 (17.6%) |
| $150,000 or more | 631 (75.1%) | 110 (58.8%) |
| Total | 840 (100.0%) | 187 (100.0%) |
Monthly Housing Cost Tiers in Medina

| Monthly Cost | Owner-occupied | Renter-occupied |
| Less than $300 | 0 (0.0%) | 0 (0.0%) |
| $300 to $499 | 5 (0.6%) | 0 (0.0%) |
| $500 to $799 | 0 (0.0%) | 0 (0.0%) |
| $800 to $999 | 6 (0.7%) | 0 (0.0%) |
| $1,000 to $1,499 | 12 (1.4%) | 11 (5.9%) |
| $1,500 to $1,999 | 46 (5.5%) | 7 (3.7%) |
| $2,000 to $2,499 | 116 (13.8%) | 0 (0.0%) |
| $2,500 to $2,999 | 90 (10.7%) | 7 (3.7%) |
| $3,000 or more | 565 (67.3%) | 148 (79.1%) |
| Total | 840 (100.0%) | 187 (100.0%) |
Physical Housing Characteristics in Medina
Housing Structures in Medina
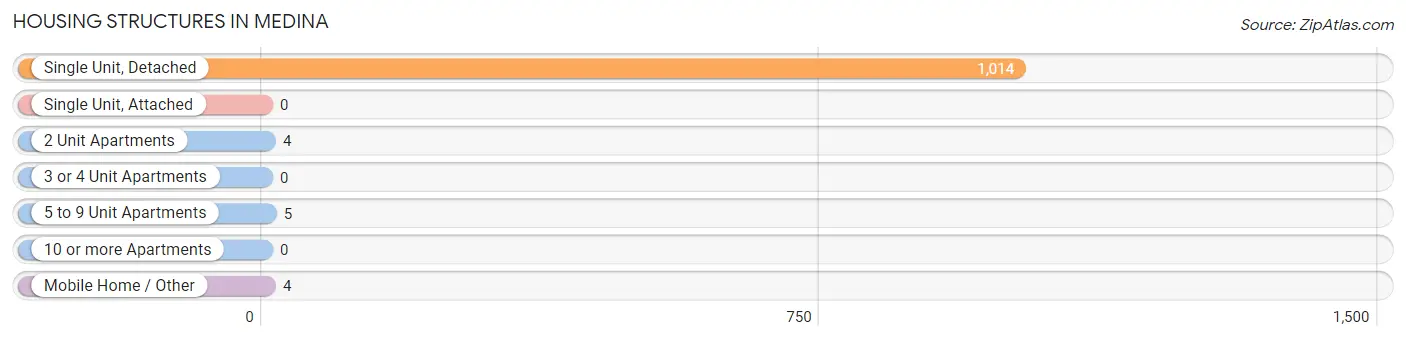
| Structure Type | # Housing Units | % Housing Units |
| Single Unit, Detached | 1,014 | 98.7% |
| Single Unit, Attached | 0 | 0.0% |
| 2 Unit Apartments | 4 | 0.4% |
| 3 or 4 Unit Apartments | 0 | 0.0% |
| 5 to 9 Unit Apartments | 5 | 0.5% |
| 10 or more Apartments | 0 | 0.0% |
| Mobile Home / Other | 4 | 0.4% |
| Total | 1,027 | 100.0% |
Housing Structures by Occupancy in Medina
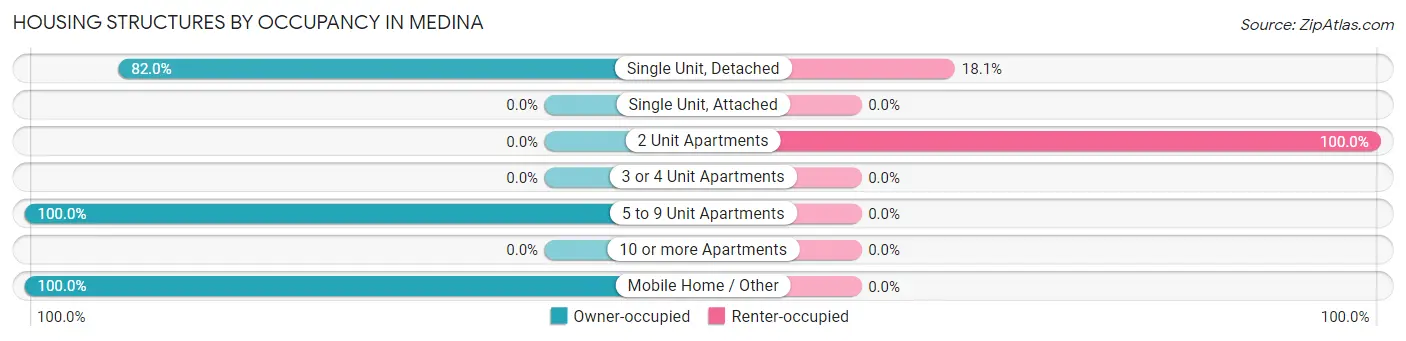
| Structure Type | Owner-occupied | Renter-occupied |
| Single Unit, Detached | 831 (82.0%) | 183 (18.0%) |
| Single Unit, Attached | 0 (0.0%) | 0 (0.0%) |
| 2 Unit Apartments | 0 (0.0%) | 4 (100.0%) |
| 3 or 4 Unit Apartments | 0 (0.0%) | 0 (0.0%) |
| 5 to 9 Unit Apartments | 5 (100.0%) | 0 (0.0%) |
| 10 or more Apartments | 0 (0.0%) | 0 (0.0%) |
| Mobile Home / Other | 4 (100.0%) | 0 (0.0%) |
| Total | 840 (81.8%) | 187 (18.2%) |
Housing Structures by Number of Rooms in Medina
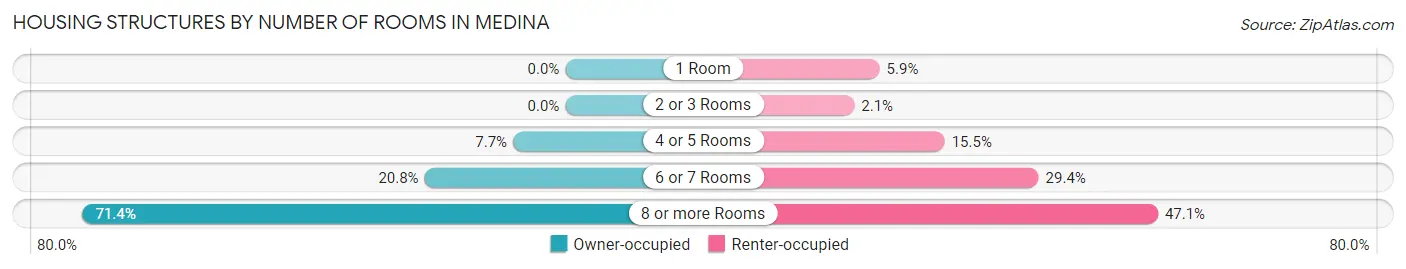
| Number of Rooms | Owner-occupied | Renter-occupied |
| 1 Room | 0 (0.0%) | 11 (5.9%) |
| 2 or 3 Rooms | 0 (0.0%) | 4 (2.1%) |
| 4 or 5 Rooms | 65 (7.7%) | 29 (15.5%) |
| 6 or 7 Rooms | 175 (20.8%) | 55 (29.4%) |
| 8 or more Rooms | 600 (71.4%) | 88 (47.1%) |
| Total | 840 (100.0%) | 187 (100.0%) |
Housing Structure by Heating Type in Medina
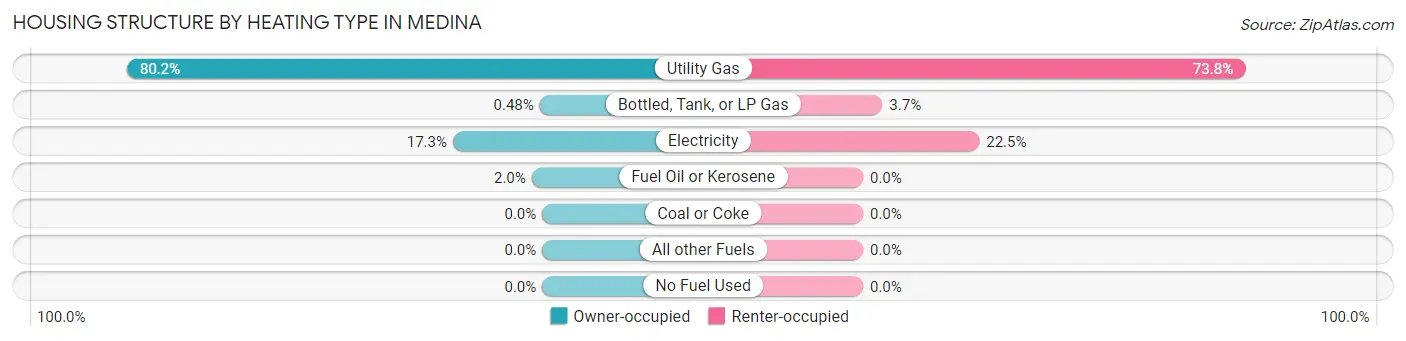
| Heating Type | Owner-occupied | Renter-occupied |
| Utility Gas | 674 (80.2%) | 138 (73.8%) |
| Bottled, Tank, or LP Gas | 4 (0.5%) | 7 (3.7%) |
| Electricity | 145 (17.3%) | 42 (22.5%) |
| Fuel Oil or Kerosene | 17 (2.0%) | 0 (0.0%) |
| Coal or Coke | 0 (0.0%) | 0 (0.0%) |
| All other Fuels | 0 (0.0%) | 0 (0.0%) |
| No Fuel Used | 0 (0.0%) | 0 (0.0%) |
| Total | 840 (100.0%) | 187 (100.0%) |
Household Vehicle Usage in Medina
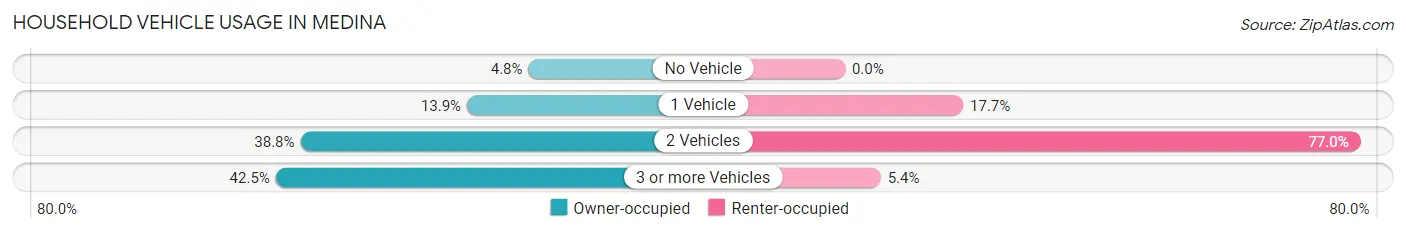
| Vehicles per Household | Owner-occupied | Renter-occupied |
| No Vehicle | 40 (4.8%) | 0 (0.0%) |
| 1 Vehicle | 117 (13.9%) | 33 (17.6%) |
| 2 Vehicles | 326 (38.8%) | 144 (77.0%) |
| 3 or more Vehicles | 357 (42.5%) | 10 (5.3%) |
| Total | 840 (100.0%) | 187 (100.0%) |
Real Estate & Mortgages in Medina
Real Estate and Mortgage Overview in Medina
| Characteristic | Without Mortgage | With Mortgage |
| Housing Units | 400 | 440 |
| Median Property Value | $2,000,001 | $2,000,001 |
| Median Household Income | $188,333 | $388 |
| Monthly Housing Costs | $1,501 | $416 |
| Real Estate Taxes | $10,001 | $0 |
Property Value by Mortgage Status in Medina
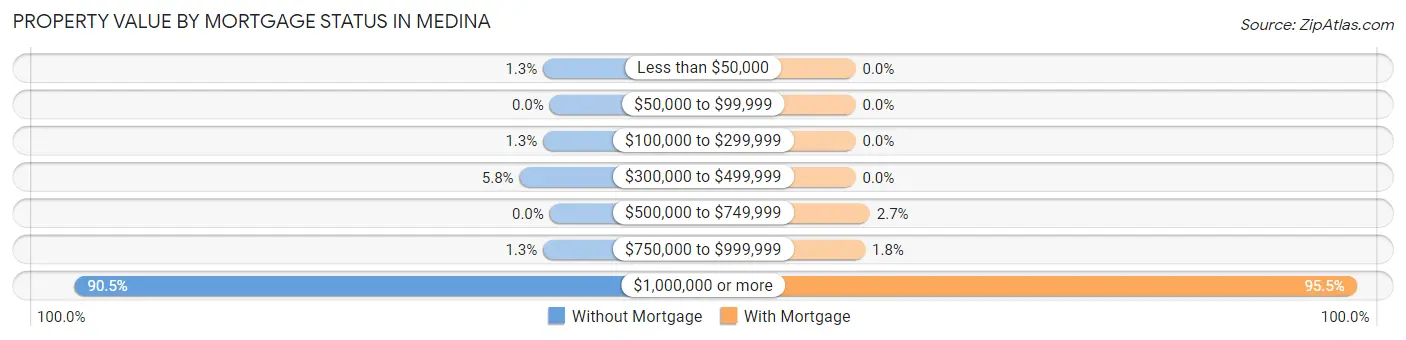
| Property Value | Without Mortgage | With Mortgage |
| Less than $50,000 | 5 (1.3%) | 0 (0.0%) |
| $50,000 to $99,999 | 0 (0.0%) | 0 (0.0%) |
| $100,000 to $299,999 | 5 (1.3%) | 0 (0.0%) |
| $300,000 to $499,999 | 23 (5.8%) | 0 (0.0%) |
| $500,000 to $749,999 | 0 (0.0%) | 12 (2.7%) |
| $750,000 to $999,999 | 5 (1.3%) | 8 (1.8%) |
| $1,000,000 or more | 362 (90.5%) | 420 (95.5%) |
| Total | 400 (100.0%) | 440 (100.0%) |
Household Income by Mortgage Status in Medina
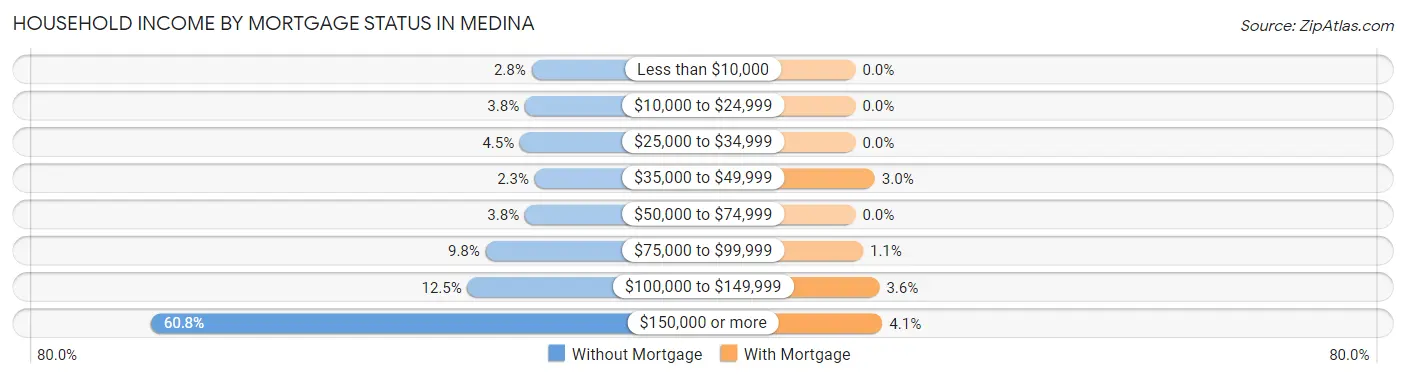
| Household Income | Without Mortgage | With Mortgage |
| Less than $10,000 | 11 (2.8%) | 0 (0.0%) |
| $10,000 to $24,999 | 15 (3.7%) | 0 (0.0%) |
| $25,000 to $34,999 | 18 (4.5%) | 0 (0.0%) |
| $35,000 to $49,999 | 9 (2.2%) | 13 (2.9%) |
| $50,000 to $74,999 | 15 (3.7%) | 0 (0.0%) |
| $75,000 to $99,999 | 39 (9.8%) | 5 (1.1%) |
| $100,000 to $149,999 | 50 (12.5%) | 16 (3.6%) |
| $150,000 or more | 243 (60.8%) | 18 (4.1%) |
| Total | 400 (100.0%) | 440 (100.0%) |
Property Value to Household Income Ratio in Medina
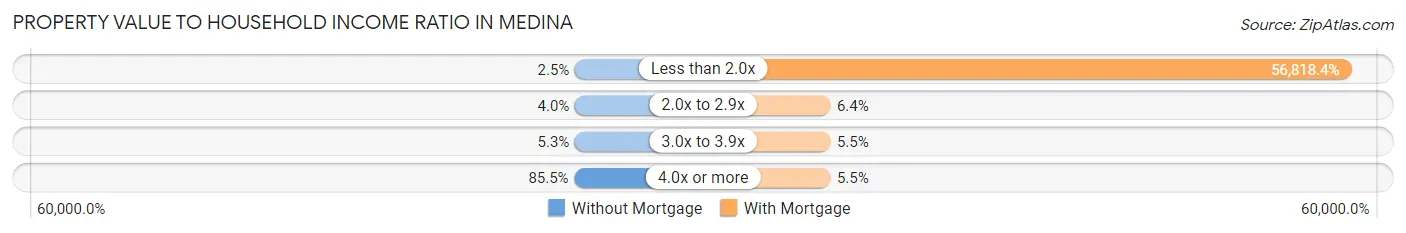
| Value-to-Income Ratio | Without Mortgage | With Mortgage |
| Less than 2.0x | 10 (2.5%) | 250,001 (56,818.4%) |
| 2.0x to 2.9x | 16 (4.0%) | 28 (6.4%) |
| 3.0x to 3.9x | 21 (5.2%) | 24 (5.4%) |
| 4.0x or more | 342 (85.5%) | 24 (5.4%) |
| Total | 400 (100.0%) | 440 (100.0%) |
Real Estate Taxes by Mortgage Status in Medina
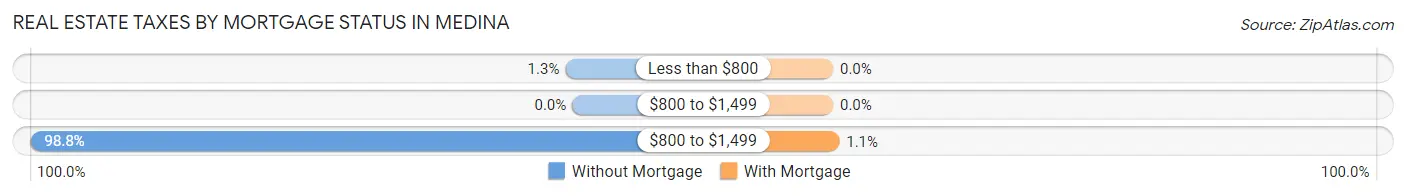
| Property Taxes | Without Mortgage | With Mortgage |
| Less than $800 | 5 (1.3%) | 0 (0.0%) |
| $800 to $1,499 | 0 (0.0%) | 0 (0.0%) |
| $800 to $1,499 | 395 (98.8%) | 5 (1.1%) |
| Total | 400 (100.0%) | 440 (100.0%) |
Health & Disability in Medina
Health Insurance Coverage by Age in Medina
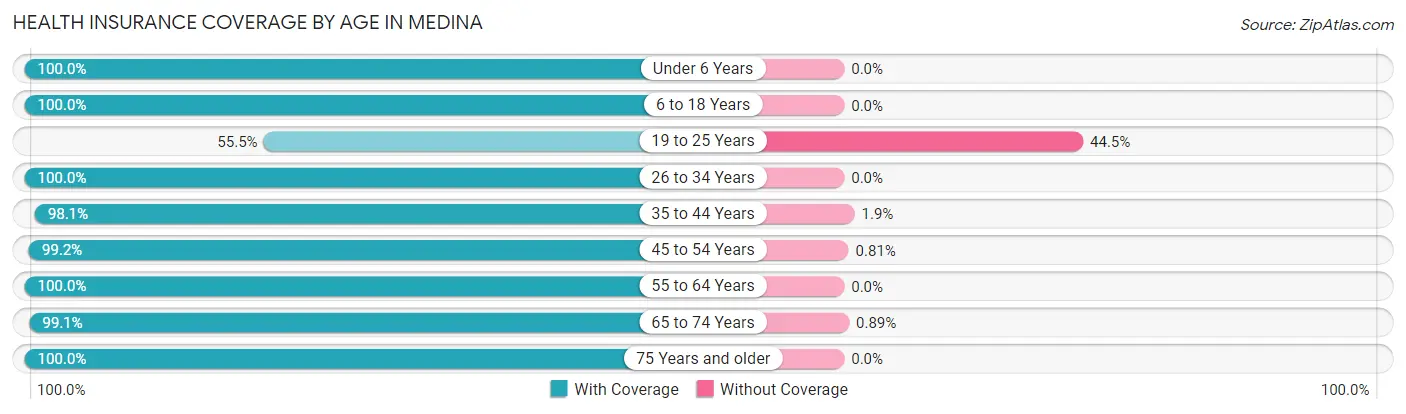
| Age Bracket | With Coverage | Without Coverage |
| Under 6 Years | 126 (100.0%) | 0 (0.0%) |
| 6 to 18 Years | 694 (100.0%) | 0 (0.0%) |
| 19 to 25 Years | 76 (55.5%) | 61 (44.5%) |
| 26 to 34 Years | 105 (100.0%) | 0 (0.0%) |
| 35 to 44 Years | 306 (98.1%) | 6 (1.9%) |
| 45 to 54 Years | 615 (99.2%) | 5 (0.8%) |
| 55 to 64 Years | 395 (100.0%) | 0 (0.0%) |
| 65 to 74 Years | 335 (99.1%) | 3 (0.9%) |
| 75 Years and older | 196 (100.0%) | 0 (0.0%) |
| Total | 2,848 (97.4%) | 75 (2.6%) |
Health Insurance Coverage by Citizenship Status in Medina
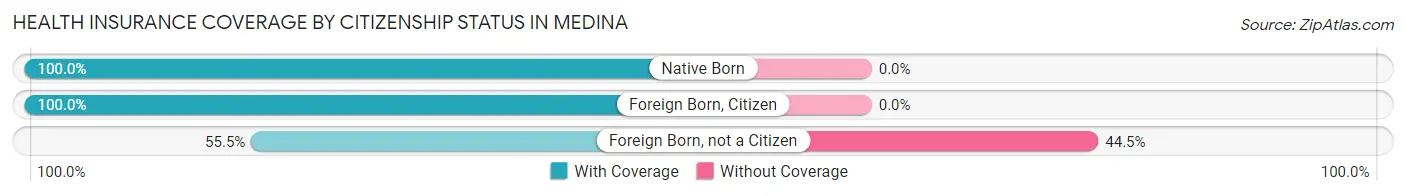
| Citizenship Status | With Coverage | Without Coverage |
| Native Born | 126 (100.0%) | 0 (0.0%) |
| Foreign Born, Citizen | 694 (100.0%) | 0 (0.0%) |
| Foreign Born, not a Citizen | 76 (55.5%) | 61 (44.5%) |
Health Insurance Coverage by Household Income in Medina
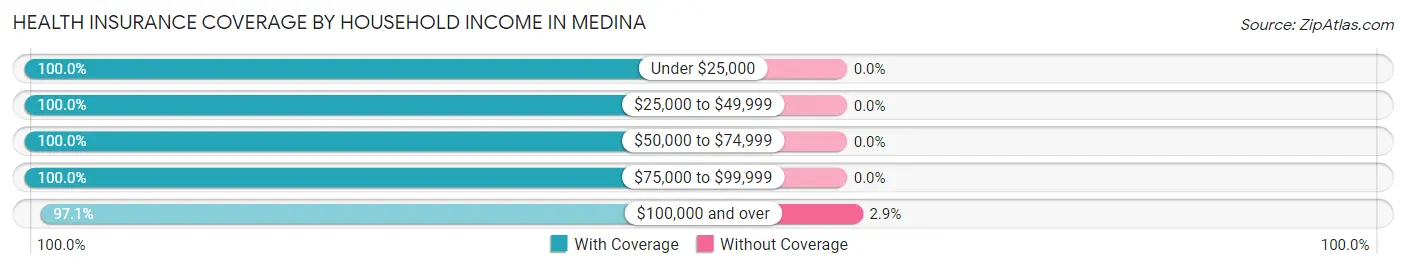
| Household Income | With Coverage | Without Coverage |
| Under $25,000 | 46 (100.0%) | 0 (0.0%) |
| $25,000 to $49,999 | 107 (100.0%) | 0 (0.0%) |
| $50,000 to $74,999 | 54 (100.0%) | 0 (0.0%) |
| $75,000 to $99,999 | 155 (100.0%) | 0 (0.0%) |
| $100,000 and over | 2,486 (97.1%) | 75 (2.9%) |
Public vs Private Health Insurance Coverage by Age in Medina
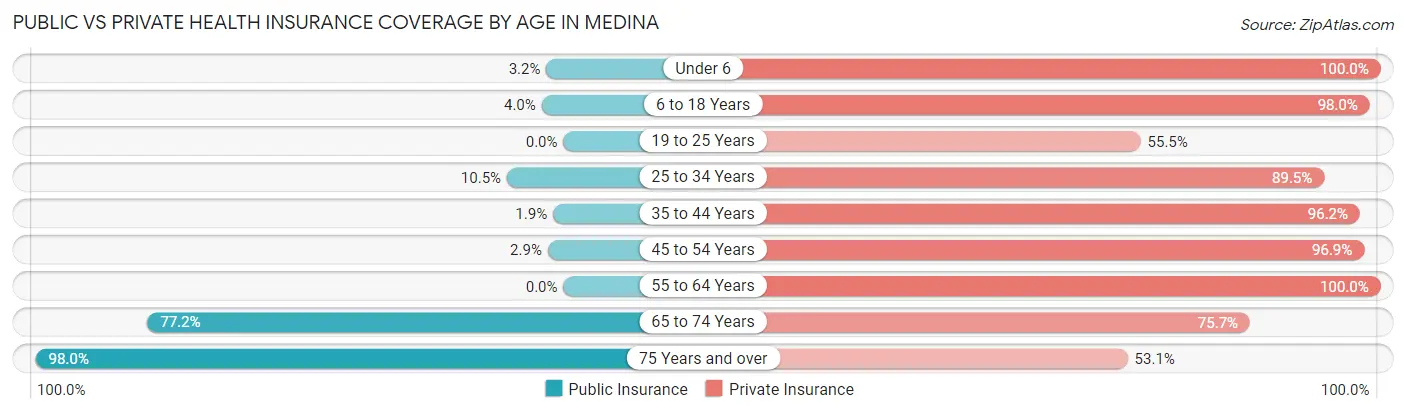
| Age Bracket | Public Insurance | Private Insurance |
| Under 6 | 4 (3.2%) | 126 (100.0%) |
| 6 to 18 Years | 28 (4.0%) | 680 (98.0%) |
| 19 to 25 Years | 0 (0.0%) | 76 (55.5%) |
| 25 to 34 Years | 11 (10.5%) | 94 (89.5%) |
| 35 to 44 Years | 6 (1.9%) | 300 (96.2%) |
| 45 to 54 Years | 18 (2.9%) | 601 (96.9%) |
| 55 to 64 Years | 0 (0.0%) | 395 (100.0%) |
| 65 to 74 Years | 261 (77.2%) | 256 (75.7%) |
| 75 Years and over | 192 (98.0%) | 104 (53.1%) |
| Total | 520 (17.8%) | 2,632 (90.0%) |
Disability Status by Sex by Age in Medina
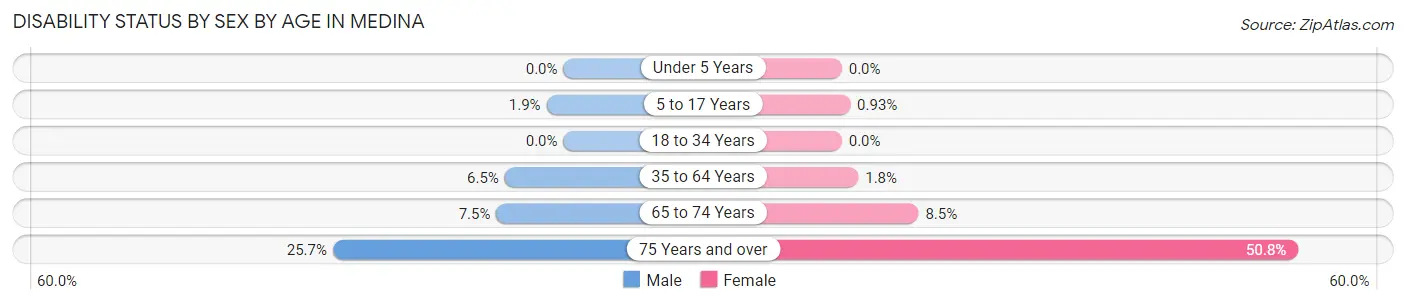
| Age Bracket | Male | Female |
| Under 5 Years | 0 (0.0%) | 0 (0.0%) |
| 5 to 17 Years | 6 (1.9%) | 3 (0.9%) |
| 18 to 34 Years | 0 (0.0%) | 0 (0.0%) |
| 35 to 64 Years | 44 (6.5%) | 12 (1.8%) |
| 65 to 74 Years | 13 (7.5%) | 14 (8.5%) |
| 75 Years and over | 19 (25.7%) | 62 (50.8%) |
Disability Class by Sex by Age in Medina
Disability Class: Hearing Difficulty
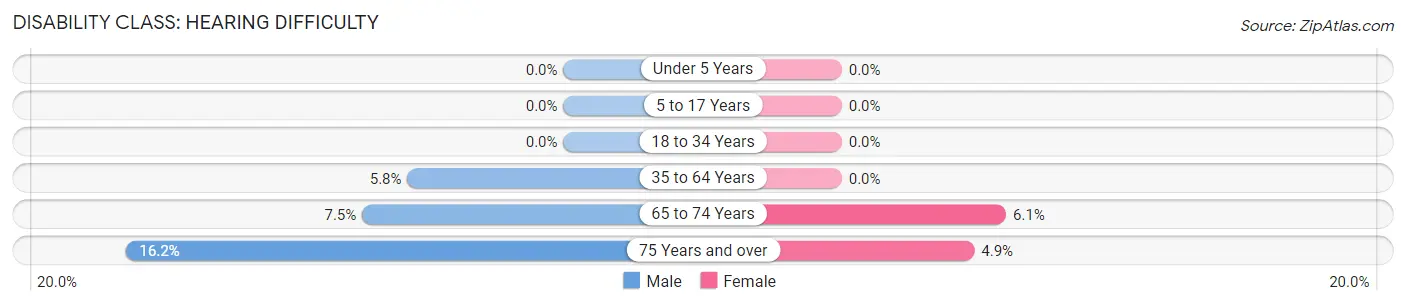
| Age Bracket | Male | Female |
| Under 5 Years | 0 (0.0%) | 0 (0.0%) |
| 5 to 17 Years | 0 (0.0%) | 0 (0.0%) |
| 18 to 34 Years | 0 (0.0%) | 0 (0.0%) |
| 35 to 64 Years | 39 (5.8%) | 0 (0.0%) |
| 65 to 74 Years | 13 (7.5%) | 10 (6.1%) |
| 75 Years and over | 12 (16.2%) | 6 (4.9%) |
Disability Class: Vision Difficulty
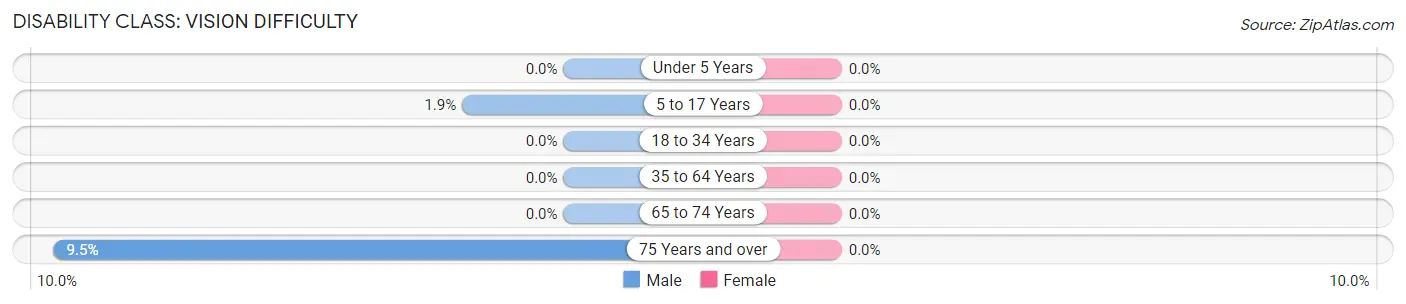
| Age Bracket | Male | Female |
| Under 5 Years | 0 (0.0%) | 0 (0.0%) |
| 5 to 17 Years | 6 (1.9%) | 0 (0.0%) |
| 18 to 34 Years | 0 (0.0%) | 0 (0.0%) |
| 35 to 64 Years | 0 (0.0%) | 0 (0.0%) |
| 65 to 74 Years | 0 (0.0%) | 0 (0.0%) |
| 75 Years and over | 7 (9.5%) | 0 (0.0%) |
Disability Class: Cognitive Difficulty
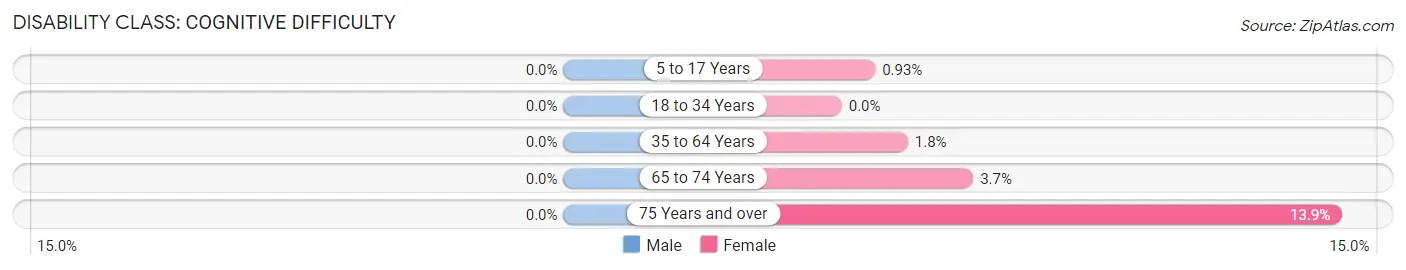
| Age Bracket | Male | Female |
| 5 to 17 Years | 0 (0.0%) | 3 (0.9%) |
| 18 to 34 Years | 0 (0.0%) | 0 (0.0%) |
| 35 to 64 Years | 0 (0.0%) | 12 (1.8%) |
| 65 to 74 Years | 0 (0.0%) | 6 (3.7%) |
| 75 Years and over | 0 (0.0%) | 17 (13.9%) |
Disability Class: Ambulatory Difficulty
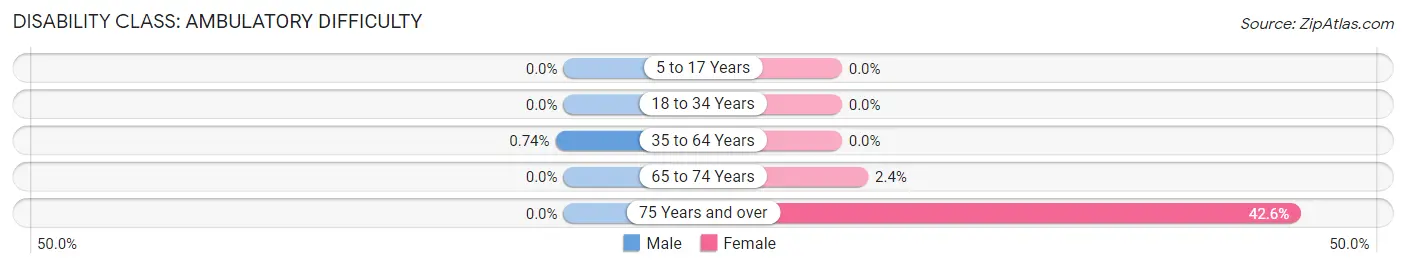
| Age Bracket | Male | Female |
| 5 to 17 Years | 0 (0.0%) | 0 (0.0%) |
| 18 to 34 Years | 0 (0.0%) | 0 (0.0%) |
| 35 to 64 Years | 5 (0.7%) | 0 (0.0%) |
| 65 to 74 Years | 0 (0.0%) | 4 (2.4%) |
| 75 Years and over | 0 (0.0%) | 52 (42.6%) |
Disability Class: Self-Care Difficulty
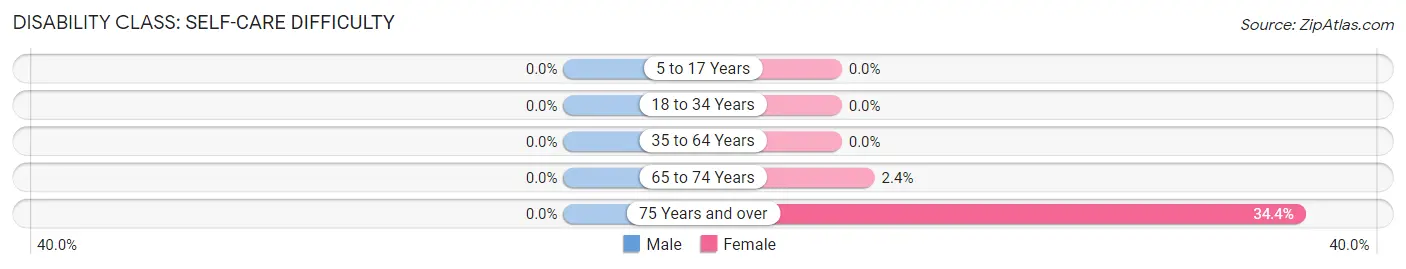
| Age Bracket | Male | Female |
| 5 to 17 Years | 0 (0.0%) | 0 (0.0%) |
| 18 to 34 Years | 0 (0.0%) | 0 (0.0%) |
| 35 to 64 Years | 0 (0.0%) | 0 (0.0%) |
| 65 to 74 Years | 0 (0.0%) | 4 (2.4%) |
| 75 Years and over | 0 (0.0%) | 42 (34.4%) |
Technology Access in Medina
Computing Device Access in Medina
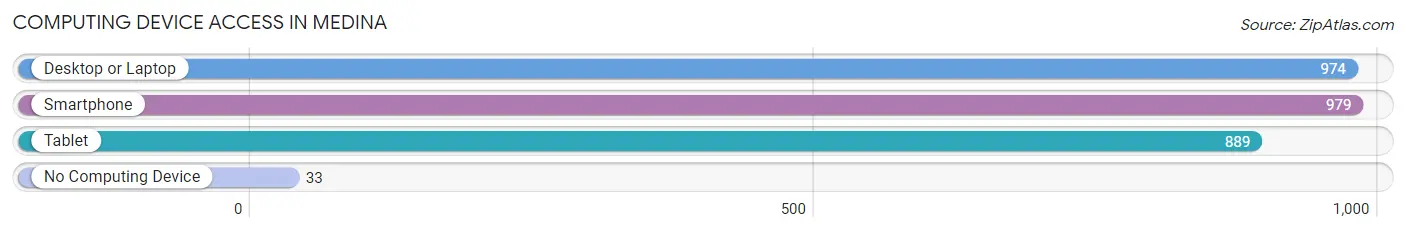
| Device Type | # Households | % Households |
| Desktop or Laptop | 974 | 94.8% |
| Smartphone | 979 | 95.3% |
| Tablet | 889 | 86.6% |
| No Computing Device | 33 | 3.2% |
| Total | 1,027 | 100.0% |
Internet Access in Medina
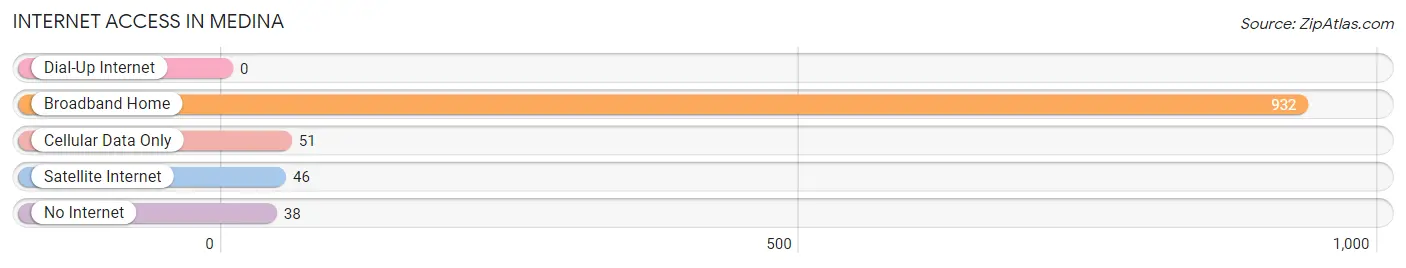
| Internet Type | # Households | % Households |
| Dial-Up Internet | 0 | 0.0% |
| Broadband Home | 932 | 90.7% |
| Cellular Data Only | 51 | 5.0% |
| Satellite Internet | 46 | 4.5% |
| No Internet | 38 | 3.7% |
| Total | 1,027 | 100.0% |
Medina Summary
Medina is a city located in King County, Washington, United States. It is situated on the east side of Lake Washington, just north of Bellevue and south of Kirkland. The population was 2,969 at the 2010 census.
History
The area that is now Medina was first settled in the late 1800s by homesteaders. The city was officially incorporated in 1955. The name Medina was chosen by the first postmaster, who was inspired by the biblical city of the same name.
Geography
Medina is located at 47°36'17" North, 122°12'17" West (47.604722, -122.204722). According to the United States Census Bureau, the city has a total area of 2.2 square miles, all of it land.
Economy
Medina is home to many affluent residents, and the city has a strong economy. The median household income in Medina is $180,000, and the median home value is $1.7 million. The city is home to many high-tech companies, including Microsoft, Amazon, and Expedia.
Demographics
As of the 2010 census, there were 2,969 people, 1,093 households, and 890 families residing in the city. The population density was 1,346.2 people per square mile. The racial makeup of the city was 87.2% White, 4.2% Asian, 2.2% African American, 0.3% Native American, 0.1% Pacific Islander, and 5.9% from other races. Hispanic or Latino of any race were 6.2% of the population.
The median age in Medina was 45.2 years. 24.2% of residents were under the age of 18; 5.2% were between the ages of 18 and 24; 20.2% were from 25 to 44; 37.2% were from 45 to 64; and 13.2% were 65 years of age or older. The gender makeup of the city was 48.2% male and 51.8% female.
Conclusion
Medina is a city located in King County, Washington, United States. It is situated on the east side of Lake Washington, just north of Bellevue and south of Kirkland. The city has a strong economy, with a median household income of $180,000 and a median home value of $1.7 million. The population of Medina is diverse, with 87.2% White, 4.2% Asian, 2.2% African American, 0.3% Native American, 0.1% Pacific Islander, and 5.9% from other races. The median age in Medina is 45.2 years, and the gender makeup of the city is 48.2% male and 51.8% female.
Common Questions
What is Per Capita Income in Medina?
Per Capita income in Medina is $156,124.
What is the Median Family Income in Medina?
Median Family Income in Medina is $250,001.
What is the Median Household income in Medina?
Median Household Income in Medina is $244,740.
What is Income or Wage Gap in Medina?
Income or Wage Gap in Medina is 55.0%.
Women in Medina earn 45.0 cents for every dollar earned by a man.
What is Inequality or Gini Index in Medina?
Inequality or Gini Index in Medina is 0.51.
What is the Total Population of Medina?
Total Population of Medina is 2,923.
What is the Total Male Population of Medina?
Total Male Population of Medina is 1,419.
What is the Total Female Population of Medina?
Total Female Population of Medina is 1,504.
What is the Ratio of Males per 100 Females in Medina?
There are 94.35 Males per 100 Females in Medina.
What is the Ratio of Females per 100 Males in Medina?
There are 105.99 Females per 100 Males in Medina.
What is the Median Population Age in Medina?
Median Population Age in Medina is 47.4 Years.
What is the Average Family Size in Medina
Average Family Size in Medina is 3.1 People.
What is the Average Household Size in Medina
Average Household Size in Medina is 2.9 People.
How Large is the Labor Force in Medina?
There are 1,252 People in the Labor Forcein in Medina.
What is the Percentage of People in the Labor Force in Medina?
55.4% of People are in the Labor Force in Medina.
What is the Unemployment Rate in Medina?
Unemployment Rate in Medina is 2.2%.