Point Roberts, WA Map & Demographics
Point Roberts Map
Point Roberts Overview
$73,318
PER CAPITA INCOME
$108,750
AVG FAMILY INCOME
$74,400
AVG HOUSEHOLD INCOME
58.9%
WAGE / INCOME GAP [ % ]
41.1¢/ $1
WAGE / INCOME GAP [ $ ]
0.58
INEQUALITY / GINI INDEX
1,249
TOTAL POPULATION
603
MALE POPULATION
646
FEMALE POPULATION
93.34
MALES / 100 FEMALES
107.13
FEMALES / 100 MALES
56.9
MEDIAN AGE
2.5
AVG FAMILY SIZE
1.9
AVG HOUSEHOLD SIZE
649
LABOR FORCE [ PEOPLE ]
57.8%
PERCENT IN LABOR FORCE
2.5%
UNEMPLOYMENT RATE
Point Roberts Zip Codes
Point Roberts Area Codes
Income in Point Roberts
Income Overview in Point Roberts
Per Capita Income in Point Roberts is $73,318, while median incomes of families and households are $108,750 and $74,400 respectively.
| Characteristic | Number | Measure |
| Per Capita Income | 1,249 | $73,318 |
| Median Family Income | 362 | $108,750 |
| Mean Family Income | 362 | $142,872 |
| Median Household Income | 668 | $74,400 |
| Mean Household Income | 668 | $134,398 |
| Income Deficit | 362 | $0 |
| Wage / Income Gap (%) | 1,249 | 58.87% |
| Wage / Income Gap ($) | 1,249 | 41.13¢ per $1 |
| Gini / Inequality Index | 1,249 | 0.58 |
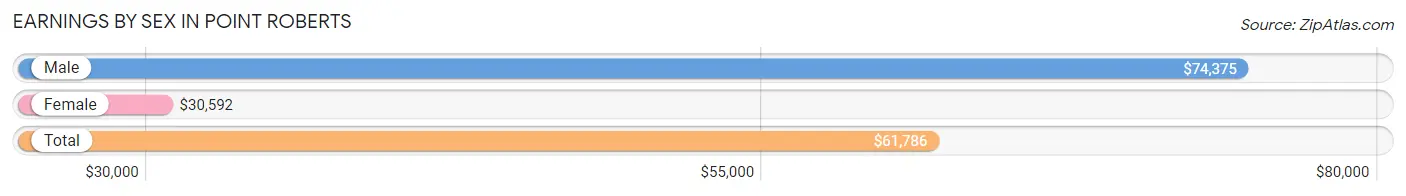
Earnings by Sex in Point Roberts
Average Earnings in Point Roberts are $61,786, $74,375 for men and $30,592 for women, a difference of 58.9%.
| Sex | Number | Average Earnings |
| Male | 351 (50.1%) | $74,375 |
| Female | 349 (49.9%) | $30,592 |
| Total | 700 (100.0%) | $61,786 |
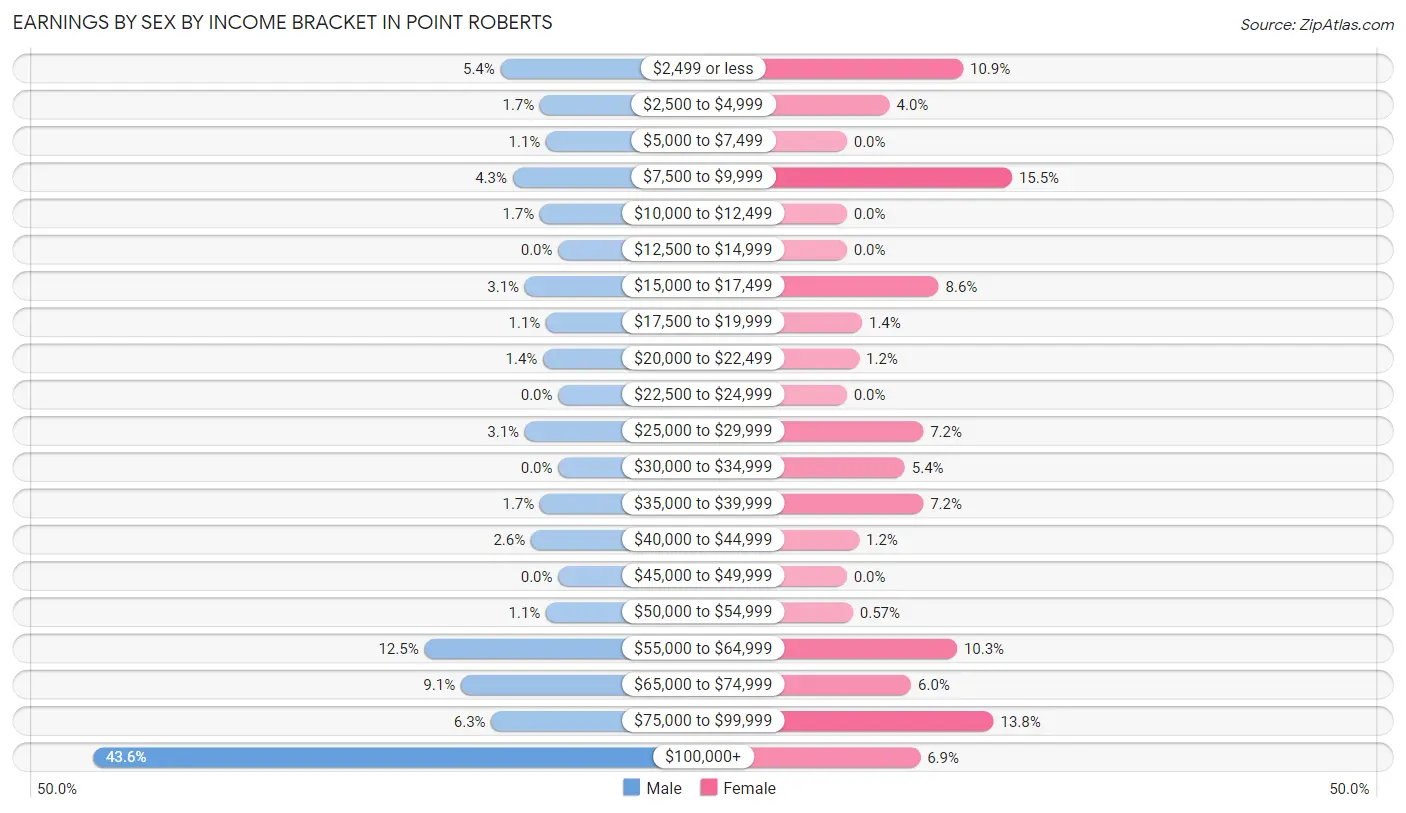
Earnings by Sex by Income Bracket in Point Roberts
The most common earnings brackets in Point Roberts are $100,000+ for men (153 | 43.6%) and $7,500 to $9,999 for women (54 | 15.5%).
| Income | Male | Female |
| $2,499 or less | 19 (5.4%) | 38 (10.9%) |
| $2,500 to $4,999 | 6 (1.7%) | 14 (4.0%) |
| $5,000 to $7,499 | 4 (1.1%) | 0 (0.0%) |
| $7,500 to $9,999 | 15 (4.3%) | 54 (15.5%) |
| $10,000 to $12,499 | 6 (1.7%) | 0 (0.0%) |
| $12,500 to $14,999 | 0 (0.0%) | 0 (0.0%) |
| $15,000 to $17,499 | 11 (3.1%) | 30 (8.6%) |
| $17,500 to $19,999 | 4 (1.1%) | 5 (1.4%) |
| $20,000 to $22,499 | 5 (1.4%) | 4 (1.1%) |
| $22,500 to $24,999 | 0 (0.0%) | 0 (0.0%) |
| $25,000 to $29,999 | 11 (3.1%) | 25 (7.2%) |
| $30,000 to $34,999 | 0 (0.0%) | 19 (5.4%) |
| $35,000 to $39,999 | 6 (1.7%) | 25 (7.2%) |
| $40,000 to $44,999 | 9 (2.6%) | 4 (1.1%) |
| $45,000 to $49,999 | 0 (0.0%) | 0 (0.0%) |
| $50,000 to $54,999 | 4 (1.1%) | 2 (0.6%) |
| $55,000 to $64,999 | 44 (12.5%) | 36 (10.3%) |
| $65,000 to $74,999 | 32 (9.1%) | 21 (6.0%) |
| $75,000 to $99,999 | 22 (6.3%) | 48 (13.8%) |
| $100,000+ | 153 (43.6%) | 24 (6.9%) |
| Total | 351 (100.0%) | 349 (100.0%) |
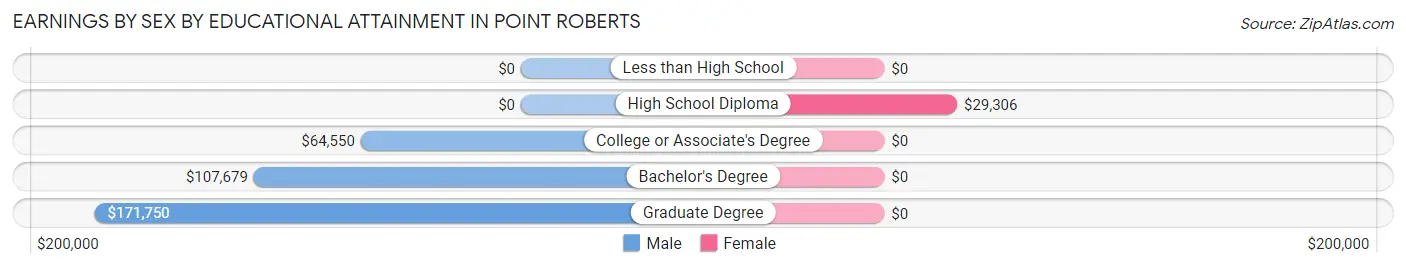
Earnings by Sex by Educational Attainment in Point Roberts
Average earnings in Point Roberts are $89,327 for men and $36,700 for women, a difference of 58.9%. Men with an educational attainment of graduate degree enjoy the highest average annual earnings of $171,750, while those with college or associate's degree education earn the least with $64,550. Women with an educational attainment of high school diploma earn the most with the average annual earnings of $29,306, while those with high school diploma education have the smallest earnings of $29,306.
| Educational Attainment | Male Income | Female Income |
| Less than High School | - | - |
| High School Diploma | - | - |
| College or Associate's Degree | $64,550 | $0 |
| Bachelor's Degree | $107,679 | $0 |
| Graduate Degree | $171,750 | $0 |
| Total | $89,327 | $36,700 |
Family Income in Point Roberts
Family Income Brackets in Point Roberts
According to the Point Roberts family income data, there are 98 families falling into the $100,000 to $149,999 income range, which is the most common income bracket and makes up 27.1% of all families. Conversely, the $25,000 to $34,999 income bracket is the least frequent group with only 4 families (1.1%) belonging to this category.
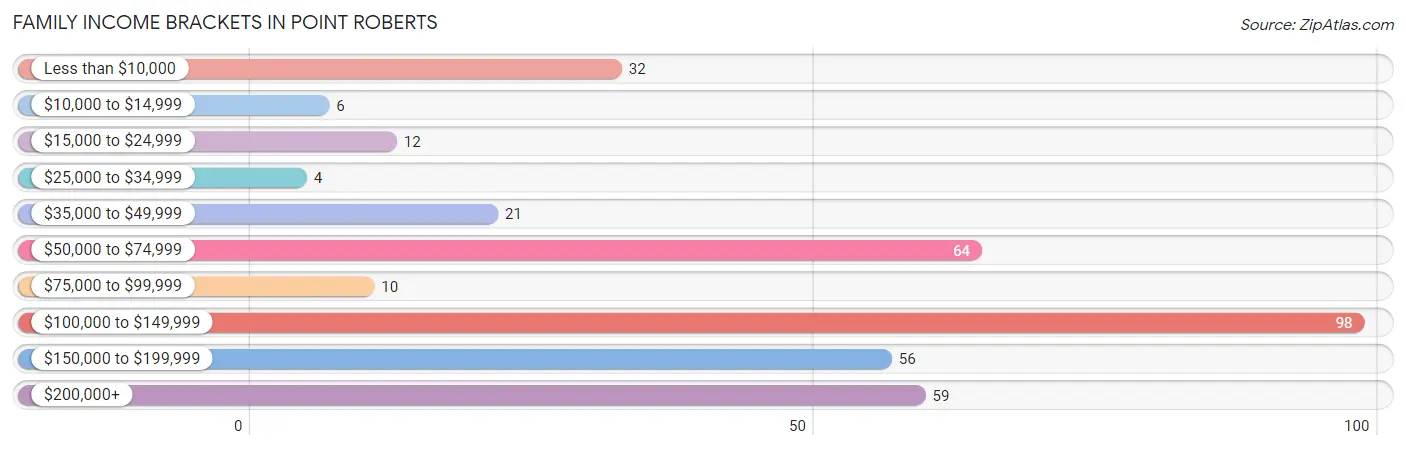
| Income Bracket | # Families | % Families |
| Less than $10,000 | 32 | 8.8% |
| $10,000 to $14,999 | 6 | 1.7% |
| $15,000 to $24,999 | 12 | 3.3% |
| $25,000 to $34,999 | 4 | 1.1% |
| $35,000 to $49,999 | 21 | 5.8% |
| $50,000 to $74,999 | 64 | 17.7% |
| $75,000 to $99,999 | 10 | 2.8% |
| $100,000 to $149,999 | 98 | 27.1% |
| $150,000 to $199,999 | 56 | 15.5% |
| $200,000+ | 59 | 16.3% |
Family Income by Famaliy Size in Point Roberts
4-person families (54 | 14.9%) account for the highest median family income in Point Roberts with $142,273 per family, while 2-person families (237 | 65.5%) have the highest median income of $53,318 per family member.
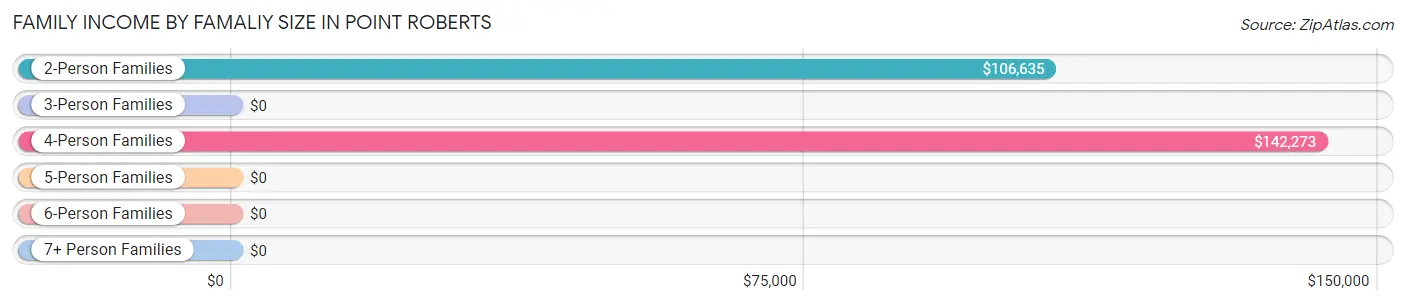
| Income Bracket | # Families | Median Income |
| 2-Person Families | 237 (65.5%) | $106,635 |
| 3-Person Families | 71 (19.6%) | $0 |
| 4-Person Families | 54 (14.9%) | $142,273 |
| 5-Person Families | 0 (0.0%) | $0 |
| 6-Person Families | 0 (0.0%) | $0 |
| 7+ Person Families | 0 (0.0%) | $0 |
| Total | 362 (100.0%) | $108,750 |
Family Income by Number of Earners in Point Roberts
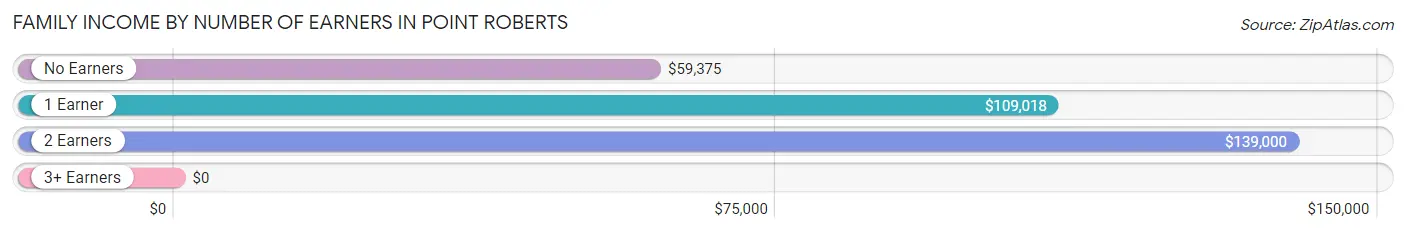
| Number of Earners | # Families | Median Income |
| No Earners | 62 (17.1%) | $59,375 |
| 1 Earner | 111 (30.7%) | $109,018 |
| 2 Earners | 182 (50.3%) | $139,000 |
| 3+ Earners | 7 (1.9%) | $0 |
| Total | 362 (100.0%) | $108,750 |
Household Income in Point Roberts
Household Income Brackets in Point Roberts
With 112 households falling in the category, the $50,000 to $74,999 income range is the most frequent in Point Roberts, accounting for 16.8% of all households. In contrast, only 6 households (0.9%) fall into the $10,000 to $14,999 income bracket, making it the least populous group.
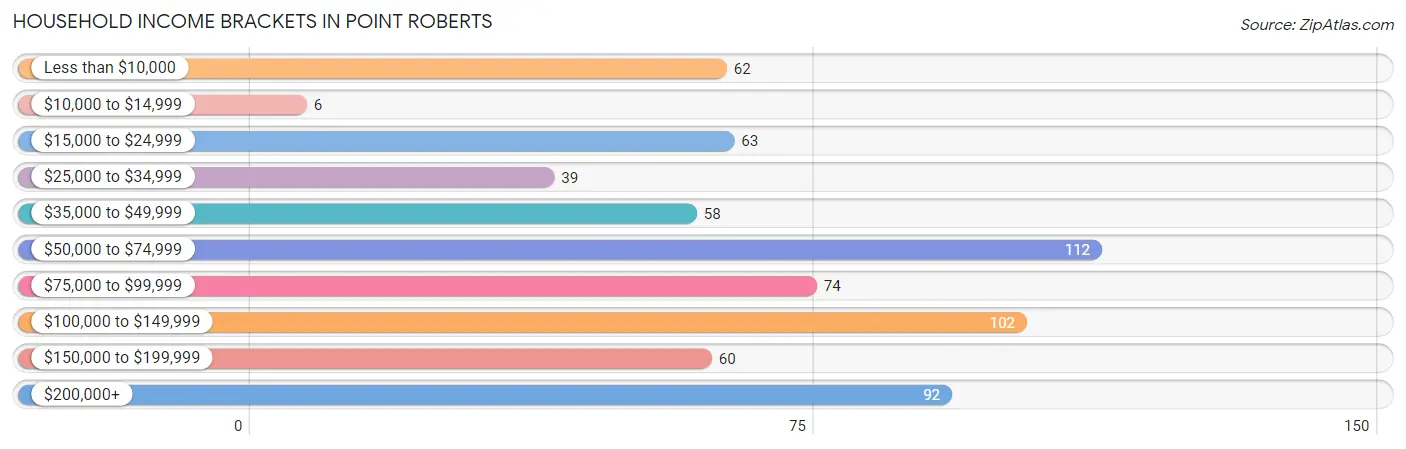
| Income Bracket | # Households | % Households |
| Less than $10,000 | 62 | 9.3% |
| $10,000 to $14,999 | 6 | 0.9% |
| $15,000 to $24,999 | 63 | 9.4% |
| $25,000 to $34,999 | 39 | 5.8% |
| $35,000 to $49,999 | 58 | 8.7% |
| $50,000 to $74,999 | 112 | 16.8% |
| $75,000 to $99,999 | 74 | 11.1% |
| $100,000 to $149,999 | 102 | 15.3% |
| $150,000 to $199,999 | 60 | 9.0% |
| $200,000+ | 92 | 13.8% |
Household Income by Householder Age in Point Roberts
The median household income in Point Roberts is $74,400, with the highest median household income of $141,364 found in the 25 to 44 years age bracket for the primary householder. A total of 68 households (10.2%) fall into this category. Meanwhile, the 15 to 24 years age bracket for the primary householder has the lowest median household income of $0, with 7 households (1.1%) in this group.
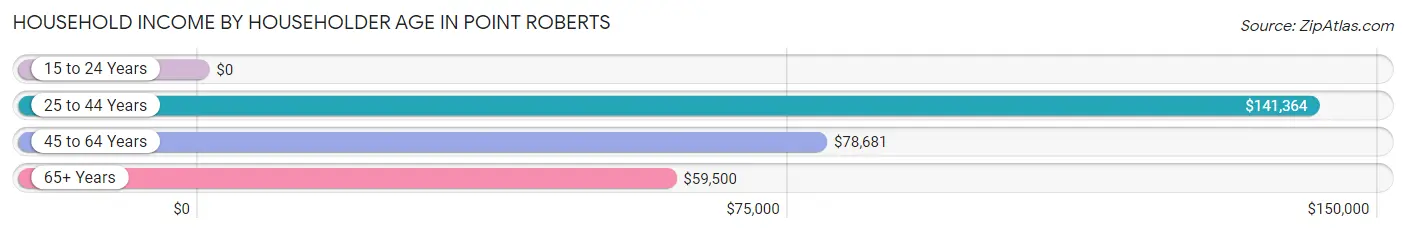
| Income Bracket | # Households | Median Income |
| 15 to 24 Years | 7 (1.1%) | $0 |
| 25 to 44 Years | 68 (10.2%) | $141,364 |
| 45 to 64 Years | 329 (49.2%) | $78,681 |
| 65+ Years | 264 (39.5%) | $59,500 |
| Total | 668 (100.0%) | $74,400 |
Poverty in Point Roberts
Income Below Poverty by Sex and Age in Point Roberts
With 4.3% poverty level for males and 16.3% for females among the residents of Point Roberts, 6 to 11 year old males and 16 and 17 year old females are the most vulnerable to poverty, with 7 males (13.2%) and 17 females (73.9%) in their respective age groups living below the poverty level.
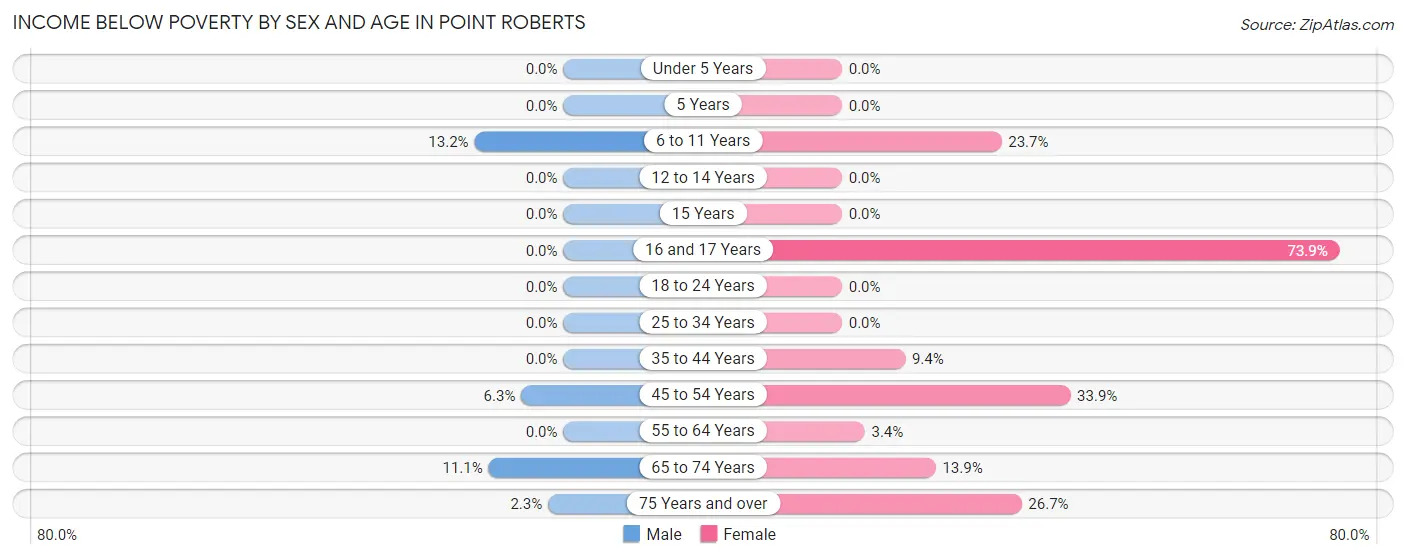
| Age Bracket | Male | Female |
| Under 5 Years | 0 (0.0%) | 0 (0.0%) |
| 5 Years | 0 (0.0%) | 0 (0.0%) |
| 6 to 11 Years | 7 (13.2%) | 9 (23.7%) |
| 12 to 14 Years | 0 (0.0%) | 0 (0.0%) |
| 15 Years | 0 (0.0%) | 0 (0.0%) |
| 16 and 17 Years | 0 (0.0%) | 17 (73.9%) |
| 18 to 24 Years | 0 (0.0%) | 0 (0.0%) |
| 25 to 34 Years | 0 (0.0%) | 0 (0.0%) |
| 35 to 44 Years | 0 (0.0%) | 6 (9.4%) |
| 45 to 54 Years | 5 (6.2%) | 39 (33.9%) |
| 55 to 64 Years | 0 (0.0%) | 5 (3.4%) |
| 65 to 74 Years | 12 (11.1%) | 21 (13.9%) |
| 75 Years and over | 2 (2.3%) | 8 (26.7%) |
| Total | 26 (4.3%) | 105 (16.3%) |
Income Above Poverty by Sex and Age in Point Roberts
According to the poverty statistics in Point Roberts, males aged under 5 years and females aged under 5 years are the age groups that are most secure financially, with 100.0% of males and 100.0% of females in these age groups living above the poverty line.
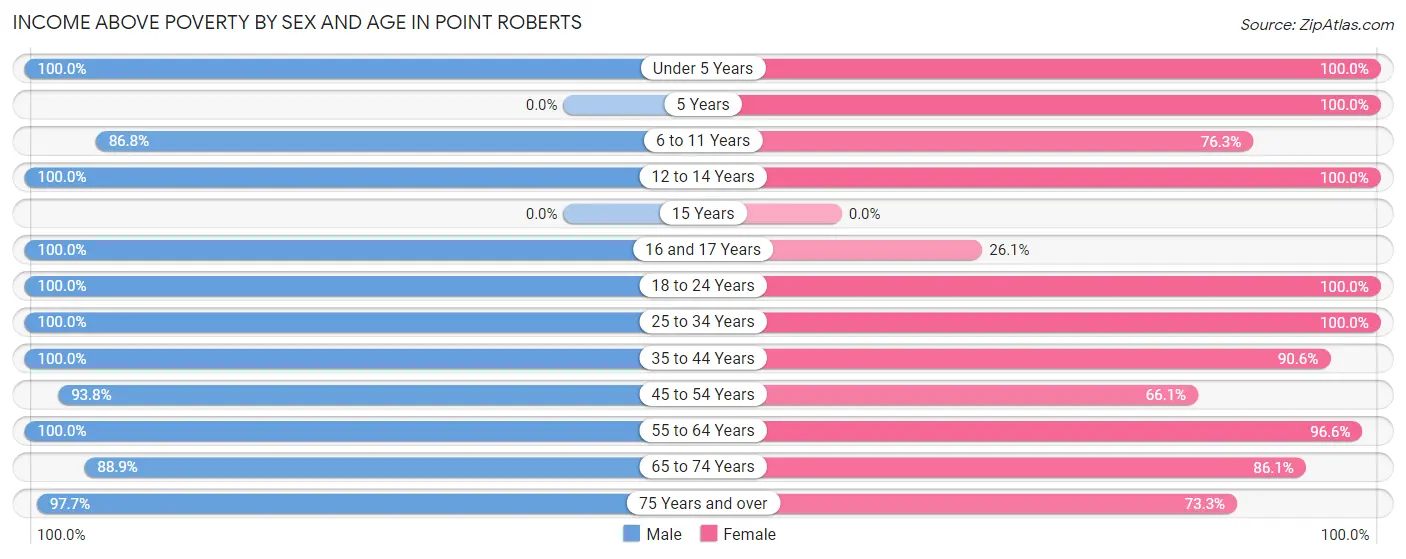
| Age Bracket | Male | Female |
| Under 5 Years | 3 (100.0%) | 4 (100.0%) |
| 5 Years | 0 (0.0%) | 7 (100.0%) |
| 6 to 11 Years | 46 (86.8%) | 29 (76.3%) |
| 12 to 14 Years | 11 (100.0%) | 11 (100.0%) |
| 15 Years | 0 (0.0%) | 0 (0.0%) |
| 16 and 17 Years | 8 (100.0%) | 6 (26.1%) |
| 18 to 24 Years | 25 (100.0%) | 46 (100.0%) |
| 25 to 34 Years | 52 (100.0%) | 9 (100.0%) |
| 35 to 44 Years | 33 (100.0%) | 58 (90.6%) |
| 45 to 54 Years | 75 (93.8%) | 76 (66.1%) |
| 55 to 64 Years | 142 (100.0%) | 143 (96.6%) |
| 65 to 74 Years | 96 (88.9%) | 130 (86.1%) |
| 75 Years and over | 86 (97.7%) | 22 (73.3%) |
| Total | 577 (95.7%) | 541 (83.8%) |
Income Below Poverty Among Married-Couple Families in Point Roberts
The poverty statistics for married-couple families in Point Roberts show that 4.5% or 14 of the total 313 families live below the poverty line. Families with no children have the highest poverty rate of 5.7%, comprising of 14 families. On the other hand, families with 1 or 2 children have the lowest poverty rate of 0.0%, which includes 0 families.
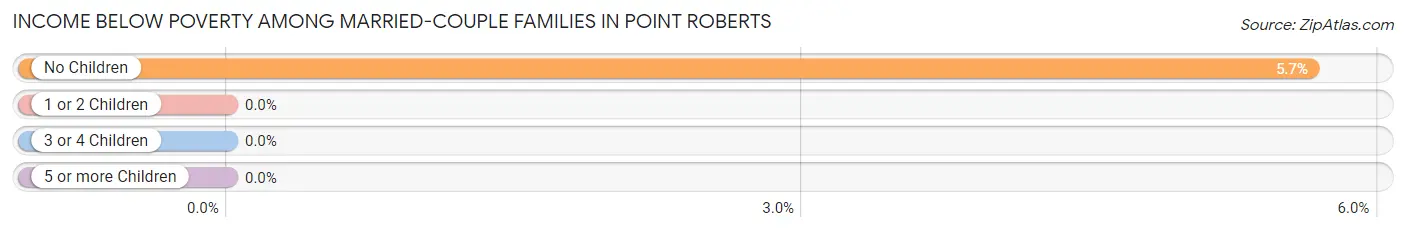
| Children | Above Poverty | Below Poverty |
| No Children | 234 (94.4%) | 14 (5.7%) |
| 1 or 2 Children | 65 (100.0%) | 0 (0.0%) |
| 3 or 4 Children | 0 (0.0%) | 0 (0.0%) |
| 5 or more Children | 0 (0.0%) | 0 (0.0%) |
| Total | 299 (95.5%) | 14 (4.5%) |
Income Below Poverty Among Single-Parent Households in Point Roberts
According to the poverty data in Point Roberts, 27.8% or 5 single-father households and 100.0% or 31 single-mother households are living below the poverty line. Among single-father households, those with no children have the highest poverty rate, with 5 households (100.0%) experiencing poverty. Likewise, among single-mother households, those with 1 or 2 children have the highest poverty rate, with 31 households (100.0%) falling below the poverty line.
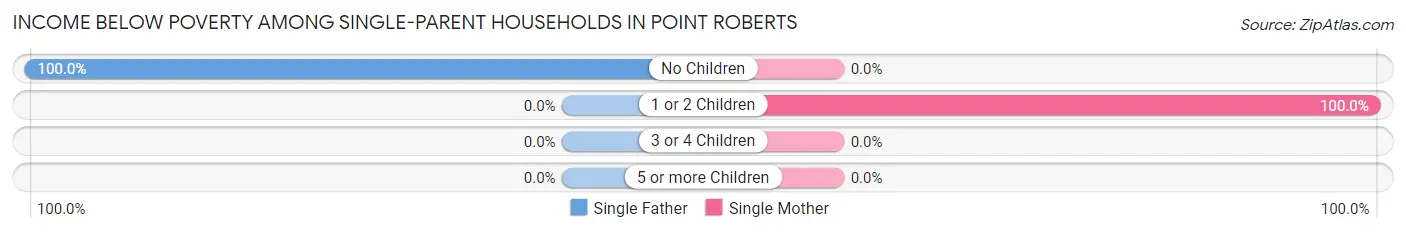
| Children | Single Father | Single Mother |
| No Children | 5 (100.0%) | 0 (0.0%) |
| 1 or 2 Children | 0 (0.0%) | 31 (100.0%) |
| 3 or 4 Children | 0 (0.0%) | 0 (0.0%) |
| 5 or more Children | 0 (0.0%) | 0 (0.0%) |
| Total | 5 (27.8%) | 31 (100.0%) |
Income Below Poverty Among Married-Couple vs Single-Parent Households in Point Roberts
The poverty data for Point Roberts shows that 14 of the married-couple family households (4.5%) and 36 of the single-parent households (73.5%) are living below the poverty level. Within the married-couple family households, those with no children have the highest poverty rate, with 14 households (5.7%) falling below the poverty line. Among the single-parent households, those with no children have the highest poverty rate, with 5 household (100.0%) living below poverty.
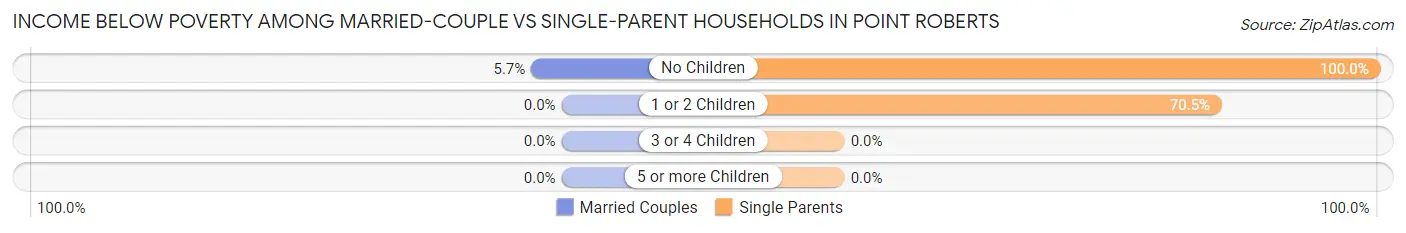
| Children | Married-Couple Families | Single-Parent Households |
| No Children | 14 (5.7%) | 5 (100.0%) |
| 1 or 2 Children | 0 (0.0%) | 31 (70.5%) |
| 3 or 4 Children | 0 (0.0%) | 0 (0.0%) |
| 5 or more Children | 0 (0.0%) | 0 (0.0%) |
| Total | 14 (4.5%) | 36 (73.5%) |
Race in Point Roberts
The most populous races in Point Roberts are White / Caucasian (1,154 | 92.4%), Hispanic or Latino (110 | 8.8%), and Two or more Races (43 | 3.4%).
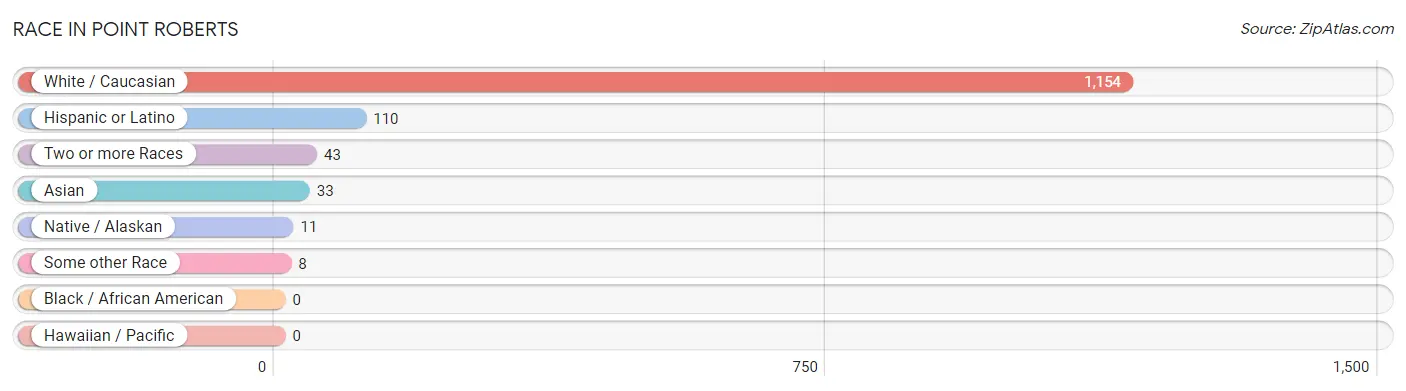
| Race | # Population | % Population |
| Asian | 33 | 2.6% |
| Black / African American | 0 | 0.0% |
| Hawaiian / Pacific | 0 | 0.0% |
| Hispanic or Latino | 110 | 8.8% |
| Native / Alaskan | 11 | 0.9% |
| White / Caucasian | 1,154 | 92.4% |
| Two or more Races | 43 | 3.4% |
| Some other Race | 8 | 0.6% |
| Total | 1,249 | 100.0% |
Ancestry in Point Roberts
The most populous ancestries reported in Point Roberts are English (256 | 20.5%), Scottish (151 | 12.1%), German (130 | 10.4%), Canadian (114 | 9.1%), and Mexican (95 | 7.6%), together accounting for 59.7% of all Point Roberts residents.
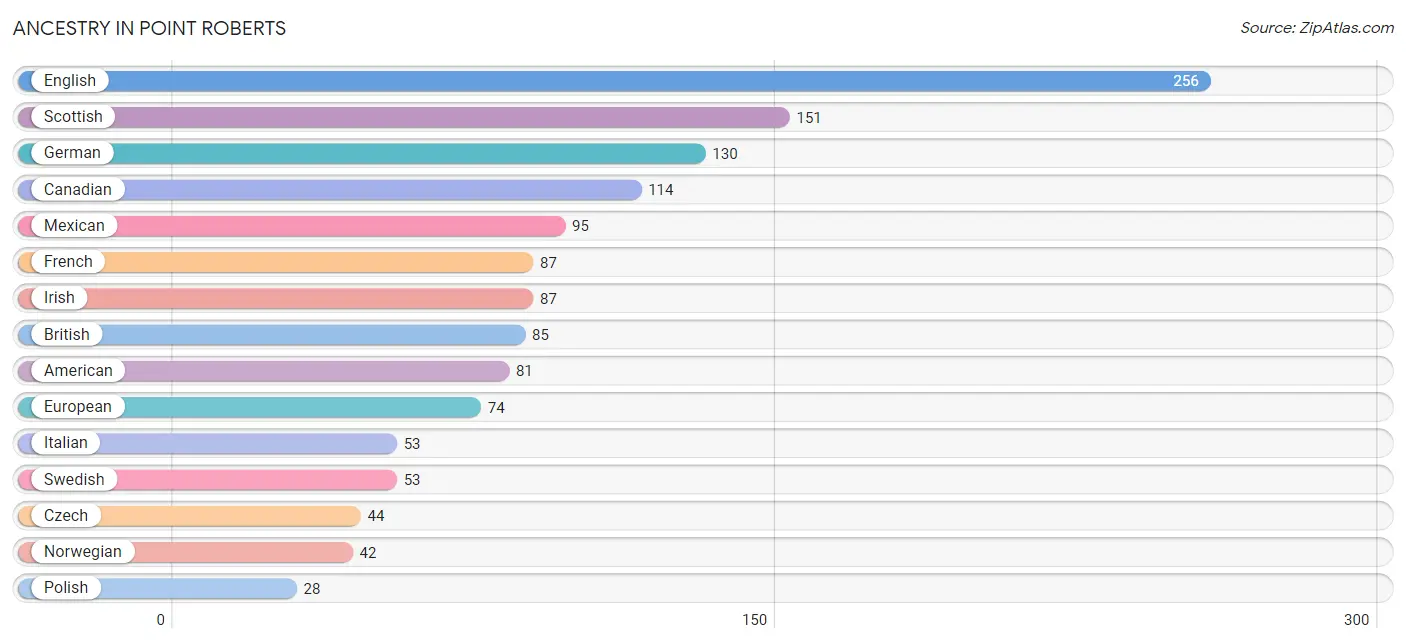
| Ancestry | # Population | % Population |
| American | 81 | 6.5% |
| Arab | 4 | 0.3% |
| Australian | 9 | 0.7% |
| Austrian | 3 | 0.2% |
| Belgian | 11 | 0.9% |
| Bhutanese | 22 | 1.8% |
| British | 85 | 6.8% |
| Cajun | 14 | 1.1% |
| Cambodian | 17 | 1.4% |
| Canadian | 114 | 9.1% |
| Cuban | 7 | 0.6% |
| Czech | 44 | 3.5% |
| Czechoslovakian | 5 | 0.4% |
| Danish | 6 | 0.5% |
| Dutch | 10 | 0.8% |
| Ecuadorian | 8 | 0.6% |
| English | 256 | 20.5% |
| European | 74 | 5.9% |
| Finnish | 25 | 2.0% |
| French | 87 | 7.0% |
| French American Indian | 4 | 0.3% |
| French Canadian | 4 | 0.3% |
| German | 130 | 10.4% |
| Hungarian | 24 | 1.9% |
| Indian (Asian) | 17 | 1.4% |
| Irish | 87 | 7.0% |
| Italian | 53 | 4.2% |
| Lebanese | 4 | 0.3% |
| Mexican | 95 | 7.6% |
| Native Hawaiian | 5 | 0.4% |
| New Zealander | 9 | 0.7% |
| Northern European | 5 | 0.4% |
| Norwegian | 42 | 3.4% |
| Polish | 28 | 2.2% |
| Russian | 10 | 0.8% |
| Scotch-Irish | 22 | 1.8% |
| Scottish | 151 | 12.1% |
| South American | 8 | 0.6% |
| Swedish | 53 | 4.2% |
| Ukrainian | 15 | 1.2% |
| Welsh | 18 | 1.4% | View All 41 Rows |
Immigrants in Point Roberts
The most numerous immigrant groups reported in Point Roberts came from Canada (303 | 24.3%), Europe (86 | 6.9%), Latin America (55 | 4.4%), Northern Europe (53 | 4.2%), and Central America (42 | 3.4%), together accounting for 43.1% of all Point Roberts residents.
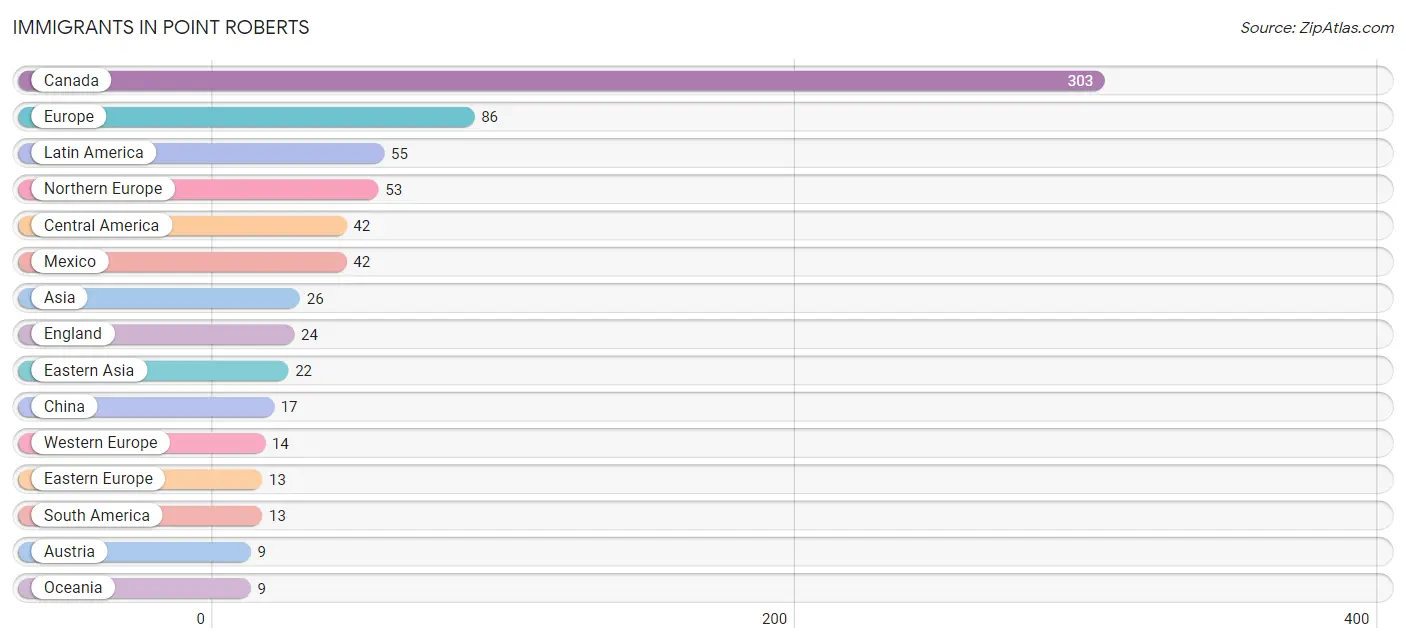
| Immigration Origin | # Population | % Population |
| Asia | 26 | 2.1% |
| Austria | 9 | 0.7% |
| Belgium | 5 | 0.4% |
| Canada | 303 | 24.3% |
| Central America | 42 | 3.4% |
| China | 17 | 1.4% |
| Czechoslovakia | 8 | 0.6% |
| Denmark | 6 | 0.5% |
| Eastern Asia | 22 | 1.8% |
| Eastern Europe | 13 | 1.0% |
| Ecuador | 8 | 0.6% |
| England | 24 | 1.9% |
| Europe | 86 | 6.9% |
| Ireland | 5 | 0.4% |
| Italy | 6 | 0.5% |
| Japan | 5 | 0.4% |
| Latin America | 55 | 4.4% |
| Lebanon | 4 | 0.3% |
| Mexico | 42 | 3.4% |
| Northern Europe | 53 | 4.2% |
| Oceania | 9 | 0.7% |
| Peru | 5 | 0.4% |
| Poland | 5 | 0.4% |
| Scotland | 4 | 0.3% |
| South America | 13 | 1.0% |
| Southern Europe | 6 | 0.5% |
| Western Asia | 4 | 0.3% |
| Western Europe | 14 | 1.1% | View All 28 Rows |
Sex and Age in Point Roberts
Sex and Age in Point Roberts
The most populous age groups in Point Roberts are 55 to 59 Years (82 | 13.6%) for men and 55 to 59 Years (86 | 13.3%) for women.
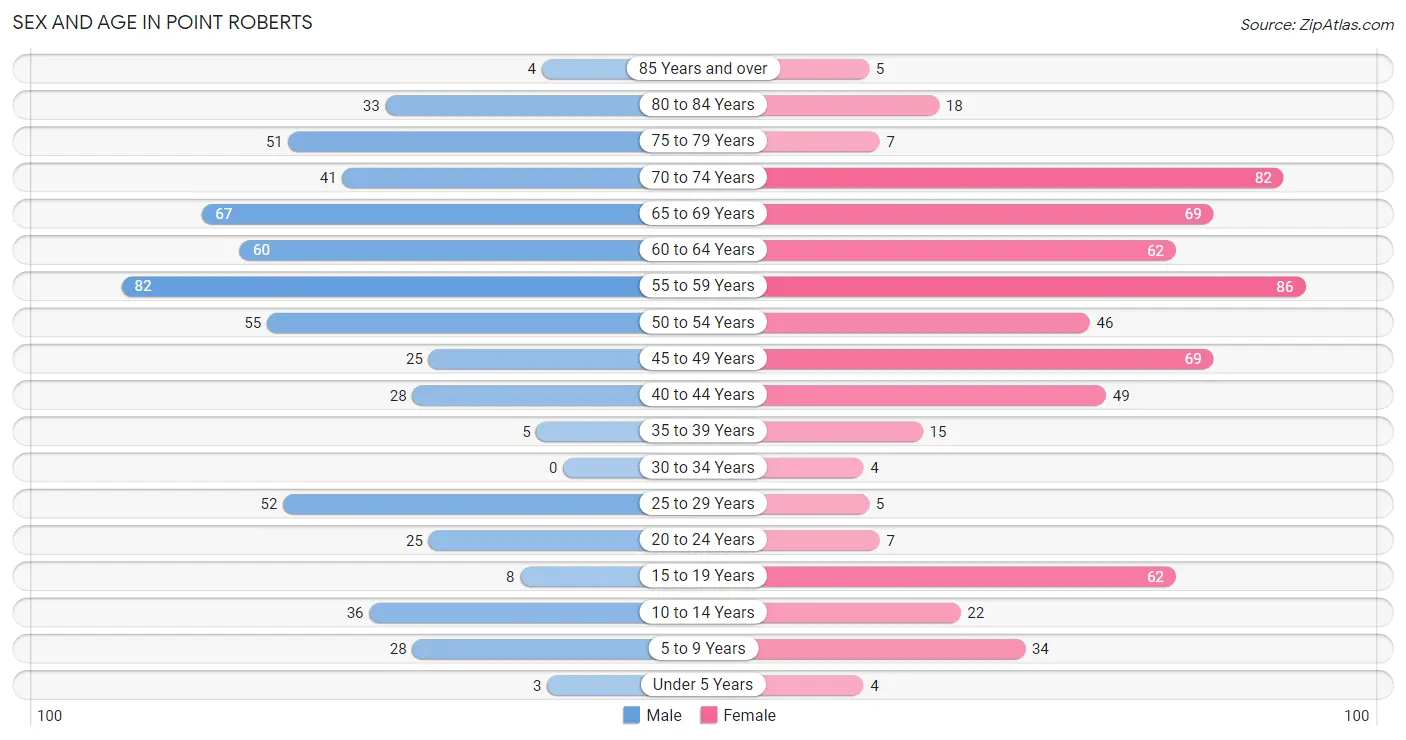
| Age Bracket | Male | Female |
| Under 5 Years | 3 (0.5%) | 4 (0.6%) |
| 5 to 9 Years | 28 (4.6%) | 34 (5.3%) |
| 10 to 14 Years | 36 (6.0%) | 22 (3.4%) |
| 15 to 19 Years | 8 (1.3%) | 62 (9.6%) |
| 20 to 24 Years | 25 (4.2%) | 7 (1.1%) |
| 25 to 29 Years | 52 (8.6%) | 5 (0.8%) |
| 30 to 34 Years | 0 (0.0%) | 4 (0.6%) |
| 35 to 39 Years | 5 (0.8%) | 15 (2.3%) |
| 40 to 44 Years | 28 (4.6%) | 49 (7.6%) |
| 45 to 49 Years | 25 (4.2%) | 69 (10.7%) |
| 50 to 54 Years | 55 (9.1%) | 46 (7.1%) |
| 55 to 59 Years | 82 (13.6%) | 86 (13.3%) |
| 60 to 64 Years | 60 (10.0%) | 62 (9.6%) |
| 65 to 69 Years | 67 (11.1%) | 69 (10.7%) |
| 70 to 74 Years | 41 (6.8%) | 82 (12.7%) |
| 75 to 79 Years | 51 (8.5%) | 7 (1.1%) |
| 80 to 84 Years | 33 (5.5%) | 18 (2.8%) |
| 85 Years and over | 4 (0.7%) | 5 (0.8%) |
| Total | 603 (100.0%) | 646 (100.0%) |
Families and Households in Point Roberts
Median Family Size in Point Roberts
The median family size in Point Roberts is 2.54 persons per family, with married-couple families (313 | 86.5%) accounting for the largest median family size of 2.6 persons per family. On the other hand, single female/mother families (31 | 8.6%) represent the smallest median family size with 2.06 persons per family.
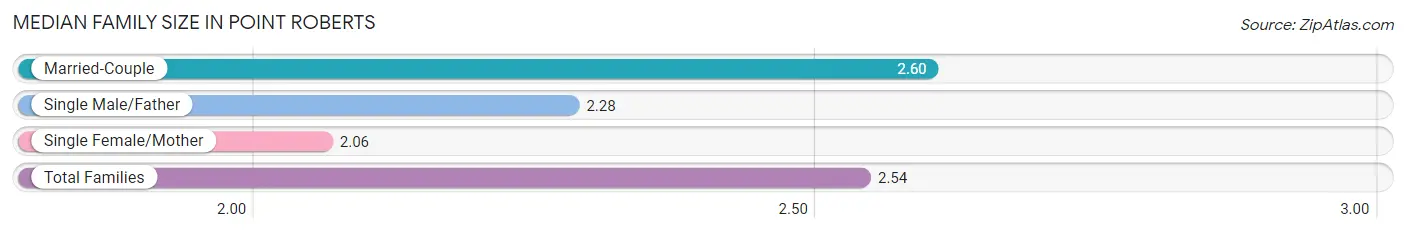
| Family Type | # Families | Family Size |
| Married-Couple | 313 (86.5%) | 2.60 |
| Single Male/Father | 18 (5.0%) | 2.28 |
| Single Female/Mother | 31 (8.6%) | 2.06 |
| Total Families | 362 (100.0%) | 2.54 |
Median Household Size in Point Roberts
The median household size in Point Roberts is 1.87 persons per household, with married-couple households (313 | 46.9%) accounting for the largest median household size of 2.6 persons per household. non-family households (306 | 45.8%) represent the smallest median household size with 1.08 persons per household.
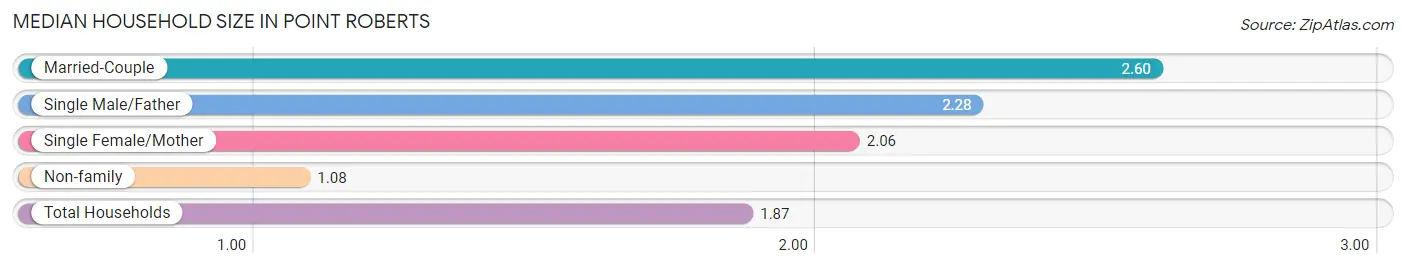
| Household Type | # Households | Household Size |
| Married-Couple | 313 (46.9%) | 2.60 |
| Single Male/Father | 18 (2.7%) | 2.28 |
| Single Female/Mother | 31 (4.6%) | 2.06 |
| Non-family | 306 (45.8%) | 1.08 |
| Total Households | 668 (100.0%) | 1.87 |
Household Size by Marriage Status in Point Roberts
Out of a total of 668 households in Point Roberts, 362 (54.2%) are family households, while 306 (45.8%) are nonfamily households. The most numerous type of family households are 2-person households, comprising 237, and the most common type of nonfamily households are 1-person households, comprising 285.
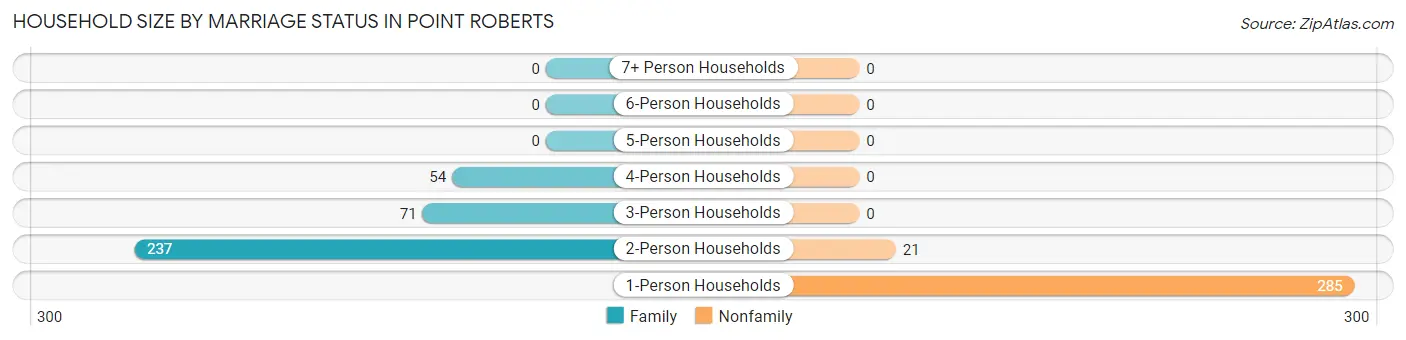
| Household Size | Family Households | Nonfamily Households |
| 1-Person Households | - | 285 (42.7%) |
| 2-Person Households | 237 (35.5%) | 21 (3.1%) |
| 3-Person Households | 71 (10.6%) | 0 (0.0%) |
| 4-Person Households | 54 (8.1%) | 0 (0.0%) |
| 5-Person Households | 0 (0.0%) | 0 (0.0%) |
| 6-Person Households | 0 (0.0%) | 0 (0.0%) |
| 7+ Person Households | 0 (0.0%) | 0 (0.0%) |
| Total | 362 (54.2%) | 306 (45.8%) |
Female Fertility in Point Roberts
Fertility by Age in Point Roberts
Average fertility rate in Point Roberts is 93.0 births per 1,000 women. Women in the age bracket of 35 to 50 years have the highest fertility rate with 143.0 births per 1,000 women. Women in the age bracket of 35 to 50 years acount for 100.0% of all women with births.
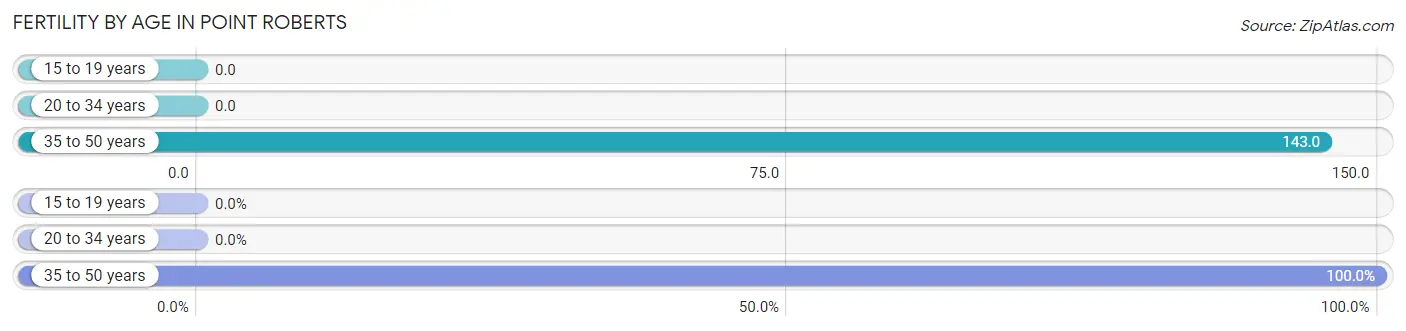
| Age Bracket | Women with Births | Births / 1,000 Women |
| 15 to 19 years | 0 (0.0%) | 0.0 |
| 20 to 34 years | 0 (0.0%) | 0.0 |
| 35 to 50 years | 21 (100.0%) | 143.0 |
| Total | 21 (100.0%) | 93.0 |
Fertility by Age by Marriage Status in Point Roberts
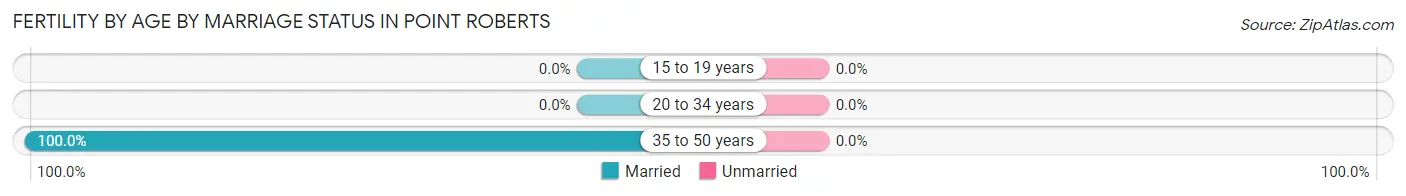
| Age Bracket | Married | Unmarried |
| 15 to 19 years | 0 (0.0%) | 0 (0.0%) |
| 20 to 34 years | 0 (0.0%) | 0 (0.0%) |
| 35 to 50 years | 21 (100.0%) | 0 (0.0%) |
| Total | 21 (100.0%) | 0 (0.0%) |
Fertility by Education in Point Roberts
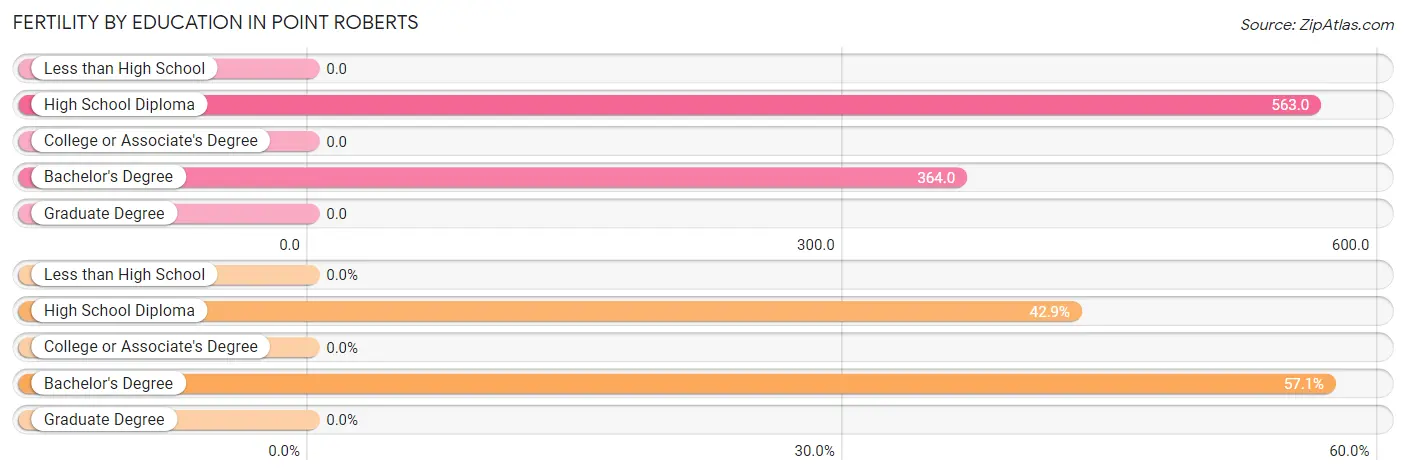
| Educational Attainment | Women with Births | Births / 1,000 Women |
| Less than High School | 0 (0.0%) | 0.0 |
| High School Diploma | 9 (42.9%) | 563.0 |
| College or Associate's Degree | 0 (0.0%) | 0.0 |
| Bachelor's Degree | 12 (57.1%) | 364.0 |
| Graduate Degree | 0 (0.0%) | 0.0 |
| Total | 21 (100.0%) | 93.0 |
Fertility by Education by Marriage Status in Point Roberts
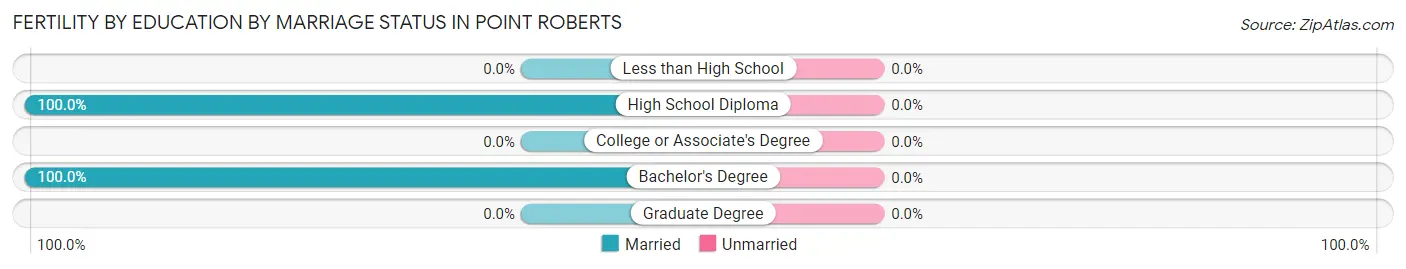
| Educational Attainment | Married | Unmarried |
| Less than High School | 0 (0.0%) | 0 (0.0%) |
| High School Diploma | 9 (100.0%) | 0 (0.0%) |
| College or Associate's Degree | 0 (0.0%) | 0 (0.0%) |
| Bachelor's Degree | 12 (100.0%) | 0 (0.0%) |
| Graduate Degree | 0 (0.0%) | 0 (0.0%) |
| Total | 21 (100.0%) | 0 (0.0%) |
Employment Characteristics in Point Roberts
Employment by Class of Employer in Point Roberts
Among the 633 employed individuals in Point Roberts, private company employees (371 | 58.6%), self-employed (not incorporated) (97 | 15.3%), and self-employed (incorporated) (90 | 14.2%) make up the most common classes of employment.
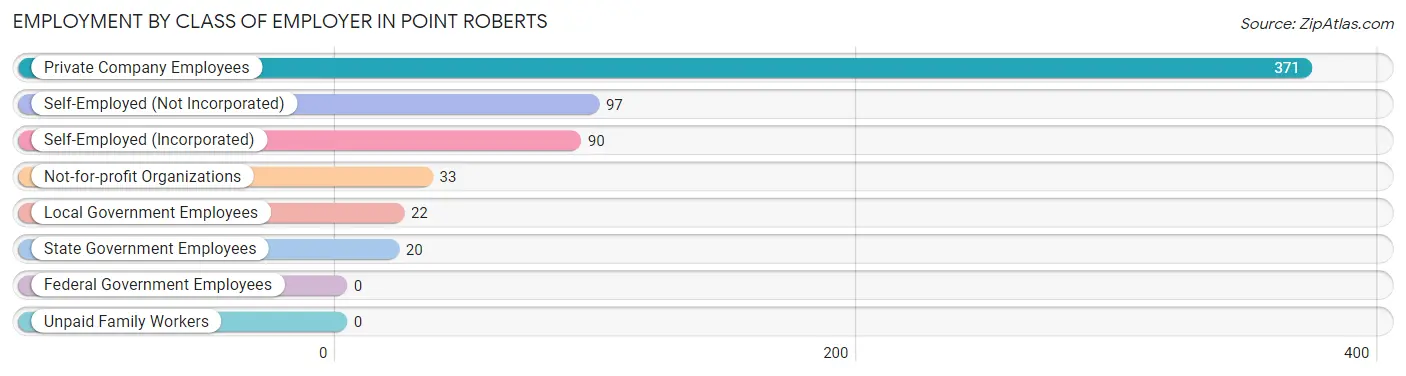
| Employer Class | # Employees | % Employees |
| Private Company Employees | 371 | 58.6% |
| Self-Employed (Incorporated) | 90 | 14.2% |
| Self-Employed (Not Incorporated) | 97 | 15.3% |
| Not-for-profit Organizations | 33 | 5.2% |
| Local Government Employees | 22 | 3.5% |
| State Government Employees | 20 | 3.2% |
| Federal Government Employees | 0 | 0.0% |
| Unpaid Family Workers | 0 | 0.0% |
| Total | 633 | 100.0% |
Employment Status by Age in Point Roberts
According to the labor force statistics for Point Roberts, out of the total population over 16 years of age (1,122), 57.8% or 649 individuals are in the labor force, with 2.5% or 16 of them unemployed. The age group with the highest labor force participation rate is 25 to 29 years, with 100.0% or 57 individuals in the labor force. Within the labor force, the 16 to 19 years age range has the highest percentage of unemployed individuals, with 17.0% or 8 of them being unemployed.
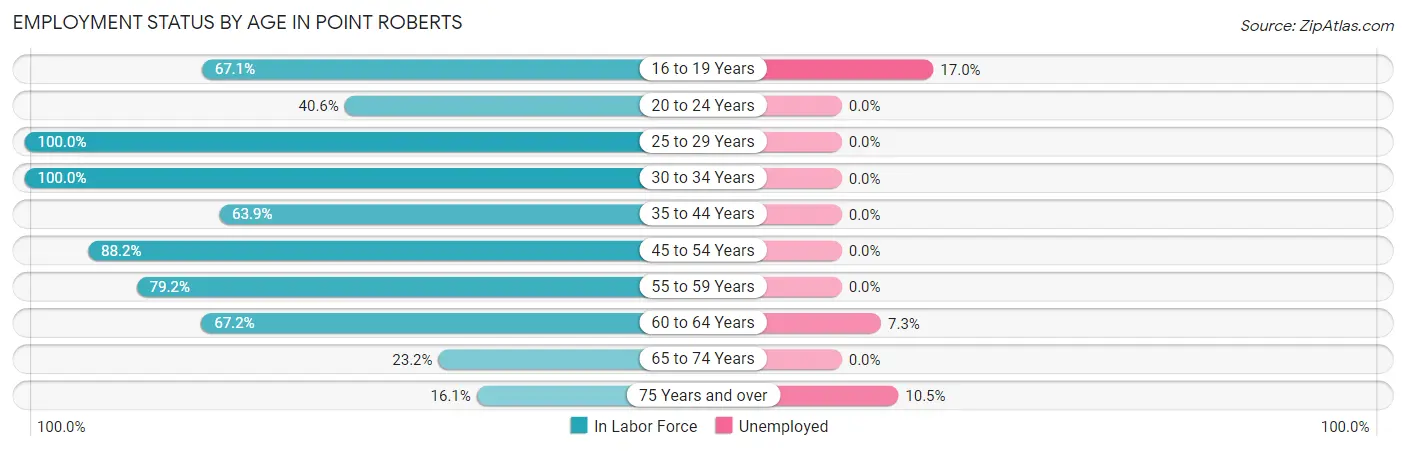
| Age Bracket | In Labor Force | Unemployed |
| 16 to 19 Years | 47 (67.1%) | 8 (17.0%) |
| 20 to 24 Years | 13 (40.6%) | 0 (0.0%) |
| 25 to 29 Years | 57 (100.0%) | 0 (0.0%) |
| 30 to 34 Years | 4 (100.0%) | 0 (0.0%) |
| 35 to 44 Years | 62 (63.9%) | 0 (0.0%) |
| 45 to 54 Years | 172 (88.2%) | 0 (0.0%) |
| 55 to 59 Years | 133 (79.2%) | 0 (0.0%) |
| 60 to 64 Years | 82 (67.2%) | 6 (7.3%) |
| 65 to 74 Years | 60 (23.2%) | 0 (0.0%) |
| 75 Years and over | 19 (16.1%) | 2 (10.5%) |
| Total | 649 (57.8%) | 16 (2.5%) |
Employment Status by Educational Attainment in Point Roberts
According to labor force statistics for Point Roberts, 79.3% of individuals (510) out of the total population between 25 and 64 years of age (643) are in the labor force, with 1.2% or 6 of them being unemployed. The group with the highest labor force participation rate are those with the educational attainment of less than high school, with 100.0% or 17 individuals in the labor force. Within the labor force, individuals with college / associate degree education have the highest percentage of unemployment, with 3.3% or 6 of them being unemployed.
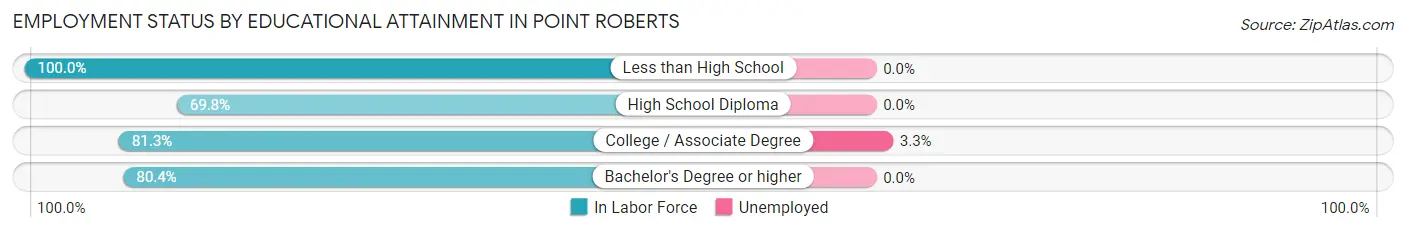
| Educational Attainment | In Labor Force | Unemployed |
| Less than High School | 17 (100.0%) | 0 (0.0%) |
| High School Diploma | 81 (69.8%) | 0 (0.0%) |
| College / Associate Degree | 183 (81.3%) | 7 (3.3%) |
| Bachelor's Degree or higher | 229 (80.4%) | 0 (0.0%) |
| Total | 510 (79.3%) | 8 (1.2%) |
Employment Occupations by Sex in Point Roberts
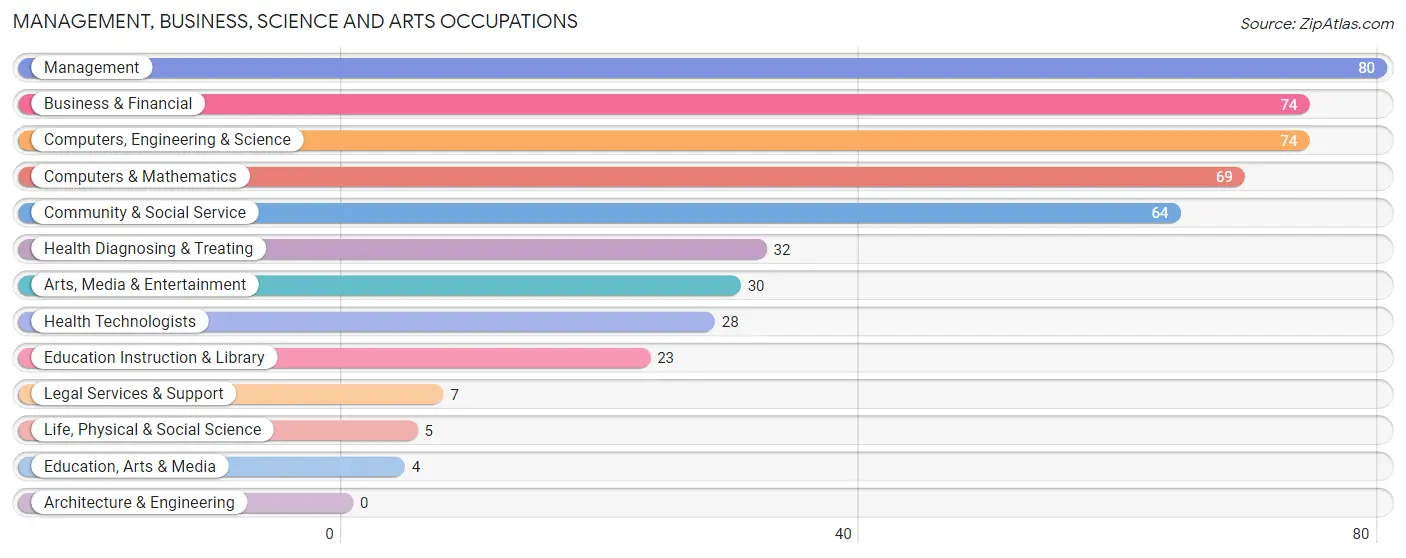
Management, Business, Science and Arts Occupations
The most common Management, Business, Science and Arts occupations in Point Roberts are Management (80 | 12.6%), Business & Financial (74 | 11.7%), Computers, Engineering & Science (74 | 11.7%), Computers & Mathematics (69 | 10.9%), and Community & Social Service (64 | 10.1%).
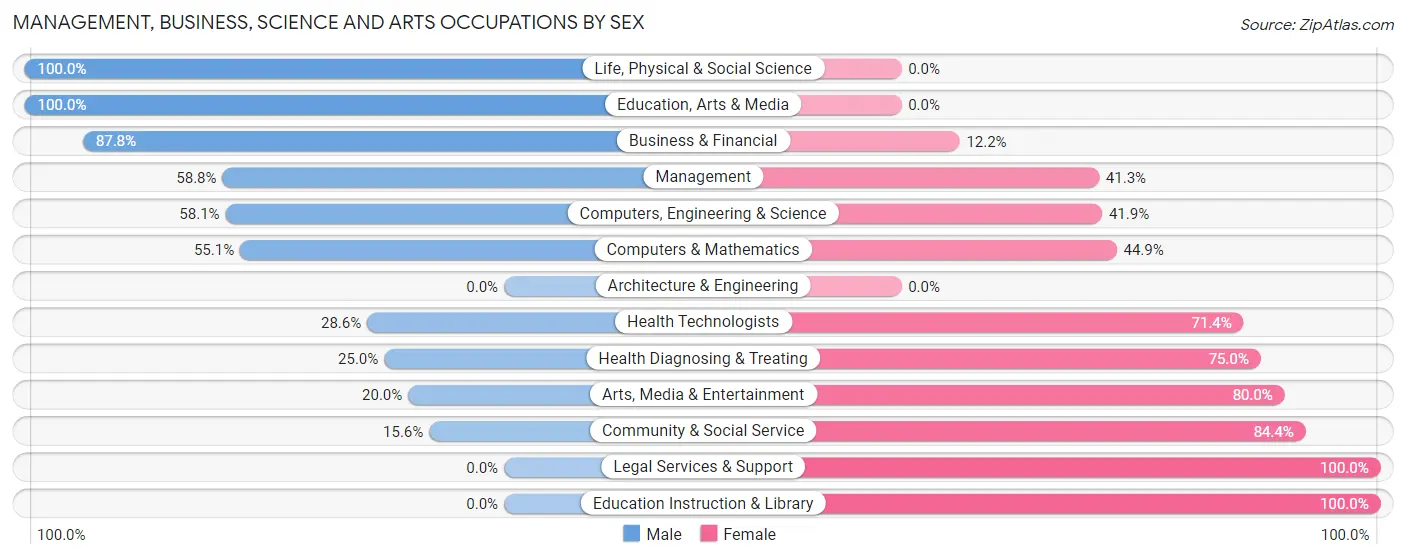
Management, Business, Science and Arts Occupations by Sex
Within the Management, Business, Science and Arts occupations in Point Roberts, the most male-oriented occupations are Life, Physical & Social Science (100.0%), Education, Arts & Media (100.0%), and Business & Financial (87.8%), while the most female-oriented occupations are Legal Services & Support (100.0%), Education Instruction & Library (100.0%), and Community & Social Service (84.4%).
| Occupation | Male | Female |
| Management | 47 (58.8%) | 33 (41.2%) |
| Business & Financial | 65 (87.8%) | 9 (12.2%) |
| Computers, Engineering & Science | 43 (58.1%) | 31 (41.9%) |
| Computers & Mathematics | 38 (55.1%) | 31 (44.9%) |
| Architecture & Engineering | 0 (0.0%) | 0 (0.0%) |
| Life, Physical & Social Science | 5 (100.0%) | 0 (0.0%) |
| Community & Social Service | 10 (15.6%) | 54 (84.4%) |
| Education, Arts & Media | 4 (100.0%) | 0 (0.0%) |
| Legal Services & Support | 0 (0.0%) | 7 (100.0%) |
| Education Instruction & Library | 0 (0.0%) | 23 (100.0%) |
| Arts, Media & Entertainment | 6 (20.0%) | 24 (80.0%) |
| Health Diagnosing & Treating | 8 (25.0%) | 24 (75.0%) |
| Health Technologists | 8 (28.6%) | 20 (71.4%) |
| Total (Category) | 173 (53.4%) | 151 (46.6%) |
| Total (Overall) | 310 (49.0%) | 323 (51.0%) |
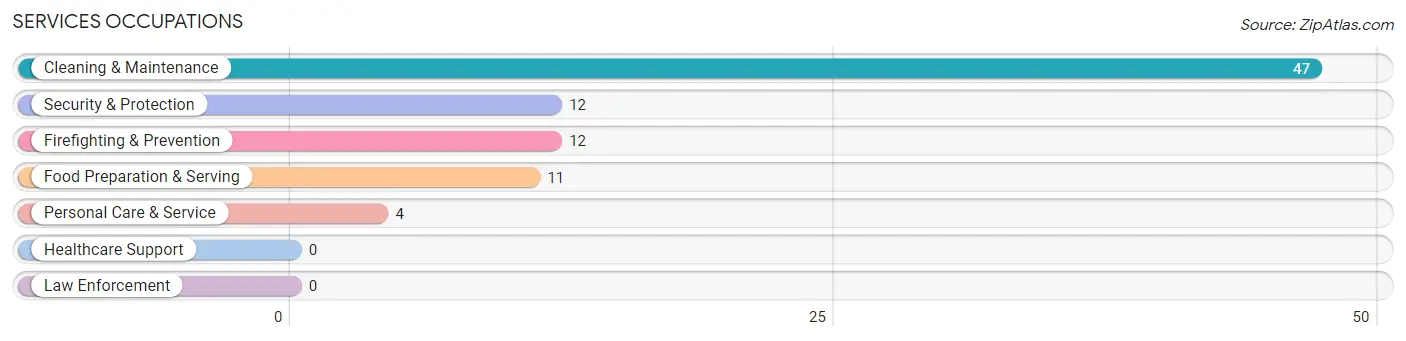
Services Occupations
The most common Services occupations in Point Roberts are Cleaning & Maintenance (47 | 7.4%), Security & Protection (12 | 1.9%), Firefighting & Prevention (12 | 1.9%), Food Preparation & Serving (11 | 1.7%), and Personal Care & Service (4 | 0.6%).
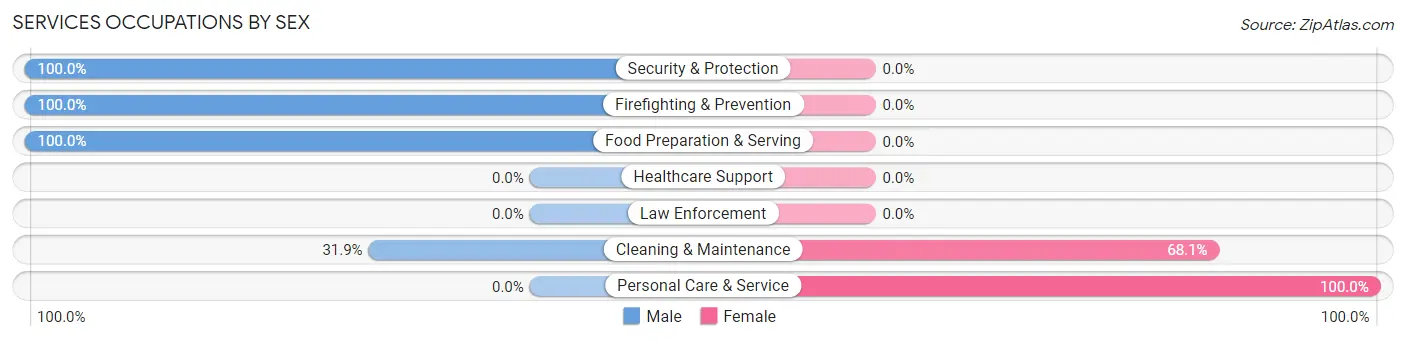
Services Occupations by Sex
Within the Services occupations in Point Roberts, the most male-oriented occupations are Security & Protection (100.0%), Firefighting & Prevention (100.0%), and Food Preparation & Serving (100.0%), while the most female-oriented occupations are Personal Care & Service (100.0%), and Cleaning & Maintenance (68.1%).
| Occupation | Male | Female |
| Healthcare Support | 0 (0.0%) | 0 (0.0%) |
| Security & Protection | 12 (100.0%) | 0 (0.0%) |
| Firefighting & Prevention | 12 (100.0%) | 0 (0.0%) |
| Law Enforcement | 0 (0.0%) | 0 (0.0%) |
| Food Preparation & Serving | 11 (100.0%) | 0 (0.0%) |
| Cleaning & Maintenance | 15 (31.9%) | 32 (68.1%) |
| Personal Care & Service | 0 (0.0%) | 4 (100.0%) |
| Total (Category) | 38 (51.3%) | 36 (48.6%) |
| Total (Overall) | 310 (49.0%) | 323 (51.0%) |
Sales and Office Occupations
The most common Sales and Office occupations in Point Roberts are Office & Administration (82 | 13.0%), and Sales & Related (81 | 12.8%).
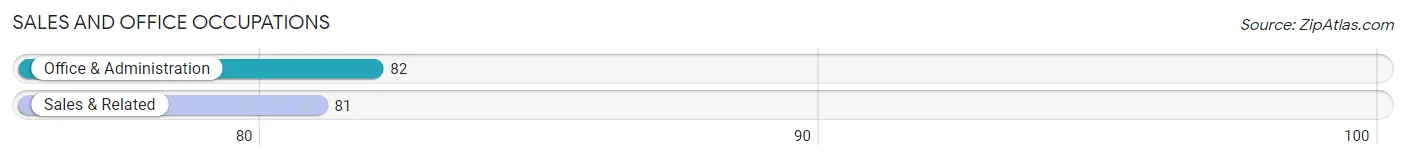
Sales and Office Occupations by Sex
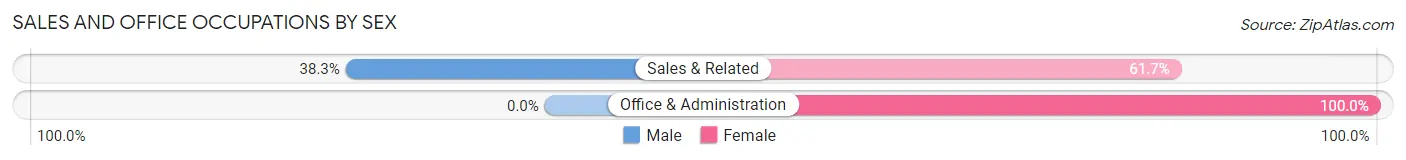
| Occupation | Male | Female |
| Sales & Related | 31 (38.3%) | 50 (61.7%) |
| Office & Administration | 0 (0.0%) | 82 (100.0%) |
| Total (Category) | 31 (19.0%) | 132 (81.0%) |
| Total (Overall) | 310 (49.0%) | 323 (51.0%) |
Natural Resources, Construction and Maintenance Occupations
The most common Natural Resources, Construction and Maintenance occupations in Point Roberts are Construction & Extraction (17 | 2.7%), and Farming, Fishing & Forestry (5 | 0.8%).
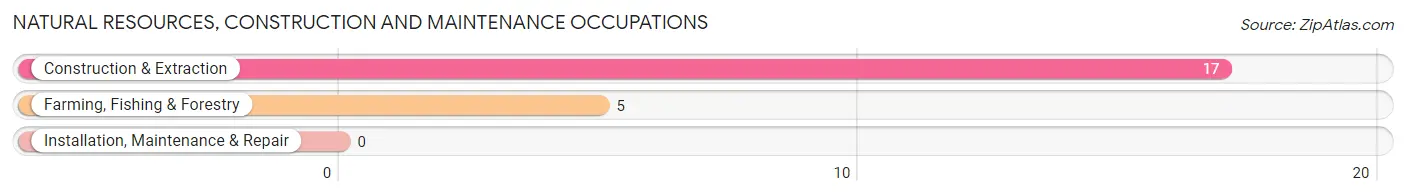
Natural Resources, Construction and Maintenance Occupations by Sex
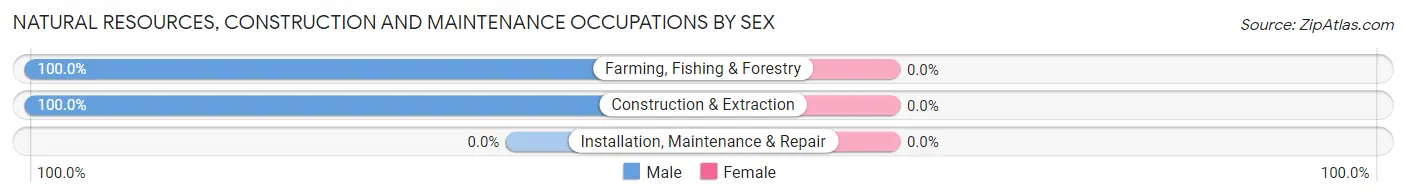
| Occupation | Male | Female |
| Farming, Fishing & Forestry | 5 (100.0%) | 0 (0.0%) |
| Construction & Extraction | 17 (100.0%) | 0 (0.0%) |
| Installation, Maintenance & Repair | 0 (0.0%) | 0 (0.0%) |
| Total (Category) | 22 (100.0%) | 0 (0.0%) |
| Total (Overall) | 310 (49.0%) | 323 (51.0%) |
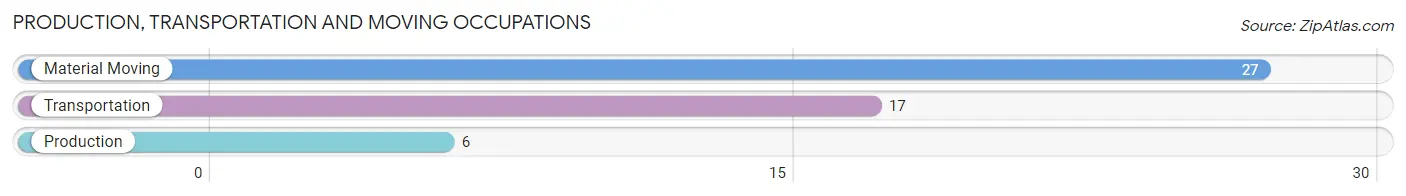
Production, Transportation and Moving Occupations
The most common Production, Transportation and Moving occupations in Point Roberts are Material Moving (27 | 4.3%), Transportation (17 | 2.7%), and Production (6 | 0.9%).
Production, Transportation and Moving Occupations by Sex
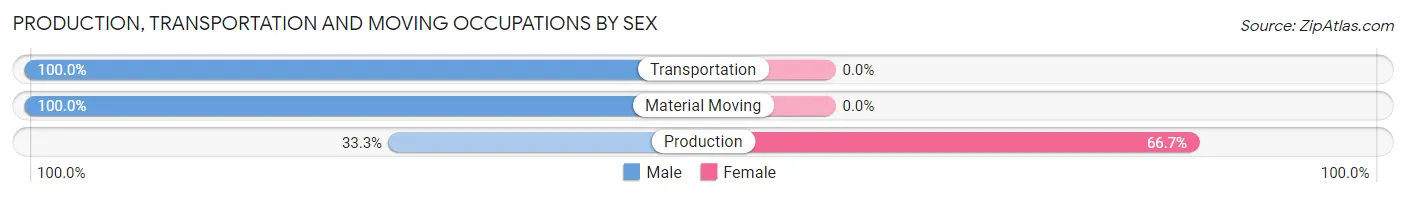
| Occupation | Male | Female |
| Production | 2 (33.3%) | 4 (66.7%) |
| Transportation | 17 (100.0%) | 0 (0.0%) |
| Material Moving | 27 (100.0%) | 0 (0.0%) |
| Total (Category) | 46 (92.0%) | 4 (8.0%) |
| Total (Overall) | 310 (49.0%) | 323 (51.0%) |
Employment Industries by Sex in Point Roberts
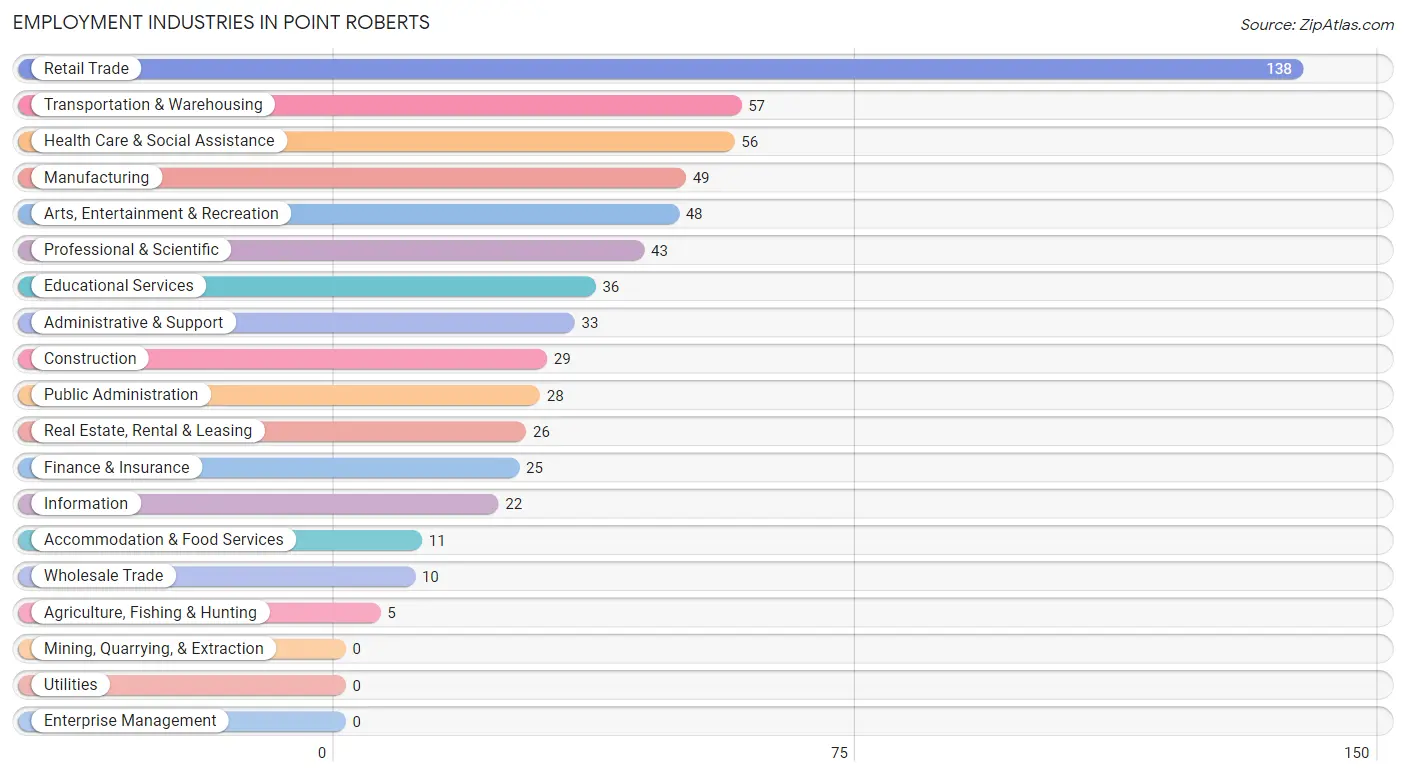
Employment Industries in Point Roberts
The major employment industries in Point Roberts include Retail Trade (138 | 21.8%), Transportation & Warehousing (57 | 9.0%), Health Care & Social Assistance (56 | 8.8%), Manufacturing (49 | 7.7%), and Arts, Entertainment & Recreation (48 | 7.6%).
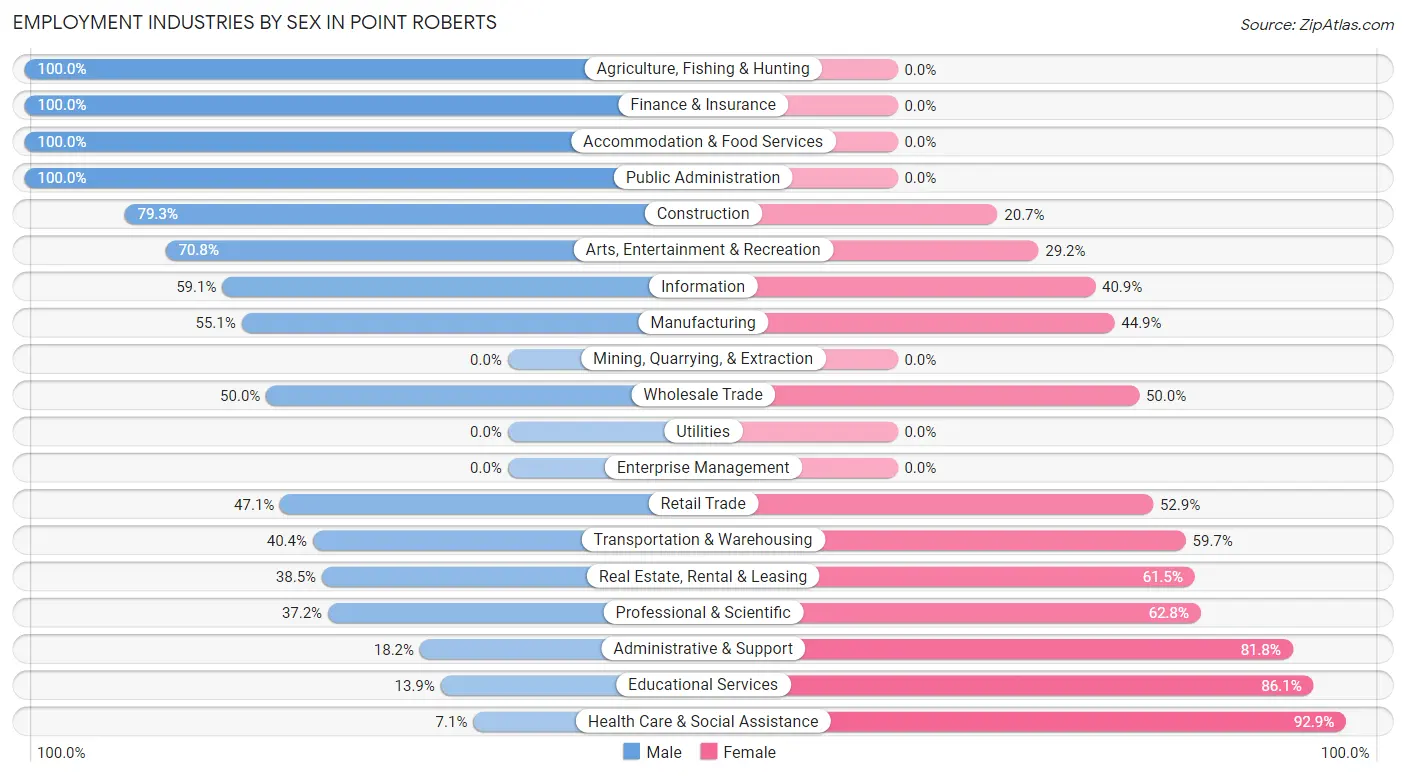
Employment Industries by Sex in Point Roberts
The Point Roberts industries that see more men than women are Agriculture, Fishing & Hunting (100.0%), Finance & Insurance (100.0%), and Accommodation & Food Services (100.0%), whereas the industries that tend to have a higher number of women are Health Care & Social Assistance (92.9%), Educational Services (86.1%), and Administrative & Support (81.8%).
| Industry | Male | Female |
| Agriculture, Fishing & Hunting | 5 (100.0%) | 0 (0.0%) |
| Mining, Quarrying, & Extraction | 0 (0.0%) | 0 (0.0%) |
| Construction | 23 (79.3%) | 6 (20.7%) |
| Manufacturing | 27 (55.1%) | 22 (44.9%) |
| Wholesale Trade | 5 (50.0%) | 5 (50.0%) |
| Retail Trade | 65 (47.1%) | 73 (52.9%) |
| Transportation & Warehousing | 23 (40.4%) | 34 (59.7%) |
| Utilities | 0 (0.0%) | 0 (0.0%) |
| Information | 13 (59.1%) | 9 (40.9%) |
| Finance & Insurance | 25 (100.0%) | 0 (0.0%) |
| Real Estate, Rental & Leasing | 10 (38.5%) | 16 (61.5%) |
| Professional & Scientific | 16 (37.2%) | 27 (62.8%) |
| Enterprise Management | 0 (0.0%) | 0 (0.0%) |
| Administrative & Support | 6 (18.2%) | 27 (81.8%) |
| Educational Services | 5 (13.9%) | 31 (86.1%) |
| Health Care & Social Assistance | 4 (7.1%) | 52 (92.9%) |
| Arts, Entertainment & Recreation | 34 (70.8%) | 14 (29.2%) |
| Accommodation & Food Services | 11 (100.0%) | 0 (0.0%) |
| Public Administration | 28 (100.0%) | 0 (0.0%) |
| Total | 310 (49.0%) | 323 (51.0%) |
Education in Point Roberts
School Enrollment in Point Roberts
The most common levels of schooling among the 239 students in Point Roberts are college / undergraduate (79 | 33.1%), elementary school (65 | 27.2%), and middle school (44 | 18.4%).
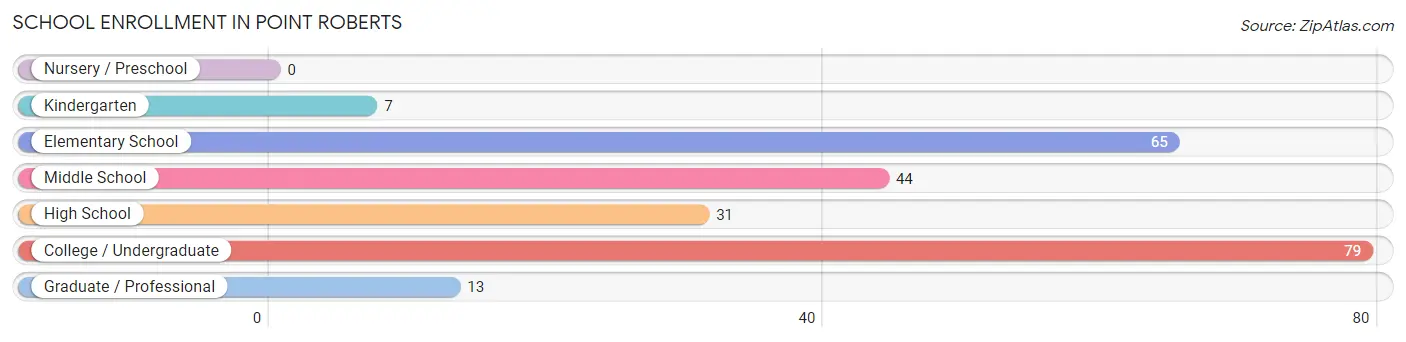
| School Level | # Students | % Students |
| Nursery / Preschool | 0 | 0.0% |
| Kindergarten | 7 | 2.9% |
| Elementary School | 65 | 27.2% |
| Middle School | 44 | 18.4% |
| High School | 31 | 13.0% |
| College / Undergraduate | 79 | 33.1% |
| Graduate / Professional | 13 | 5.4% |
| Total | 239 | 100.0% |
School Enrollment by Age by Funding Source in Point Roberts
Out of a total of 239 students who are enrolled in schools in Point Roberts, 116 (48.5%) attend a private institution, while the remaining 123 (51.5%) are enrolled in public schools. The age group of 18 to 19 year olds has the highest likelihood of being enrolled in private schools, with 39 (100.0% in the age bracket) enrolled. Conversely, the age group of 15 to 17 year olds has the lowest likelihood of being enrolled in a private school, with 31 (100.0% in the age bracket) attending a public institution.
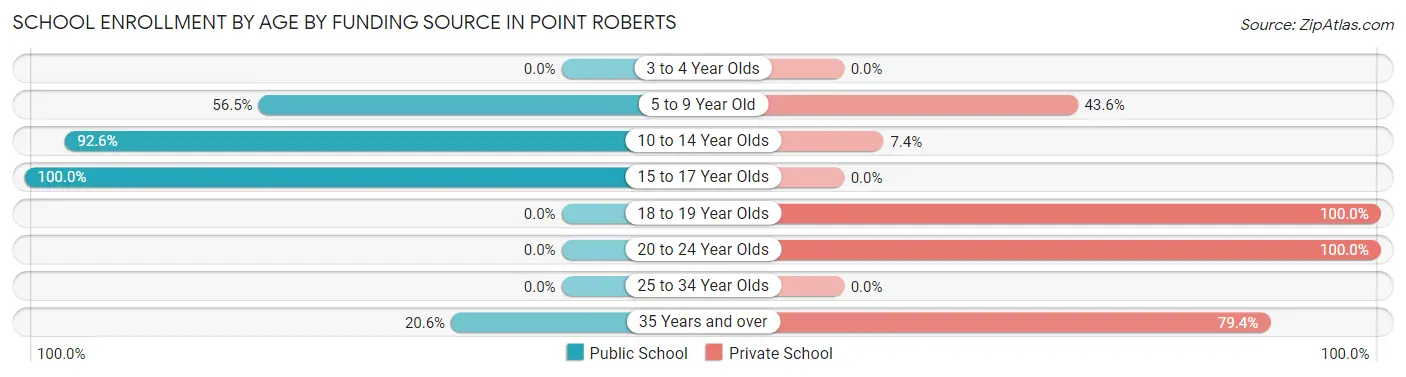
| Age Bracket | Public School | Private School |
| 3 to 4 Year Olds | 0 (0.0%) | 0 (0.0%) |
| 5 to 9 Year Old | 35 (56.5%) | 27 (43.5%) |
| 10 to 14 Year Olds | 50 (92.6%) | 4 (7.4%) |
| 15 to 17 Year Olds | 31 (100.0%) | 0 (0.0%) |
| 18 to 19 Year Olds | 0 (0.0%) | 39 (100.0%) |
| 20 to 24 Year Olds | 0 (0.0%) | 19 (100.0%) |
| 25 to 34 Year Olds | 0 (0.0%) | 0 (0.0%) |
| 35 Years and over | 7 (20.6%) | 27 (79.4%) |
| Total | 123 (51.5%) | 116 (48.5%) |
Educational Attainment by Field of Study in Point Roberts
Business (135 | 25.8%), education (99 | 18.9%), computers & mathematics (47 | 9.0%), social sciences (45 | 8.6%), and engineering (43 | 8.2%) are the most common fields of study among 524 individuals in Point Roberts who have obtained a bachelor's degree or higher.
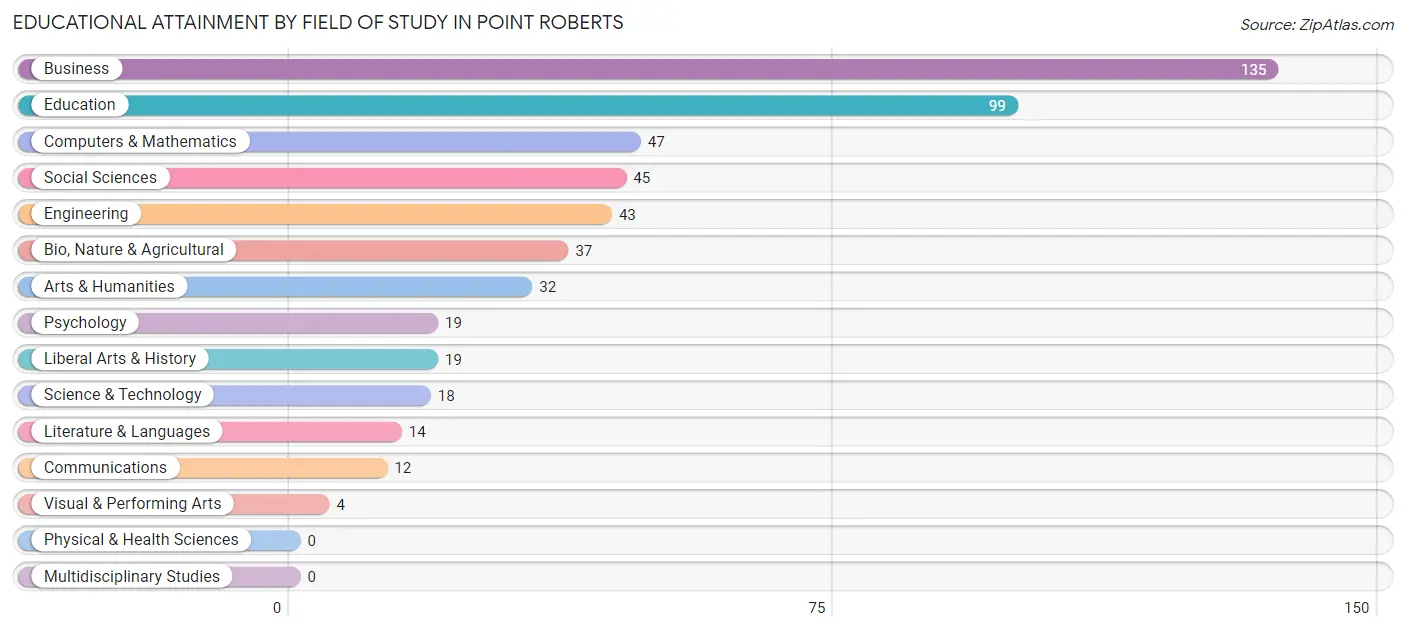
| Field of Study | # Graduates | % Graduates |
| Computers & Mathematics | 47 | 9.0% |
| Bio, Nature & Agricultural | 37 | 7.1% |
| Physical & Health Sciences | 0 | 0.0% |
| Psychology | 19 | 3.6% |
| Social Sciences | 45 | 8.6% |
| Engineering | 43 | 8.2% |
| Multidisciplinary Studies | 0 | 0.0% |
| Science & Technology | 18 | 3.4% |
| Business | 135 | 25.8% |
| Education | 99 | 18.9% |
| Literature & Languages | 14 | 2.7% |
| Liberal Arts & History | 19 | 3.6% |
| Visual & Performing Arts | 4 | 0.8% |
| Communications | 12 | 2.3% |
| Arts & Humanities | 32 | 6.1% |
| Total | 524 | 100.0% |
Transportation & Commute in Point Roberts
Vehicle Availability by Sex in Point Roberts
The most prevalent vehicle ownership categories in Point Roberts are males with 2 vehicles (125, accounting for 40.3%) and females with 2 vehicles (125, making up 38.7%).
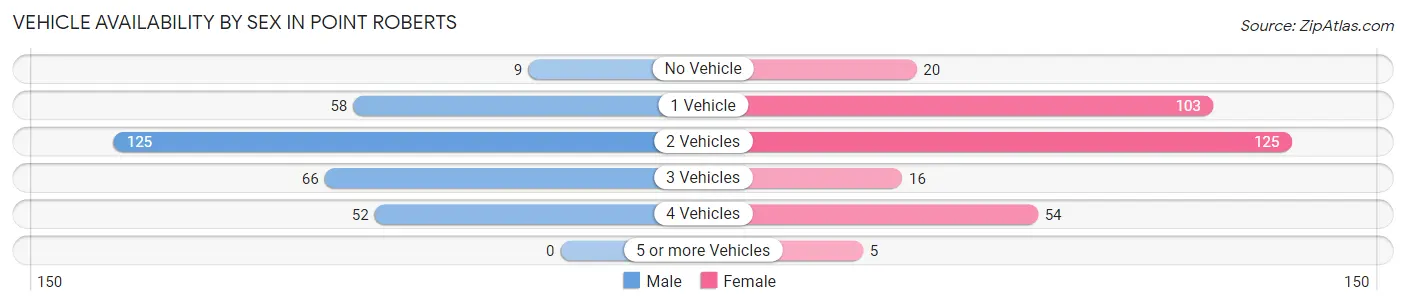
| Vehicles Available | Male | Female |
| No Vehicle | 9 (2.9%) | 20 (6.2%) |
| 1 Vehicle | 58 (18.7%) | 103 (31.9%) |
| 2 Vehicles | 125 (40.3%) | 125 (38.7%) |
| 3 Vehicles | 66 (21.3%) | 16 (5.0%) |
| 4 Vehicles | 52 (16.8%) | 54 (16.7%) |
| 5 or more Vehicles | 0 (0.0%) | 5 (1.5%) |
| Total | 310 (100.0%) | 323 (100.0%) |
Commute Time in Point Roberts
The most frequently occuring commute durations in Point Roberts are less than 5 minutes (101 commuters, 26.1%), 5 to 9 minutes (97 commuters, 25.1%), and 10 to 14 minutes (64 commuters, 16.5%).
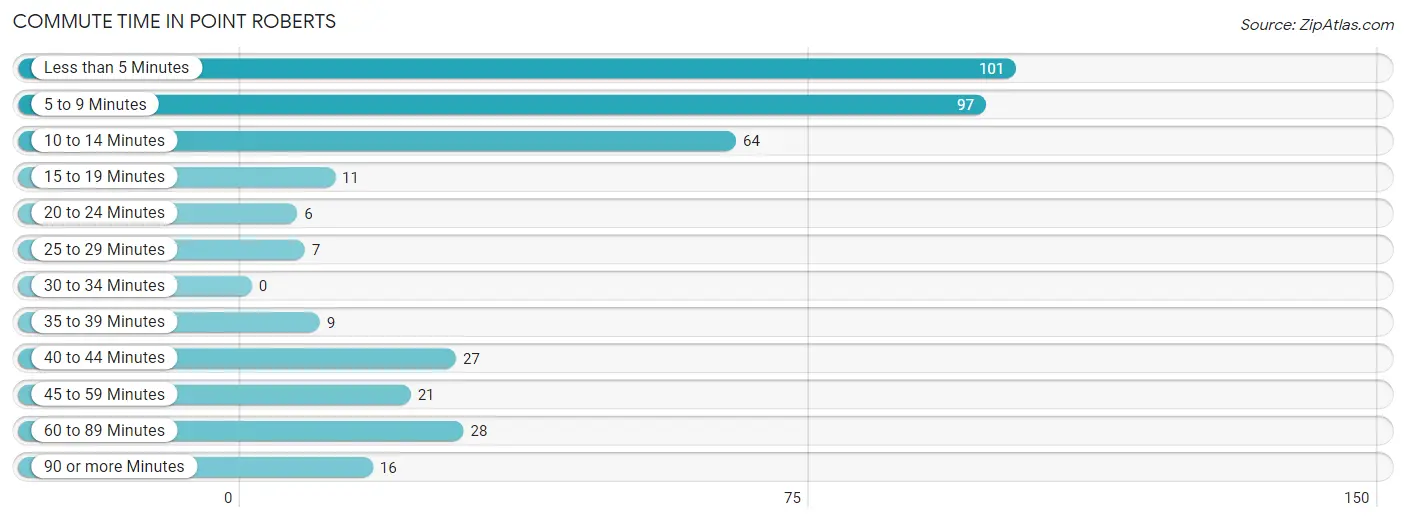
| Commute Time | # Commuters | % Commuters |
| Less than 5 Minutes | 101 | 26.1% |
| 5 to 9 Minutes | 97 | 25.1% |
| 10 to 14 Minutes | 64 | 16.5% |
| 15 to 19 Minutes | 11 | 2.8% |
| 20 to 24 Minutes | 6 | 1.5% |
| 25 to 29 Minutes | 7 | 1.8% |
| 30 to 34 Minutes | 0 | 0.0% |
| 35 to 39 Minutes | 9 | 2.3% |
| 40 to 44 Minutes | 27 | 7.0% |
| 45 to 59 Minutes | 21 | 5.4% |
| 60 to 89 Minutes | 28 | 7.2% |
| 90 or more Minutes | 16 | 4.1% |
Commute Time by Sex in Point Roberts
The most common commute times in Point Roberts are 5 to 9 minutes (45 commuters, 21.8%) for males and less than 5 minutes (67 commuters, 37.0%) for females.
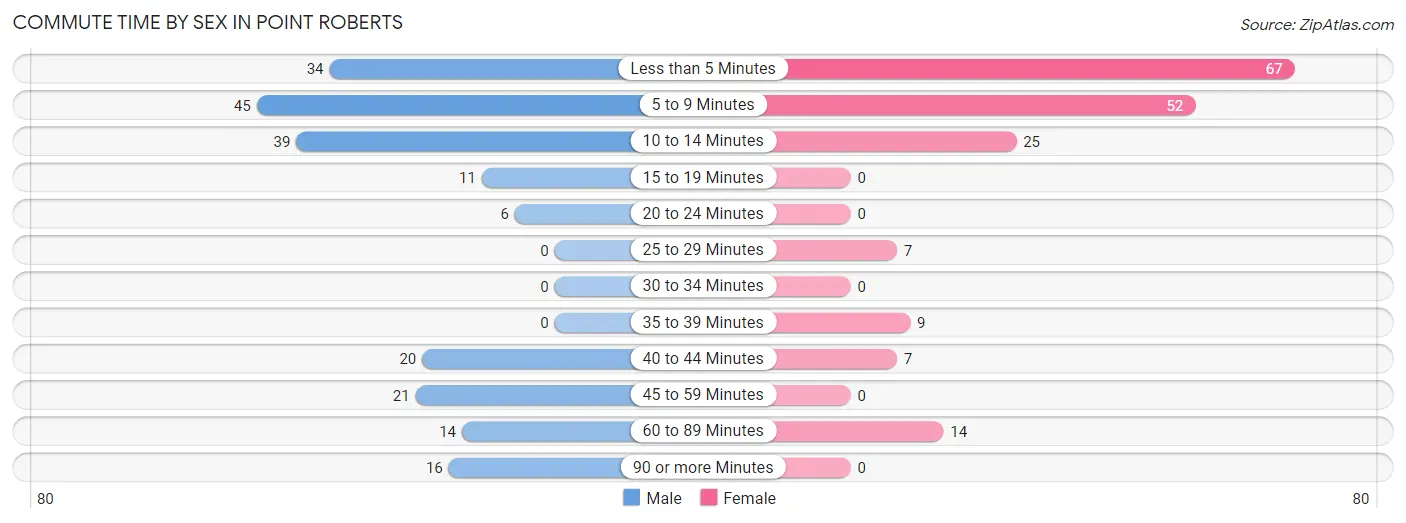
| Commute Time | Male | Female |
| Less than 5 Minutes | 34 (16.5%) | 67 (37.0%) |
| 5 to 9 Minutes | 45 (21.8%) | 52 (28.7%) |
| 10 to 14 Minutes | 39 (18.9%) | 25 (13.8%) |
| 15 to 19 Minutes | 11 (5.3%) | 0 (0.0%) |
| 20 to 24 Minutes | 6 (2.9%) | 0 (0.0%) |
| 25 to 29 Minutes | 0 (0.0%) | 7 (3.9%) |
| 30 to 34 Minutes | 0 (0.0%) | 0 (0.0%) |
| 35 to 39 Minutes | 0 (0.0%) | 9 (5.0%) |
| 40 to 44 Minutes | 20 (9.7%) | 7 (3.9%) |
| 45 to 59 Minutes | 21 (10.2%) | 0 (0.0%) |
| 60 to 89 Minutes | 14 (6.8%) | 14 (7.7%) |
| 90 or more Minutes | 16 (7.8%) | 0 (0.0%) |
Time of Departure to Work by Sex in Point Roberts
The most frequent times of departure to work in Point Roberts are 7:30 AM to 7:59 AM (46, 22.3%) for males and 10:00 AM to 10:59 AM (49, 27.1%) for females.
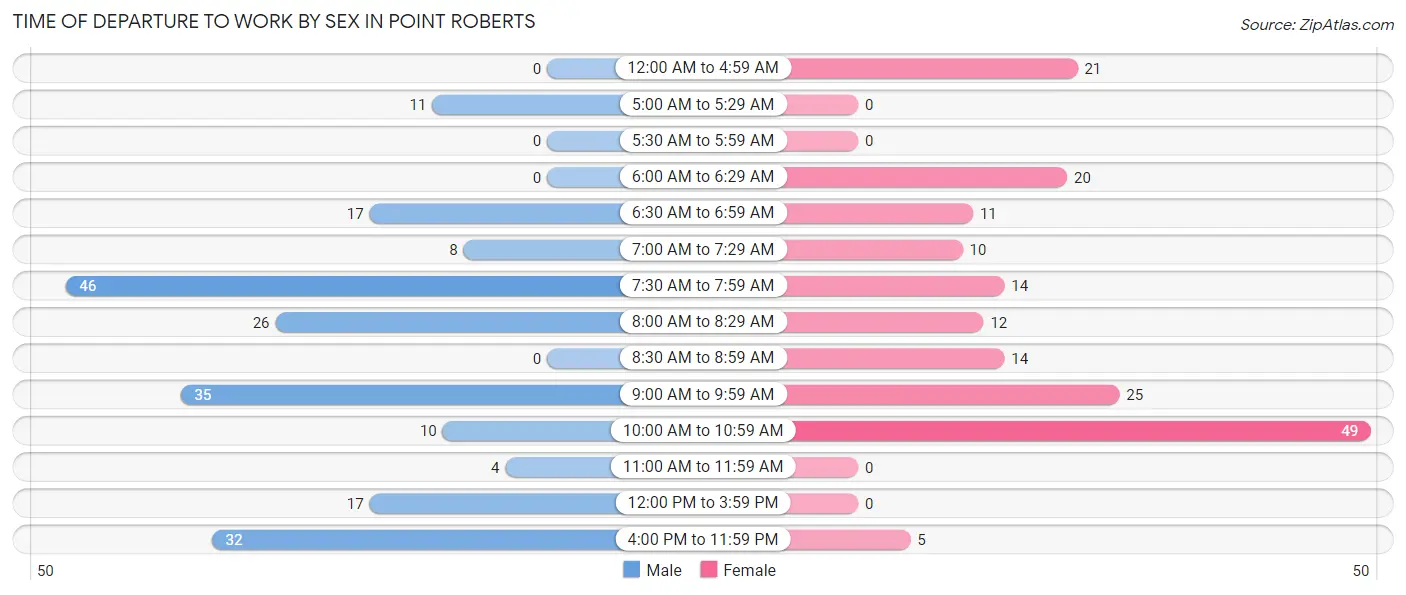
| Time of Departure | Male | Female |
| 12:00 AM to 4:59 AM | 0 (0.0%) | 21 (11.6%) |
| 5:00 AM to 5:29 AM | 11 (5.3%) | 0 (0.0%) |
| 5:30 AM to 5:59 AM | 0 (0.0%) | 0 (0.0%) |
| 6:00 AM to 6:29 AM | 0 (0.0%) | 20 (11.1%) |
| 6:30 AM to 6:59 AM | 17 (8.3%) | 11 (6.1%) |
| 7:00 AM to 7:29 AM | 8 (3.9%) | 10 (5.5%) |
| 7:30 AM to 7:59 AM | 46 (22.3%) | 14 (7.7%) |
| 8:00 AM to 8:29 AM | 26 (12.6%) | 12 (6.6%) |
| 8:30 AM to 8:59 AM | 0 (0.0%) | 14 (7.7%) |
| 9:00 AM to 9:59 AM | 35 (17.0%) | 25 (13.8%) |
| 10:00 AM to 10:59 AM | 10 (4.9%) | 49 (27.1%) |
| 11:00 AM to 11:59 AM | 4 (1.9%) | 0 (0.0%) |
| 12:00 PM to 3:59 PM | 17 (8.3%) | 0 (0.0%) |
| 4:00 PM to 11:59 PM | 32 (15.5%) | 5 (2.8%) |
| Total | 206 (100.0%) | 181 (100.0%) |
Housing Occupancy in Point Roberts
Occupancy by Ownership in Point Roberts
Of the total 668 dwellings in Point Roberts, owner-occupied units account for 572 (85.6%), while renter-occupied units make up 96 (14.4%).
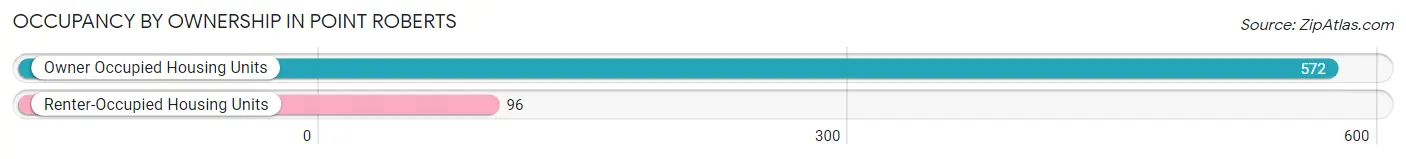
| Occupancy | # Housing Units | % Housing Units |
| Owner Occupied Housing Units | 572 | 85.6% |
| Renter-Occupied Housing Units | 96 | 14.4% |
| Total Occupied Housing Units | 668 | 100.0% |
Occupancy by Household Size in Point Roberts
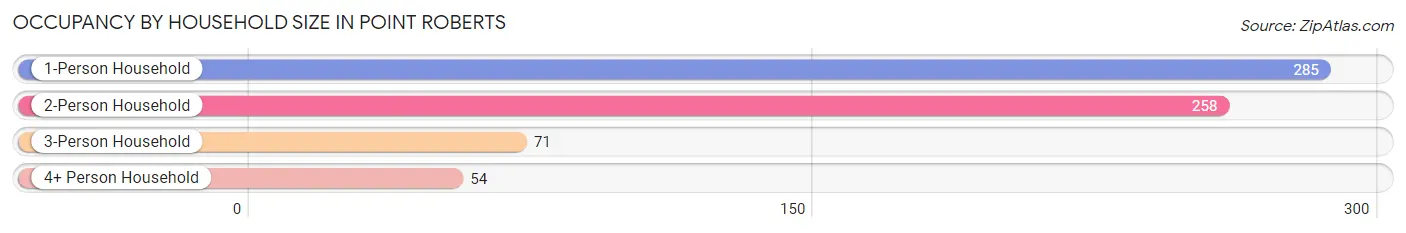
| Household Size | # Housing Units | % Housing Units |
| 1-Person Household | 285 | 42.7% |
| 2-Person Household | 258 | 38.6% |
| 3-Person Household | 71 | 10.6% |
| 4+ Person Household | 54 | 8.1% |
| Total Housing Units | 668 | 100.0% |
Occupancy by Ownership by Household Size in Point Roberts
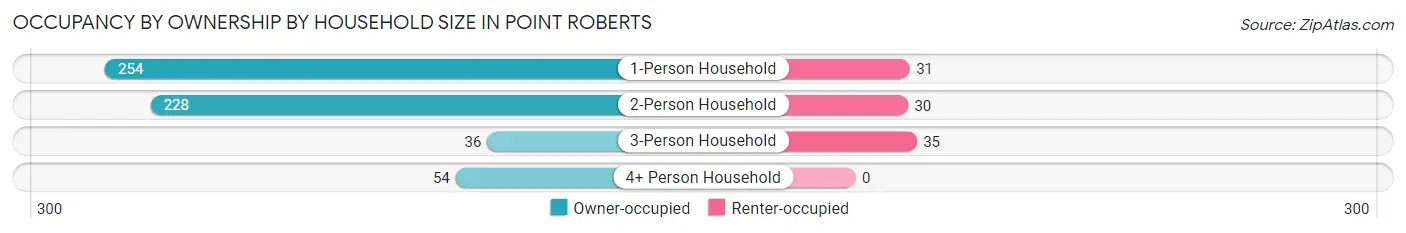
| Household Size | Owner-occupied | Renter-occupied |
| 1-Person Household | 254 (89.1%) | 31 (10.9%) |
| 2-Person Household | 228 (88.4%) | 30 (11.6%) |
| 3-Person Household | 36 (50.7%) | 35 (49.3%) |
| 4+ Person Household | 54 (100.0%) | 0 (0.0%) |
| Total Housing Units | 572 (85.6%) | 96 (14.4%) |
Occupancy by Educational Attainment in Point Roberts
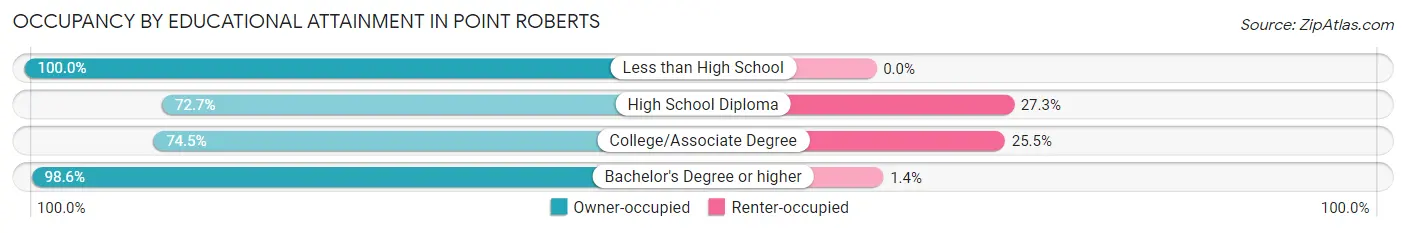
| Household Size | Owner-occupied | Renter-occupied |
| Less than High School | 30 (100.0%) | 0 (0.0%) |
| High School Diploma | 80 (72.7%) | 30 (27.3%) |
| College/Associate Degree | 181 (74.5%) | 62 (25.5%) |
| Bachelor's Degree or higher | 281 (98.6%) | 4 (1.4%) |
Occupancy by Age of Householder in Point Roberts
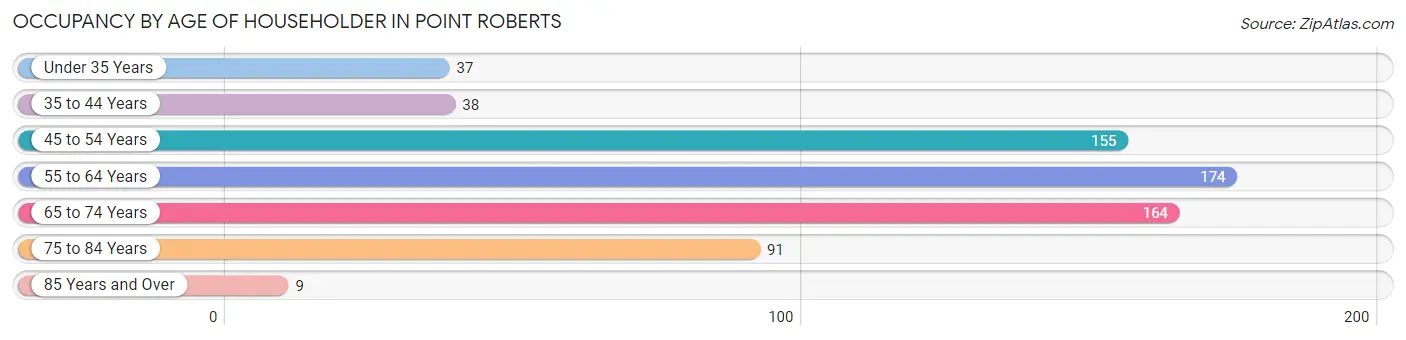
| Age Bracket | # Households | % Households |
| Under 35 Years | 37 | 5.5% |
| 35 to 44 Years | 38 | 5.7% |
| 45 to 54 Years | 155 | 23.2% |
| 55 to 64 Years | 174 | 26.1% |
| 65 to 74 Years | 164 | 24.5% |
| 75 to 84 Years | 91 | 13.6% |
| 85 Years and Over | 9 | 1.3% |
| Total | 668 | 100.0% |
Housing Finances in Point Roberts
Median Income by Occupancy in Point Roberts
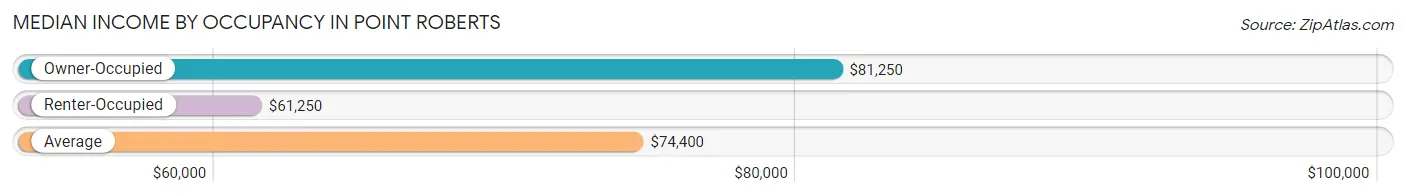
| Occupancy Type | # Households | Median Income |
| Owner-Occupied | 572 (85.6%) | $81,250 |
| Renter-Occupied | 96 (14.4%) | $61,250 |
| Average | 668 (100.0%) | $74,400 |
Occupancy by Householder Income Bracket in Point Roberts
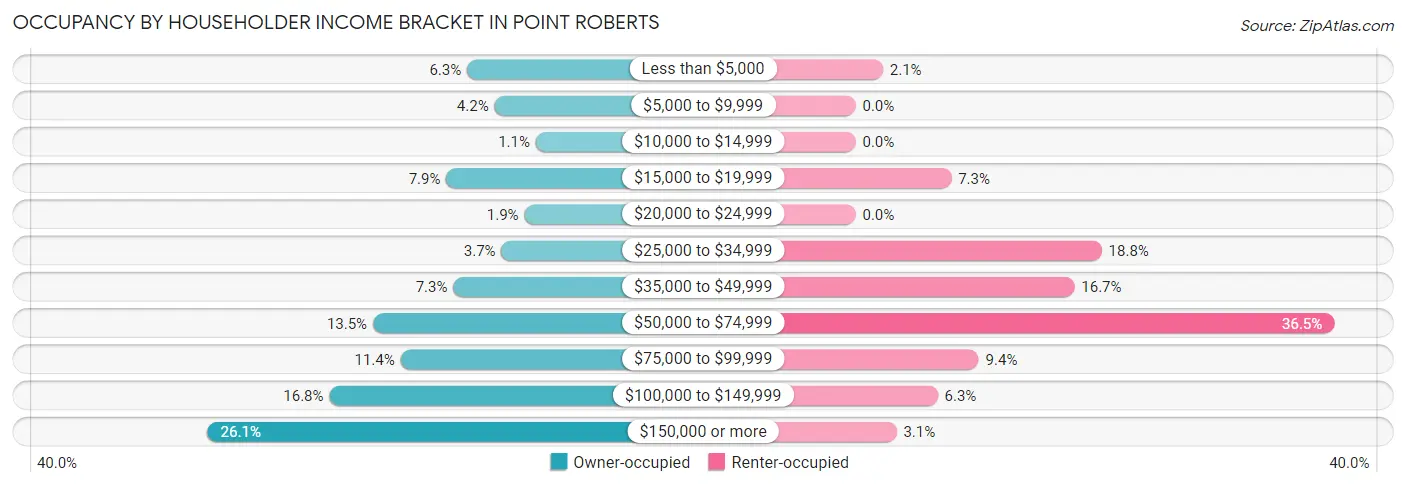
| Income Bracket | Owner-occupied | Renter-occupied |
| Less than $5,000 | 36 (6.3%) | 2 (2.1%) |
| $5,000 to $9,999 | 24 (4.2%) | 0 (0.0%) |
| $10,000 to $14,999 | 6 (1.1%) | 0 (0.0%) |
| $15,000 to $19,999 | 45 (7.9%) | 7 (7.3%) |
| $20,000 to $24,999 | 11 (1.9%) | 0 (0.0%) |
| $25,000 to $34,999 | 21 (3.7%) | 18 (18.8%) |
| $35,000 to $49,999 | 42 (7.3%) | 16 (16.7%) |
| $50,000 to $74,999 | 77 (13.5%) | 35 (36.5%) |
| $75,000 to $99,999 | 65 (11.4%) | 9 (9.4%) |
| $100,000 to $149,999 | 96 (16.8%) | 6 (6.2%) |
| $150,000 or more | 149 (26.1%) | 3 (3.1%) |
| Total | 572 (100.0%) | 96 (100.0%) |
Monthly Housing Cost Tiers in Point Roberts
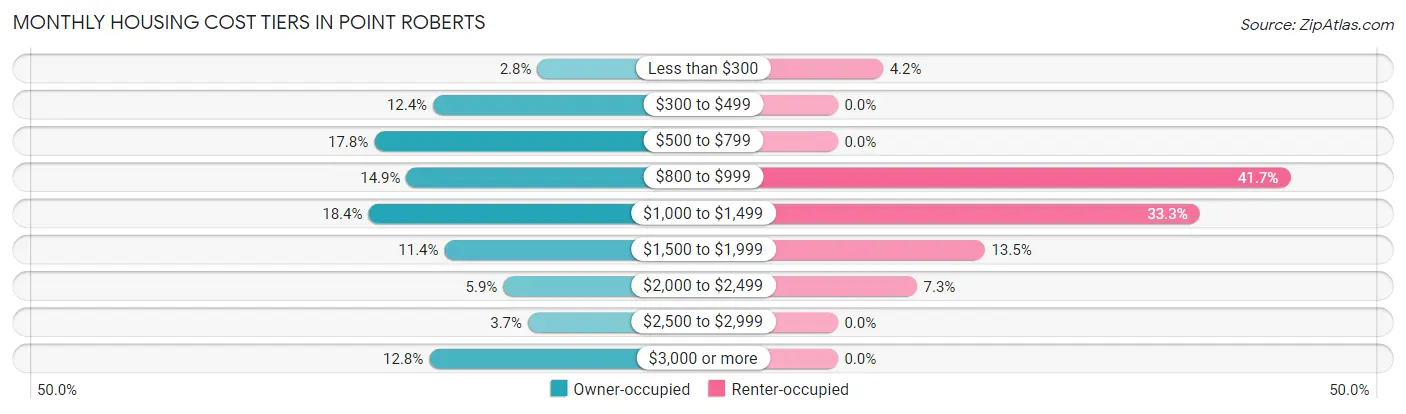
| Monthly Cost | Owner-occupied | Renter-occupied |
| Less than $300 | 16 (2.8%) | 4 (4.2%) |
| $300 to $499 | 71 (12.4%) | 0 (0.0%) |
| $500 to $799 | 102 (17.8%) | 0 (0.0%) |
| $800 to $999 | 85 (14.9%) | 40 (41.7%) |
| $1,000 to $1,499 | 105 (18.4%) | 32 (33.3%) |
| $1,500 to $1,999 | 65 (11.4%) | 13 (13.5%) |
| $2,000 to $2,499 | 34 (5.9%) | 7 (7.3%) |
| $2,500 to $2,999 | 21 (3.7%) | 0 (0.0%) |
| $3,000 or more | 73 (12.8%) | 0 (0.0%) |
| Total | 572 (100.0%) | 96 (100.0%) |
Physical Housing Characteristics in Point Roberts
Housing Structures in Point Roberts
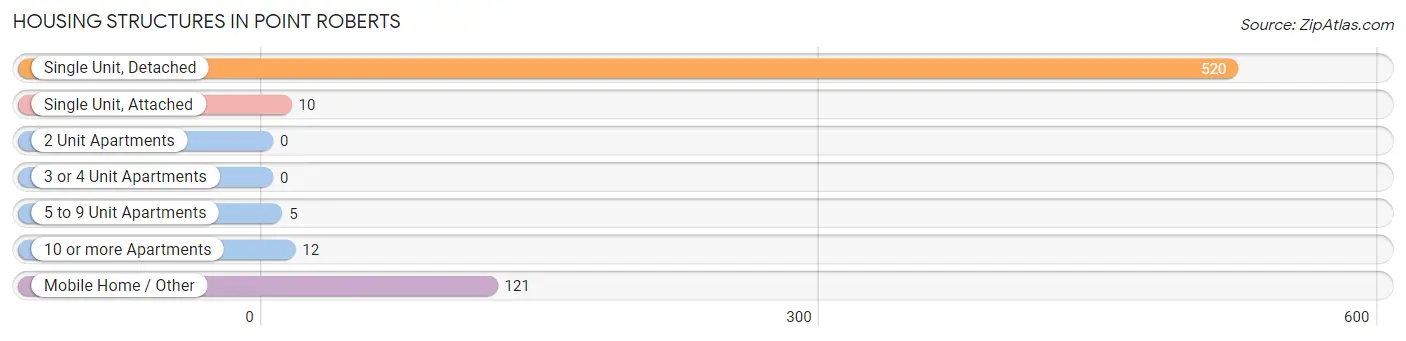
| Structure Type | # Housing Units | % Housing Units |
| Single Unit, Detached | 520 | 77.8% |
| Single Unit, Attached | 10 | 1.5% |
| 2 Unit Apartments | 0 | 0.0% |
| 3 or 4 Unit Apartments | 0 | 0.0% |
| 5 to 9 Unit Apartments | 5 | 0.7% |
| 10 or more Apartments | 12 | 1.8% |
| Mobile Home / Other | 121 | 18.1% |
| Total | 668 | 100.0% |
Housing Structures by Occupancy in Point Roberts
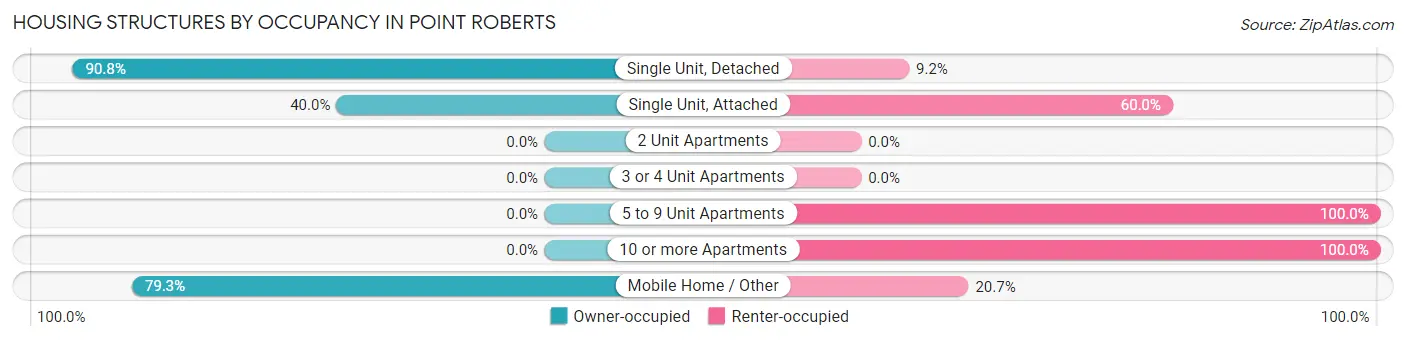
| Structure Type | Owner-occupied | Renter-occupied |
| Single Unit, Detached | 472 (90.8%) | 48 (9.2%) |
| Single Unit, Attached | 4 (40.0%) | 6 (60.0%) |
| 2 Unit Apartments | 0 (0.0%) | 0 (0.0%) |
| 3 or 4 Unit Apartments | 0 (0.0%) | 0 (0.0%) |
| 5 to 9 Unit Apartments | 0 (0.0%) | 5 (100.0%) |
| 10 or more Apartments | 0 (0.0%) | 12 (100.0%) |
| Mobile Home / Other | 96 (79.3%) | 25 (20.7%) |
| Total | 572 (85.6%) | 96 (14.4%) |
Housing Structures by Number of Rooms in Point Roberts
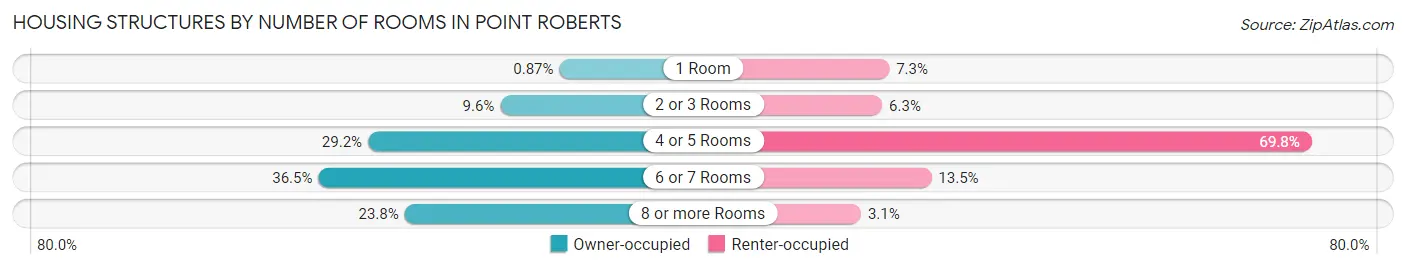
| Number of Rooms | Owner-occupied | Renter-occupied |
| 1 Room | 5 (0.9%) | 7 (7.3%) |
| 2 or 3 Rooms | 55 (9.6%) | 6 (6.2%) |
| 4 or 5 Rooms | 167 (29.2%) | 67 (69.8%) |
| 6 or 7 Rooms | 209 (36.5%) | 13 (13.5%) |
| 8 or more Rooms | 136 (23.8%) | 3 (3.1%) |
| Total | 572 (100.0%) | 96 (100.0%) |
Housing Structure by Heating Type in Point Roberts
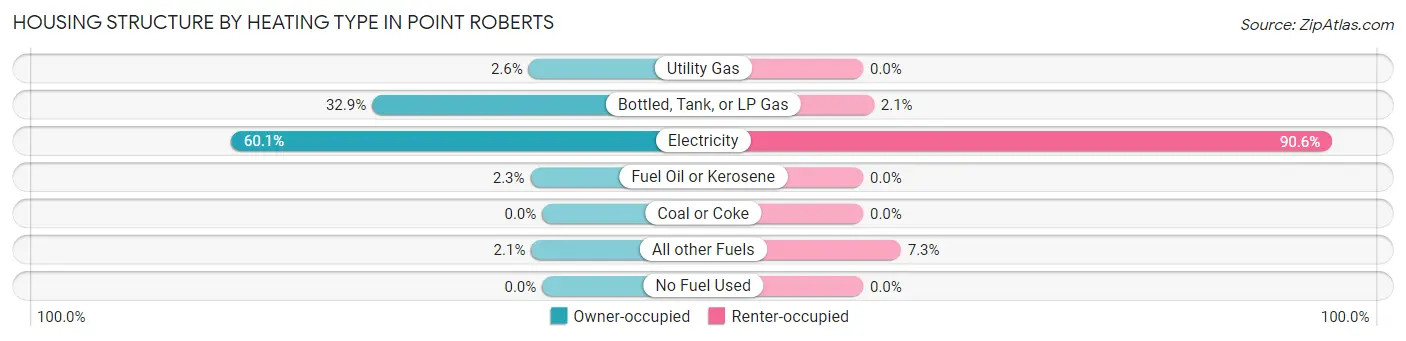
| Heating Type | Owner-occupied | Renter-occupied |
| Utility Gas | 15 (2.6%) | 0 (0.0%) |
| Bottled, Tank, or LP Gas | 188 (32.9%) | 2 (2.1%) |
| Electricity | 344 (60.1%) | 87 (90.6%) |
| Fuel Oil or Kerosene | 13 (2.3%) | 0 (0.0%) |
| Coal or Coke | 0 (0.0%) | 0 (0.0%) |
| All other Fuels | 12 (2.1%) | 7 (7.3%) |
| No Fuel Used | 0 (0.0%) | 0 (0.0%) |
| Total | 572 (100.0%) | 96 (100.0%) |
Household Vehicle Usage in Point Roberts
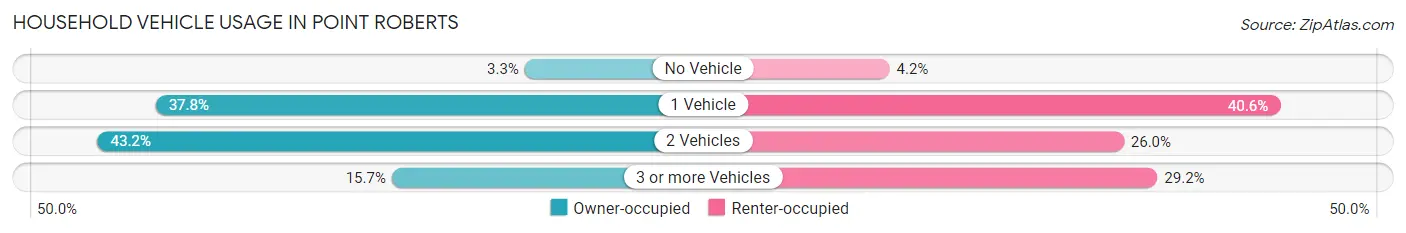
| Vehicles per Household | Owner-occupied | Renter-occupied |
| No Vehicle | 19 (3.3%) | 4 (4.2%) |
| 1 Vehicle | 216 (37.8%) | 39 (40.6%) |
| 2 Vehicles | 247 (43.2%) | 25 (26.0%) |
| 3 or more Vehicles | 90 (15.7%) | 28 (29.2%) |
| Total | 572 (100.0%) | 96 (100.0%) |
Real Estate & Mortgages in Point Roberts
Real Estate and Mortgage Overview in Point Roberts
| Characteristic | Without Mortgage | With Mortgage |
| Housing Units | 279 | 293 |
| Median Property Value | $469,700 | $312,700 |
| Median Household Income | $91,250 | $55 |
| Monthly Housing Costs | $650 | $56 |
| Real Estate Taxes | $2,931 | $22 |
Property Value by Mortgage Status in Point Roberts
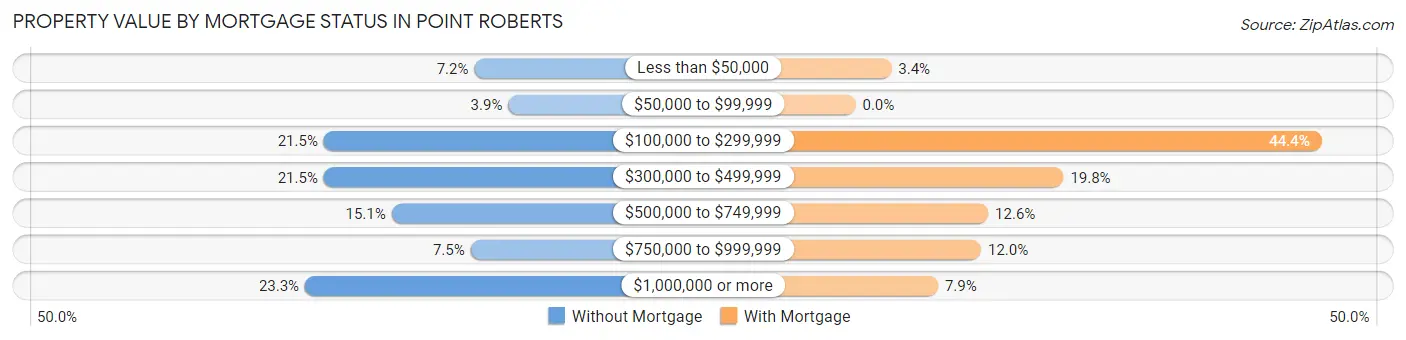
| Property Value | Without Mortgage | With Mortgage |
| Less than $50,000 | 20 (7.2%) | 10 (3.4%) |
| $50,000 to $99,999 | 11 (3.9%) | 0 (0.0%) |
| $100,000 to $299,999 | 60 (21.5%) | 130 (44.4%) |
| $300,000 to $499,999 | 60 (21.5%) | 58 (19.8%) |
| $500,000 to $749,999 | 42 (15.0%) | 37 (12.6%) |
| $750,000 to $999,999 | 21 (7.5%) | 35 (11.9%) |
| $1,000,000 or more | 65 (23.3%) | 23 (7.9%) |
| Total | 279 (100.0%) | 293 (100.0%) |
Household Income by Mortgage Status in Point Roberts
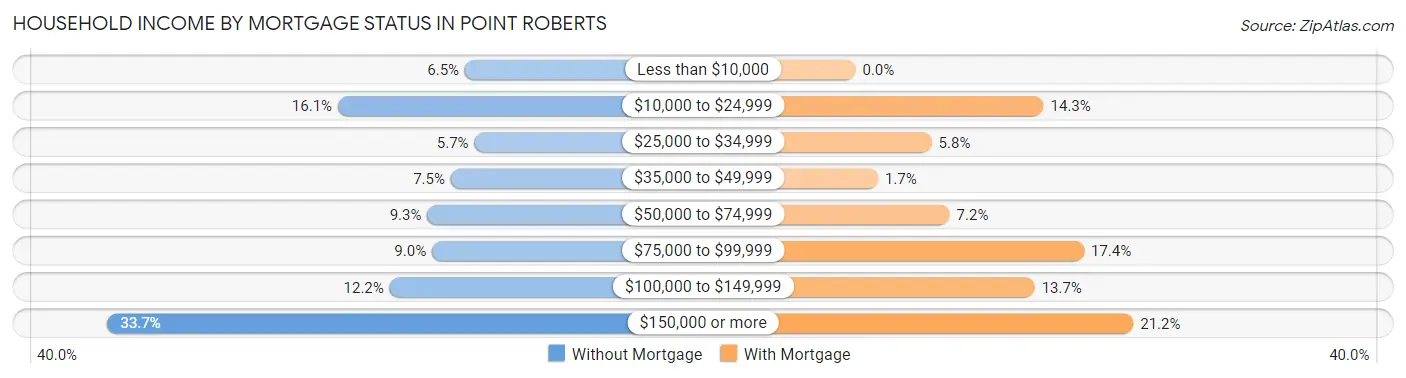
| Household Income | Without Mortgage | With Mortgage |
| Less than $10,000 | 18 (6.5%) | 0 (0.0%) |
| $10,000 to $24,999 | 45 (16.1%) | 42 (14.3%) |
| $25,000 to $34,999 | 16 (5.7%) | 17 (5.8%) |
| $35,000 to $49,999 | 21 (7.5%) | 5 (1.7%) |
| $50,000 to $74,999 | 26 (9.3%) | 21 (7.2%) |
| $75,000 to $99,999 | 25 (9.0%) | 51 (17.4%) |
| $100,000 to $149,999 | 34 (12.2%) | 40 (13.7%) |
| $150,000 or more | 94 (33.7%) | 62 (21.2%) |
| Total | 279 (100.0%) | 293 (100.0%) |
Property Value to Household Income Ratio in Point Roberts
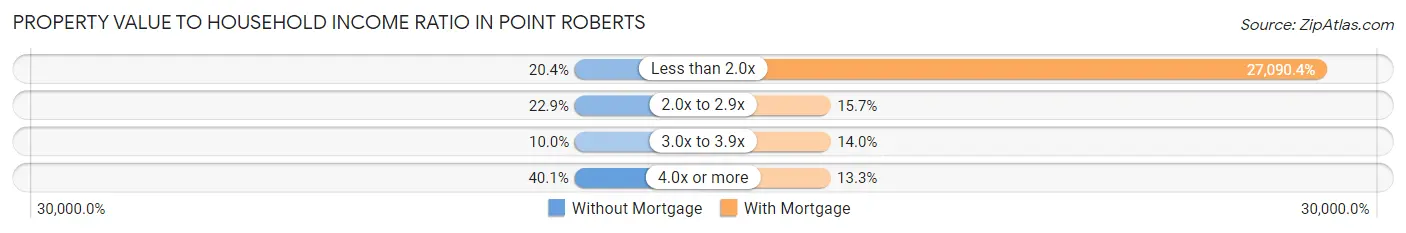
| Value-to-Income Ratio | Without Mortgage | With Mortgage |
| Less than 2.0x | 57 (20.4%) | 79,375 (27,090.4%) |
| 2.0x to 2.9x | 64 (22.9%) | 46 (15.7%) |
| 3.0x to 3.9x | 28 (10.0%) | 41 (14.0%) |
| 4.0x or more | 112 (40.1%) | 39 (13.3%) |
| Total | 279 (100.0%) | 293 (100.0%) |
Real Estate Taxes by Mortgage Status in Point Roberts
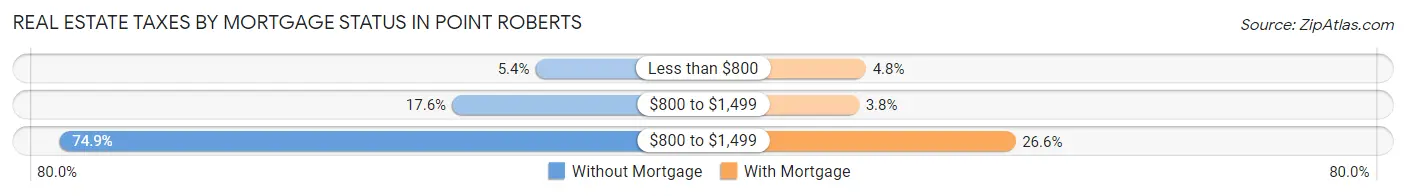
| Property Taxes | Without Mortgage | With Mortgage |
| Less than $800 | 15 (5.4%) | 14 (4.8%) |
| $800 to $1,499 | 49 (17.6%) | 11 (3.7%) |
| $800 to $1,499 | 209 (74.9%) | 78 (26.6%) |
| Total | 279 (100.0%) | 293 (100.0%) |
Health & Disability in Point Roberts
Health Insurance Coverage by Age in Point Roberts
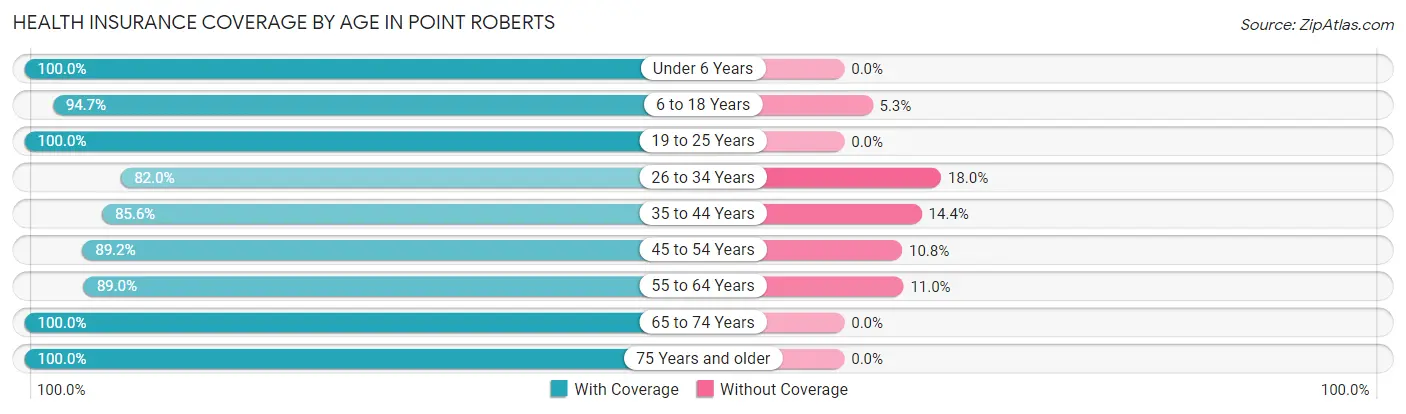
| Age Bracket | With Coverage | Without Coverage |
| Under 6 Years | 14 (100.0%) | 0 (0.0%) |
| 6 to 18 Years | 144 (94.7%) | 8 (5.3%) |
| 19 to 25 Years | 63 (100.0%) | 0 (0.0%) |
| 26 to 34 Years | 50 (82.0%) | 11 (18.0%) |
| 35 to 44 Years | 83 (85.6%) | 14 (14.4%) |
| 45 to 54 Years | 174 (89.2%) | 21 (10.8%) |
| 55 to 64 Years | 258 (89.0%) | 32 (11.0%) |
| 65 to 74 Years | 259 (100.0%) | 0 (0.0%) |
| 75 Years and older | 118 (100.0%) | 0 (0.0%) |
| Total | 1,163 (93.1%) | 86 (6.9%) |
Health Insurance Coverage by Citizenship Status in Point Roberts
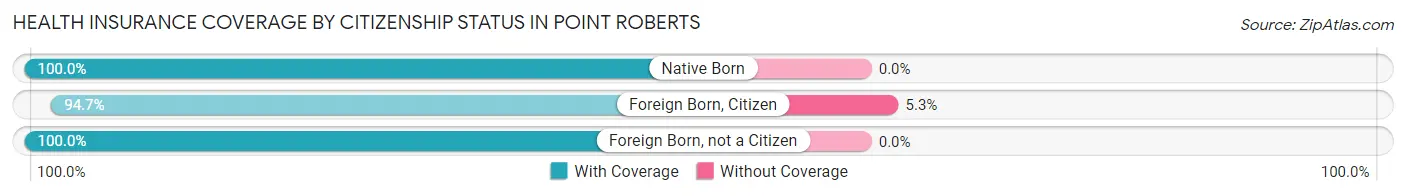
| Citizenship Status | With Coverage | Without Coverage |
| Native Born | 14 (100.0%) | 0 (0.0%) |
| Foreign Born, Citizen | 144 (94.7%) | 8 (5.3%) |
| Foreign Born, not a Citizen | 63 (100.0%) | 0 (0.0%) |
Health Insurance Coverage by Household Income in Point Roberts
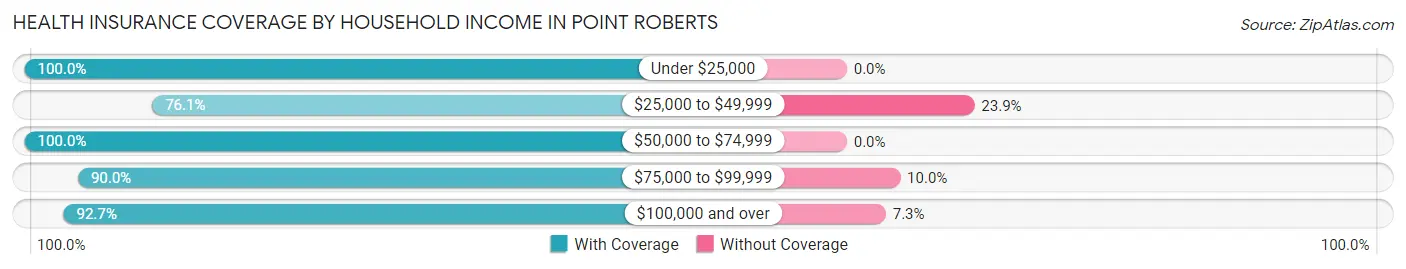
| Household Income | With Coverage | Without Coverage |
| Under $25,000 | 182 (100.0%) | 0 (0.0%) |
| $25,000 to $49,999 | 105 (76.1%) | 33 (23.9%) |
| $50,000 to $74,999 | 237 (100.0%) | 0 (0.0%) |
| $75,000 to $99,999 | 81 (90.0%) | 9 (10.0%) |
| $100,000 and over | 558 (92.7%) | 44 (7.3%) |
Public vs Private Health Insurance Coverage by Age in Point Roberts
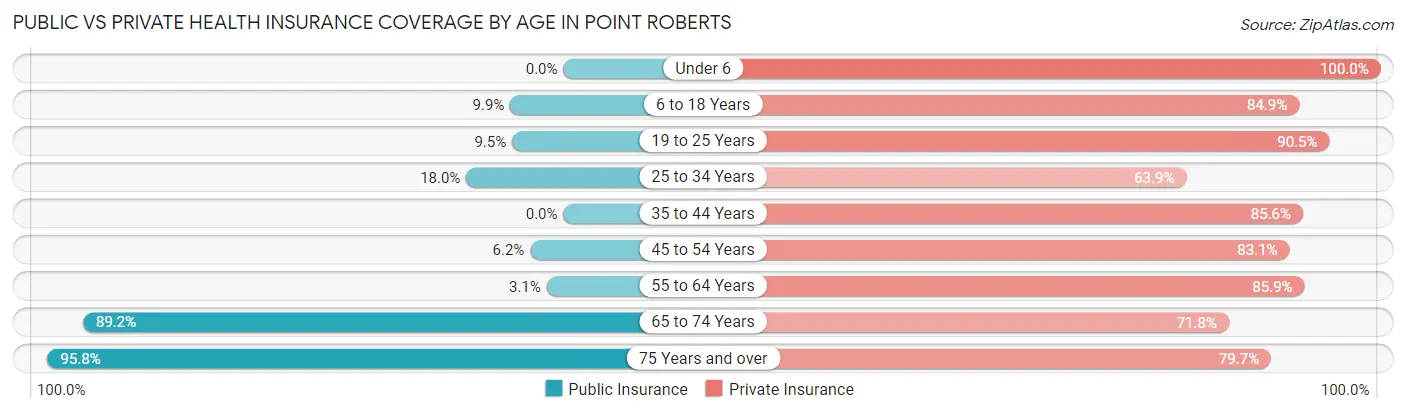
| Age Bracket | Public Insurance | Private Insurance |
| Under 6 | 0 (0.0%) | 14 (100.0%) |
| 6 to 18 Years | 15 (9.9%) | 129 (84.9%) |
| 19 to 25 Years | 6 (9.5%) | 57 (90.5%) |
| 25 to 34 Years | 11 (18.0%) | 39 (63.9%) |
| 35 to 44 Years | 0 (0.0%) | 83 (85.6%) |
| 45 to 54 Years | 12 (6.1%) | 162 (83.1%) |
| 55 to 64 Years | 9 (3.1%) | 249 (85.9%) |
| 65 to 74 Years | 231 (89.2%) | 186 (71.8%) |
| 75 Years and over | 113 (95.8%) | 94 (79.7%) |
| Total | 397 (31.8%) | 1,013 (81.1%) |
Disability Status by Sex by Age in Point Roberts
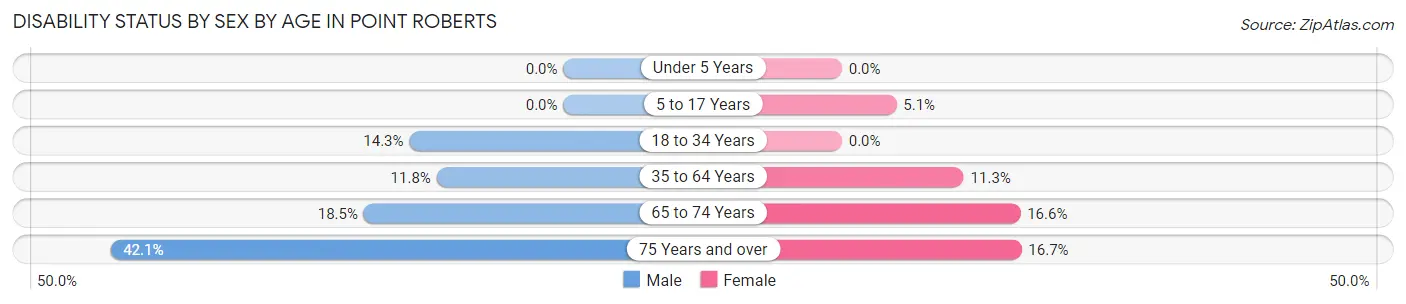
| Age Bracket | Male | Female |
| Under 5 Years | 0 (0.0%) | 0 (0.0%) |
| 5 to 17 Years | 0 (0.0%) | 4 (5.1%) |
| 18 to 34 Years | 11 (14.3%) | 0 (0.0%) |
| 35 to 64 Years | 30 (11.8%) | 37 (11.3%) |
| 65 to 74 Years | 20 (18.5%) | 25 (16.6%) |
| 75 Years and over | 37 (42.0%) | 5 (16.7%) |
Disability Class by Sex by Age in Point Roberts
Disability Class: Hearing Difficulty
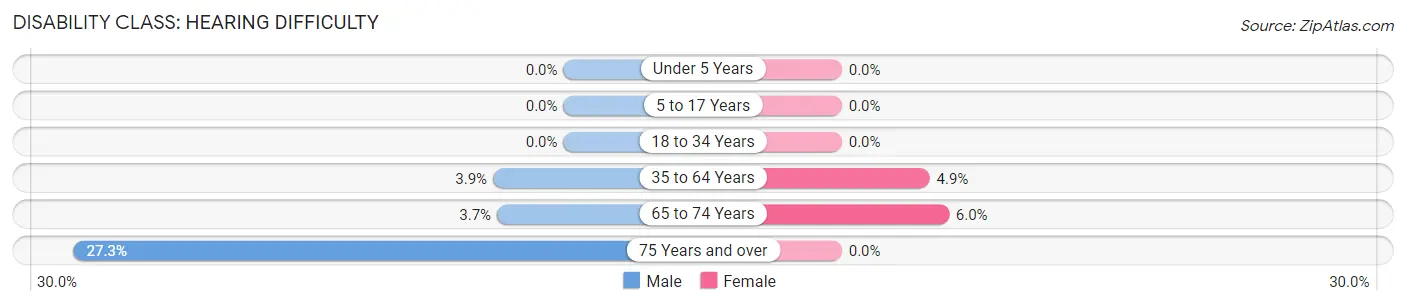
| Age Bracket | Male | Female |
| Under 5 Years | 0 (0.0%) | 0 (0.0%) |
| 5 to 17 Years | 0 (0.0%) | 0 (0.0%) |
| 18 to 34 Years | 0 (0.0%) | 0 (0.0%) |
| 35 to 64 Years | 10 (3.9%) | 16 (4.9%) |
| 65 to 74 Years | 4 (3.7%) | 9 (6.0%) |
| 75 Years and over | 24 (27.3%) | 0 (0.0%) |
Disability Class: Vision Difficulty
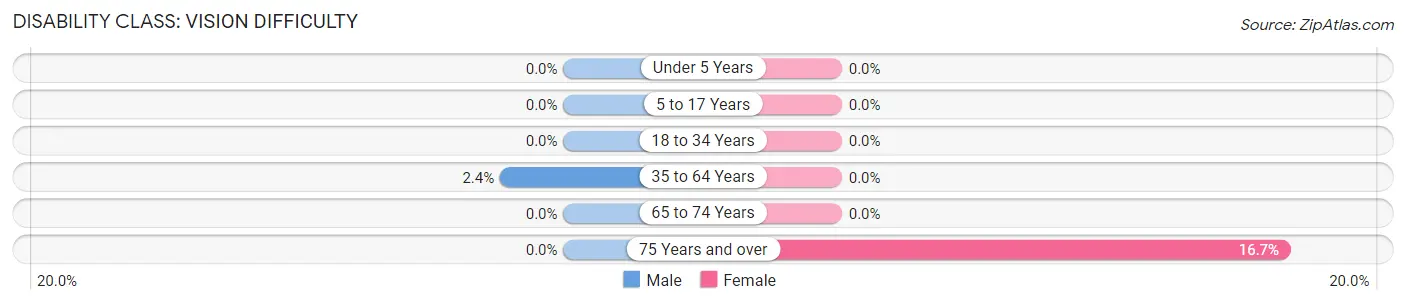
| Age Bracket | Male | Female |
| Under 5 Years | 0 (0.0%) | 0 (0.0%) |
| 5 to 17 Years | 0 (0.0%) | 0 (0.0%) |
| 18 to 34 Years | 0 (0.0%) | 0 (0.0%) |
| 35 to 64 Years | 6 (2.4%) | 0 (0.0%) |
| 65 to 74 Years | 0 (0.0%) | 0 (0.0%) |
| 75 Years and over | 0 (0.0%) | 5 (16.7%) |
Disability Class: Cognitive Difficulty
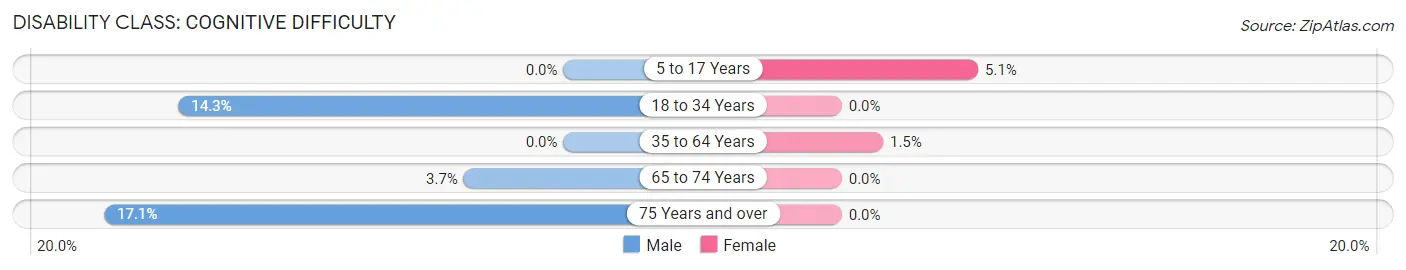
| Age Bracket | Male | Female |
| 5 to 17 Years | 0 (0.0%) | 4 (5.1%) |
| 18 to 34 Years | 11 (14.3%) | 0 (0.0%) |
| 35 to 64 Years | 0 (0.0%) | 5 (1.5%) |
| 65 to 74 Years | 4 (3.7%) | 0 (0.0%) |
| 75 Years and over | 15 (17.1%) | 0 (0.0%) |
Disability Class: Ambulatory Difficulty
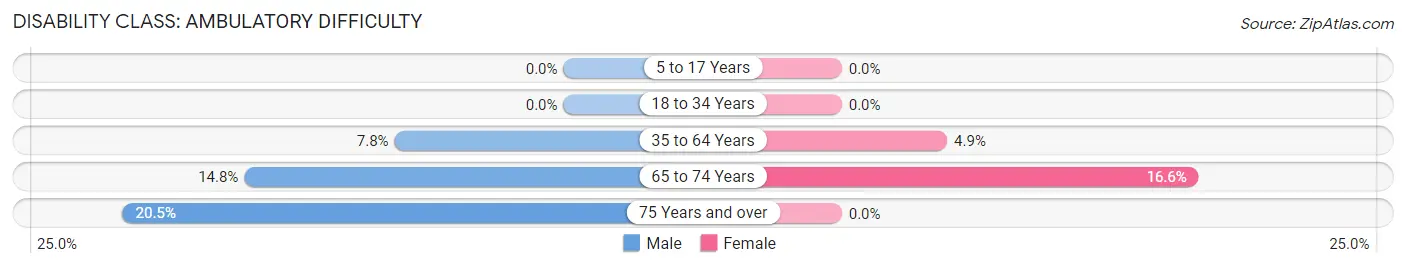
| Age Bracket | Male | Female |
| 5 to 17 Years | 0 (0.0%) | 0 (0.0%) |
| 18 to 34 Years | 0 (0.0%) | 0 (0.0%) |
| 35 to 64 Years | 20 (7.8%) | 16 (4.9%) |
| 65 to 74 Years | 16 (14.8%) | 25 (16.6%) |
| 75 Years and over | 18 (20.4%) | 0 (0.0%) |
Disability Class: Self-Care Difficulty
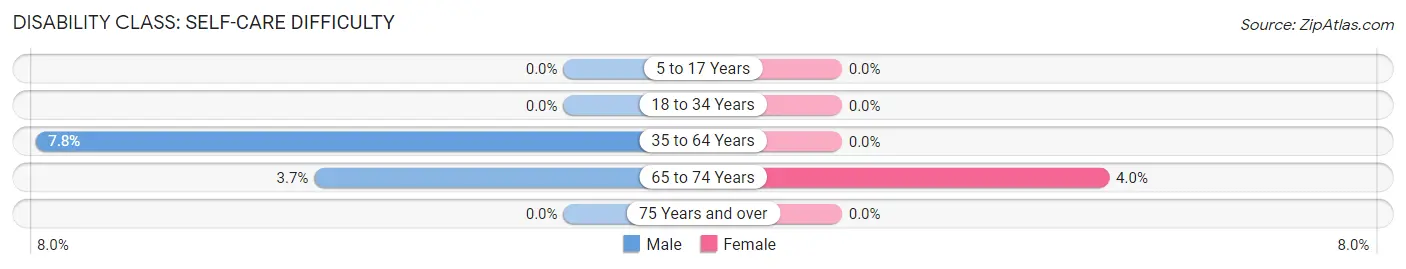
| Age Bracket | Male | Female |
| 5 to 17 Years | 0 (0.0%) | 0 (0.0%) |
| 18 to 34 Years | 0 (0.0%) | 0 (0.0%) |
| 35 to 64 Years | 20 (7.8%) | 0 (0.0%) |
| 65 to 74 Years | 4 (3.7%) | 6 (4.0%) |
| 75 Years and over | 0 (0.0%) | 0 (0.0%) |
Technology Access in Point Roberts
Computing Device Access in Point Roberts
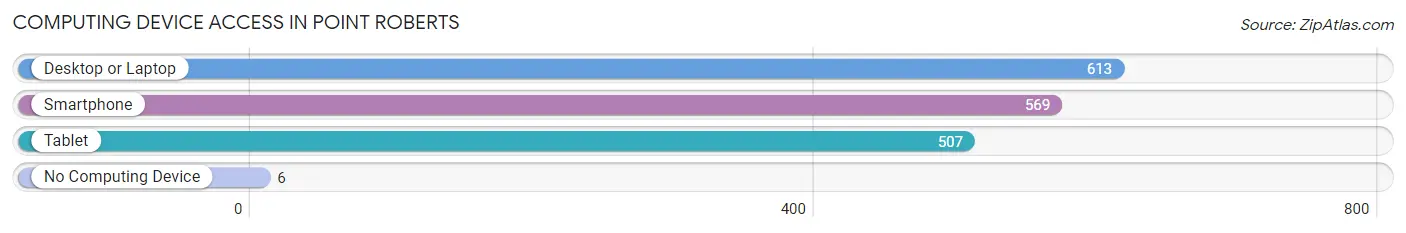
| Device Type | # Households | % Households |
| Desktop or Laptop | 613 | 91.8% |
| Smartphone | 569 | 85.2% |
| Tablet | 507 | 75.9% |
| No Computing Device | 6 | 0.9% |
| Total | 668 | 100.0% |
Internet Access in Point Roberts
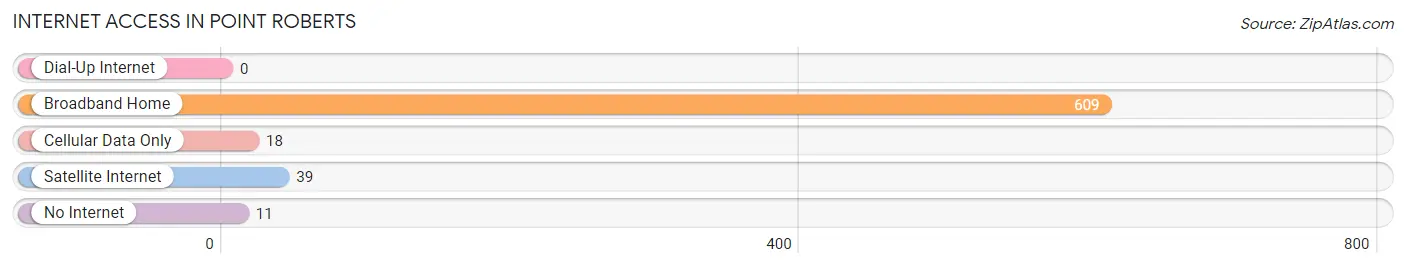
| Internet Type | # Households | % Households |
| Dial-Up Internet | 0 | 0.0% |
| Broadband Home | 609 | 91.2% |
| Cellular Data Only | 18 | 2.7% |
| Satellite Internet | 39 | 5.8% |
| No Internet | 11 | 1.7% |
| Total | 668 | 100.0% |
Point Roberts Summary
Point Roberts, WA is a small unincorporated community located in the northwest corner of Whatcom County, Washington, United States. It is located on the Tsawwassen Peninsula, which is the southernmost tip of mainland British Columbia, Canada. It is the only part of the United States that is not connected to the rest of the country by land, and is accessible only by land from Canada.
History
Point Roberts was first discovered by Europeans in 1792, when Spanish explorer Francisco de Eliza sailed into the area. He named the area “Punta de los Reyes”, or “Point of the Kings”. The area was later explored by the British in 1859, and was annexed by the United States in 1872.
In the late 19th century, Point Roberts was a popular destination for vacationers from Seattle and Vancouver. The area was also home to a number of fishing and logging camps.
In the early 20th century, Point Roberts was a popular destination for smugglers, who used the area to smuggle alcohol and other contraband into the United States. The area was also home to a number of bootleggers and rum-runners.
In the 1950s, Point Roberts began to develop as a residential community. The area was annexed by Whatcom County in 1957, and the first post office was established in 1959.
Geography
Point Roberts is located on the Tsawwassen Peninsula, which is the southernmost tip of mainland British Columbia, Canada. It is located on the Strait of Georgia, which separates the United States from Canada. The area is surrounded by water on three sides, and is accessible only by land from Canada.
The area is approximately 5.3 square miles in size, and is home to approximately 1,300 people. The area is mostly rural, with a few small businesses and a marina.
Economy
The economy of Point Roberts is largely based on tourism and fishing. The area is home to a number of small businesses, including restaurants, gift shops, and marinas. The area is also home to a number of recreational activities, including fishing, boating, and camping.
Demographics
As of the 2010 census, the population of Point Roberts was 1,314. The racial makeup of the area was 94.3% White, 0.8% Native American, 0.7% Asian, 0.2% Pacific Islander, 0.2% from other races, and 3.8% from two or more races. Hispanic or Latino of any race were 2.2% of the population.
The median income for a household in the area was $50,000, and the median income for a family was $54,375. The per capita income for the area was $25,945. About 8.3% of families and 10.2% of the population were below the poverty line, including 14.3% of those under age 18 and none of those age 65 or over.
Conclusion
Point Roberts, WA is a small unincorporated community located in the northwest corner of Whatcom County, Washington, United States. It is located on the Tsawwassen Peninsula, which is the southernmost tip of mainland British Columbia, Canada. It is the only part of the United States that is not connected to the rest of the country by land, and is accessible only by land from Canada. The area has a rich history, and is home to a variety of businesses and recreational activities. The area is also home to a diverse population, with a median income of $50,000.
Common Questions
What is Per Capita Income in Point Roberts?
Per Capita income in Point Roberts is $73,318.
What is the Median Family Income in Point Roberts?
Median Family Income in Point Roberts is $108,750.
What is the Median Household income in Point Roberts?
Median Household Income in Point Roberts is $74,400.
What is Income or Wage Gap in Point Roberts?
Income or Wage Gap in Point Roberts is 58.9%.
Women in Point Roberts earn 41.1 cents for every dollar earned by a man.
What is Inequality or Gini Index in Point Roberts?
Inequality or Gini Index in Point Roberts is 0.58.
What is the Total Population of Point Roberts?
Total Population of Point Roberts is 1,249.
What is the Total Male Population of Point Roberts?
Total Male Population of Point Roberts is 603.
What is the Total Female Population of Point Roberts?
Total Female Population of Point Roberts is 646.
What is the Ratio of Males per 100 Females in Point Roberts?
There are 93.34 Males per 100 Females in Point Roberts.
What is the Ratio of Females per 100 Males in Point Roberts?
There are 107.13 Females per 100 Males in Point Roberts.
What is the Median Population Age in Point Roberts?
Median Population Age in Point Roberts is 56.9 Years.
What is the Average Family Size in Point Roberts
Average Family Size in Point Roberts is 2.5 People.
What is the Average Household Size in Point Roberts
Average Household Size in Point Roberts is 1.9 People.
How Large is the Labor Force in Point Roberts?
There are 649 People in the Labor Forcein in Point Roberts.
What is the Percentage of People in the Labor Force in Point Roberts?
57.8% of People are in the Labor Force in Point Roberts.
What is the Unemployment Rate in Point Roberts?
Unemployment Rate in Point Roberts is 2.5%.