Sammamish, WA Map & Demographics
Sammamish Map
Sammamish Overview
$88,476
PER CAPITA INCOME
$232,188
AVG FAMILY INCOME
$215,047
AVG HOUSEHOLD INCOME
57.4%
WAGE / INCOME GAP [ % ]
42.6¢/ $1
WAGE / INCOME GAP [ $ ]
$11,392
FAMILY INCOME DEFICIT
0.39
INEQUALITY / GINI INDEX
66,586
TOTAL POPULATION
32,529
MALE POPULATION
34,057
FEMALE POPULATION
95.51
MALES / 100 FEMALES
104.70
FEMALES / 100 MALES
39.3
MEDIAN AGE
3.2
AVG FAMILY SIZE
3.0
AVG HOUSEHOLD SIZE
34,345
LABOR FORCE [ PEOPLE ]
69.2%
PERCENT IN LABOR FORCE
2.8%
UNEMPLOYMENT RATE
Income in Sammamish
Income Overview in Sammamish
Per Capita Income in Sammamish is $88,476, while median incomes of families and households are $232,188 and $215,047 respectively.
| Characteristic | Number | Measure |
| Per Capita Income | 66,586 | $88,476 |
| Median Family Income | 19,301 | $232,188 |
| Mean Family Income | 19,301 | $278,772 |
| Median Household Income | 22,258 | $215,047 |
| Mean Household Income | 22,258 | $261,753 |
| Income Deficit | 19,301 | $11,392 |
| Wage / Income Gap (%) | 66,586 | 57.36% |
| Wage / Income Gap ($) | 66,586 | 42.64¢ per $1 |
| Gini / Inequality Index | 66,586 | 0.39 |
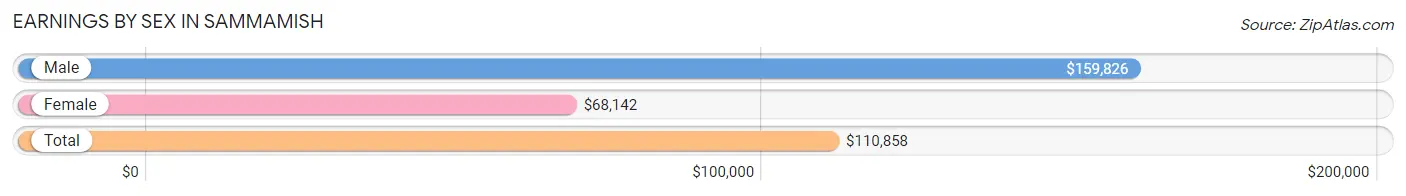
Earnings by Sex in Sammamish
Average Earnings in Sammamish are $110,858, $159,826 for men and $68,142 for women, a difference of 57.4%.
| Sex | Number | Average Earnings |
| Male | 20,660 (56.1%) | $159,826 |
| Female | 16,143 (43.9%) | $68,142 |
| Total | 36,803 (100.0%) | $110,858 |
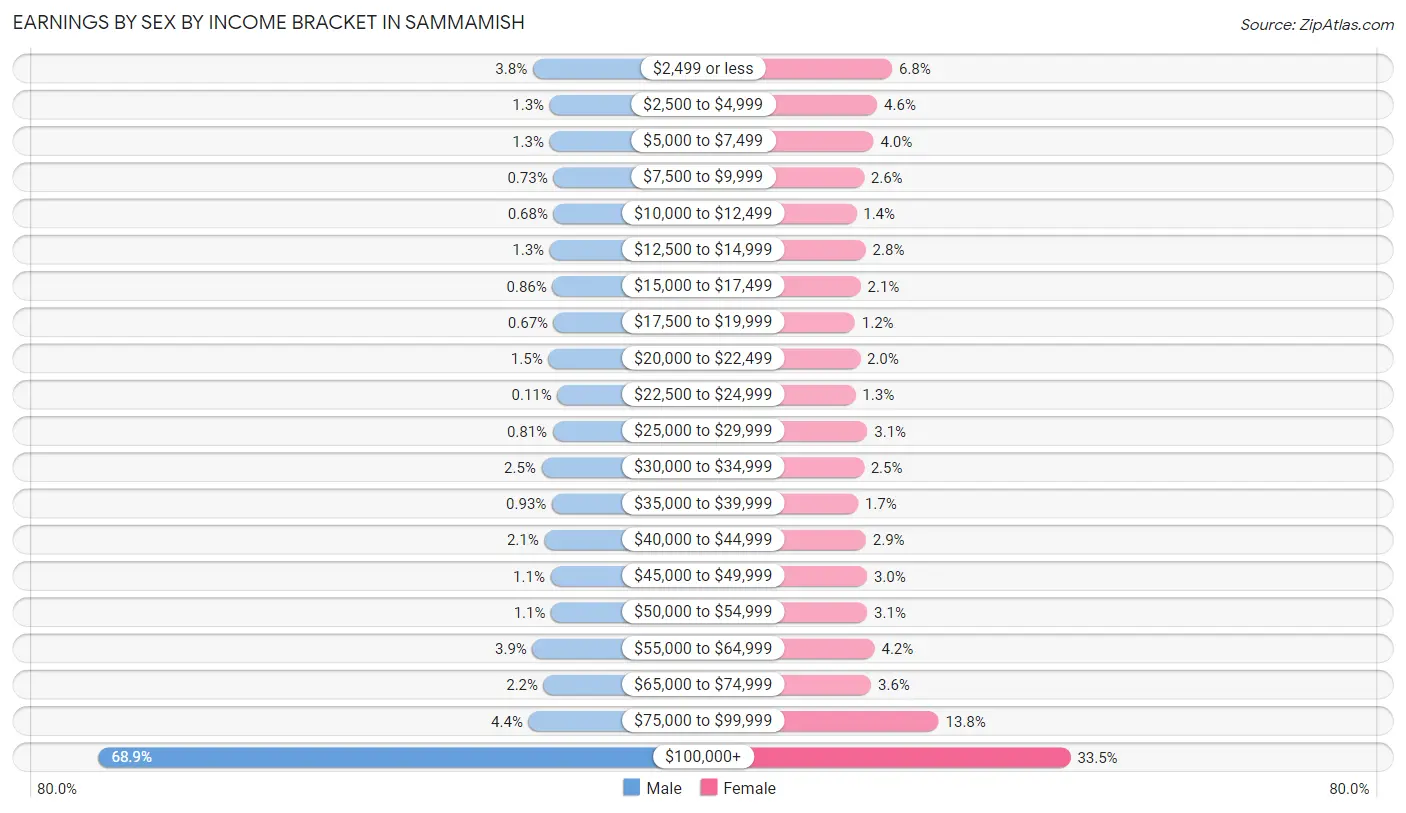
Earnings by Sex by Income Bracket in Sammamish
The most common earnings brackets in Sammamish are $100,000+ for men (14,236 | 68.9%) and $100,000+ for women (5,411 | 33.5%).
| Income | Male | Female |
| $2,499 or less | 785 (3.8%) | 1,095 (6.8%) |
| $2,500 to $4,999 | 260 (1.3%) | 734 (4.5%) |
| $5,000 to $7,499 | 264 (1.3%) | 648 (4.0%) |
| $7,500 to $9,999 | 151 (0.7%) | 412 (2.5%) |
| $10,000 to $12,499 | 140 (0.7%) | 230 (1.4%) |
| $12,500 to $14,999 | 261 (1.3%) | 457 (2.8%) |
| $15,000 to $17,499 | 178 (0.9%) | 334 (2.1%) |
| $17,500 to $19,999 | 138 (0.7%) | 196 (1.2%) |
| $20,000 to $22,499 | 305 (1.5%) | 320 (2.0%) |
| $22,500 to $24,999 | 22 (0.1%) | 209 (1.3%) |
| $25,000 to $29,999 | 167 (0.8%) | 498 (3.1%) |
| $30,000 to $34,999 | 516 (2.5%) | 409 (2.5%) |
| $35,000 to $39,999 | 193 (0.9%) | 270 (1.7%) |
| $40,000 to $44,999 | 428 (2.1%) | 461 (2.9%) |
| $45,000 to $49,999 | 235 (1.1%) | 487 (3.0%) |
| $50,000 to $54,999 | 220 (1.1%) | 492 (3.0%) |
| $55,000 to $64,999 | 796 (3.8%) | 672 (4.2%) |
| $65,000 to $74,999 | 448 (2.2%) | 587 (3.6%) |
| $75,000 to $99,999 | 917 (4.4%) | 2,221 (13.8%) |
| $100,000+ | 14,236 (68.9%) | 5,411 (33.5%) |
| Total | 20,660 (100.0%) | 16,143 (100.0%) |
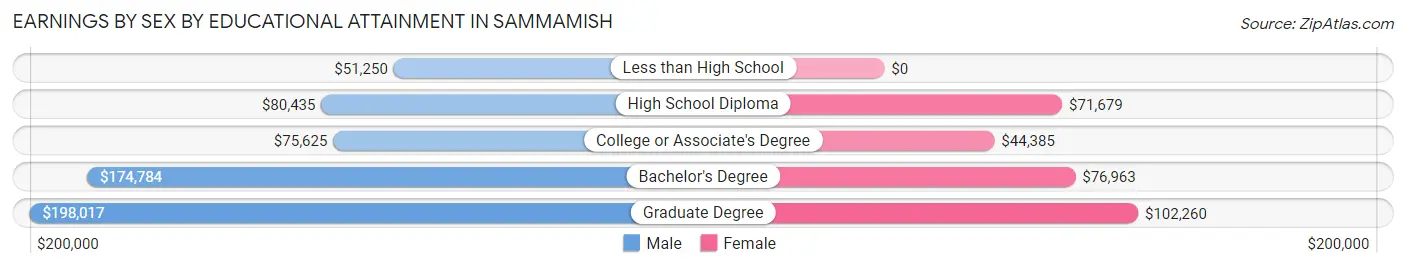
Earnings by Sex by Educational Attainment in Sammamish
Average earnings in Sammamish are $171,456 for men and $78,950 for women, a difference of 53.9%. Men with an educational attainment of graduate degree enjoy the highest average annual earnings of $198,017, while those with less than high school education earn the least with $51,250. Women with an educational attainment of graduate degree earn the most with the average annual earnings of $102,260, while those with college or associate's degree education have the smallest earnings of $44,385.
| Educational Attainment | Male Income | Female Income |
| Less than High School | $51,250 | $0 |
| High School Diploma | $80,435 | $71,679 |
| College or Associate's Degree | $75,625 | $44,385 |
| Bachelor's Degree | $174,784 | $76,963 |
| Graduate Degree | $198,017 | $102,260 |
| Total | $171,456 | $78,950 |
Family Income in Sammamish
Family Income Brackets in Sammamish
According to the Sammamish family income data, there are 11,330 families falling into the $200,000+ income range, which is the most common income bracket and makes up 58.7% of all families. Conversely, the $25,000 to $34,999 income bracket is the least frequent group with only 58 families (0.3%) belonging to this category.
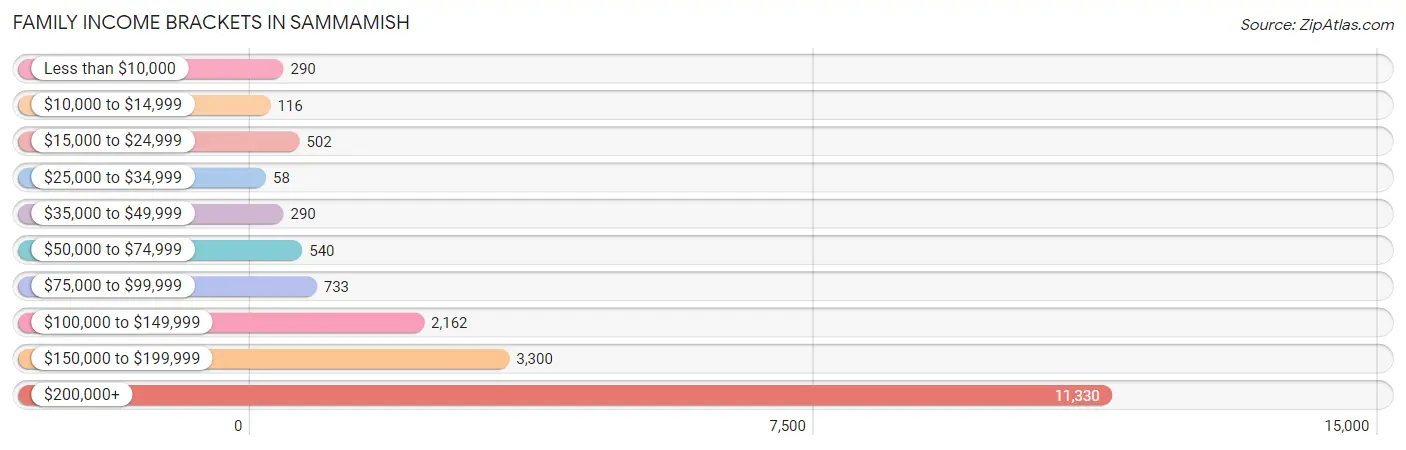
| Income Bracket | # Families | % Families |
| Less than $10,000 | 290 | 1.5% |
| $10,000 to $14,999 | 116 | 0.6% |
| $15,000 to $24,999 | 502 | 2.6% |
| $25,000 to $34,999 | 58 | 0.3% |
| $35,000 to $49,999 | 290 | 1.5% |
| $50,000 to $74,999 | 540 | 2.8% |
| $75,000 to $99,999 | 733 | 3.8% |
| $100,000 to $149,999 | 2,162 | 11.2% |
| $150,000 to $199,999 | 3,300 | 17.1% |
| $200,000+ | 11,330 | 58.7% |
Family Income by Famaliy Size in Sammamish
4-person families (5,780 | 29.9%) account for the highest median family income in Sammamish with $250,001 per family, while 2-person families (6,166 | 32.0%) have the highest median income of $86,317 per family member.
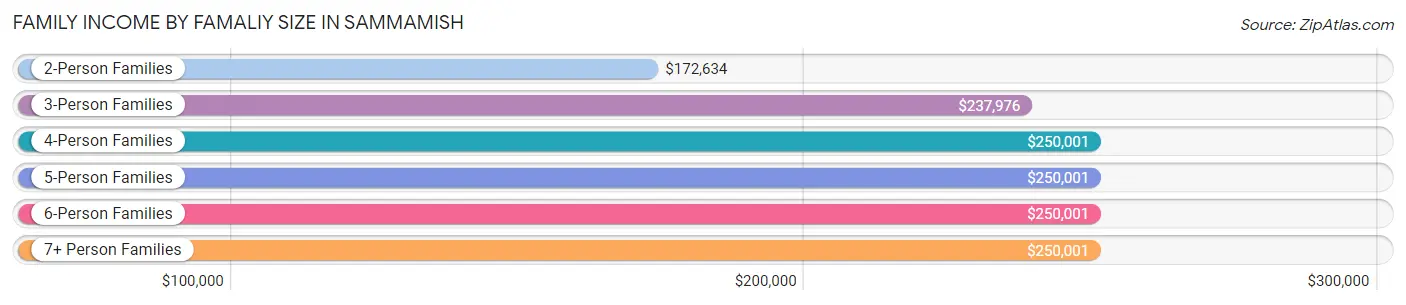
| Income Bracket | # Families | Median Income |
| 2-Person Families | 6,166 (32.0%) | $172,634 |
| 3-Person Families | 5,122 (26.5%) | $237,976 |
| 4-Person Families | 5,780 (29.9%) | $250,001 |
| 5-Person Families | 1,830 (9.5%) | $250,001 |
| 6-Person Families | 348 (1.8%) | $250,001 |
| 7+ Person Families | 55 (0.3%) | $250,001 |
| Total | 19,301 (100.0%) | $232,188 |
Family Income by Number of Earners in Sammamish
The median family income in Sammamish is $232,188, with families comprising 2 earners (9,586) having the highest median family income of $250,001, while families with no earners (1,279) have the lowest median family income of $91,250, accounting for 49.7% and 6.6% of families, respectively.
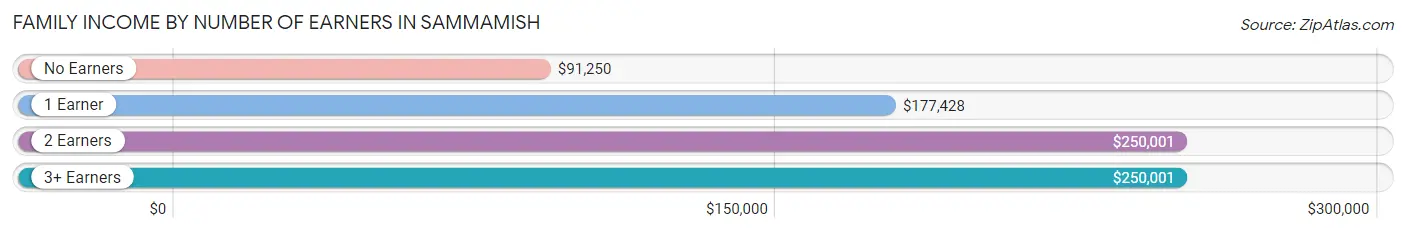
| Number of Earners | # Families | Median Income |
| No Earners | 1,279 (6.6%) | $91,250 |
| 1 Earner | 6,205 (32.2%) | $177,428 |
| 2 Earners | 9,586 (49.7%) | $250,001 |
| 3+ Earners | 2,231 (11.6%) | $250,001 |
| Total | 19,301 (100.0%) | $232,188 |
Household Income in Sammamish
Household Income Brackets in Sammamish
With 12,019 households falling in the category, the $200,000+ income range is the most frequent in Sammamish, accounting for 54.0% of all households. In contrast, only 134 households (0.6%) fall into the $10,000 to $14,999 income bracket, making it the least populous group.
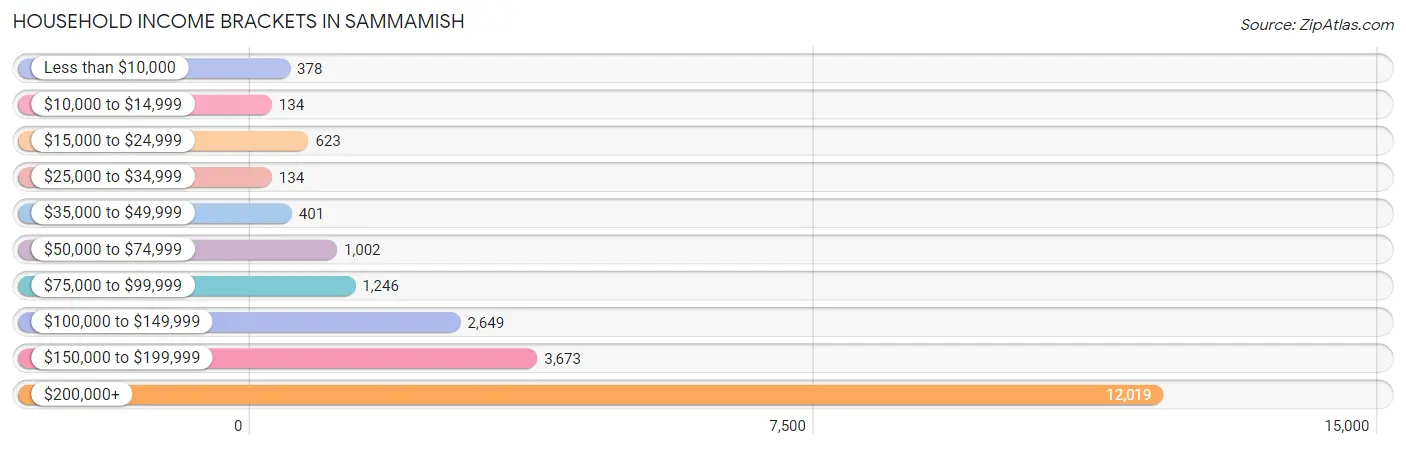
| Income Bracket | # Households | % Households |
| Less than $10,000 | 378 | 1.7% |
| $10,000 to $14,999 | 134 | 0.6% |
| $15,000 to $24,999 | 623 | 2.8% |
| $25,000 to $34,999 | 134 | 0.6% |
| $35,000 to $49,999 | 401 | 1.8% |
| $50,000 to $74,999 | 1,002 | 4.5% |
| $75,000 to $99,999 | 1,246 | 5.6% |
| $100,000 to $149,999 | 2,649 | 11.9% |
| $150,000 to $199,999 | 3,673 | 16.5% |
| $200,000+ | 12,019 | 54.0% |
Household Income by Householder Age in Sammamish
The median household income in Sammamish is $215,047, with the highest median household income of $245,174 found in the 25 to 44 years age bracket for the primary householder. A total of 8,458 households (38.0%) fall into this category. Meanwhile, the 15 to 24 years age bracket for the primary householder has the lowest median household income of $90,787, with 191 households (0.9%) in this group.
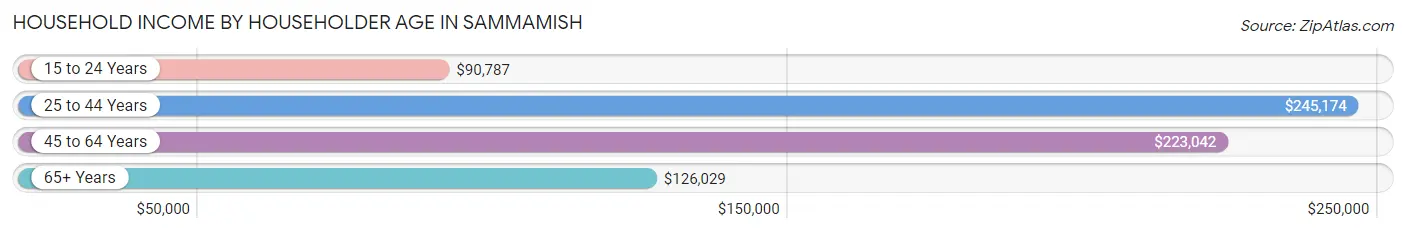
| Income Bracket | # Households | Median Income |
| 15 to 24 Years | 191 (0.9%) | $90,787 |
| 25 to 44 Years | 8,458 (38.0%) | $245,174 |
| 45 to 64 Years | 10,789 (48.5%) | $223,042 |
| 65+ Years | 2,820 (12.7%) | $126,029 |
| Total | 22,258 (100.0%) | $215,047 |
Poverty in Sammamish
Income Below Poverty by Sex and Age in Sammamish
With 3.5% poverty level for males and 4.7% for females among the residents of Sammamish, 5 year old males and 25 to 34 year old females are the most vulnerable to poverty, with 75 males (12.4%) and 429 females (13.9%) in their respective age groups living below the poverty level.
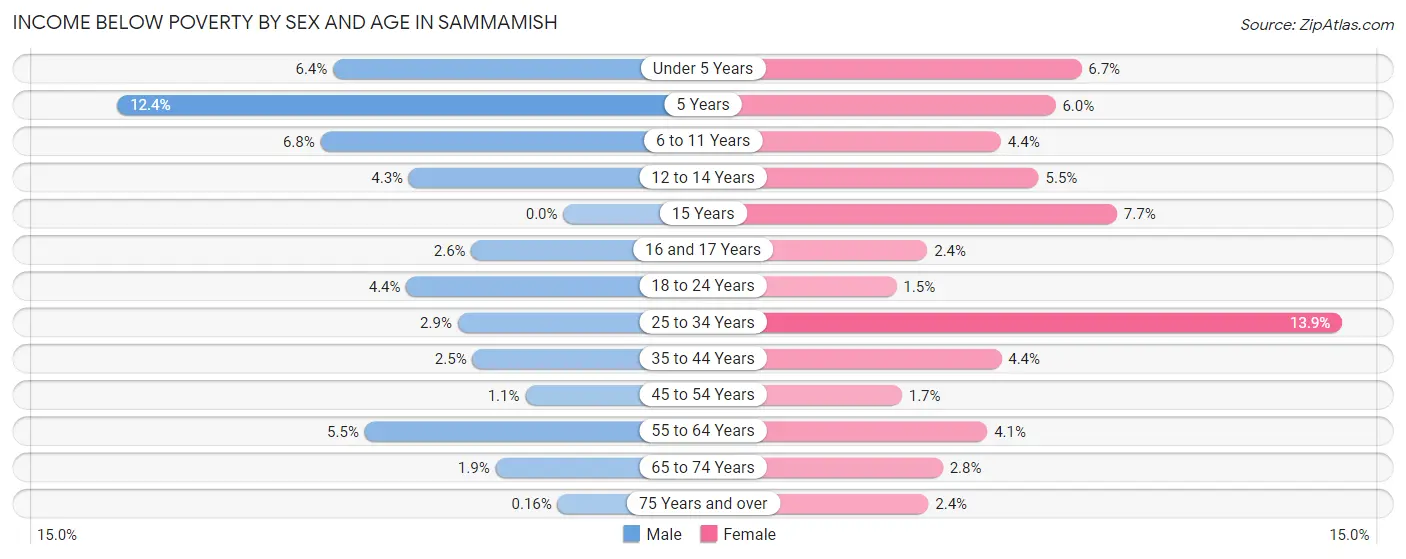
| Age Bracket | Male | Female |
| Under 5 Years | 116 (6.4%) | 150 (6.7%) |
| 5 Years | 75 (12.4%) | 22 (5.9%) |
| 6 to 11 Years | 220 (6.8%) | 142 (4.4%) |
| 12 to 14 Years | 74 (4.3%) | 118 (5.5%) |
| 15 Years | 0 (0.0%) | 63 (7.7%) |
| 16 and 17 Years | 29 (2.6%) | 36 (2.4%) |
| 18 to 24 Years | 85 (4.4%) | 23 (1.5%) |
| 25 to 34 Years | 70 (2.9%) | 429 (13.9%) |
| 35 to 44 Years | 154 (2.5%) | 274 (4.4%) |
| 45 to 54 Years | 67 (1.1%) | 106 (1.7%) |
| 55 to 64 Years | 220 (5.5%) | 146 (4.1%) |
| 65 to 74 Years | 37 (1.9%) | 56 (2.8%) |
| 75 Years and over | 1 (0.2%) | 23 (2.4%) |
| Total | 1,148 (3.5%) | 1,588 (4.7%) |
Income Above Poverty by Sex and Age in Sammamish
According to the poverty statistics in Sammamish, males aged 15 years and females aged 18 to 24 years are the age groups that are most secure financially, with 100.0% of males and 98.5% of females in these age groups living above the poverty line.
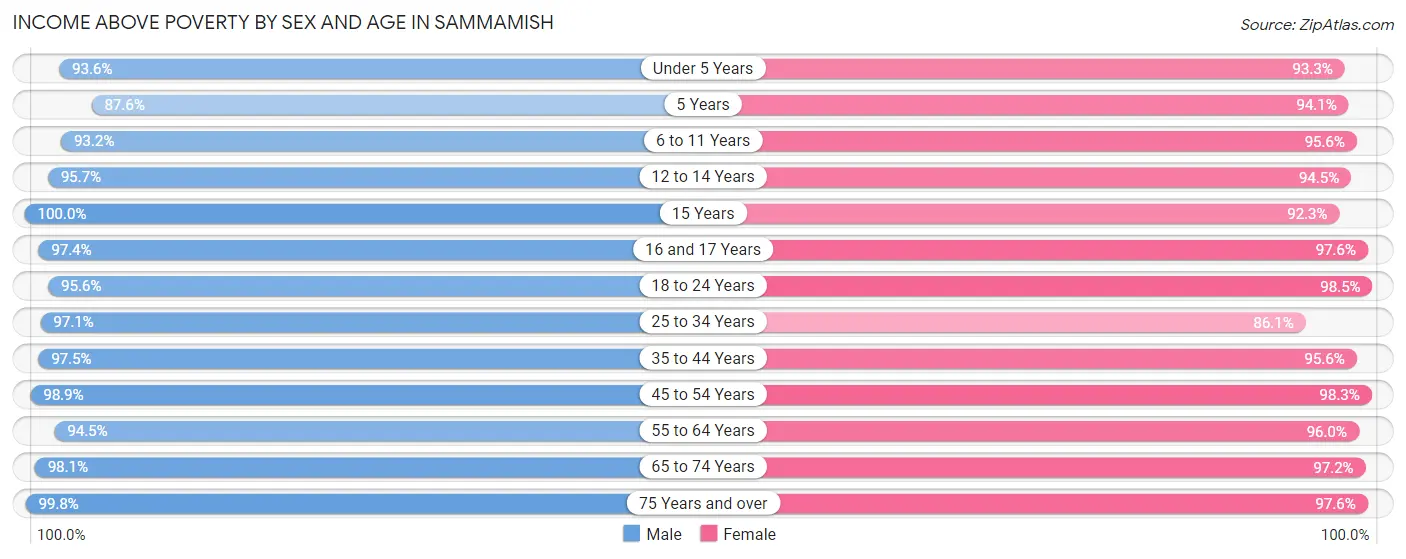
| Age Bracket | Male | Female |
| Under 5 Years | 1,695 (93.6%) | 2,098 (93.3%) |
| 5 Years | 529 (87.6%) | 348 (94.1%) |
| 6 to 11 Years | 3,036 (93.2%) | 3,063 (95.6%) |
| 12 to 14 Years | 1,646 (95.7%) | 2,035 (94.5%) |
| 15 Years | 691 (100.0%) | 759 (92.3%) |
| 16 and 17 Years | 1,106 (97.4%) | 1,476 (97.6%) |
| 18 to 24 Years | 1,861 (95.6%) | 1,493 (98.5%) |
| 25 to 34 Years | 2,310 (97.1%) | 2,650 (86.1%) |
| 35 to 44 Years | 5,943 (97.5%) | 5,900 (95.6%) |
| 45 to 54 Years | 6,255 (98.9%) | 6,241 (98.3%) |
| 55 to 64 Years | 3,757 (94.5%) | 3,462 (96.0%) |
| 65 to 74 Years | 1,919 (98.1%) | 1,936 (97.2%) |
| 75 Years and over | 633 (99.8%) | 933 (97.6%) |
| Total | 31,381 (96.5%) | 32,394 (95.3%) |
Income Below Poverty Among Married-Couple Families in Sammamish
The poverty statistics for married-couple families in Sammamish show that 1.8% or 307 of the total 17,325 families live below the poverty line. Families with 3 or 4 children have the highest poverty rate of 8.2%, comprising of 109 families. On the other hand, families with 5 or more children have the lowest poverty rate of 0.0%, which includes 0 families.
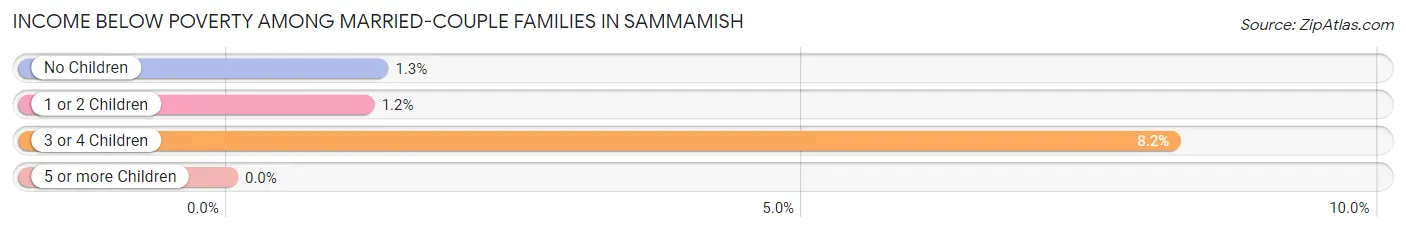
| Children | Above Poverty | Below Poverty |
| No Children | 6,786 (98.7%) | 90 (1.3%) |
| 1 or 2 Children | 8,986 (98.8%) | 108 (1.2%) |
| 3 or 4 Children | 1,219 (91.8%) | 109 (8.2%) |
| 5 or more Children | 27 (100.0%) | 0 (0.0%) |
| Total | 17,018 (98.2%) | 307 (1.8%) |
Income Below Poverty Among Single-Parent Households in Sammamish
According to the poverty data in Sammamish, 19.3% or 118 single-father households and 32.6% or 444 single-mother households are living below the poverty line. Among single-father households, those with 3 or 4 children have the highest poverty rate, with 14 households (32.6%) experiencing poverty. Likewise, among single-mother households, those with 5 or more children have the highest poverty rate, with 14 households (100.0%) falling below the poverty line.
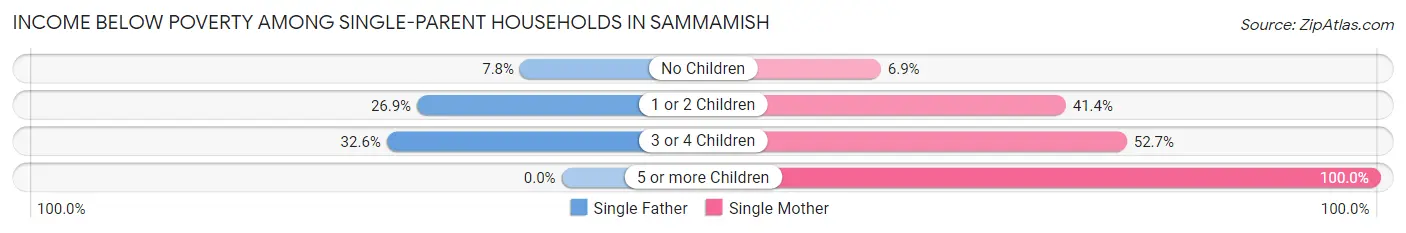
| Children | Single Father | Single Mother |
| No Children | 20 (7.7%) | 27 (6.9%) |
| 1 or 2 Children | 84 (26.9%) | 374 (41.4%) |
| 3 or 4 Children | 14 (32.6%) | 29 (52.7%) |
| 5 or more Children | 0 (0.0%) | 14 (100.0%) |
| Total | 118 (19.3%) | 444 (32.6%) |
Income Below Poverty Among Married-Couple vs Single-Parent Households in Sammamish
The poverty data for Sammamish shows that 307 of the married-couple family households (1.8%) and 562 of the single-parent households (28.4%) are living below the poverty level. Within the married-couple family households, those with 3 or 4 children have the highest poverty rate, with 109 households (8.2%) falling below the poverty line. Among the single-parent households, those with 5 or more children have the highest poverty rate, with 14 household (100.0%) living below poverty.
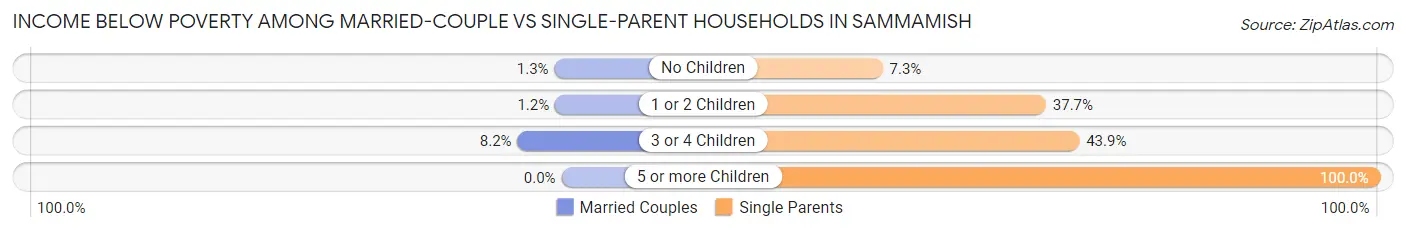
| Children | Married-Couple Families | Single-Parent Households |
| No Children | 90 (1.3%) | 47 (7.2%) |
| 1 or 2 Children | 108 (1.2%) | 458 (37.7%) |
| 3 or 4 Children | 109 (8.2%) | 43 (43.9%) |
| 5 or more Children | 0 (0.0%) | 14 (100.0%) |
| Total | 307 (1.8%) | 562 (28.4%) |
Race in Sammamish
The most populous races in Sammamish are White / Caucasian (36,771 | 55.2%), Asian (23,827 | 35.8%), and Two or more Races (4,324 | 6.5%).
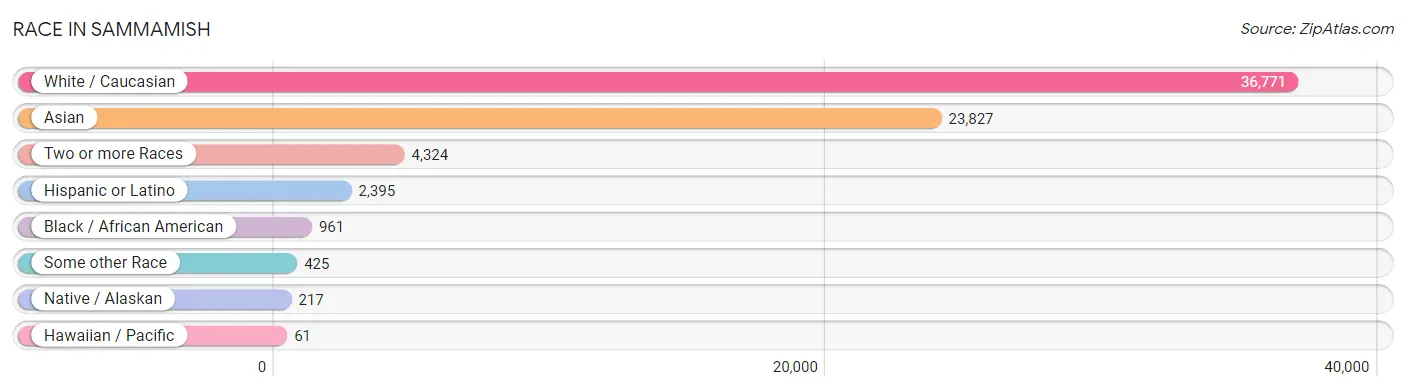
| Race | # Population | % Population |
| Asian | 23,827 | 35.8% |
| Black / African American | 961 | 1.4% |
| Hawaiian / Pacific | 61 | 0.1% |
| Hispanic or Latino | 2,395 | 3.6% |
| Native / Alaskan | 217 | 0.3% |
| White / Caucasian | 36,771 | 55.2% |
| Two or more Races | 4,324 | 6.5% |
| Some other Race | 425 | 0.6% |
| Total | 66,586 | 100.0% |
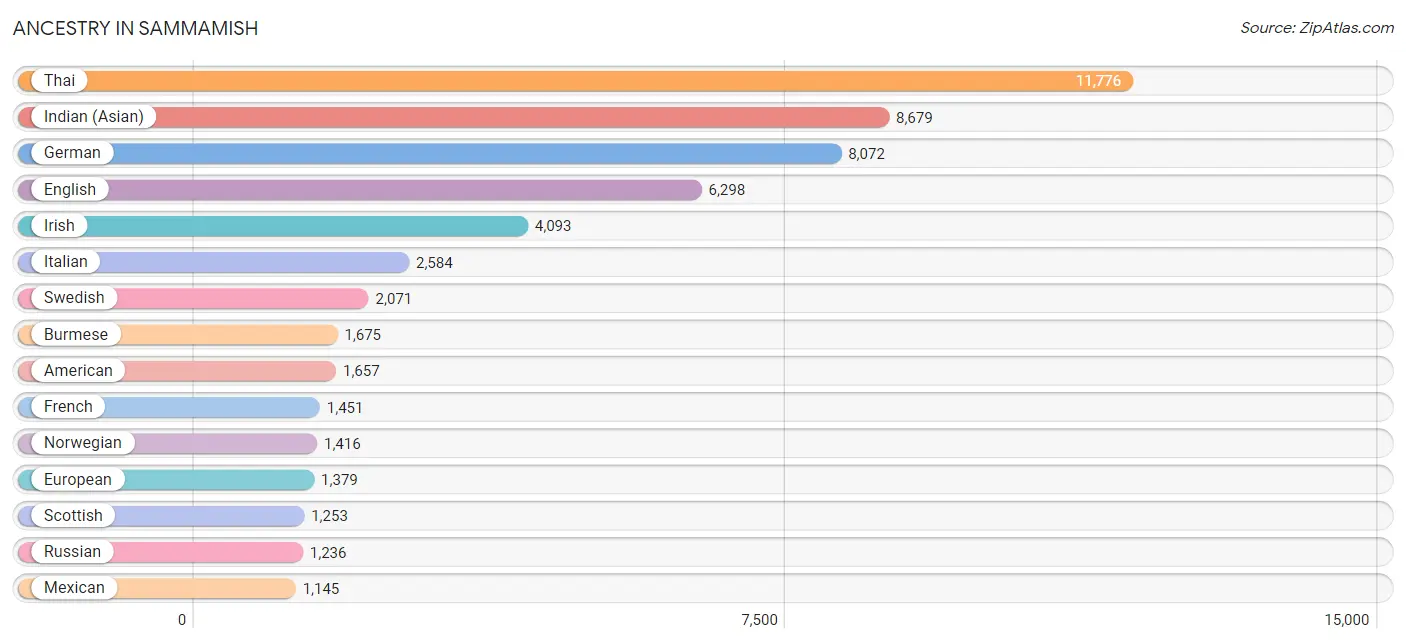
Ancestry in Sammamish
The most populous ancestries reported in Sammamish are Thai (11,776 | 17.7%), Indian (Asian) (8,679 | 13.0%), German (8,072 | 12.1%), English (6,298 | 9.5%), and Irish (4,093 | 6.1%), together accounting for 58.5% of all Sammamish residents.
| Ancestry | # Population | % Population |
| Afghan | 190 | 0.3% |
| African | 141 | 0.2% |
| Albanian | 2 | 0.0% |
| American | 1,657 | 2.5% |
| Apache | 12 | 0.0% |
| Arab | 811 | 1.2% |
| Argentinean | 18 | 0.0% |
| Australian | 18 | 0.0% |
| Austrian | 211 | 0.3% |
| Basque | 61 | 0.1% |
| Belgian | 77 | 0.1% |
| Bhutanese | 1,099 | 1.7% |
| Blackfeet | 13 | 0.0% |
| Bolivian | 92 | 0.1% |
| Brazilian | 75 | 0.1% |
| British | 821 | 1.2% |
| Bulgarian | 159 | 0.2% |
| Burmese | 1,675 | 2.5% |
| Canadian | 441 | 0.7% |
| Central American | 69 | 0.1% |
| Cherokee | 179 | 0.3% |
| Chilean | 61 | 0.1% |
| Choctaw | 49 | 0.1% |
| Colombian | 210 | 0.3% |
| Costa Rican | 59 | 0.1% |
| Croatian | 81 | 0.1% |
| Cuban | 95 | 0.1% |
| Czech | 296 | 0.4% |
| Czechoslovakian | 44 | 0.1% |
| Danish | 425 | 0.6% |
| Dominican | 15 | 0.0% |
| Dutch | 735 | 1.1% |
| Eastern European | 198 | 0.3% |
| Ecuadorian | 14 | 0.0% |
| Egyptian | 105 | 0.2% |
| English | 6,298 | 9.5% |
| European | 1,379 | 2.1% |
| Filipino | 578 | 0.9% |
| Finnish | 318 | 0.5% |
| French | 1,451 | 2.2% |
| French Canadian | 192 | 0.3% |
| German | 8,072 | 12.1% |
| Greek | 485 | 0.7% |
| Guamanian / Chamorro | 8 | 0.0% |
| Haitian | 16 | 0.0% |
| Honduran | 10 | 0.0% |
| Hungarian | 193 | 0.3% |
| Icelander | 84 | 0.1% |
| Indian (Asian) | 8,679 | 13.0% |
| Iranian | 561 | 0.8% |
| Irish | 4,093 | 6.1% |
| Iroquois | 7 | 0.0% |
| Israeli | 54 | 0.1% |
| Italian | 2,584 | 3.9% |
| Jamaican | 142 | 0.2% |
| Japanese | 25 | 0.0% |
| Jordanian | 138 | 0.2% |
| Korean | 861 | 1.3% |
| Laotian | 11 | 0.0% |
| Latvian | 18 | 0.0% |
| Lebanese | 564 | 0.9% |
| Liberian | 36 | 0.1% |
| Lithuanian | 74 | 0.1% |
| Luxembourger | 18 | 0.0% |
| Malaysian | 234 | 0.4% |
| Maltese | 27 | 0.0% |
| Mexican | 1,145 | 1.7% |
| Mexican American Indian | 22 | 0.0% |
| Mongolian | 111 | 0.2% |
| Native Hawaiian | 140 | 0.2% |
| Nigerian | 9 | 0.0% |
| Northern European | 424 | 0.6% |
| Norwegian | 1,416 | 2.1% |
| Okinawan | 70 | 0.1% |
| Pakistani | 127 | 0.2% |
| Palestinian | 38 | 0.1% |
| Pennsylvania German | 8 | 0.0% |
| Peruvian | 103 | 0.2% |
| Polish | 1,053 | 1.6% |
| Portuguese | 459 | 0.7% |
| Puerto Rican | 85 | 0.1% |
| Romanian | 463 | 0.7% |
| Russian | 1,236 | 1.9% |
| Samoan | 11 | 0.0% |
| Scandinavian | 556 | 0.8% |
| Scotch-Irish | 297 | 0.4% |
| Scottish | 1,253 | 1.9% |
| Serbian | 110 | 0.2% |
| Slavic | 51 | 0.1% |
| Slovak | 78 | 0.1% |
| South African | 107 | 0.2% |
| South American | 552 | 0.8% |
| South American Indian | 22 | 0.0% |
| Spaniard | 194 | 0.3% |
| Spanish | 219 | 0.3% |
| Sri Lankan | 592 | 0.9% |
| Subsaharan African | 257 | 0.4% |
| Swedish | 2,071 | 3.1% |
| Swiss | 351 | 0.5% |
| Syrian | 16 | 0.0% |
| Thai | 11,776 | 17.7% |
| Trinidadian and Tobagonian | 67 | 0.1% |
| Tsimshian | 17 | 0.0% |
| Turkish | 196 | 0.3% |
| Ukrainian | 203 | 0.3% |
| Venezuelan | 47 | 0.1% |
| Vietnamese | 36 | 0.1% |
| Welsh | 327 | 0.5% |
| West Indian | 7 | 0.0% |
| Yugoslavian | 26 | 0.0% | View All 110 Rows |
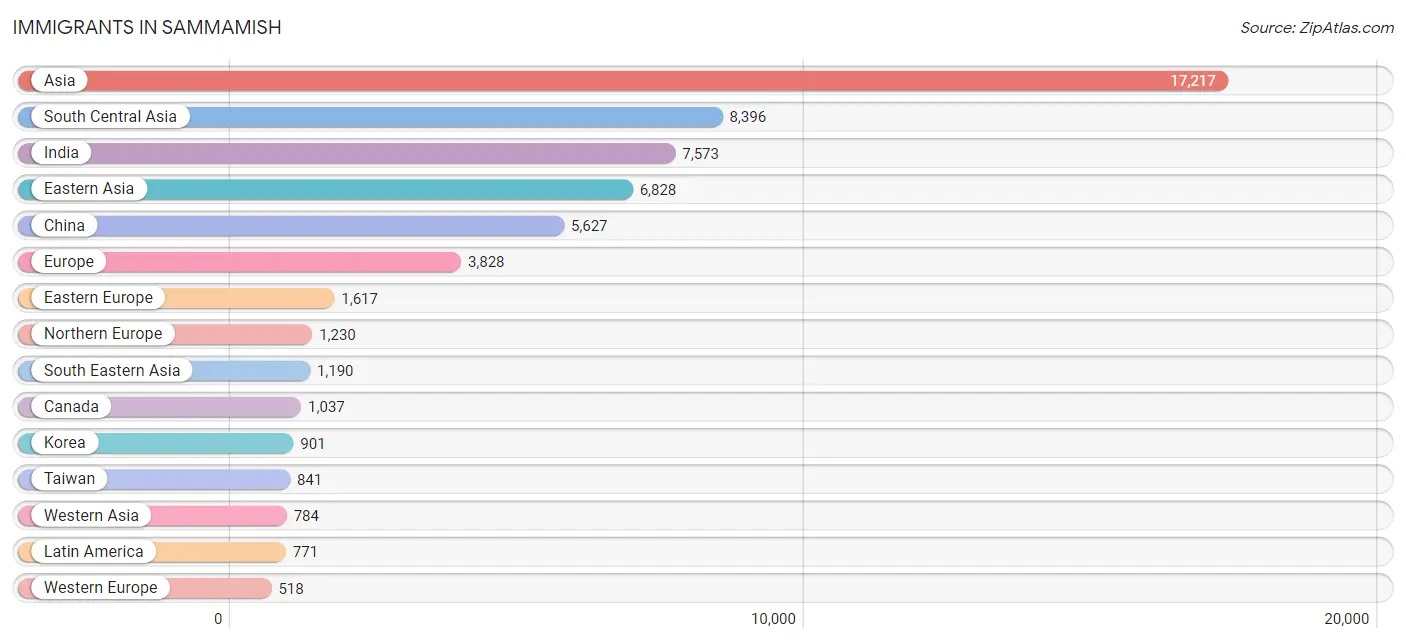
Immigrants in Sammamish
The most numerous immigrant groups reported in Sammamish came from Asia (17,217 | 25.9%), South Central Asia (8,396 | 12.6%), India (7,573 | 11.4%), Eastern Asia (6,828 | 10.2%), and China (5,627 | 8.5%), together accounting for 68.5% of all Sammamish residents.
| Immigration Origin | # Population | % Population |
| Afghanistan | 126 | 0.2% |
| Africa | 353 | 0.5% |
| Argentina | 18 | 0.0% |
| Asia | 17,217 | 25.9% |
| Australia | 157 | 0.2% |
| Austria | 60 | 0.1% |
| Bangladesh | 73 | 0.1% |
| Belarus | 22 | 0.0% |
| Belgium | 18 | 0.0% |
| Bolivia | 14 | 0.0% |
| Brazil | 123 | 0.2% |
| Bulgaria | 101 | 0.2% |
| Cambodia | 22 | 0.0% |
| Canada | 1,037 | 1.6% |
| Caribbean | 31 | 0.1% |
| Central America | 422 | 0.6% |
| Chile | 21 | 0.0% |
| China | 5,627 | 8.5% |
| Colombia | 41 | 0.1% |
| Costa Rica | 59 | 0.1% |
| Czechoslovakia | 77 | 0.1% |
| Denmark | 116 | 0.2% |
| Eastern Africa | 37 | 0.1% |
| Eastern Asia | 6,828 | 10.2% |
| Eastern Europe | 1,617 | 2.4% |
| Ecuador | 14 | 0.0% |
| Egypt | 40 | 0.1% |
| England | 247 | 0.4% |
| Europe | 3,828 | 5.8% |
| Fiji | 8 | 0.0% |
| France | 194 | 0.3% |
| Germany | 151 | 0.2% |
| Greece | 192 | 0.3% |
| Haiti | 11 | 0.0% |
| Honduras | 10 | 0.0% |
| Hong Kong | 174 | 0.3% |
| Hungary | 396 | 0.6% |
| India | 7,573 | 11.4% |
| Indonesia | 22 | 0.0% |
| Iran | 398 | 0.6% |
| Ireland | 55 | 0.1% |
| Israel | 76 | 0.1% |
| Italy | 54 | 0.1% |
| Japan | 300 | 0.4% |
| Jordan | 91 | 0.1% |
| Korea | 901 | 1.3% |
| Kuwait | 12 | 0.0% |
| Laos | 177 | 0.3% |
| Latin America | 771 | 1.2% |
| Lebanon | 128 | 0.2% |
| Malaysia | 220 | 0.3% |
| Mexico | 353 | 0.5% |
| Nepal | 12 | 0.0% |
| Netherlands | 21 | 0.0% |
| Nigeria | 40 | 0.1% |
| Northern Africa | 44 | 0.1% |
| Northern Europe | 1,230 | 1.8% |
| Norway | 33 | 0.1% |
| Oceania | 177 | 0.3% |
| Pakistan | 198 | 0.3% |
| Peru | 56 | 0.1% |
| Philippines | 259 | 0.4% |
| Poland | 75 | 0.1% |
| Portugal | 68 | 0.1% |
| Romania | 393 | 0.6% |
| Russia | 327 | 0.5% |
| Saudi Arabia | 114 | 0.2% |
| Scotland | 51 | 0.1% |
| Singapore | 67 | 0.1% |
| South Africa | 218 | 0.3% |
| South America | 318 | 0.5% |
| South Central Asia | 8,396 | 12.6% |
| South Eastern Asia | 1,190 | 1.8% |
| Southern Europe | 463 | 0.7% |
| Spain | 149 | 0.2% |
| Sri Lanka | 7 | 0.0% |
| Sweden | 147 | 0.2% |
| Switzerland | 62 | 0.1% |
| Syria | 40 | 0.1% |
| Taiwan | 841 | 1.3% |
| Thailand | 45 | 0.1% |
| Trinidad and Tobago | 20 | 0.0% |
| Turkey | 140 | 0.2% |
| Ukraine | 213 | 0.3% |
| Uzbekistan | 9 | 0.0% |
| Venezuela | 31 | 0.1% |
| Vietnam | 378 | 0.6% |
| Western Africa | 40 | 0.1% |
| Western Asia | 784 | 1.2% |
| Western Europe | 518 | 0.8% | View All 90 Rows |
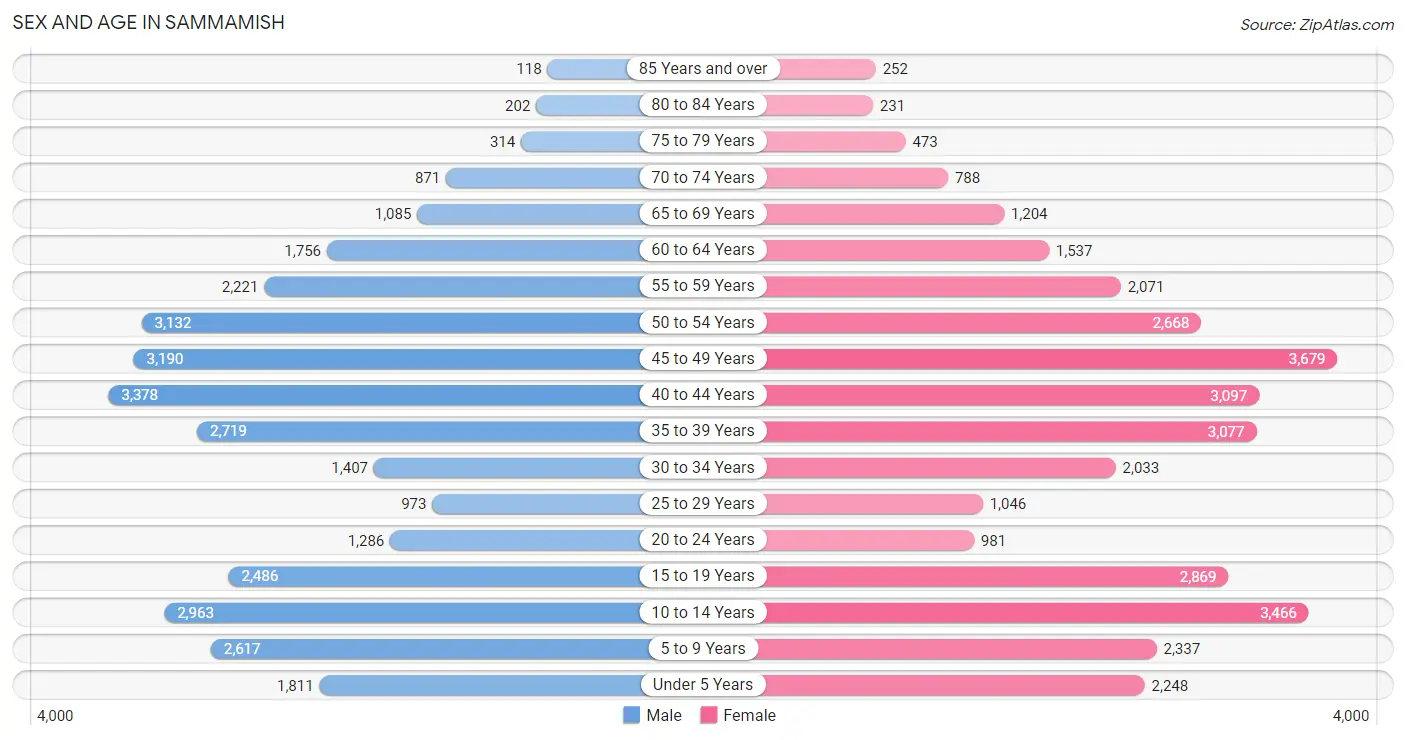
Sex and Age in Sammamish
Sex and Age in Sammamish
The most populous age groups in Sammamish are 40 to 44 Years (3,378 | 10.4%) for men and 45 to 49 Years (3,679 | 10.8%) for women.
| Age Bracket | Male | Female |
| Under 5 Years | 1,811 (5.6%) | 2,248 (6.6%) |
| 5 to 9 Years | 2,617 (8.1%) | 2,337 (6.9%) |
| 10 to 14 Years | 2,963 (9.1%) | 3,466 (10.2%) |
| 15 to 19 Years | 2,486 (7.6%) | 2,869 (8.4%) |
| 20 to 24 Years | 1,286 (4.0%) | 981 (2.9%) |
| 25 to 29 Years | 973 (3.0%) | 1,046 (3.1%) |
| 30 to 34 Years | 1,407 (4.3%) | 2,033 (6.0%) |
| 35 to 39 Years | 2,719 (8.4%) | 3,077 (9.0%) |
| 40 to 44 Years | 3,378 (10.4%) | 3,097 (9.1%) |
| 45 to 49 Years | 3,190 (9.8%) | 3,679 (10.8%) |
| 50 to 54 Years | 3,132 (9.6%) | 2,668 (7.8%) |
| 55 to 59 Years | 2,221 (6.8%) | 2,071 (6.1%) |
| 60 to 64 Years | 1,756 (5.4%) | 1,537 (4.5%) |
| 65 to 69 Years | 1,085 (3.3%) | 1,204 (3.5%) |
| 70 to 74 Years | 871 (2.7%) | 788 (2.3%) |
| 75 to 79 Years | 314 (1.0%) | 473 (1.4%) |
| 80 to 84 Years | 202 (0.6%) | 231 (0.7%) |
| 85 Years and over | 118 (0.4%) | 252 (0.7%) |
| Total | 32,529 (100.0%) | 34,057 (100.0%) |
Families and Households in Sammamish
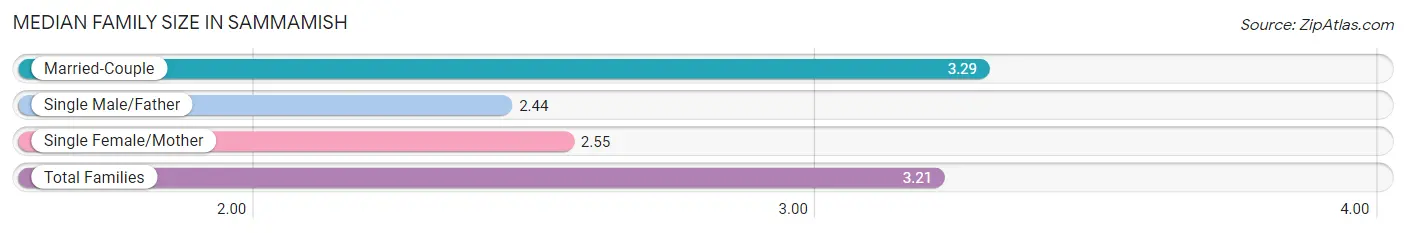
Median Family Size in Sammamish
The median family size in Sammamish is 3.21 persons per family, with married-couple families (17,325 | 89.8%) accounting for the largest median family size of 3.29 persons per family. On the other hand, single male/father families (613 | 3.2%) represent the smallest median family size with 2.44 persons per family.
| Family Type | # Families | Family Size |
| Married-Couple | 17,325 (89.8%) | 3.29 |
| Single Male/Father | 613 (3.2%) | 2.44 |
| Single Female/Mother | 1,363 (7.1%) | 2.55 |
| Total Families | 19,301 (100.0%) | 3.21 |
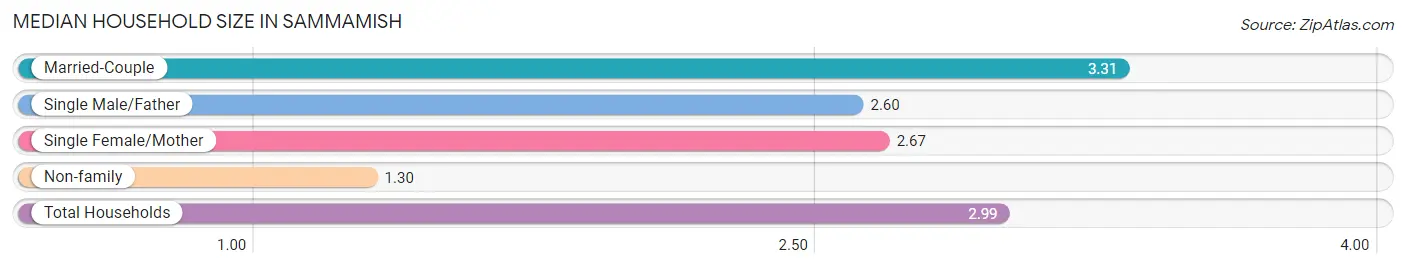
Median Household Size in Sammamish
The median household size in Sammamish is 2.99 persons per household, with married-couple households (17,325 | 77.8%) accounting for the largest median household size of 3.31 persons per household. non-family households (2,957 | 13.3%) represent the smallest median household size with 1.30 persons per household.
| Household Type | # Households | Household Size |
| Married-Couple | 17,325 (77.8%) | 3.31 |
| Single Male/Father | 613 (2.8%) | 2.60 |
| Single Female/Mother | 1,363 (6.1%) | 2.67 |
| Non-family | 2,957 (13.3%) | 1.30 |
| Total Households | 22,258 (100.0%) | 2.99 |
Household Size by Marriage Status in Sammamish
Out of a total of 22,258 households in Sammamish, 19,301 (86.7%) are family households, while 2,957 (13.3%) are nonfamily households. The most numerous type of family households are 4-person households, comprising 6,038, and the most common type of nonfamily households are 1-person households, comprising 2,191.
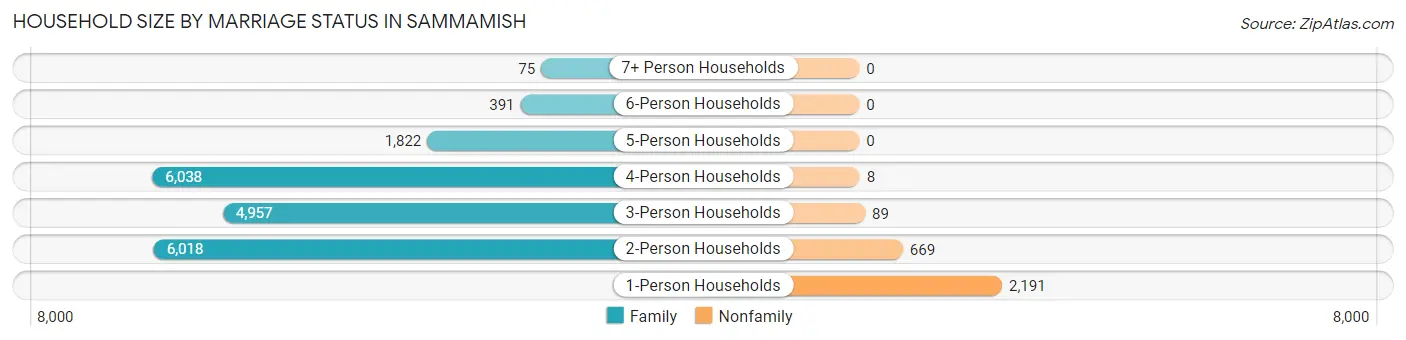
| Household Size | Family Households | Nonfamily Households |
| 1-Person Households | - | 2,191 (9.8%) |
| 2-Person Households | 6,018 (27.0%) | 669 (3.0%) |
| 3-Person Households | 4,957 (22.3%) | 89 (0.4%) |
| 4-Person Households | 6,038 (27.1%) | 8 (0.0%) |
| 5-Person Households | 1,822 (8.2%) | 0 (0.0%) |
| 6-Person Households | 391 (1.8%) | 0 (0.0%) |
| 7+ Person Households | 75 (0.3%) | 0 (0.0%) |
| Total | 19,301 (86.7%) | 2,957 (13.3%) |
Female Fertility in Sammamish
Fertility by Age in Sammamish
Average fertility rate in Sammamish is 40.0 births per 1,000 women. Women in the age bracket of 20 to 34 years have the highest fertility rate with 67.0 births per 1,000 women. Women in the age bracket of 35 to 50 years acount for 60.7% of all women with births.
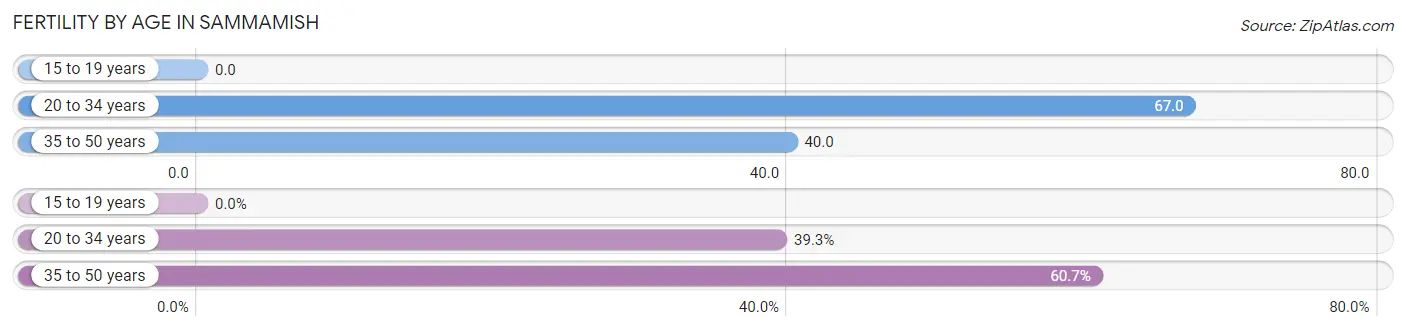
| Age Bracket | Women with Births | Births / 1,000 Women |
| 15 to 19 years | 0 (0.0%) | 0.0 |
| 20 to 34 years | 270 (39.3%) | 67.0 |
| 35 to 50 years | 417 (60.7%) | 40.0 |
| Total | 687 (100.0%) | 40.0 |
Fertility by Age by Marriage Status in Sammamish
99.7% of women with births (687) in Sammamish are married. The highest percentage of unmarried women with births falls into 20 to 34 years age bracket with 0.7% of them unmarried at the time of birth, while the lowest percentage of unmarried women with births belong to 35 to 50 years age bracket with 0.0% of them unmarried.
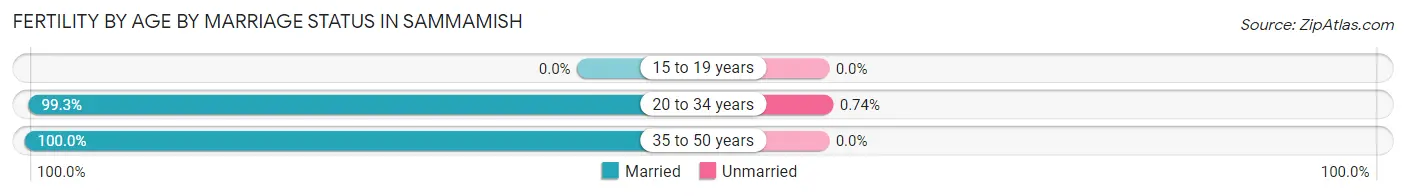
| Age Bracket | Married | Unmarried |
| 15 to 19 years | 0 (0.0%) | 0 (0.0%) |
| 20 to 34 years | 268 (99.3%) | 2 (0.7%) |
| 35 to 50 years | 417 (100.0%) | 0 (0.0%) |
| Total | 685 (99.7%) | 2 (0.3%) |
Fertility by Education in Sammamish
Average fertility rate in Sammamish is 40.0 births per 1,000 women. Women with the education attainment of bachelor's degree have the highest fertility rate of 53.0 births per 1,000 women, while women with the education attainment of less than high school have the lowest fertility at 10.0 births per 1,000 women. Women with the education attainment of bachelor's degree represent 44.8% of all women with births.
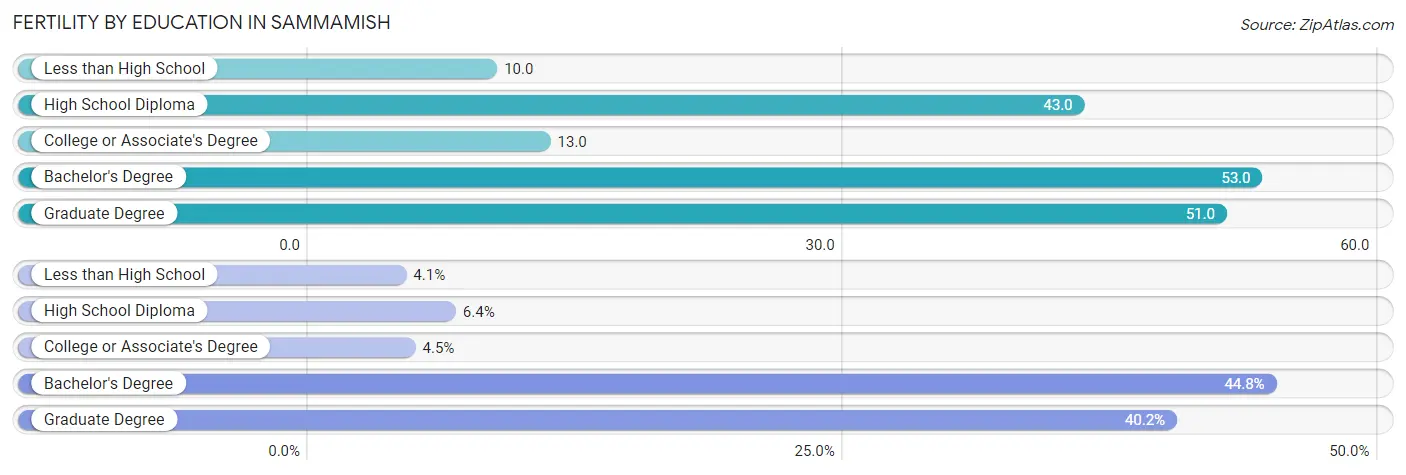
| Educational Attainment | Women with Births | Births / 1,000 Women |
| Less than High School | 28 (4.1%) | 10.0 |
| High School Diploma | 44 (6.4%) | 43.0 |
| College or Associate's Degree | 31 (4.5%) | 13.0 |
| Bachelor's Degree | 308 (44.8%) | 53.0 |
| Graduate Degree | 276 (40.2%) | 51.0 |
| Total | 687 (100.0%) | 40.0 |
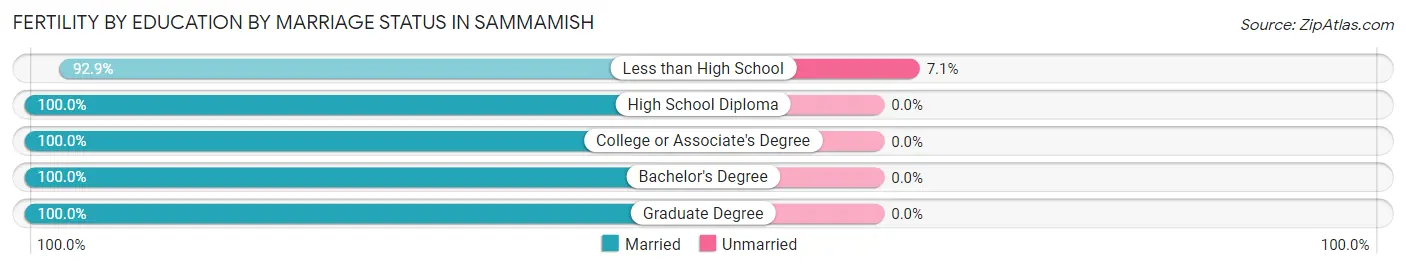
Fertility by Education by Marriage Status in Sammamish
0.3% of women with births in Sammamish are unmarried. Women with the educational attainment of high school diploma are most likely to be married with 100.0% of them married at childbirth, while women with the educational attainment of less than high school are least likely to be married with 7.1% of them unmarried at childbirth.
| Educational Attainment | Married | Unmarried |
| Less than High School | 26 (92.9%) | 2 (7.1%) |
| High School Diploma | 44 (100.0%) | 0 (0.0%) |
| College or Associate's Degree | 31 (100.0%) | 0 (0.0%) |
| Bachelor's Degree | 308 (100.0%) | 0 (0.0%) |
| Graduate Degree | 276 (100.0%) | 0 (0.0%) |
| Total | 685 (99.7%) | 2 (0.3%) |
Employment Characteristics in Sammamish
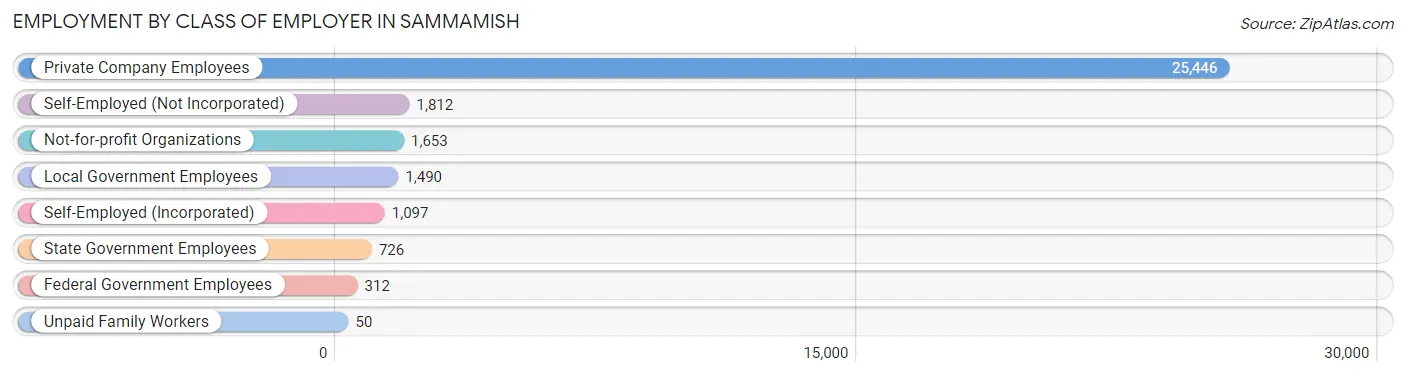
Employment by Class of Employer in Sammamish
Among the 32,586 employed individuals in Sammamish, private company employees (25,446 | 78.1%), self-employed (not incorporated) (1,812 | 5.6%), and not-for-profit organizations (1,653 | 5.1%) make up the most common classes of employment.
| Employer Class | # Employees | % Employees |
| Private Company Employees | 25,446 | 78.1% |
| Self-Employed (Incorporated) | 1,097 | 3.4% |
| Self-Employed (Not Incorporated) | 1,812 | 5.6% |
| Not-for-profit Organizations | 1,653 | 5.1% |
| Local Government Employees | 1,490 | 4.6% |
| State Government Employees | 726 | 2.2% |
| Federal Government Employees | 312 | 1.0% |
| Unpaid Family Workers | 50 | 0.2% |
| Total | 32,586 | 100.0% |
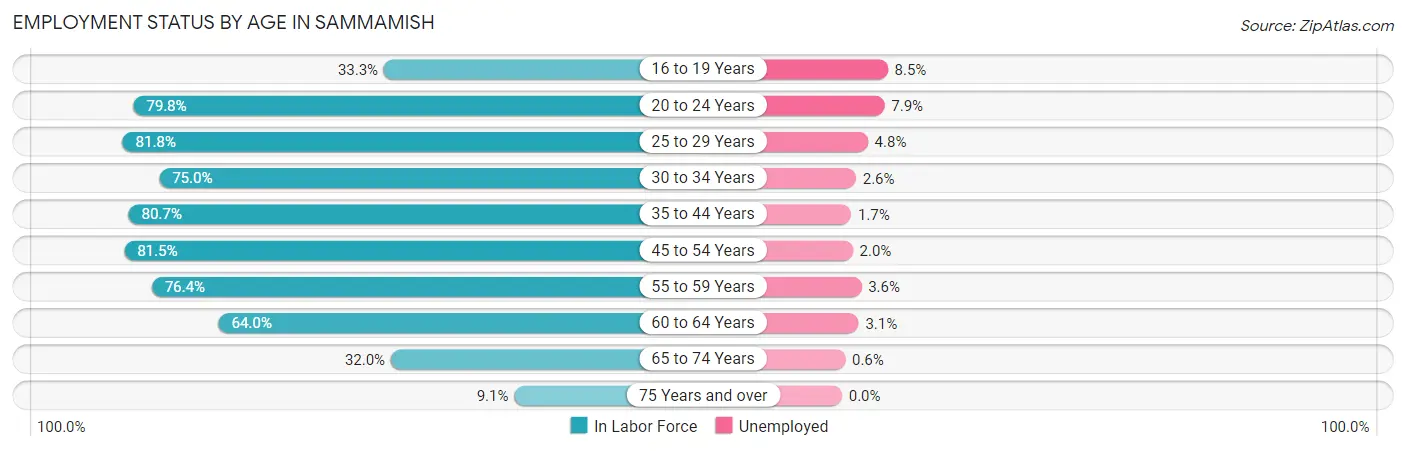
Employment Status by Age in Sammamish
According to the labor force statistics for Sammamish, out of the total population over 16 years of age (49,631), 69.2% or 34,345 individuals are in the labor force, with 2.8% or 962 of them unemployed. The age group with the highest labor force participation rate is 25 to 29 years, with 81.8% or 1,652 individuals in the labor force. Within the labor force, the 16 to 19 years age range has the highest percentage of unemployed individuals, with 8.5% or 109 of them being unemployed.
| Age Bracket | In Labor Force | Unemployed |
| 16 to 19 Years | 1,279 (33.3%) | 109 (8.5%) |
| 20 to 24 Years | 1,809 (79.8%) | 143 (7.9%) |
| 25 to 29 Years | 1,652 (81.8%) | 79 (4.8%) |
| 30 to 34 Years | 2,580 (75.0%) | 67 (2.6%) |
| 35 to 44 Years | 9,903 (80.7%) | 168 (1.7%) |
| 45 to 54 Years | 10,325 (81.5%) | 206 (2.0%) |
| 55 to 59 Years | 3,279 (76.4%) | 118 (3.6%) |
| 60 to 64 Years | 2,108 (64.0%) | 65 (3.1%) |
| 65 to 74 Years | 1,263 (32.0%) | 8 (0.6%) |
| 75 Years and over | 145 (9.1%) | 0 (0.0%) |
| Total | 34,345 (69.2%) | 962 (2.8%) |
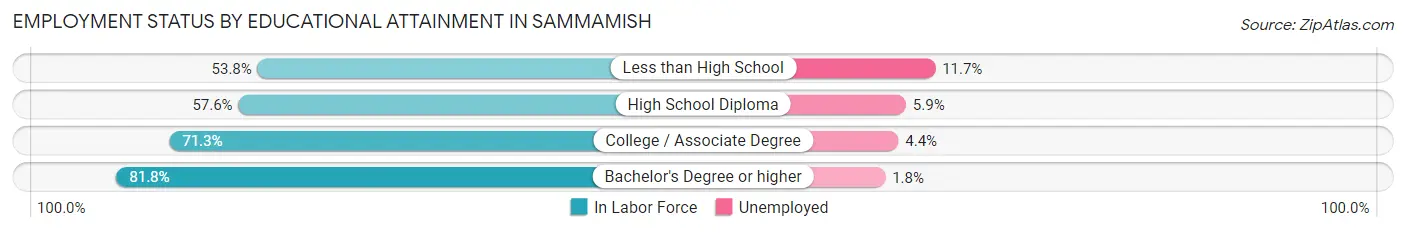
Employment Status by Educational Attainment in Sammamish
According to labor force statistics for Sammamish, 78.6% of individuals (29,855) out of the total population between 25 and 64 years of age (37,984) are in the labor force, with 2.4% or 717 of them being unemployed. The group with the highest labor force participation rate are those with the educational attainment of bachelor's degree or higher, with 81.8% or 24,483 individuals in the labor force. Within the labor force, individuals with less than high school education have the highest percentage of unemployment, with 11.7% or 46 of them being unemployed.
| Educational Attainment | In Labor Force | Unemployed |
| Less than High School | 393 (53.8%) | 86 (11.7%) |
| High School Diploma | 1,056 (57.6%) | 108 (5.9%) |
| College / Associate Degree | 3,914 (71.3%) | 242 (4.4%) |
| Bachelor's Degree or higher | 24,483 (81.8%) | 539 (1.8%) |
| Total | 29,855 (78.6%) | 912 (2.4%) |
Employment Occupations by Sex in Sammamish
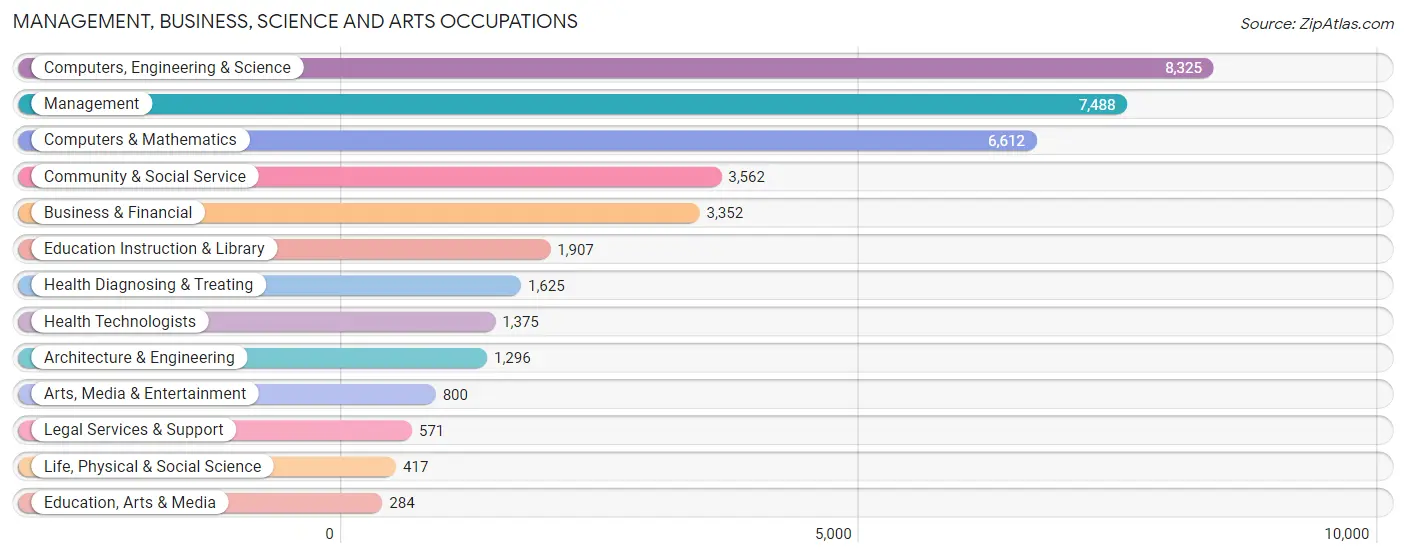
Management, Business, Science and Arts Occupations
The most common Management, Business, Science and Arts occupations in Sammamish are Computers, Engineering & Science (8,325 | 25.0%), Management (7,488 | 22.5%), Computers & Mathematics (6,612 | 19.8%), Community & Social Service (3,562 | 10.7%), and Business & Financial (3,352 | 10.1%).
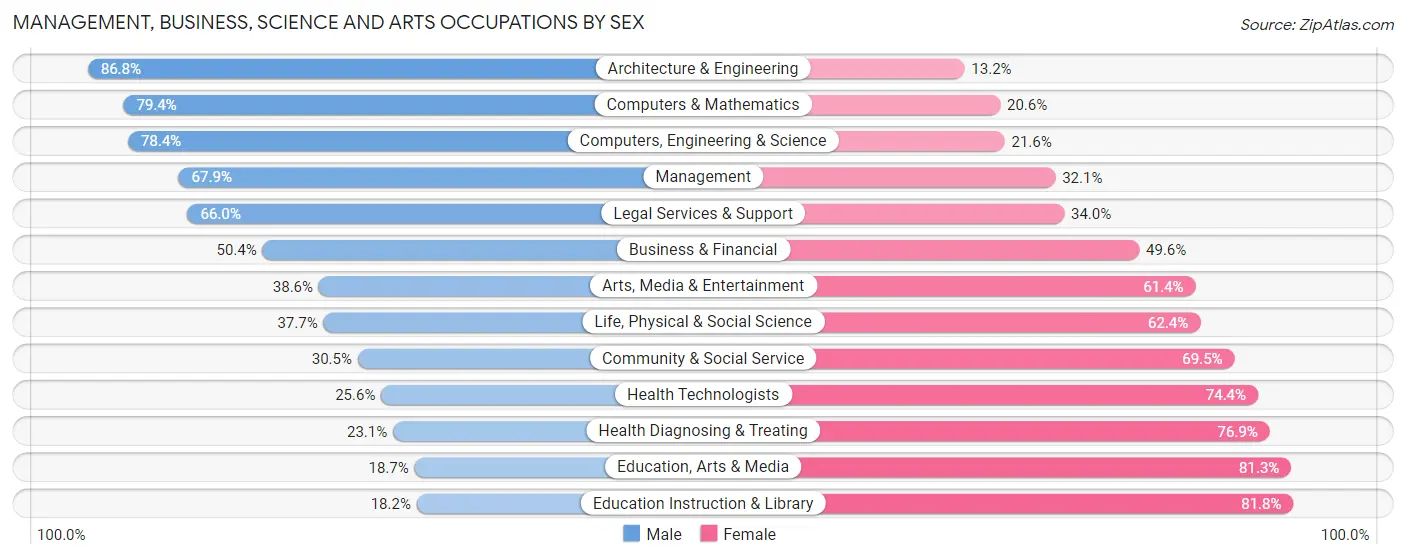
Management, Business, Science and Arts Occupations by Sex
Within the Management, Business, Science and Arts occupations in Sammamish, the most male-oriented occupations are Architecture & Engineering (86.8%), Computers & Mathematics (79.4%), and Computers, Engineering & Science (78.4%), while the most female-oriented occupations are Education Instruction & Library (81.8%), Education, Arts & Media (81.3%), and Health Diagnosing & Treating (76.9%).
| Occupation | Male | Female |
| Management | 5,081 (67.9%) | 2,407 (32.1%) |
| Business & Financial | 1,688 (50.4%) | 1,664 (49.6%) |
| Computers, Engineering & Science | 6,530 (78.4%) | 1,795 (21.6%) |
| Computers & Mathematics | 5,248 (79.4%) | 1,364 (20.6%) |
| Architecture & Engineering | 1,125 (86.8%) | 171 (13.2%) |
| Life, Physical & Social Science | 157 (37.7%) | 260 (62.4%) |
| Community & Social Service | 1,086 (30.5%) | 2,476 (69.5%) |
| Education, Arts & Media | 53 (18.7%) | 231 (81.3%) |
| Legal Services & Support | 377 (66.0%) | 194 (34.0%) |
| Education Instruction & Library | 347 (18.2%) | 1,560 (81.8%) |
| Arts, Media & Entertainment | 309 (38.6%) | 491 (61.4%) |
| Health Diagnosing & Treating | 376 (23.1%) | 1,249 (76.9%) |
| Health Technologists | 352 (25.6%) | 1,023 (74.4%) |
| Total (Category) | 14,761 (60.6%) | 9,591 (39.4%) |
| Total (Overall) | 19,272 (57.8%) | 14,064 (42.2%) |
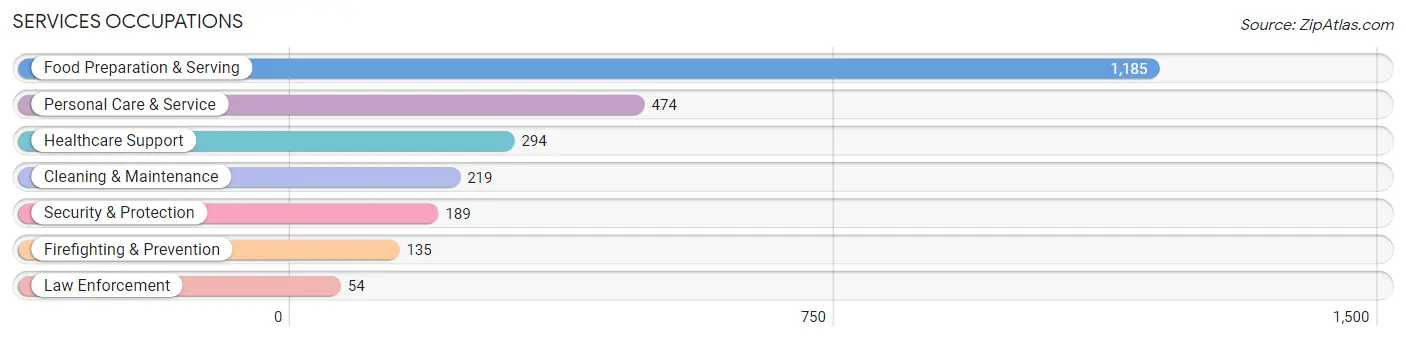
Services Occupations
The most common Services occupations in Sammamish are Food Preparation & Serving (1,185 | 3.5%), Personal Care & Service (474 | 1.4%), Healthcare Support (294 | 0.9%), Cleaning & Maintenance (219 | 0.7%), and Security & Protection (189 | 0.6%).
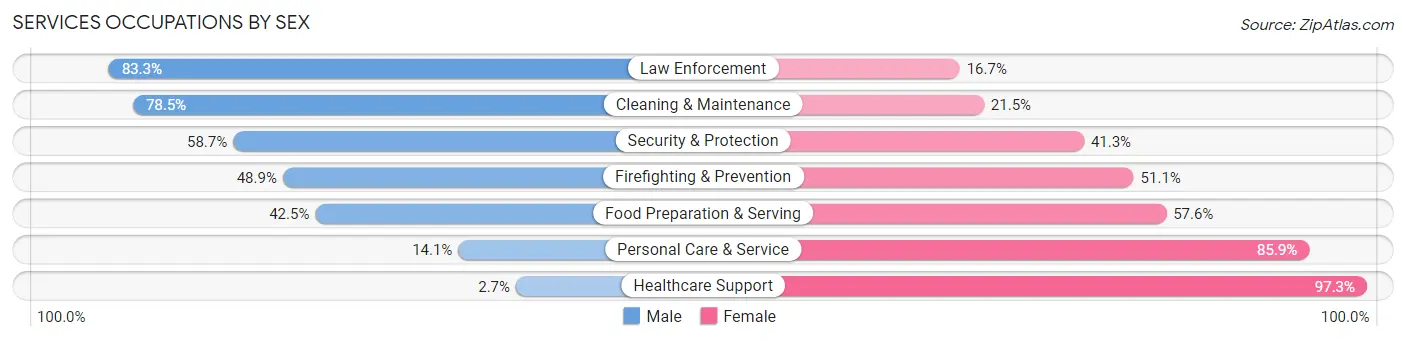
Services Occupations by Sex
Within the Services occupations in Sammamish, the most male-oriented occupations are Law Enforcement (83.3%), Cleaning & Maintenance (78.5%), and Security & Protection (58.7%), while the most female-oriented occupations are Healthcare Support (97.3%), Personal Care & Service (85.9%), and Food Preparation & Serving (57.6%).
| Occupation | Male | Female |
| Healthcare Support | 8 (2.7%) | 286 (97.3%) |
| Security & Protection | 111 (58.7%) | 78 (41.3%) |
| Firefighting & Prevention | 66 (48.9%) | 69 (51.1%) |
| Law Enforcement | 45 (83.3%) | 9 (16.7%) |
| Food Preparation & Serving | 503 (42.4%) | 682 (57.6%) |
| Cleaning & Maintenance | 172 (78.5%) | 47 (21.5%) |
| Personal Care & Service | 67 (14.1%) | 407 (85.9%) |
| Total (Category) | 861 (36.5%) | 1,500 (63.5%) |
| Total (Overall) | 19,272 (57.8%) | 14,064 (42.2%) |
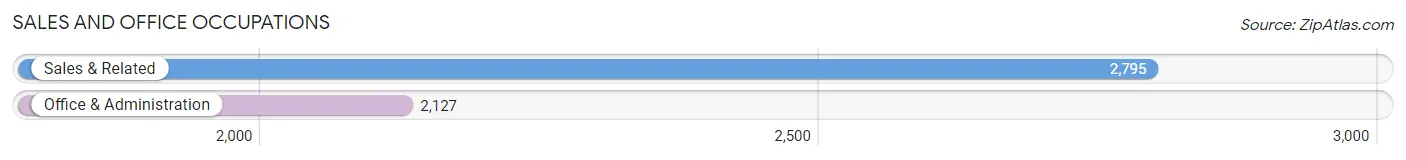
Sales and Office Occupations
The most common Sales and Office occupations in Sammamish are Sales & Related (2,795 | 8.4%), and Office & Administration (2,127 | 6.4%).
Sales and Office Occupations by Sex
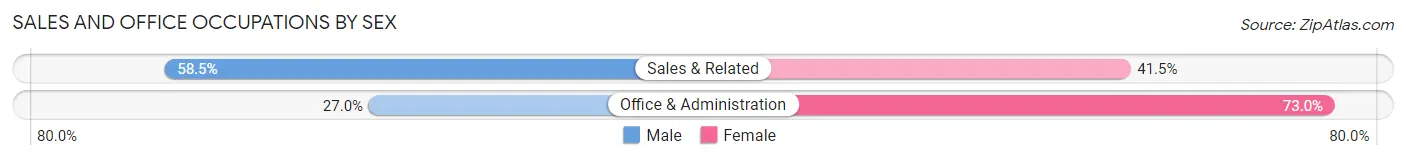
| Occupation | Male | Female |
| Sales & Related | 1,635 (58.5%) | 1,160 (41.5%) |
| Office & Administration | 575 (27.0%) | 1,552 (73.0%) |
| Total (Category) | 2,210 (44.9%) | 2,712 (55.1%) |
| Total (Overall) | 19,272 (57.8%) | 14,064 (42.2%) |
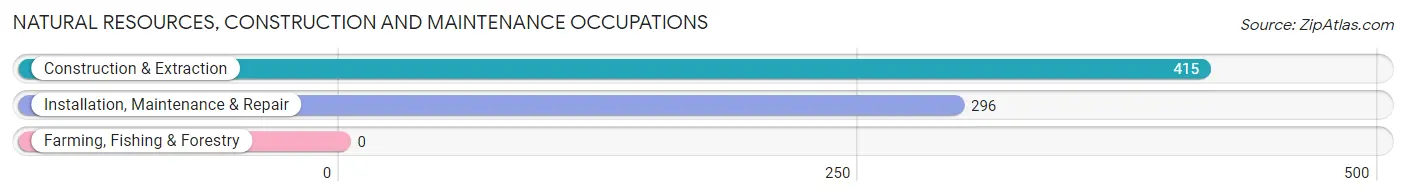
Natural Resources, Construction and Maintenance Occupations
The most common Natural Resources, Construction and Maintenance occupations in Sammamish are Construction & Extraction (415 | 1.2%), and Installation, Maintenance & Repair (296 | 0.9%).
Natural Resources, Construction and Maintenance Occupations by Sex
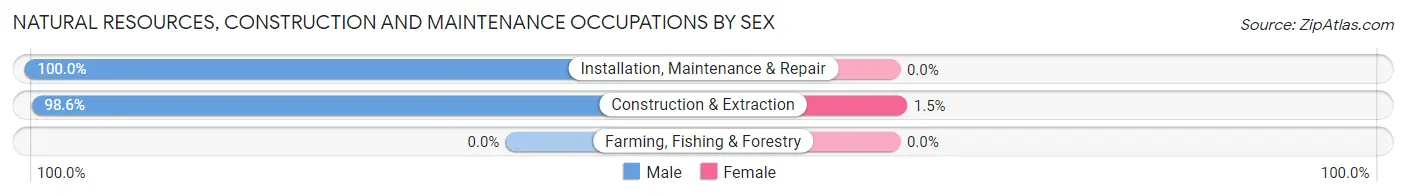
| Occupation | Male | Female |
| Farming, Fishing & Forestry | 0 (0.0%) | 0 (0.0%) |
| Construction & Extraction | 409 (98.6%) | 6 (1.5%) |
| Installation, Maintenance & Repair | 296 (100.0%) | 0 (0.0%) |
| Total (Category) | 705 (99.2%) | 6 (0.8%) |
| Total (Overall) | 19,272 (57.8%) | 14,064 (42.2%) |
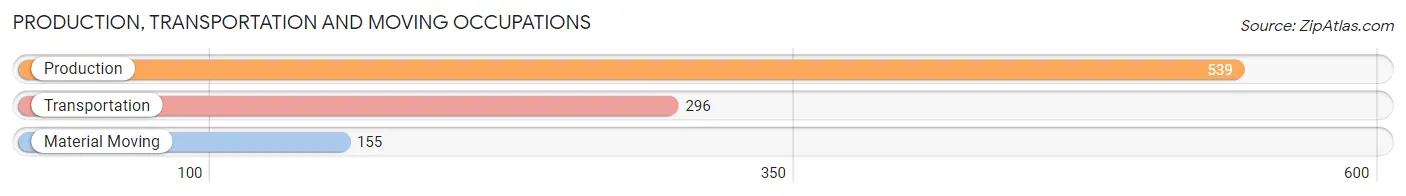
Production, Transportation and Moving Occupations
The most common Production, Transportation and Moving occupations in Sammamish are Production (539 | 1.6%), Transportation (296 | 0.9%), and Material Moving (155 | 0.5%).
Production, Transportation and Moving Occupations by Sex
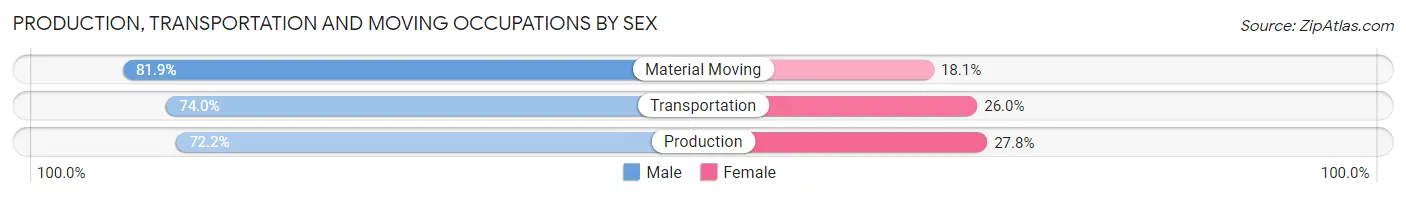
| Occupation | Male | Female |
| Production | 389 (72.2%) | 150 (27.8%) |
| Transportation | 219 (74.0%) | 77 (26.0%) |
| Material Moving | 127 (81.9%) | 28 (18.1%) |
| Total (Category) | 735 (74.2%) | 255 (25.8%) |
| Total (Overall) | 19,272 (57.8%) | 14,064 (42.2%) |
Employment Industries by Sex in Sammamish
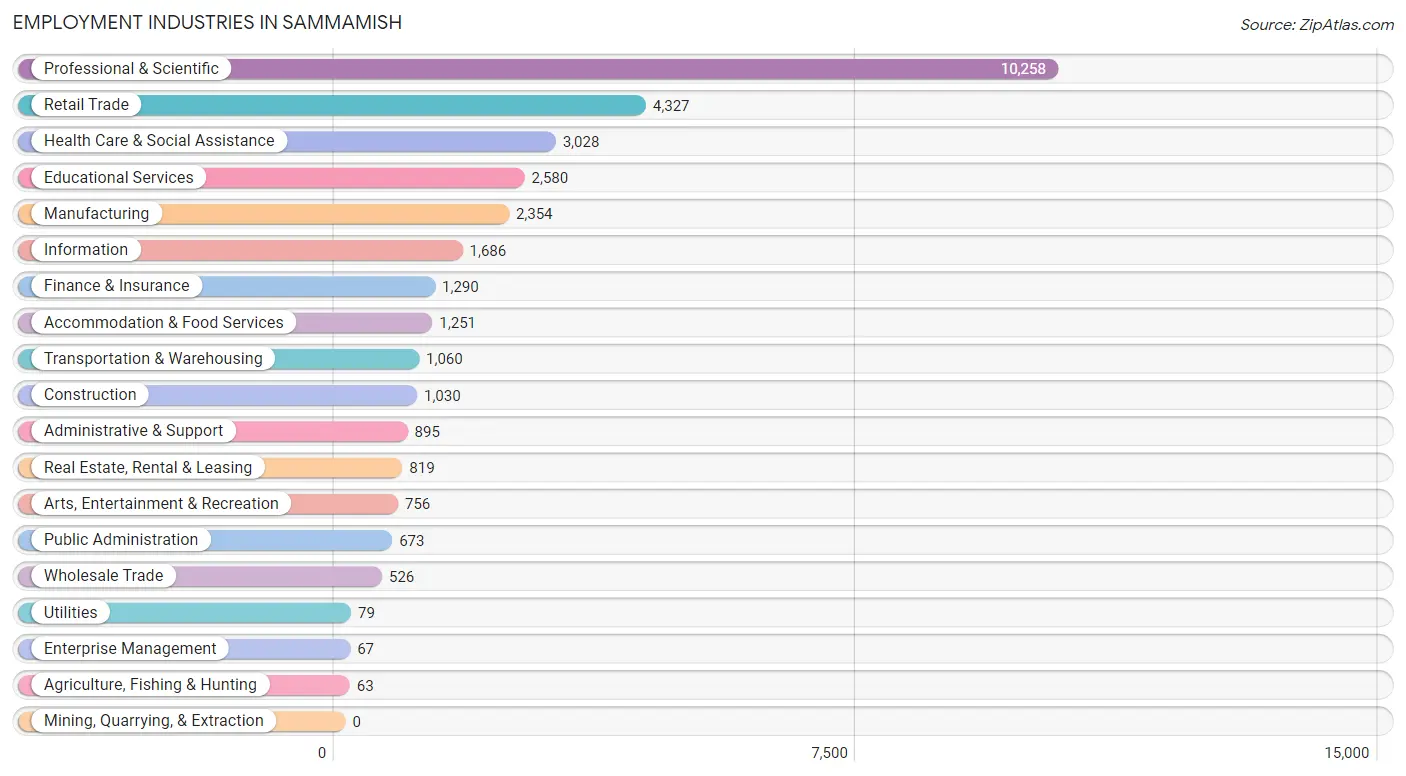
Employment Industries in Sammamish
The major employment industries in Sammamish include Professional & Scientific (10,258 | 30.8%), Retail Trade (4,327 | 13.0%), Health Care & Social Assistance (3,028 | 9.1%), Educational Services (2,580 | 7.7%), and Manufacturing (2,354 | 7.1%).
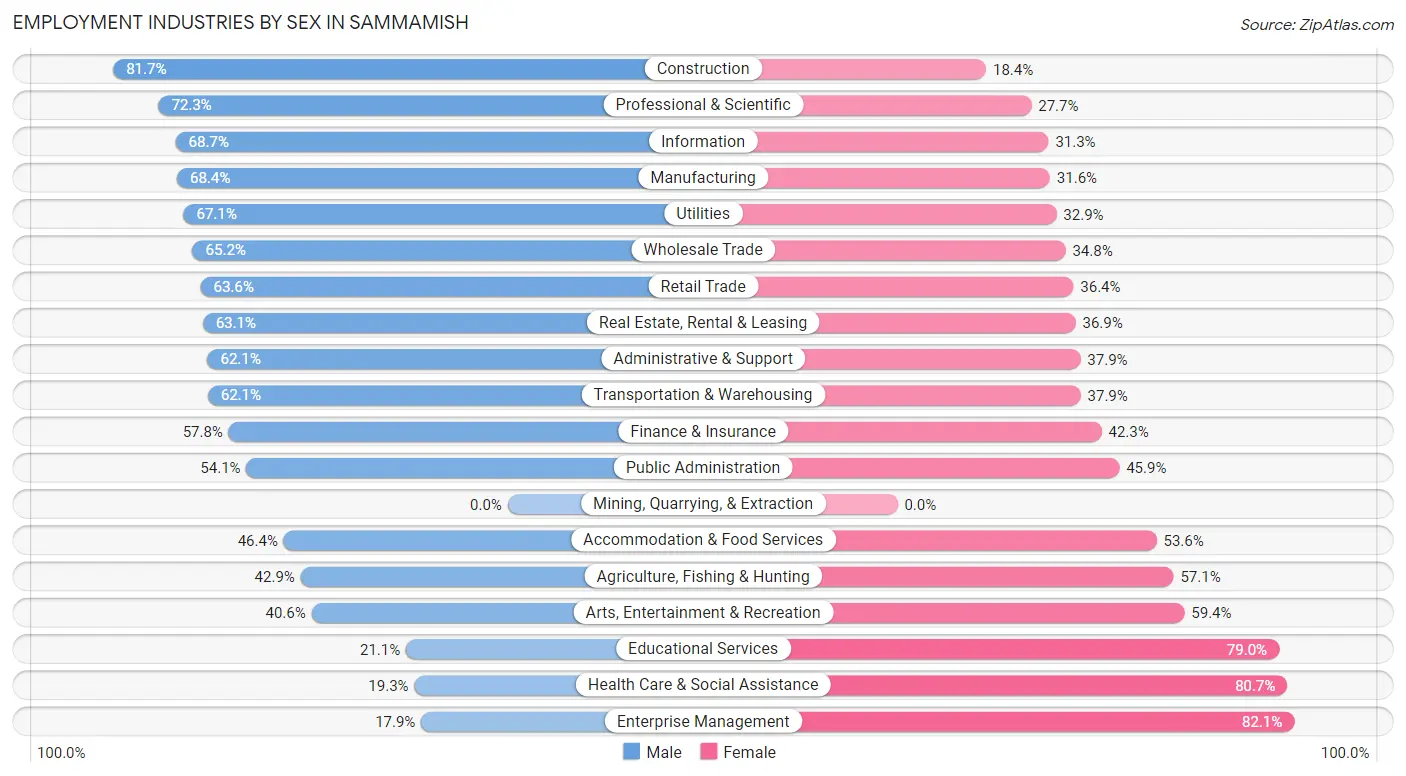
Employment Industries by Sex in Sammamish
The Sammamish industries that see more men than women are Construction (81.7%), Professional & Scientific (72.3%), and Information (68.7%), whereas the industries that tend to have a higher number of women are Enterprise Management (82.1%), Health Care & Social Assistance (80.7%), and Educational Services (78.9%).
| Industry | Male | Female |
| Agriculture, Fishing & Hunting | 27 (42.9%) | 36 (57.1%) |
| Mining, Quarrying, & Extraction | 0 (0.0%) | 0 (0.0%) |
| Construction | 841 (81.7%) | 189 (18.3%) |
| Manufacturing | 1,611 (68.4%) | 743 (31.6%) |
| Wholesale Trade | 343 (65.2%) | 183 (34.8%) |
| Retail Trade | 2,751 (63.6%) | 1,576 (36.4%) |
| Transportation & Warehousing | 658 (62.1%) | 402 (37.9%) |
| Utilities | 53 (67.1%) | 26 (32.9%) |
| Information | 1,159 (68.7%) | 527 (31.3%) |
| Finance & Insurance | 745 (57.8%) | 545 (42.2%) |
| Real Estate, Rental & Leasing | 517 (63.1%) | 302 (36.9%) |
| Professional & Scientific | 7,415 (72.3%) | 2,843 (27.7%) |
| Enterprise Management | 12 (17.9%) | 55 (82.1%) |
| Administrative & Support | 556 (62.1%) | 339 (37.9%) |
| Educational Services | 543 (21.0%) | 2,037 (78.9%) |
| Health Care & Social Assistance | 585 (19.3%) | 2,443 (80.7%) |
| Arts, Entertainment & Recreation | 307 (40.6%) | 449 (59.4%) |
| Accommodation & Food Services | 580 (46.4%) | 671 (53.6%) |
| Public Administration | 364 (54.1%) | 309 (45.9%) |
| Total | 19,272 (57.8%) | 14,064 (42.2%) |
Education in Sammamish
School Enrollment in Sammamish
The most common levels of schooling among the 20,128 students in Sammamish are middle school (5,494 | 27.3%), high school (5,298 | 26.3%), and elementary school (3,905 | 19.4%).
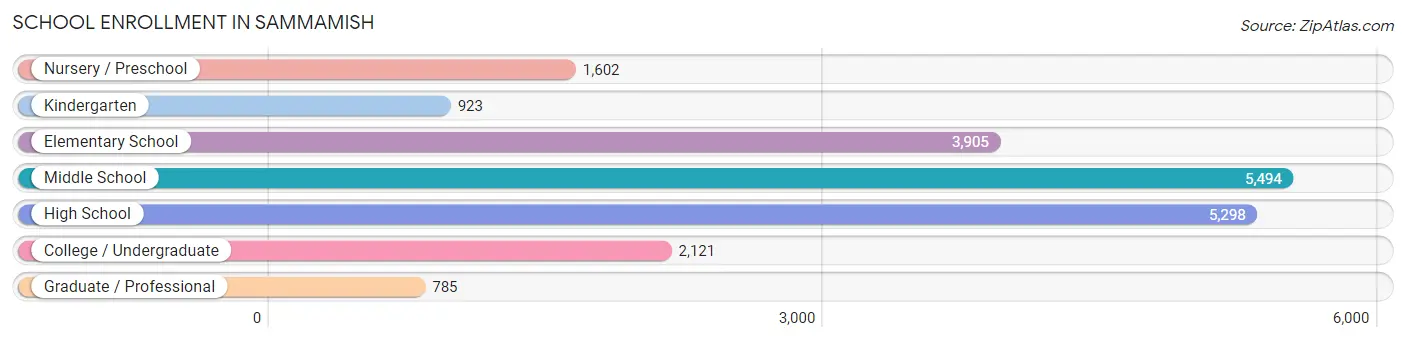
| School Level | # Students | % Students |
| Nursery / Preschool | 1,602 | 8.0% |
| Kindergarten | 923 | 4.6% |
| Elementary School | 3,905 | 19.4% |
| Middle School | 5,494 | 27.3% |
| High School | 5,298 | 26.3% |
| College / Undergraduate | 2,121 | 10.5% |
| Graduate / Professional | 785 | 3.9% |
| Total | 20,128 | 100.0% |
School Enrollment by Age by Funding Source in Sammamish
Out of a total of 20,128 students who are enrolled in schools in Sammamish, 3,281 (16.3%) attend a private institution, while the remaining 16,847 (83.7%) are enrolled in public schools. The age group of 3 to 4 year olds has the highest likelihood of being enrolled in private schools, with 855 (69.5% in the age bracket) enrolled. Conversely, the age group of 15 to 17 year olds has the lowest likelihood of being enrolled in a private school, with 3,792 (93.8% in the age bracket) attending a public institution.
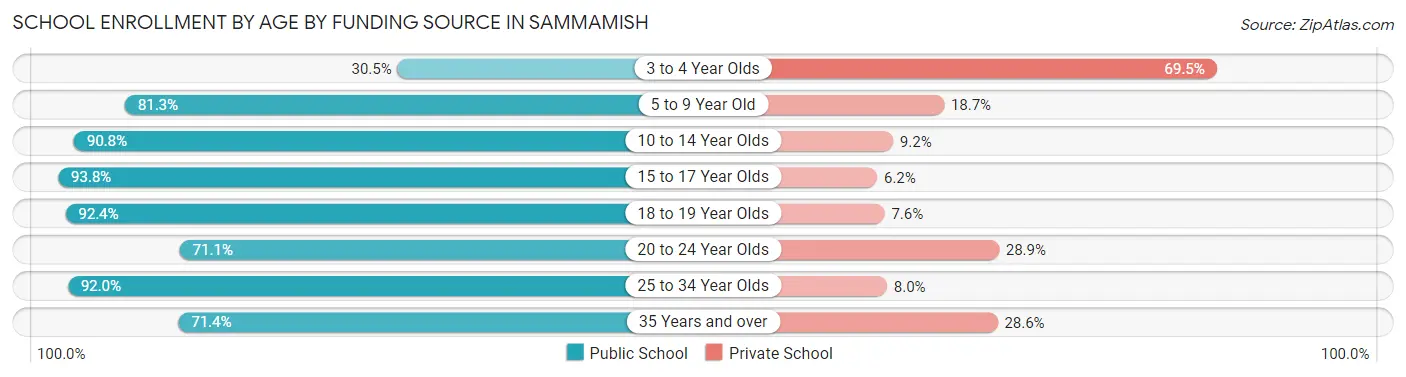
| Age Bracket | Public School | Private School |
| 3 to 4 Year Olds | 376 (30.5%) | 855 (69.5%) |
| 5 to 9 Year Old | 3,945 (81.3%) | 906 (18.7%) |
| 10 to 14 Year Olds | 5,783 (90.8%) | 584 (9.2%) |
| 15 to 17 Year Olds | 3,792 (93.8%) | 251 (6.2%) |
| 18 to 19 Year Olds | 985 (92.4%) | 81 (7.6%) |
| 20 to 24 Year Olds | 785 (71.1%) | 319 (28.9%) |
| 25 to 34 Year Olds | 629 (92.0%) | 55 (8.0%) |
| 35 Years and over | 558 (71.4%) | 224 (28.6%) |
| Total | 16,847 (83.7%) | 3,281 (16.3%) |
Educational Attainment by Field of Study in Sammamish
Business (7,131 | 20.1%), engineering (6,679 | 18.9%), computers & mathematics (4,937 | 13.9%), social sciences (2,729 | 7.7%), and science & technology (2,352 | 6.6%) are the most common fields of study among 35,437 individuals in Sammamish who have obtained a bachelor's degree or higher.
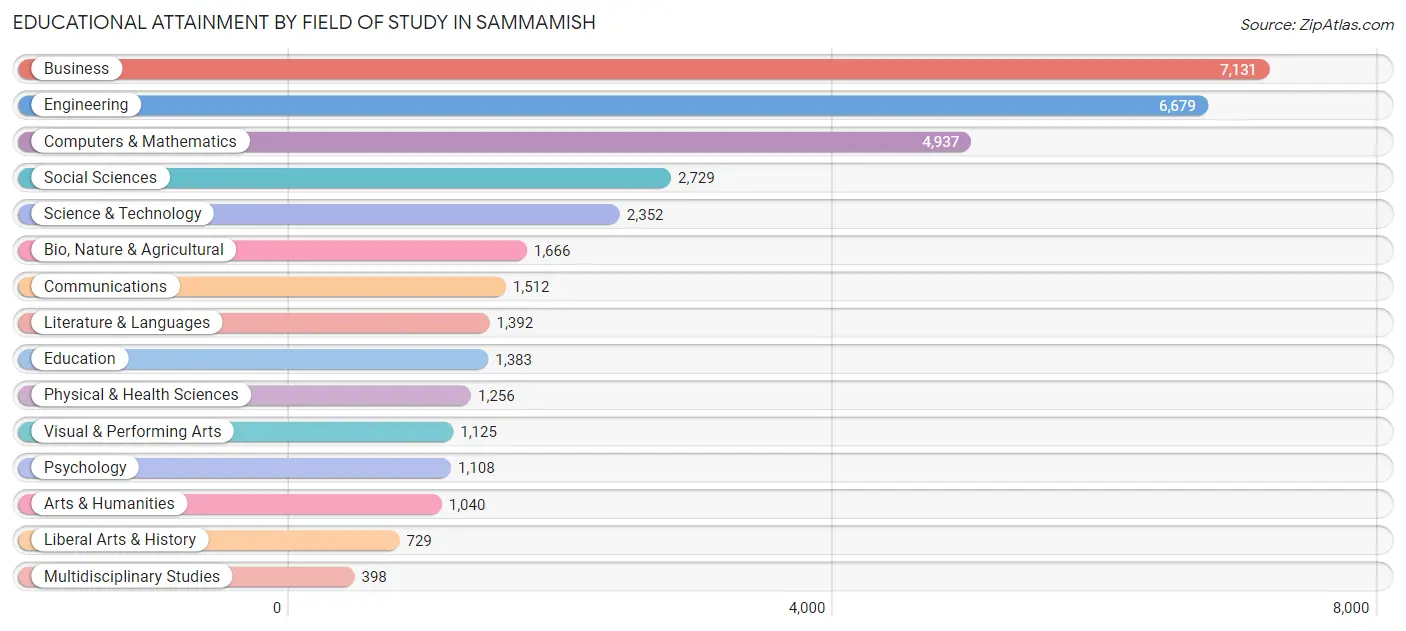
| Field of Study | # Graduates | % Graduates |
| Computers & Mathematics | 4,937 | 13.9% |
| Bio, Nature & Agricultural | 1,666 | 4.7% |
| Physical & Health Sciences | 1,256 | 3.5% |
| Psychology | 1,108 | 3.1% |
| Social Sciences | 2,729 | 7.7% |
| Engineering | 6,679 | 18.9% |
| Multidisciplinary Studies | 398 | 1.1% |
| Science & Technology | 2,352 | 6.6% |
| Business | 7,131 | 20.1% |
| Education | 1,383 | 3.9% |
| Literature & Languages | 1,392 | 3.9% |
| Liberal Arts & History | 729 | 2.1% |
| Visual & Performing Arts | 1,125 | 3.2% |
| Communications | 1,512 | 4.3% |
| Arts & Humanities | 1,040 | 2.9% |
| Total | 35,437 | 100.0% |
Transportation & Commute in Sammamish
Vehicle Availability by Sex in Sammamish
The most prevalent vehicle ownership categories in Sammamish are males with 2 vehicles (10,410, accounting for 54.5%) and females with 2 vehicles (6,948, making up 77.3%).
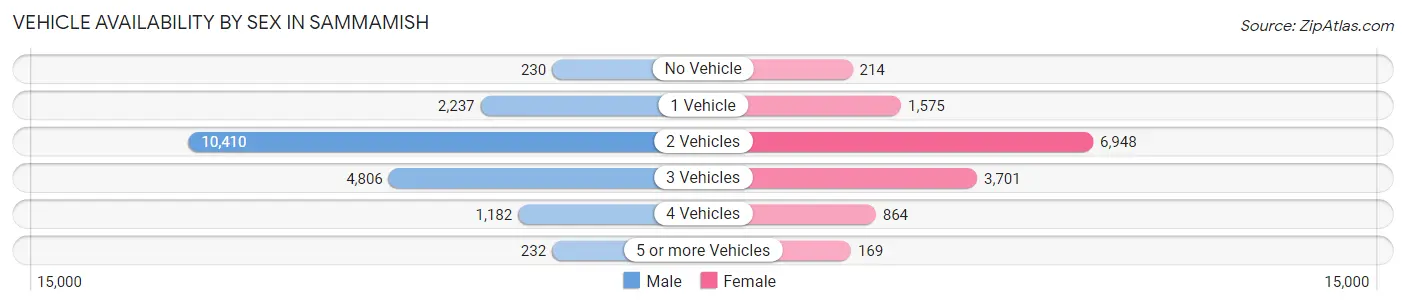
| Vehicles Available | Male | Female |
| No Vehicle | 230 (1.2%) | 214 (1.6%) |
| 1 Vehicle | 2,237 (11.7%) | 1,575 (11.7%) |
| 2 Vehicles | 10,410 (54.5%) | 6,948 (51.6%) |
| 3 Vehicles | 4,806 (25.2%) | 3,701 (27.5%) |
| 4 Vehicles | 1,182 (6.2%) | 864 (6.4%) |
| 5 or more Vehicles | 232 (1.2%) | 169 (1.3%) |
| Total | 19,097 (100.0%) | 13,471 (100.0%) |
Commute Time in Sammamish
The most frequently occuring commute durations in Sammamish are 30 to 34 minutes (4,049 commuters, 17.9%), 45 to 59 minutes (2,791 commuters, 12.4%), and 20 to 24 minutes (2,422 commuters, 10.7%).
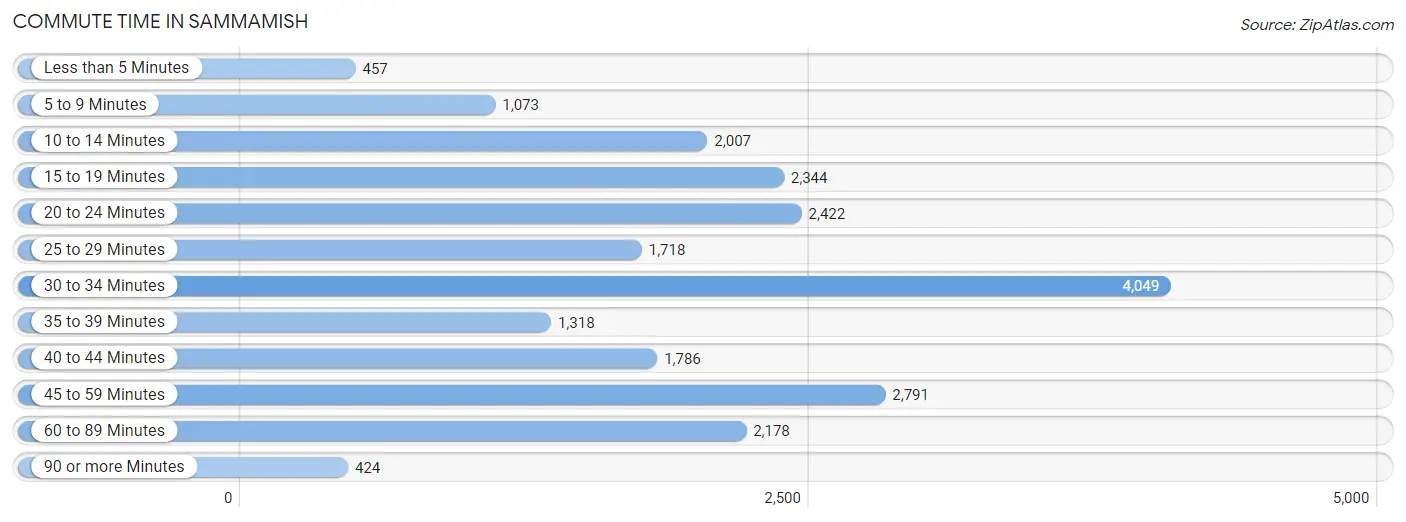
| Commute Time | # Commuters | % Commuters |
| Less than 5 Minutes | 457 | 2.0% |
| 5 to 9 Minutes | 1,073 | 4.8% |
| 10 to 14 Minutes | 2,007 | 8.9% |
| 15 to 19 Minutes | 2,344 | 10.4% |
| 20 to 24 Minutes | 2,422 | 10.7% |
| 25 to 29 Minutes | 1,718 | 7.6% |
| 30 to 34 Minutes | 4,049 | 17.9% |
| 35 to 39 Minutes | 1,318 | 5.8% |
| 40 to 44 Minutes | 1,786 | 7.9% |
| 45 to 59 Minutes | 2,791 | 12.4% |
| 60 to 89 Minutes | 2,178 | 9.7% |
| 90 or more Minutes | 424 | 1.9% |
Commute Time by Sex in Sammamish
The most common commute times in Sammamish are 30 to 34 minutes (2,497 commuters, 19.0%) for males and 30 to 34 minutes (1,552 commuters, 16.5%) for females.
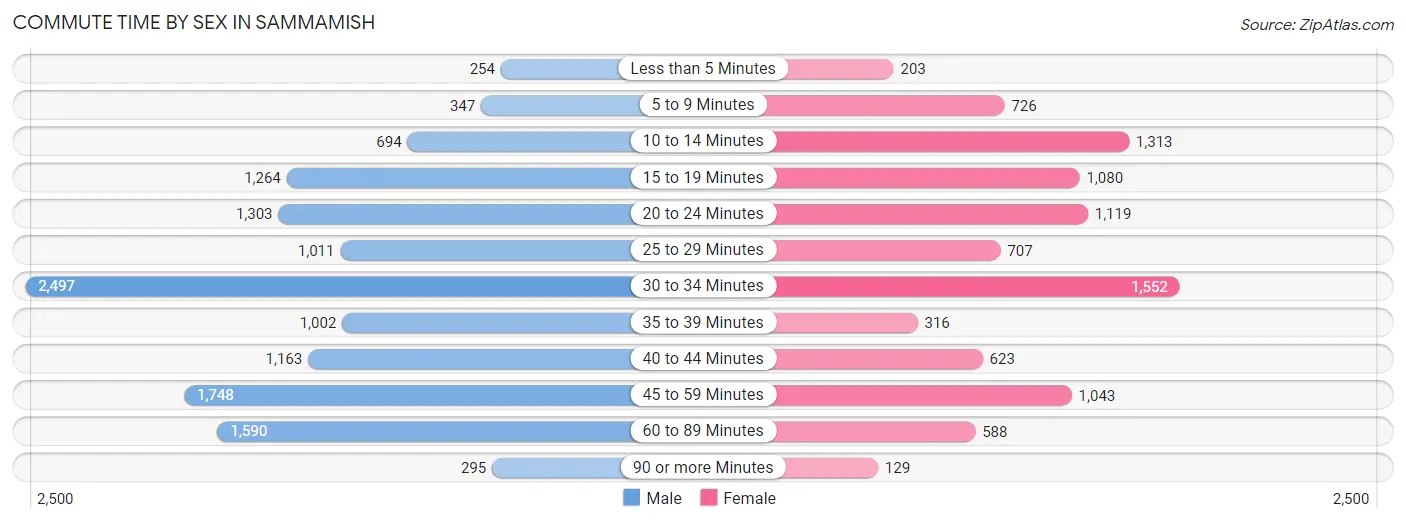
| Commute Time | Male | Female |
| Less than 5 Minutes | 254 (1.9%) | 203 (2.2%) |
| 5 to 9 Minutes | 347 (2.6%) | 726 (7.7%) |
| 10 to 14 Minutes | 694 (5.3%) | 1,313 (14.0%) |
| 15 to 19 Minutes | 1,264 (9.6%) | 1,080 (11.5%) |
| 20 to 24 Minutes | 1,303 (9.9%) | 1,119 (11.9%) |
| 25 to 29 Minutes | 1,011 (7.7%) | 707 (7.5%) |
| 30 to 34 Minutes | 2,497 (19.0%) | 1,552 (16.5%) |
| 35 to 39 Minutes | 1,002 (7.6%) | 316 (3.4%) |
| 40 to 44 Minutes | 1,163 (8.8%) | 623 (6.6%) |
| 45 to 59 Minutes | 1,748 (13.3%) | 1,043 (11.1%) |
| 60 to 89 Minutes | 1,590 (12.1%) | 588 (6.3%) |
| 90 or more Minutes | 295 (2.2%) | 129 (1.4%) |
Time of Departure to Work by Sex in Sammamish
The most frequent times of departure to work in Sammamish are 8:00 AM to 8:29 AM (1,824, 13.9%) for males and 8:00 AM to 8:29 AM (1,629, 17.3%) for females.
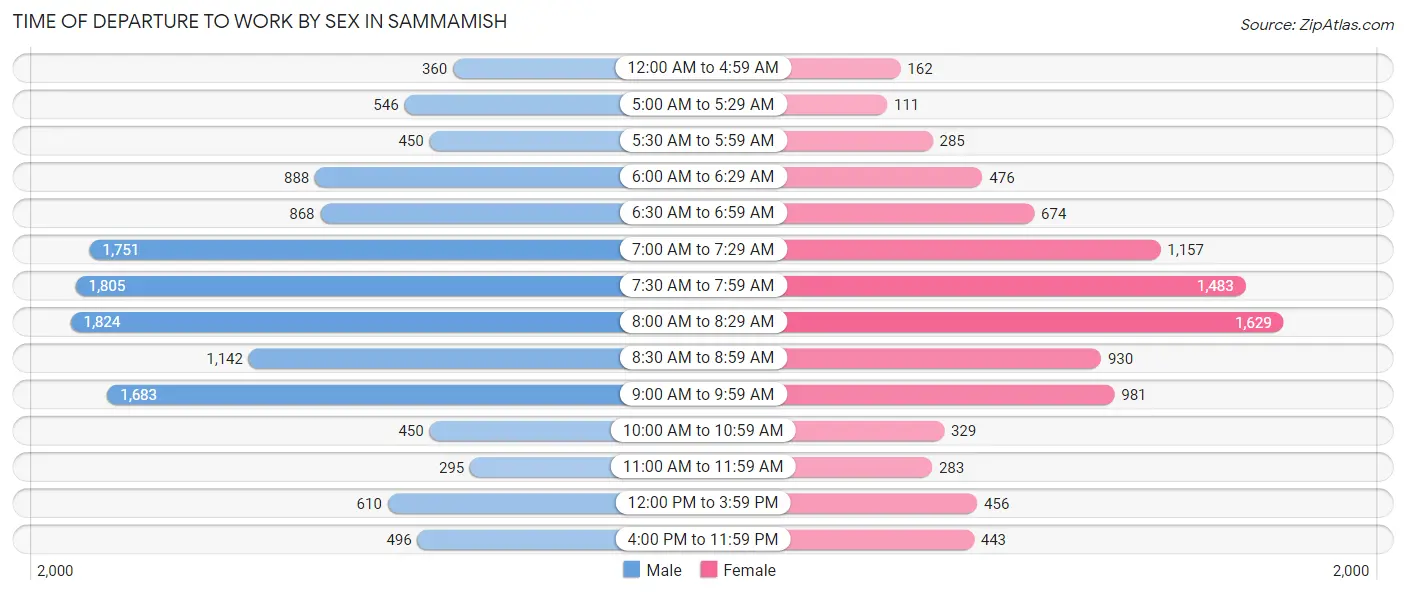
| Time of Departure | Male | Female |
| 12:00 AM to 4:59 AM | 360 (2.7%) | 162 (1.7%) |
| 5:00 AM to 5:29 AM | 546 (4.2%) | 111 (1.2%) |
| 5:30 AM to 5:59 AM | 450 (3.4%) | 285 (3.0%) |
| 6:00 AM to 6:29 AM | 888 (6.7%) | 476 (5.1%) |
| 6:30 AM to 6:59 AM | 868 (6.6%) | 674 (7.2%) |
| 7:00 AM to 7:29 AM | 1,751 (13.3%) | 1,157 (12.3%) |
| 7:30 AM to 7:59 AM | 1,805 (13.7%) | 1,483 (15.8%) |
| 8:00 AM to 8:29 AM | 1,824 (13.9%) | 1,629 (17.3%) |
| 8:30 AM to 8:59 AM | 1,142 (8.7%) | 930 (9.9%) |
| 9:00 AM to 9:59 AM | 1,683 (12.8%) | 981 (10.4%) |
| 10:00 AM to 10:59 AM | 450 (3.4%) | 329 (3.5%) |
| 11:00 AM to 11:59 AM | 295 (2.2%) | 283 (3.0%) |
| 12:00 PM to 3:59 PM | 610 (4.6%) | 456 (4.9%) |
| 4:00 PM to 11:59 PM | 496 (3.8%) | 443 (4.7%) |
| Total | 13,168 (100.0%) | 9,399 (100.0%) |
Housing Occupancy in Sammamish
Occupancy by Ownership in Sammamish
Of the total 22,258 dwellings in Sammamish, owner-occupied units account for 18,746 (84.2%), while renter-occupied units make up 3,512 (15.8%).
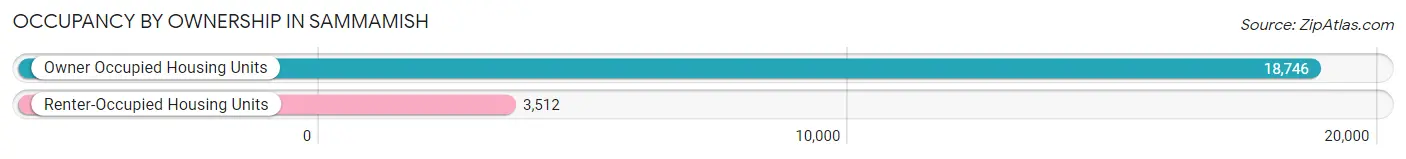
| Occupancy | # Housing Units | % Housing Units |
| Owner Occupied Housing Units | 18,746 | 84.2% |
| Renter-Occupied Housing Units | 3,512 | 15.8% |
| Total Occupied Housing Units | 22,258 | 100.0% |
Occupancy by Household Size in Sammamish
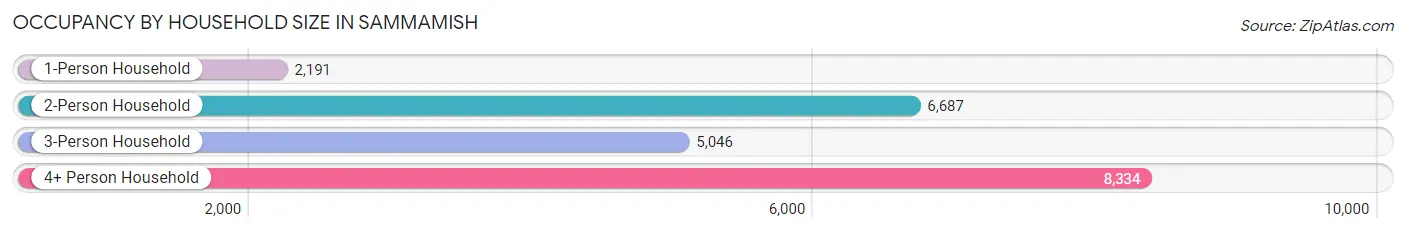
| Household Size | # Housing Units | % Housing Units |
| 1-Person Household | 2,191 | 9.8% |
| 2-Person Household | 6,687 | 30.0% |
| 3-Person Household | 5,046 | 22.7% |
| 4+ Person Household | 8,334 | 37.4% |
| Total Housing Units | 22,258 | 100.0% |
Occupancy by Ownership by Household Size in Sammamish
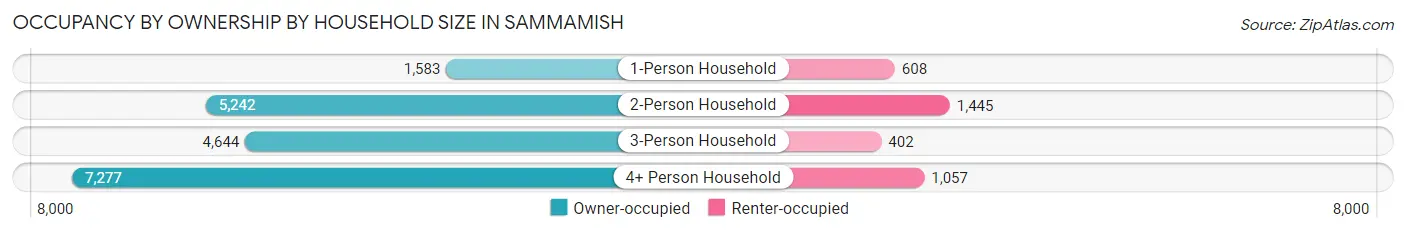
| Household Size | Owner-occupied | Renter-occupied |
| 1-Person Household | 1,583 (72.3%) | 608 (27.8%) |
| 2-Person Household | 5,242 (78.4%) | 1,445 (21.6%) |
| 3-Person Household | 4,644 (92.0%) | 402 (8.0%) |
| 4+ Person Household | 7,277 (87.3%) | 1,057 (12.7%) |
| Total Housing Units | 18,746 (84.2%) | 3,512 (15.8%) |
Occupancy by Educational Attainment in Sammamish
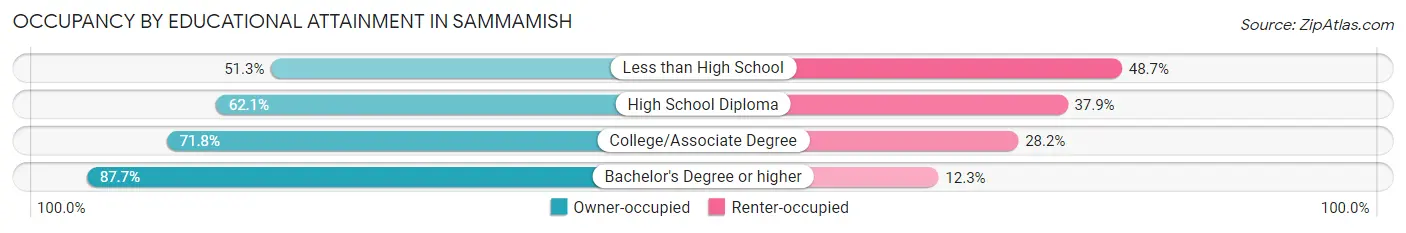
| Household Size | Owner-occupied | Renter-occupied |
| Less than High School | 79 (51.3%) | 75 (48.7%) |
| High School Diploma | 483 (62.1%) | 295 (37.9%) |
| College/Associate Degree | 2,314 (71.8%) | 907 (28.2%) |
| Bachelor's Degree or higher | 15,870 (87.7%) | 2,235 (12.3%) |
Occupancy by Age of Householder in Sammamish
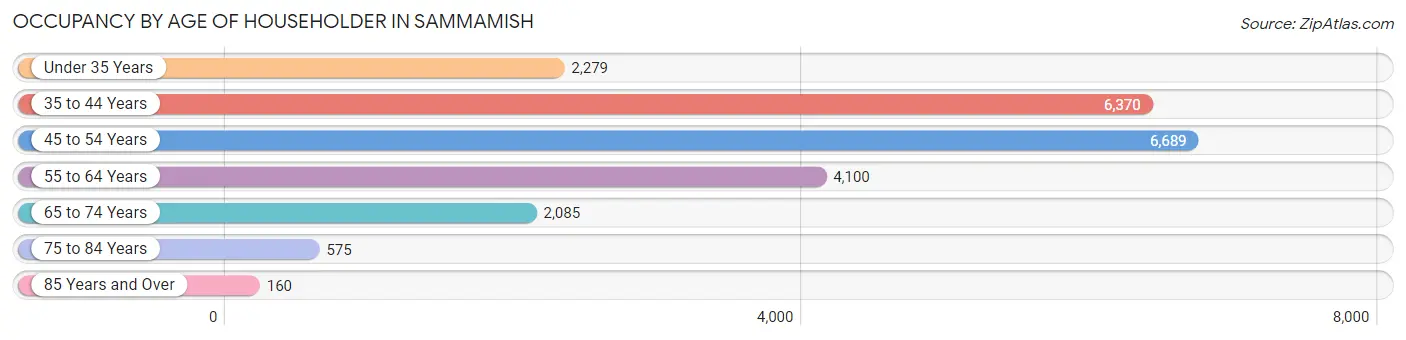
| Age Bracket | # Households | % Households |
| Under 35 Years | 2,279 | 10.2% |
| 35 to 44 Years | 6,370 | 28.6% |
| 45 to 54 Years | 6,689 | 30.0% |
| 55 to 64 Years | 4,100 | 18.4% |
| 65 to 74 Years | 2,085 | 9.4% |
| 75 to 84 Years | 575 | 2.6% |
| 85 Years and Over | 160 | 0.7% |
| Total | 22,258 | 100.0% |
Housing Finances in Sammamish
Median Income by Occupancy in Sammamish
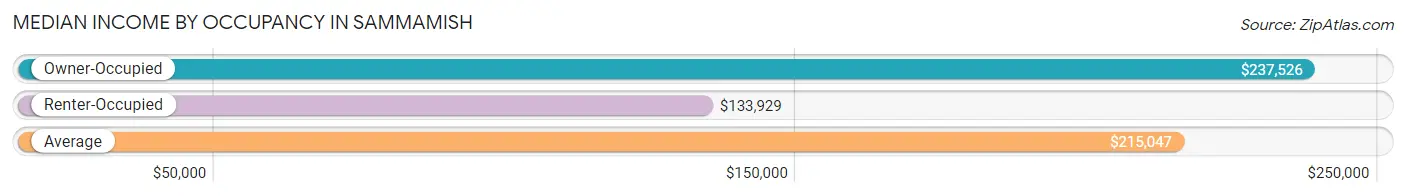
| Occupancy Type | # Households | Median Income |
| Owner-Occupied | 18,746 (84.2%) | $237,526 |
| Renter-Occupied | 3,512 (15.8%) | $133,929 |
| Average | 22,258 (100.0%) | $215,047 |
Occupancy by Householder Income Bracket in Sammamish
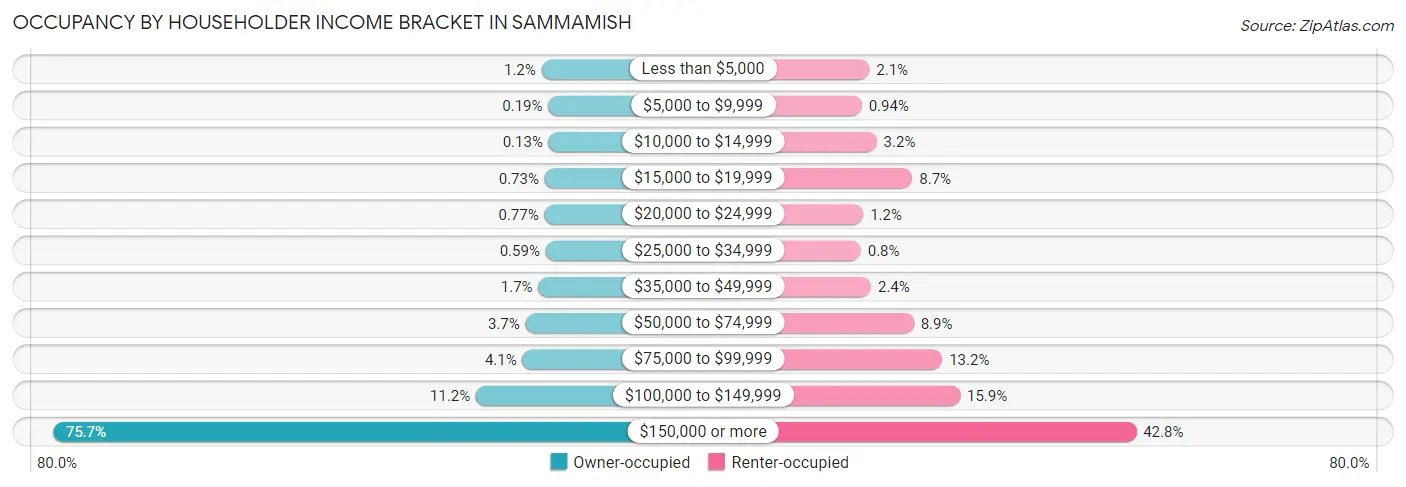
| Income Bracket | Owner-occupied | Renter-occupied |
| Less than $5,000 | 229 (1.2%) | 74 (2.1%) |
| $5,000 to $9,999 | 36 (0.2%) | 33 (0.9%) |
| $10,000 to $14,999 | 25 (0.1%) | 113 (3.2%) |
| $15,000 to $19,999 | 136 (0.7%) | 304 (8.7%) |
| $20,000 to $24,999 | 144 (0.8%) | 41 (1.2%) |
| $25,000 to $34,999 | 111 (0.6%) | 28 (0.8%) |
| $35,000 to $49,999 | 318 (1.7%) | 83 (2.4%) |
| $50,000 to $74,999 | 686 (3.7%) | 311 (8.9%) |
| $75,000 to $99,999 | 772 (4.1%) | 464 (13.2%) |
| $100,000 to $149,999 | 2,099 (11.2%) | 559 (15.9%) |
| $150,000 or more | 14,190 (75.7%) | 1,502 (42.8%) |
| Total | 18,746 (100.0%) | 3,512 (100.0%) |
Monthly Housing Cost Tiers in Sammamish
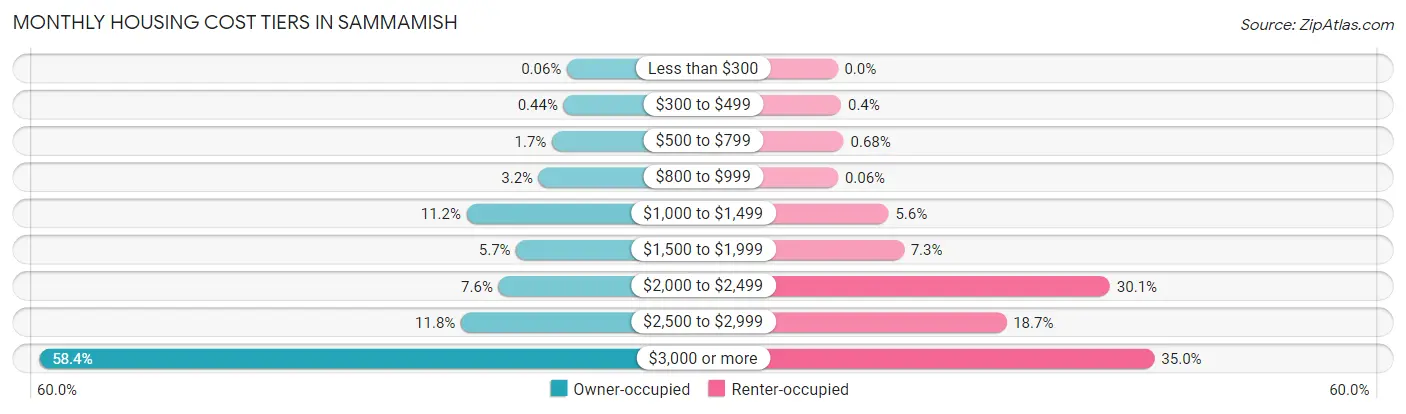
| Monthly Cost | Owner-occupied | Renter-occupied |
| Less than $300 | 12 (0.1%) | 0 (0.0%) |
| $300 to $499 | 83 (0.4%) | 14 (0.4%) |
| $500 to $799 | 323 (1.7%) | 24 (0.7%) |
| $800 to $999 | 596 (3.2%) | 2 (0.1%) |
| $1,000 to $1,499 | 2,090 (11.2%) | 198 (5.6%) |
| $1,500 to $1,999 | 1,062 (5.7%) | 257 (7.3%) |
| $2,000 to $2,499 | 1,429 (7.6%) | 1,057 (30.1%) |
| $2,500 to $2,999 | 2,207 (11.8%) | 655 (18.6%) |
| $3,000 or more | 10,944 (58.4%) | 1,230 (35.0%) |
| Total | 18,746 (100.0%) | 3,512 (100.0%) |
Physical Housing Characteristics in Sammamish
Housing Structures in Sammamish
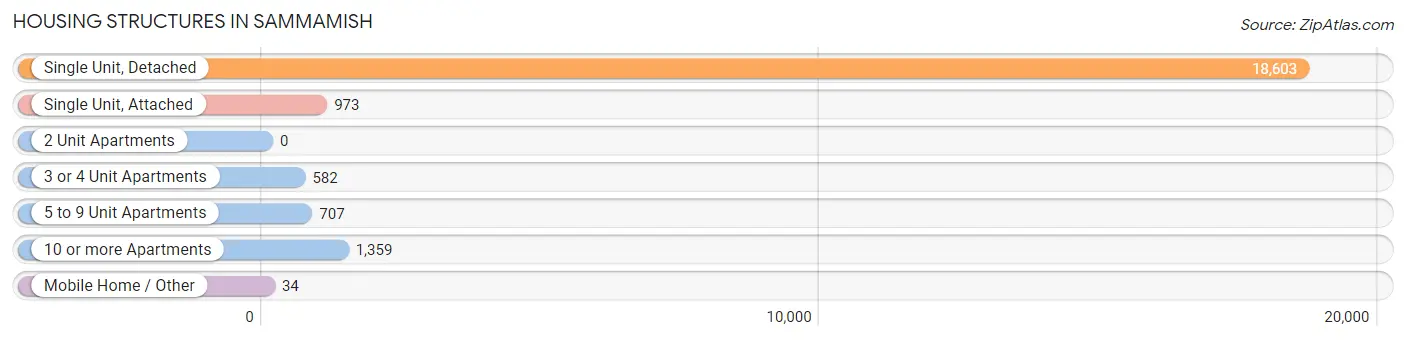
| Structure Type | # Housing Units | % Housing Units |
| Single Unit, Detached | 18,603 | 83.6% |
| Single Unit, Attached | 973 | 4.4% |
| 2 Unit Apartments | 0 | 0.0% |
| 3 or 4 Unit Apartments | 582 | 2.6% |
| 5 to 9 Unit Apartments | 707 | 3.2% |
| 10 or more Apartments | 1,359 | 6.1% |
| Mobile Home / Other | 34 | 0.2% |
| Total | 22,258 | 100.0% |
Housing Structures by Occupancy in Sammamish
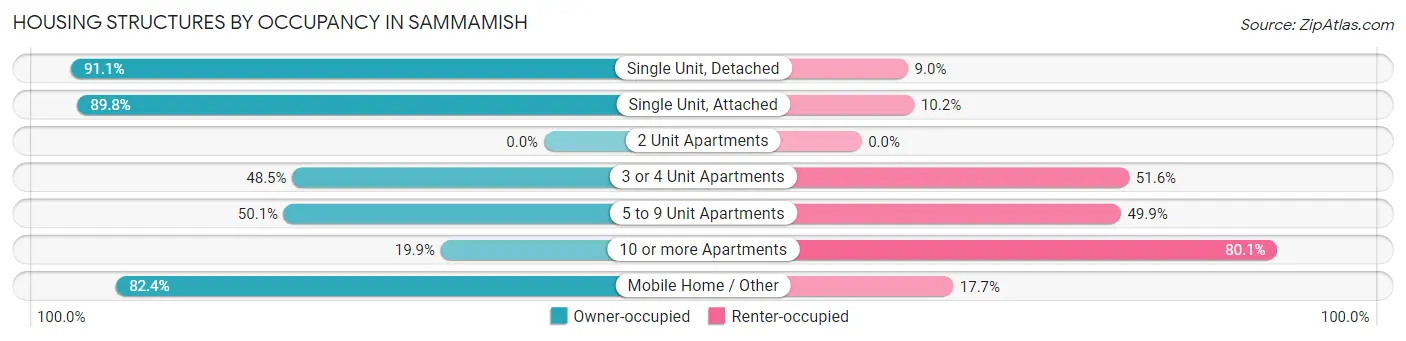
| Structure Type | Owner-occupied | Renter-occupied |
| Single Unit, Detached | 16,938 (91.0%) | 1,665 (8.9%) |
| Single Unit, Attached | 874 (89.8%) | 99 (10.2%) |
| 2 Unit Apartments | 0 (0.0%) | 0 (0.0%) |
| 3 or 4 Unit Apartments | 282 (48.4%) | 300 (51.5%) |
| 5 to 9 Unit Apartments | 354 (50.1%) | 353 (49.9%) |
| 10 or more Apartments | 270 (19.9%) | 1,089 (80.1%) |
| Mobile Home / Other | 28 (82.4%) | 6 (17.6%) |
| Total | 18,746 (84.2%) | 3,512 (15.8%) |
Housing Structures by Number of Rooms in Sammamish
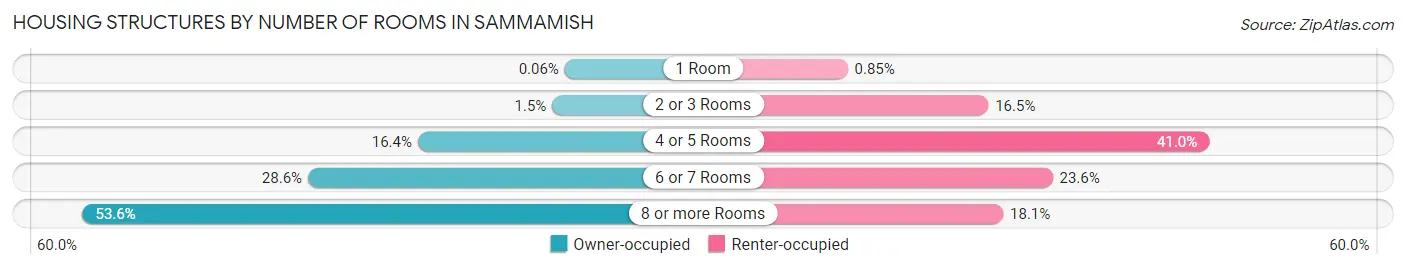
| Number of Rooms | Owner-occupied | Renter-occupied |
| 1 Room | 11 (0.1%) | 30 (0.9%) |
| 2 or 3 Rooms | 271 (1.5%) | 578 (16.5%) |
| 4 or 5 Rooms | 3,066 (16.4%) | 1,439 (41.0%) |
| 6 or 7 Rooms | 5,354 (28.6%) | 829 (23.6%) |
| 8 or more Rooms | 10,044 (53.6%) | 636 (18.1%) |
| Total | 18,746 (100.0%) | 3,512 (100.0%) |
Housing Structure by Heating Type in Sammamish
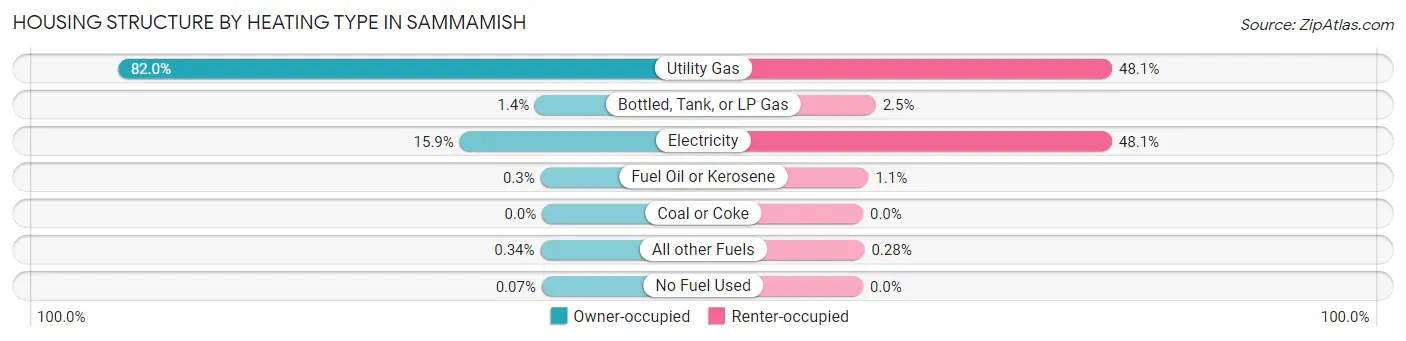
| Heating Type | Owner-occupied | Renter-occupied |
| Utility Gas | 15,372 (82.0%) | 1,690 (48.1%) |
| Bottled, Tank, or LP Gas | 253 (1.3%) | 86 (2.5%) |
| Electricity | 2,988 (15.9%) | 1,689 (48.1%) |
| Fuel Oil or Kerosene | 56 (0.3%) | 37 (1.1%) |
| Coal or Coke | 0 (0.0%) | 0 (0.0%) |
| All other Fuels | 64 (0.3%) | 10 (0.3%) |
| No Fuel Used | 13 (0.1%) | 0 (0.0%) |
| Total | 18,746 (100.0%) | 3,512 (100.0%) |
Household Vehicle Usage in Sammamish
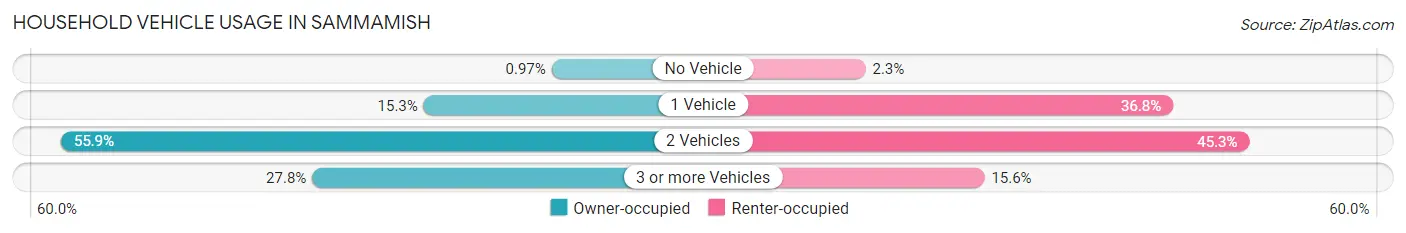
| Vehicles per Household | Owner-occupied | Renter-occupied |
| No Vehicle | 181 (1.0%) | 81 (2.3%) |
| 1 Vehicle | 2,869 (15.3%) | 1,291 (36.8%) |
| 2 Vehicles | 10,487 (55.9%) | 1,591 (45.3%) |
| 3 or more Vehicles | 5,209 (27.8%) | 549 (15.6%) |
| Total | 18,746 (100.0%) | 3,512 (100.0%) |
Real Estate & Mortgages in Sammamish
Real Estate and Mortgage Overview in Sammamish
| Characteristic | Without Mortgage | With Mortgage |
| Housing Units | 4,125 | 14,621 |
| Median Property Value | $1,132,200 | $1,141,200 |
| Median Household Income | $180,750 | $11,746 |
| Monthly Housing Costs | $1,262 | $10,758 |
| Real Estate Taxes | $9,523 | $124 |
Property Value by Mortgage Status in Sammamish
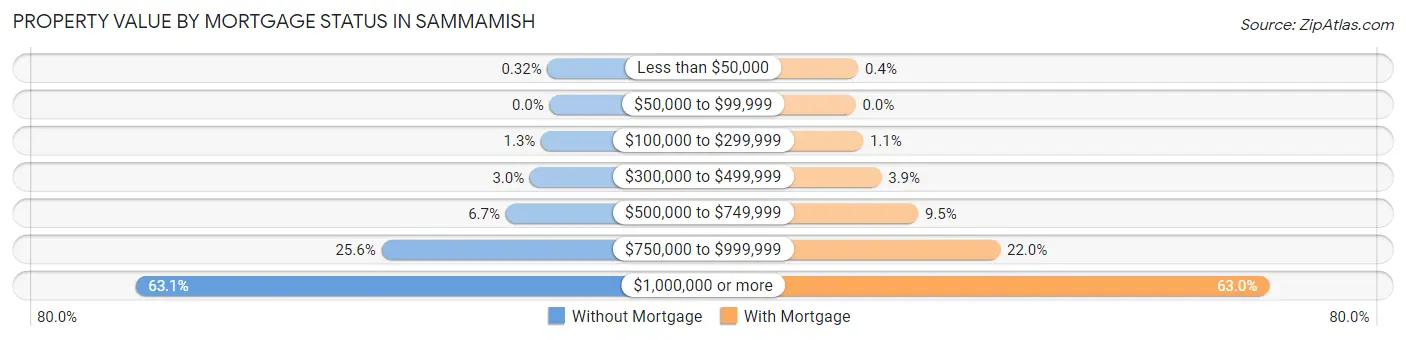
| Property Value | Without Mortgage | With Mortgage |
| Less than $50,000 | 13 (0.3%) | 58 (0.4%) |
| $50,000 to $99,999 | 0 (0.0%) | 0 (0.0%) |
| $100,000 to $299,999 | 53 (1.3%) | 165 (1.1%) |
| $300,000 to $499,999 | 123 (3.0%) | 573 (3.9%) |
| $500,000 to $749,999 | 275 (6.7%) | 1,390 (9.5%) |
| $750,000 to $999,999 | 1,057 (25.6%) | 3,220 (22.0%) |
| $1,000,000 or more | 2,604 (63.1%) | 9,215 (63.0%) |
| Total | 4,125 (100.0%) | 14,621 (100.0%) |
Household Income by Mortgage Status in Sammamish
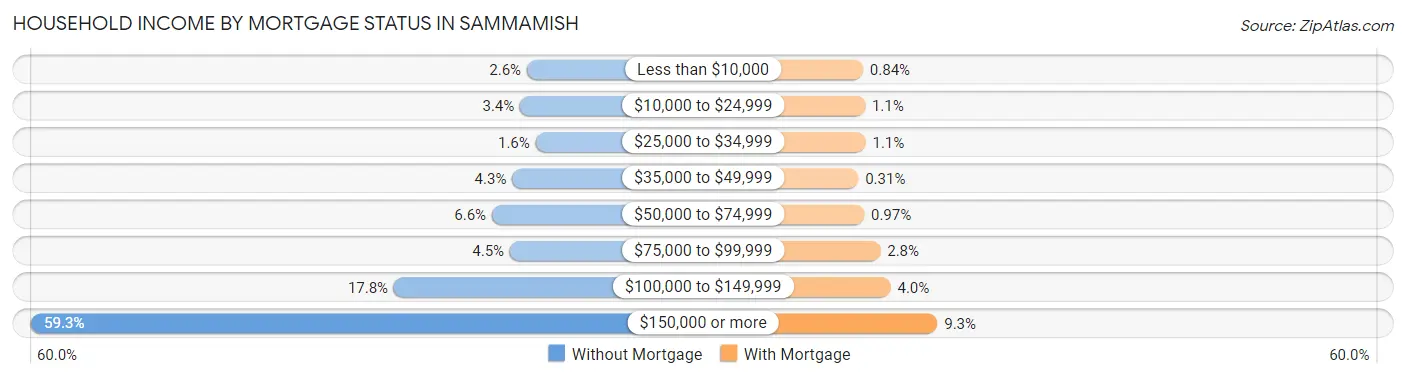
| Household Income | Without Mortgage | With Mortgage |
| Less than $10,000 | 107 (2.6%) | 123 (0.8%) |
| $10,000 to $24,999 | 139 (3.4%) | 158 (1.1%) |
| $25,000 to $34,999 | 66 (1.6%) | 166 (1.1%) |
| $35,000 to $49,999 | 176 (4.3%) | 45 (0.3%) |
| $50,000 to $74,999 | 272 (6.6%) | 142 (1.0%) |
| $75,000 to $99,999 | 187 (4.5%) | 414 (2.8%) |
| $100,000 to $149,999 | 734 (17.8%) | 585 (4.0%) |
| $150,000 or more | 2,444 (59.3%) | 1,365 (9.3%) |
| Total | 4,125 (100.0%) | 14,621 (100.0%) |
Property Value to Household Income Ratio in Sammamish
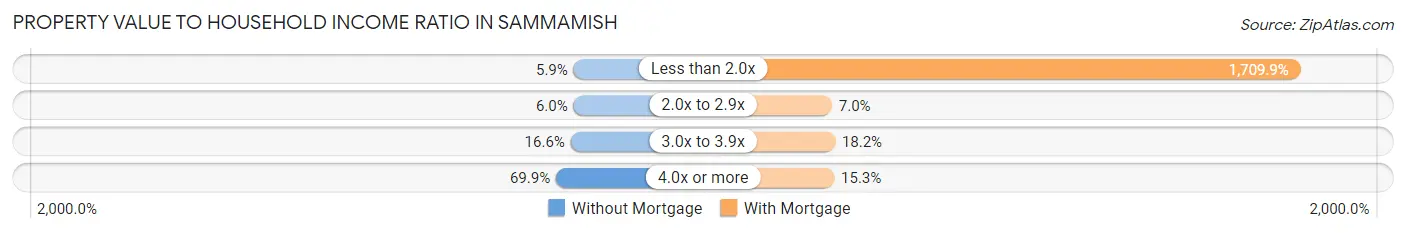
| Value-to-Income Ratio | Without Mortgage | With Mortgage |
| Less than 2.0x | 243 (5.9%) | 250,001 (1,709.9%) |
| 2.0x to 2.9x | 248 (6.0%) | 1,019 (7.0%) |
| 3.0x to 3.9x | 683 (16.6%) | 2,664 (18.2%) |
| 4.0x or more | 2,885 (69.9%) | 2,239 (15.3%) |
| Total | 4,125 (100.0%) | 14,621 (100.0%) |
Real Estate Taxes by Mortgage Status in Sammamish
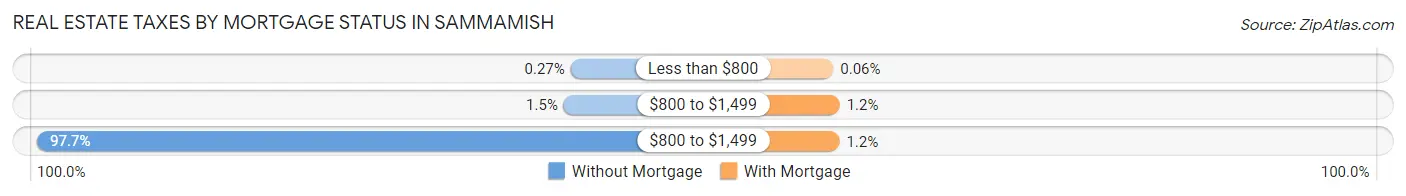
| Property Taxes | Without Mortgage | With Mortgage |
| Less than $800 | 11 (0.3%) | 9 (0.1%) |
| $800 to $1,499 | 63 (1.5%) | 179 (1.2%) |
| $800 to $1,499 | 4,031 (97.7%) | 172 (1.2%) |
| Total | 4,125 (100.0%) | 14,621 (100.0%) |
Health & Disability in Sammamish
Health Insurance Coverage by Age in Sammamish
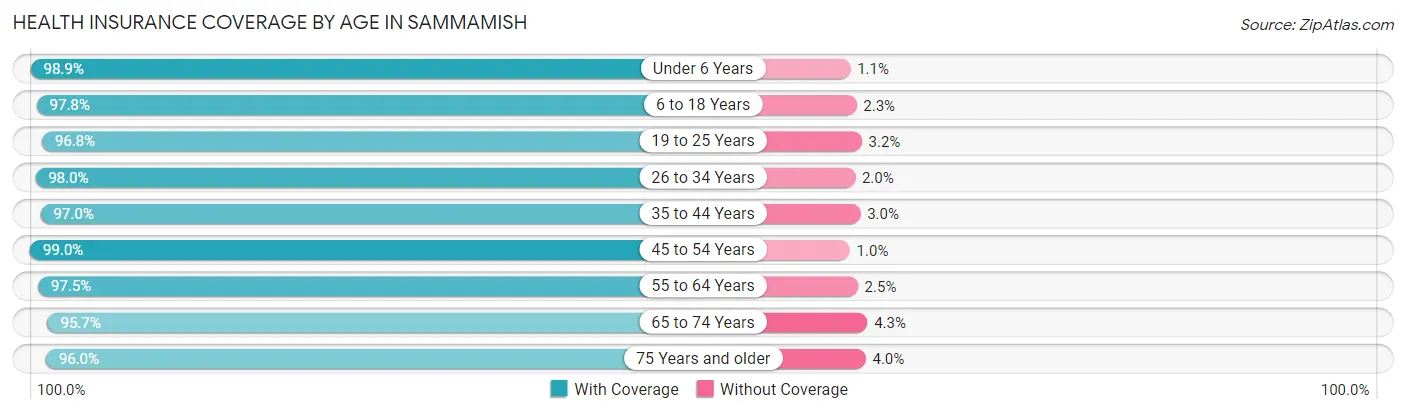
| Age Bracket | With Coverage | Without Coverage |
| Under 6 Years | 4,977 (98.9%) | 56 (1.1%) |
| 6 to 18 Years | 15,023 (97.8%) | 346 (2.2%) |
| 19 to 25 Years | 2,738 (96.8%) | 91 (3.2%) |
| 26 to 34 Years | 5,180 (98.0%) | 105 (2.0%) |
| 35 to 44 Years | 11,907 (97.0%) | 364 (3.0%) |
| 45 to 54 Years | 12,516 (99.0%) | 127 (1.0%) |
| 55 to 64 Years | 7,396 (97.5%) | 189 (2.5%) |
| 65 to 74 Years | 3,779 (95.7%) | 169 (4.3%) |
| 75 Years and older | 1,527 (96.0%) | 63 (4.0%) |
| Total | 65,043 (97.7%) | 1,510 (2.3%) |
Health Insurance Coverage by Citizenship Status in Sammamish
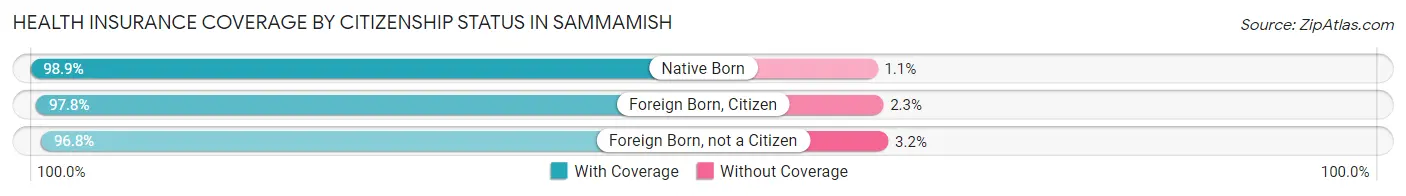
| Citizenship Status | With Coverage | Without Coverage |
| Native Born | 4,977 (98.9%) | 56 (1.1%) |
| Foreign Born, Citizen | 15,023 (97.8%) | 346 (2.2%) |
| Foreign Born, not a Citizen | 2,738 (96.8%) | 91 (3.2%) |
Health Insurance Coverage by Household Income in Sammamish
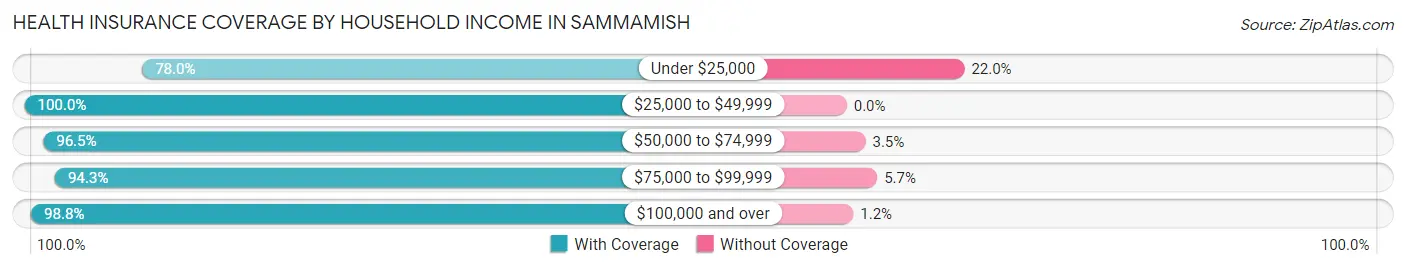
| Household Income | With Coverage | Without Coverage |
| Under $25,000 | 2,016 (78.0%) | 570 (22.0%) |
| $25,000 to $49,999 | 1,156 (100.0%) | 0 (0.0%) |
| $50,000 to $74,999 | 2,033 (96.5%) | 74 (3.5%) |
| $75,000 to $99,999 | 2,399 (94.3%) | 145 (5.7%) |
| $100,000 and over | 57,325 (98.8%) | 715 (1.2%) |
Public vs Private Health Insurance Coverage by Age in Sammamish
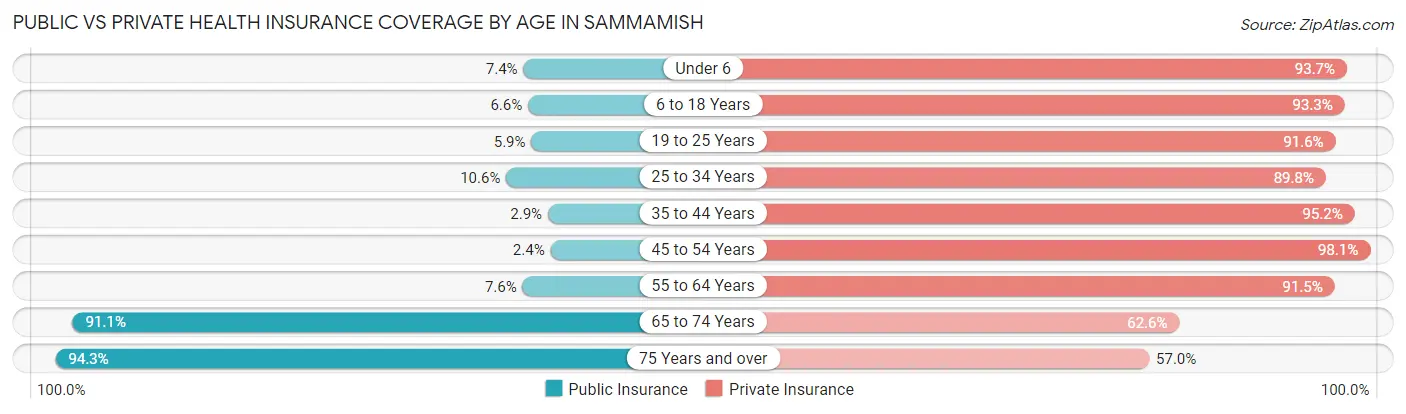
| Age Bracket | Public Insurance | Private Insurance |
| Under 6 | 373 (7.4%) | 4,718 (93.7%) |
| 6 to 18 Years | 1,006 (6.6%) | 14,343 (93.3%) |
| 19 to 25 Years | 168 (5.9%) | 2,592 (91.6%) |
| 25 to 34 Years | 560 (10.6%) | 4,747 (89.8%) |
| 35 to 44 Years | 351 (2.9%) | 11,679 (95.2%) |
| 45 to 54 Years | 302 (2.4%) | 12,397 (98.1%) |
| 55 to 64 Years | 575 (7.6%) | 6,938 (91.5%) |
| 65 to 74 Years | 3,597 (91.1%) | 2,473 (62.6%) |
| 75 Years and over | 1,499 (94.3%) | 907 (57.0%) |
| Total | 8,431 (12.7%) | 60,794 (91.3%) |
Disability Status by Sex by Age in Sammamish
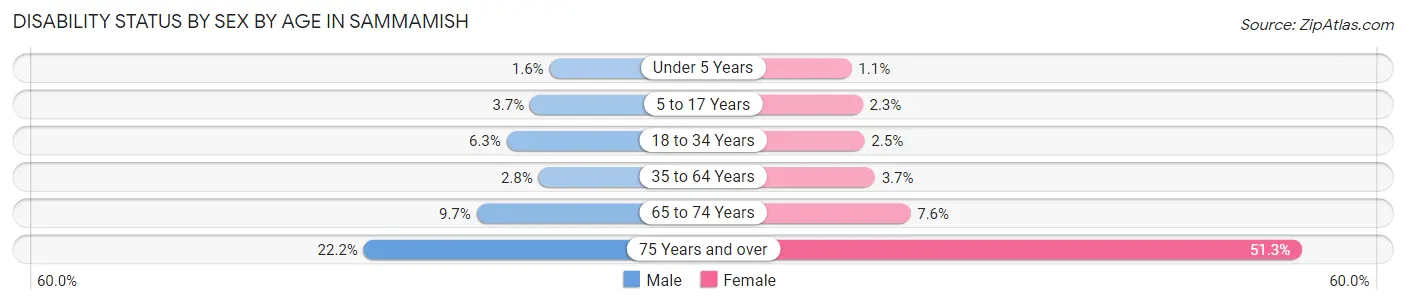
| Age Bracket | Male | Female |
| Under 5 Years | 28 (1.5%) | 24 (1.1%) |
| 5 to 17 Years | 275 (3.7%) | 188 (2.3%) |
| 18 to 34 Years | 273 (6.3%) | 116 (2.5%) |
| 35 to 64 Years | 453 (2.8%) | 591 (3.7%) |
| 65 to 74 Years | 189 (9.7%) | 152 (7.6%) |
| 75 Years and over | 141 (22.2%) | 490 (51.3%) |
Disability Class by Sex by Age in Sammamish
Disability Class: Hearing Difficulty
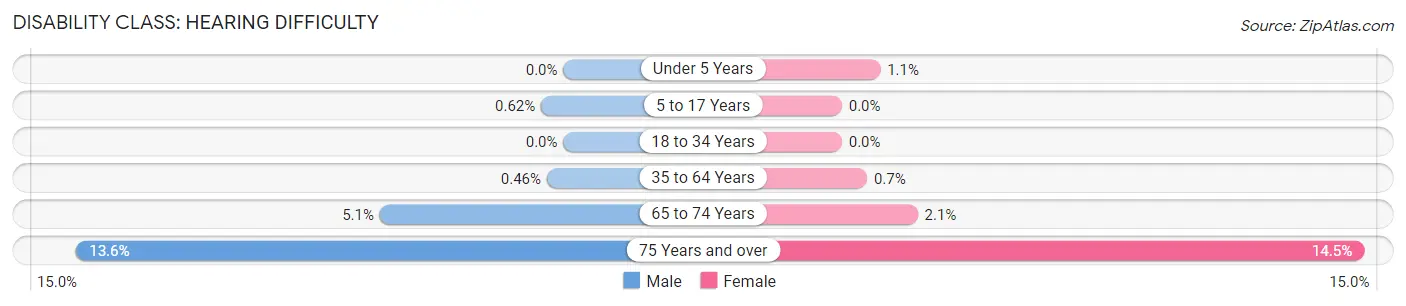
| Age Bracket | Male | Female |
| Under 5 Years | 0 (0.0%) | 24 (1.1%) |
| 5 to 17 Years | 46 (0.6%) | 0 (0.0%) |
| 18 to 34 Years | 0 (0.0%) | 0 (0.0%) |
| 35 to 64 Years | 75 (0.5%) | 112 (0.7%) |
| 65 to 74 Years | 100 (5.1%) | 42 (2.1%) |
| 75 Years and over | 86 (13.6%) | 139 (14.5%) |
Disability Class: Vision Difficulty
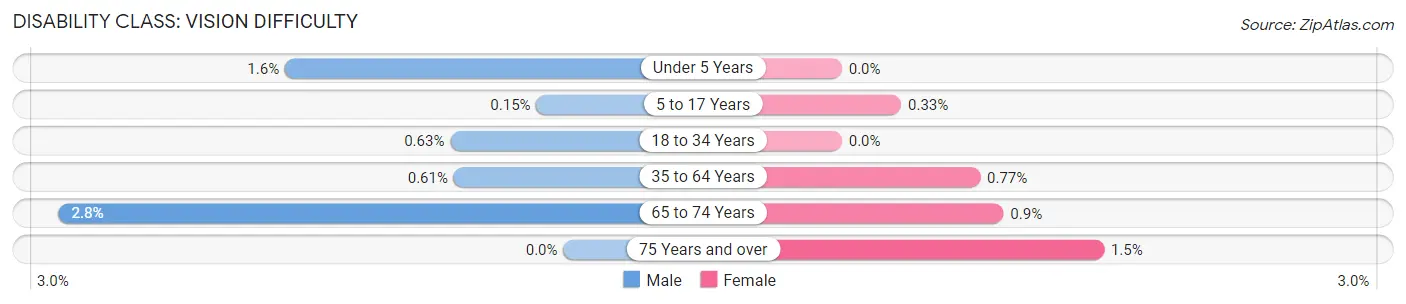
| Age Bracket | Male | Female |
| Under 5 Years | 28 (1.5%) | 0 (0.0%) |
| 5 to 17 Years | 11 (0.2%) | 27 (0.3%) |
| 18 to 34 Years | 27 (0.6%) | 0 (0.0%) |
| 35 to 64 Years | 100 (0.6%) | 124 (0.8%) |
| 65 to 74 Years | 55 (2.8%) | 18 (0.9%) |
| 75 Years and over | 0 (0.0%) | 14 (1.5%) |
Disability Class: Cognitive Difficulty
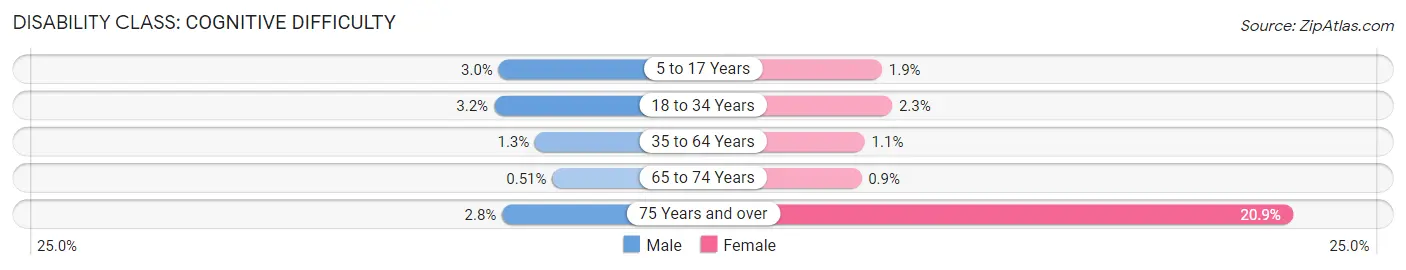
| Age Bracket | Male | Female |
| 5 to 17 Years | 222 (3.0%) | 151 (1.9%) |
| 18 to 34 Years | 139 (3.2%) | 107 (2.3%) |
| 35 to 64 Years | 215 (1.3%) | 171 (1.1%) |
| 65 to 74 Years | 10 (0.5%) | 18 (0.9%) |
| 75 Years and over | 18 (2.8%) | 200 (20.9%) |
Disability Class: Ambulatory Difficulty
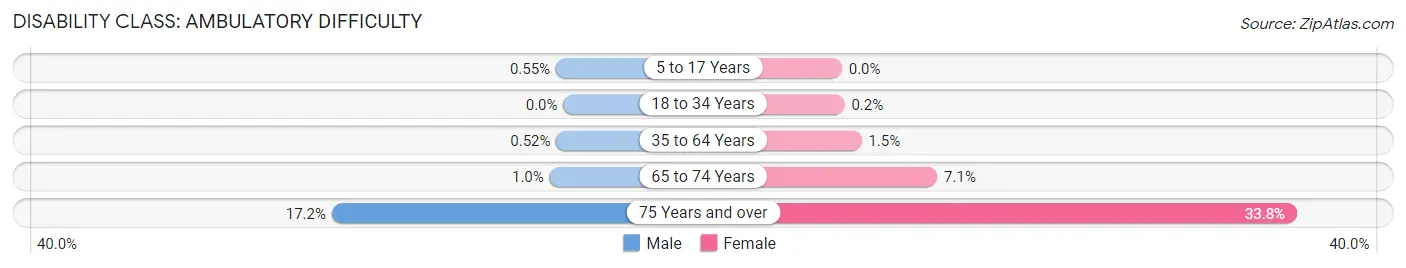
| Age Bracket | Male | Female |
| 5 to 17 Years | 41 (0.5%) | 0 (0.0%) |
| 18 to 34 Years | 0 (0.0%) | 9 (0.2%) |
| 35 to 64 Years | 86 (0.5%) | 235 (1.5%) |
| 65 to 74 Years | 20 (1.0%) | 141 (7.1%) |
| 75 Years and over | 109 (17.2%) | 323 (33.8%) |
Disability Class: Self-Care Difficulty
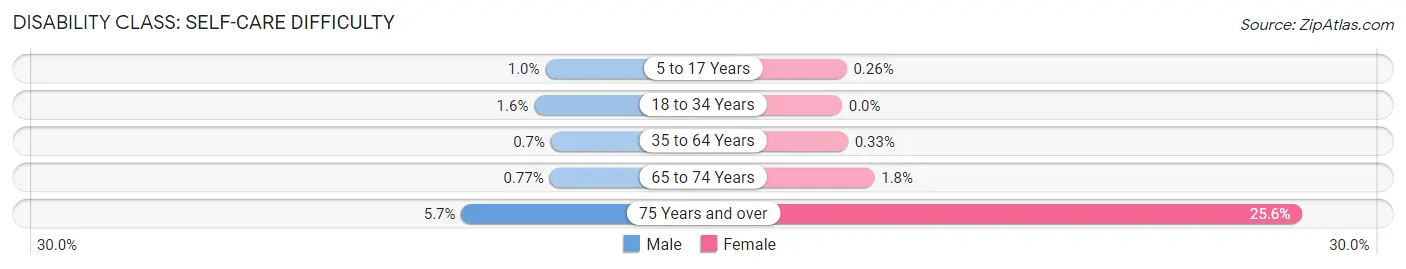
| Age Bracket | Male | Female |
| 5 to 17 Years | 74 (1.0%) | 21 (0.3%) |
| 18 to 34 Years | 70 (1.6%) | 0 (0.0%) |
| 35 to 64 Years | 115 (0.7%) | 53 (0.3%) |
| 65 to 74 Years | 15 (0.8%) | 36 (1.8%) |
| 75 Years and over | 36 (5.7%) | 245 (25.6%) |
Technology Access in Sammamish
Computing Device Access in Sammamish
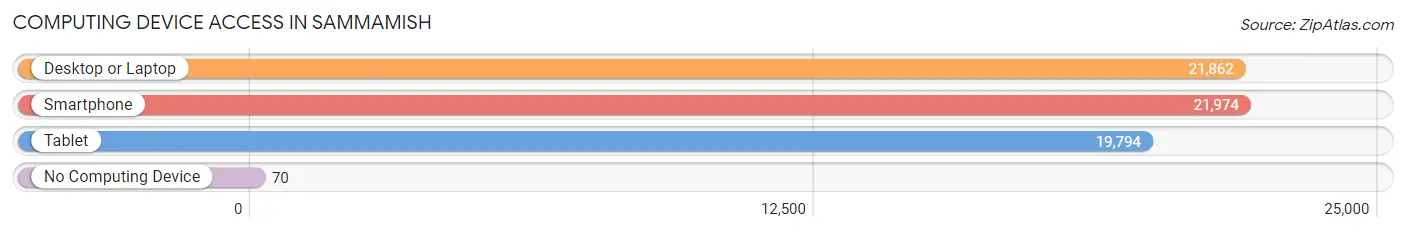
| Device Type | # Households | % Households |
| Desktop or Laptop | 21,862 | 98.2% |
| Smartphone | 21,974 | 98.7% |
| Tablet | 19,794 | 88.9% |
| No Computing Device | 70 | 0.3% |
| Total | 22,258 | 100.0% |
Internet Access in Sammamish
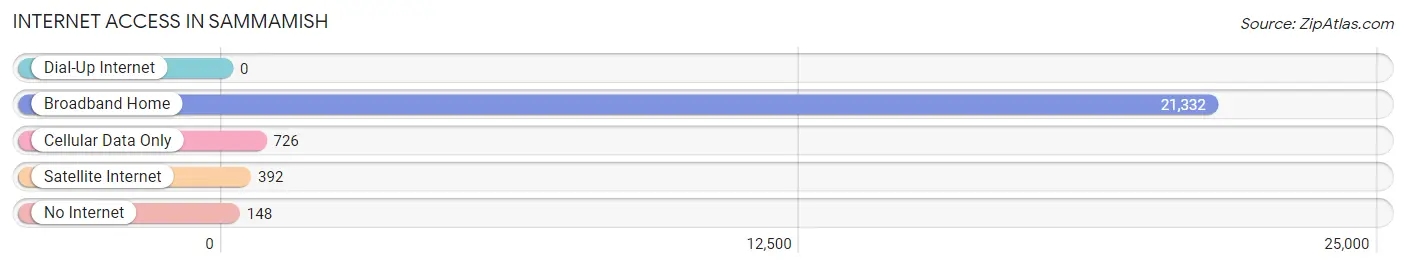
| Internet Type | # Households | % Households |
| Dial-Up Internet | 0 | 0.0% |
| Broadband Home | 21,332 | 95.8% |
| Cellular Data Only | 726 | 3.3% |
| Satellite Internet | 392 | 1.8% |
| No Internet | 148 | 0.7% |
| Total | 22,258 | 100.0% |
Sammamish Summary
Sammamish is a city located in King County, Washington, United States. It is located east of Seattle and is part of the Seattle metropolitan area. As of the 2010 census, the population was 45,780, making it the 15th largest city in the state.
History
The area that is now Sammamish was originally inhabited by the Sammamish people, a Native American tribe of the Coast Salish people. The Sammamish people lived in the area for thousands of years before the arrival of European settlers. The first European settlers arrived in the area in the late 1800s, and the area was officially incorporated as the City of Sammamish in 1999.
Geography
Sammamish is located in King County, Washington, United States. It is located east of Seattle and is part of the Seattle metropolitan area. The city is situated on the Sammamish Plateau, a plateau that rises from the Puget Sound lowlands to the Cascade Mountains. The city is bordered by Lake Sammamish to the west, Issaquah to the south, Redmond to the north, and the Snoqualmie Valley to the east.
Economy
Sammamish is home to a variety of businesses, including technology, retail, and professional services. The city is also home to several large employers, including Microsoft, Nintendo, and T-Mobile. The city is also home to several shopping centers, including the Sammamish Town Center and the Redmond Town Center.
Demographics
As of the 2010 census, the population of Sammamish was 45,780. The racial makeup of the city was 75.3% White, 8.2% Asian, 6.2% Hispanic or Latino, 4.2% African American, 0.7% Native American, and 5.4% from other races. The median household income was $118,945, and the median family income was $136,945.
Conclusion
Sammamish is a city located in King County, Washington, United States. It is located east of Seattle and is part of the Seattle metropolitan area. As of the 2010 census, the population was 45,780, making it the 15th largest city in the state. The city is home to a variety of businesses, including technology, retail, and professional services. The racial makeup of the city was 75.3% White, 8.2% Asian, 6.2% Hispanic or Latino, 4.2% African American, 0.7% Native American, and 5.4% from other races. The median household income was $118,945, and the median family income was $136,945. Sammamish is a vibrant city with a rich history and a diverse population.
Common Questions
What is Per Capita Income in Sammamish?
Per Capita income in Sammamish is $88,476.
What is the Median Family Income in Sammamish?
Median Family Income in Sammamish is $232,188.
What is the Median Household income in Sammamish?
Median Household Income in Sammamish is $215,047.
What is Income or Wage Gap in Sammamish?
Income or Wage Gap in Sammamish is 57.4%.
Women in Sammamish earn 42.6 cents for every dollar earned by a man.
What is Family Income Deficit in Sammamish?
Family Income Deficit in Sammamish is $11,392.
Families that are below poverty line in Sammamish earn $11,392 less on average than the poverty threshold level.
What is Inequality or Gini Index in Sammamish?
Inequality or Gini Index in Sammamish is 0.39.
What is the Total Population of Sammamish?
Total Population of Sammamish is 66,586.
What is the Total Male Population of Sammamish?
Total Male Population of Sammamish is 32,529.
What is the Total Female Population of Sammamish?
Total Female Population of Sammamish is 34,057.
What is the Ratio of Males per 100 Females in Sammamish?
There are 95.51 Males per 100 Females in Sammamish.
What is the Ratio of Females per 100 Males in Sammamish?
There are 104.70 Females per 100 Males in Sammamish.
What is the Median Population Age in Sammamish?
Median Population Age in Sammamish is 39.3 Years.
What is the Average Family Size in Sammamish
Average Family Size in Sammamish is 3.2 People.
What is the Average Household Size in Sammamish
Average Household Size in Sammamish is 3.0 People.
How Large is the Labor Force in Sammamish?
There are 34,345 People in the Labor Forcein in Sammamish.
What is the Percentage of People in the Labor Force in Sammamish?
69.2% of People are in the Labor Force in Sammamish.
What is the Unemployment Rate in Sammamish?
Unemployment Rate in Sammamish is 2.8%.