North Bend, WA Map & Demographics
North Bend Map
North Bend Overview
$72,456
PER CAPITA INCOME
$193,603
AVG FAMILY INCOME
$171,078
AVG HOUSEHOLD INCOME
49.1%
WAGE / INCOME GAP [ % ]
50.9¢/ $1
WAGE / INCOME GAP [ $ ]
0.46
INEQUALITY / GINI INDEX
7,549
TOTAL POPULATION
3,785
MALE POPULATION
3,764
FEMALE POPULATION
100.56
MALES / 100 FEMALES
99.45
FEMALES / 100 MALES
40.3
MEDIAN AGE
3.1
AVG FAMILY SIZE
2.7
AVG HOUSEHOLD SIZE
4,236
LABOR FORCE [ PEOPLE ]
71.0%
PERCENT IN LABOR FORCE
2.0%
UNEMPLOYMENT RATE
North Bend Zip Codes
North Bend Area Codes
Income in North Bend
Income Overview in North Bend
Per Capita Income in North Bend is $72,456, while median incomes of families and households are $193,603 and $171,078 respectively.
| Characteristic | Number | Measure |
| Per Capita Income | 7,549 | $72,456 |
| Median Family Income | 2,090 | $193,603 |
| Mean Family Income | 2,090 | $230,280 |
| Median Household Income | 2,797 | $171,078 |
| Mean Household Income | 2,797 | $192,327 |
| Income Deficit | 2,090 | $0 |
| Wage / Income Gap (%) | 7,549 | 49.08% |
| Wage / Income Gap ($) | 7,549 | 50.92¢ per $1 |
| Gini / Inequality Index | 7,549 | 0.46 |
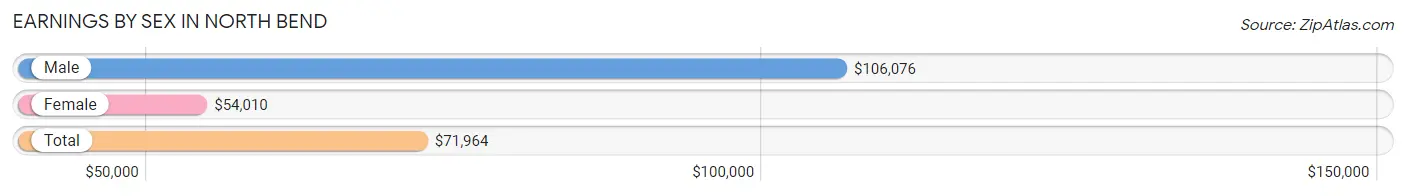
Earnings by Sex in North Bend
Average Earnings in North Bend are $71,964, $106,076 for men and $54,010 for women, a difference of 49.1%.
| Sex | Number | Average Earnings |
| Male | 2,406 (54.2%) | $106,076 |
| Female | 2,032 (45.8%) | $54,010 |
| Total | 4,438 (100.0%) | $71,964 |
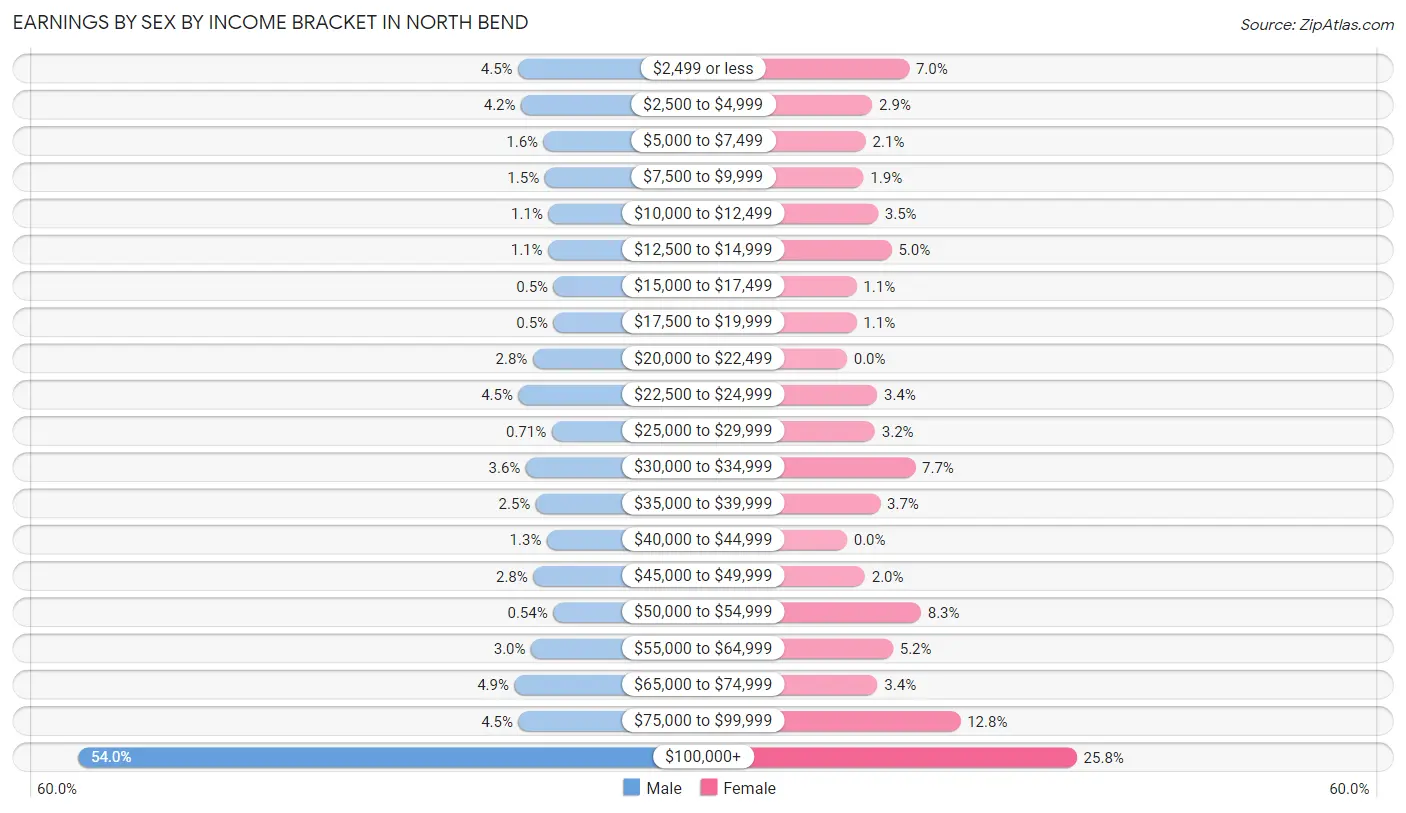
Earnings by Sex by Income Bracket in North Bend
The most common earnings brackets in North Bend are $100,000+ for men (1,299 | 54.0%) and $100,000+ for women (525 | 25.8%).
| Income | Male | Female |
| $2,499 or less | 108 (4.5%) | 142 (7.0%) |
| $2,500 to $4,999 | 100 (4.2%) | 58 (2.9%) |
| $5,000 to $7,499 | 39 (1.6%) | 43 (2.1%) |
| $7,500 to $9,999 | 36 (1.5%) | 38 (1.9%) |
| $10,000 to $12,499 | 26 (1.1%) | 71 (3.5%) |
| $12,500 to $14,999 | 27 (1.1%) | 102 (5.0%) |
| $15,000 to $17,499 | 12 (0.5%) | 22 (1.1%) |
| $17,500 to $19,999 | 12 (0.5%) | 22 (1.1%) |
| $20,000 to $22,499 | 68 (2.8%) | 0 (0.0%) |
| $22,500 to $24,999 | 107 (4.4%) | 69 (3.4%) |
| $25,000 to $29,999 | 17 (0.7%) | 64 (3.2%) |
| $30,000 to $34,999 | 87 (3.6%) | 156 (7.7%) |
| $35,000 to $39,999 | 60 (2.5%) | 76 (3.7%) |
| $40,000 to $44,999 | 30 (1.3%) | 0 (0.0%) |
| $45,000 to $49,999 | 67 (2.8%) | 41 (2.0%) |
| $50,000 to $54,999 | 13 (0.5%) | 169 (8.3%) |
| $55,000 to $64,999 | 73 (3.0%) | 105 (5.2%) |
| $65,000 to $74,999 | 118 (4.9%) | 70 (3.4%) |
| $75,000 to $99,999 | 107 (4.4%) | 259 (12.8%) |
| $100,000+ | 1,299 (54.0%) | 525 (25.8%) |
| Total | 2,406 (100.0%) | 2,032 (100.0%) |
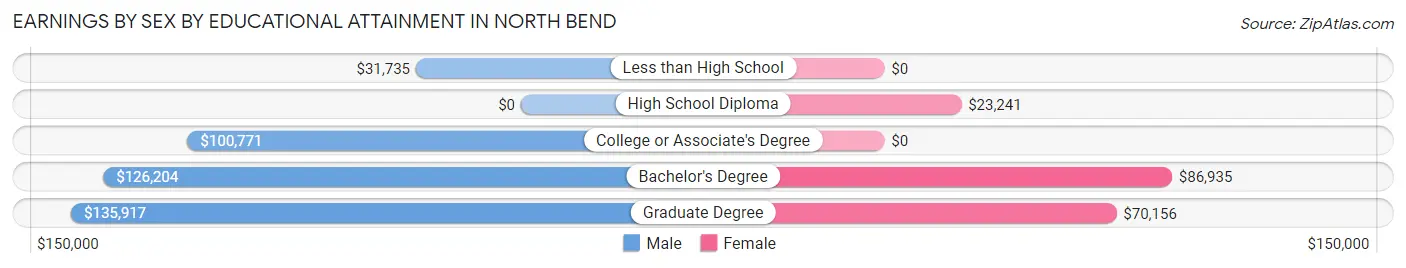
Earnings by Sex by Educational Attainment in North Bend
Average earnings in North Bend are $113,992 for men and $62,500 for women, a difference of 45.2%. Men with an educational attainment of graduate degree enjoy the highest average annual earnings of $135,917, while those with less than high school education earn the least with $31,735. Women with an educational attainment of bachelor's degree earn the most with the average annual earnings of $86,935, while those with high school diploma education have the smallest earnings of $23,241.
| Educational Attainment | Male Income | Female Income |
| Less than High School | $31,735 | $0 |
| High School Diploma | - | - |
| College or Associate's Degree | $100,771 | $0 |
| Bachelor's Degree | $126,204 | $86,935 |
| Graduate Degree | $135,917 | $70,156 |
| Total | $113,992 | $62,500 |
Family Income in North Bend
Family Income Brackets in North Bend
According to the North Bend family income data, there are 1,026 families falling into the $200,000+ income range, which is the most common income bracket and makes up 49.1% of all families.
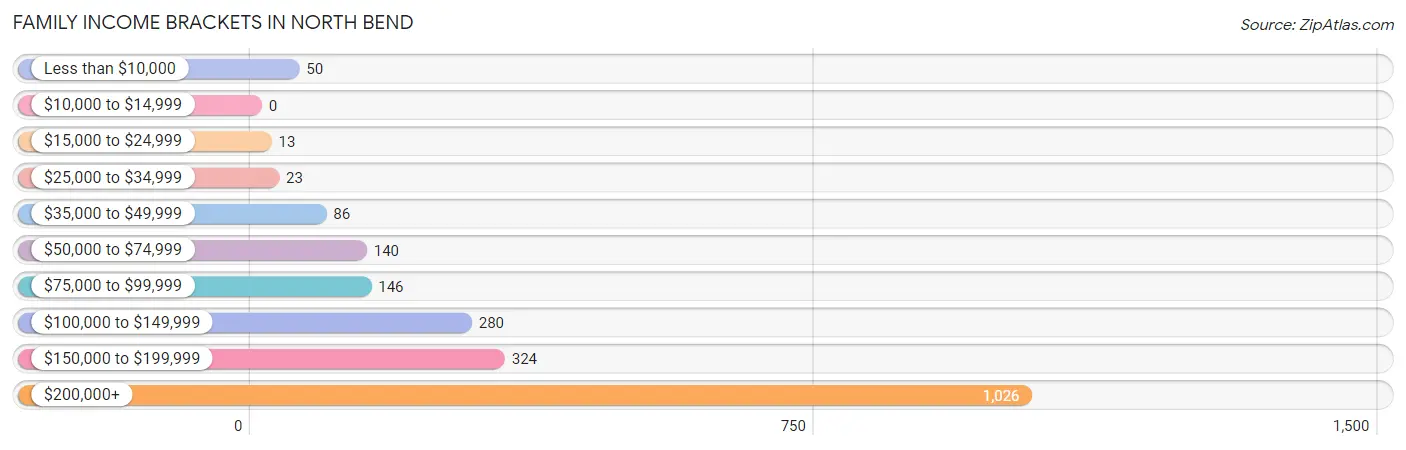
| Income Bracket | # Families | % Families |
| Less than $10,000 | 50 | 2.4% |
| $10,000 to $14,999 | 0 | 0.0% |
| $15,000 to $24,999 | 13 | 0.6% |
| $25,000 to $34,999 | 23 | 1.1% |
| $35,000 to $49,999 | 86 | 4.1% |
| $50,000 to $74,999 | 140 | 6.7% |
| $75,000 to $99,999 | 146 | 7.0% |
| $100,000 to $149,999 | 280 | 13.4% |
| $150,000 to $199,999 | 324 | 15.5% |
| $200,000+ | 1,026 | 49.1% |
Family Income by Famaliy Size in North Bend
6-person families (68 | 3.3%) account for the highest median family income in North Bend with $245,203 per family, while 2-person families (1,015 | 48.6%) have the highest median income of $110,542 per family member.
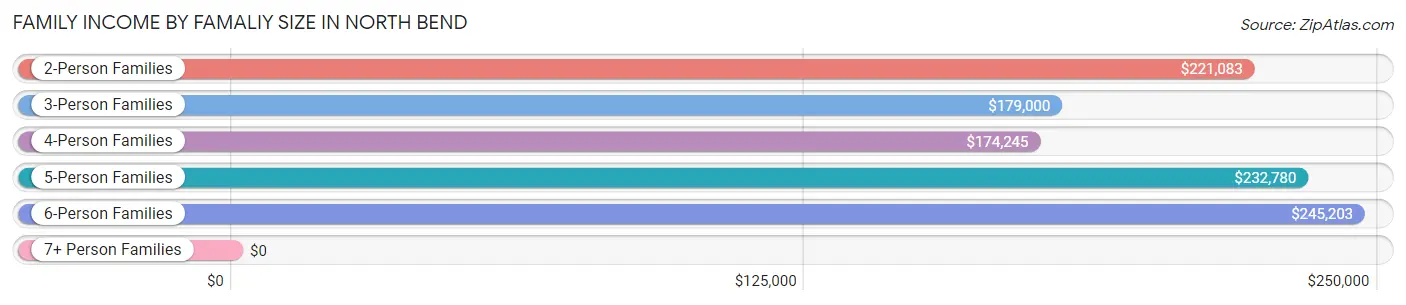
| Income Bracket | # Families | Median Income |
| 2-Person Families | 1,015 (48.6%) | $221,083 |
| 3-Person Families | 428 (20.5%) | $179,000 |
| 4-Person Families | 380 (18.2%) | $174,245 |
| 5-Person Families | 199 (9.5%) | $232,780 |
| 6-Person Families | 68 (3.3%) | $245,203 |
| 7+ Person Families | 0 (0.0%) | $0 |
| Total | 2,090 (100.0%) | $193,603 |
Family Income by Number of Earners in North Bend
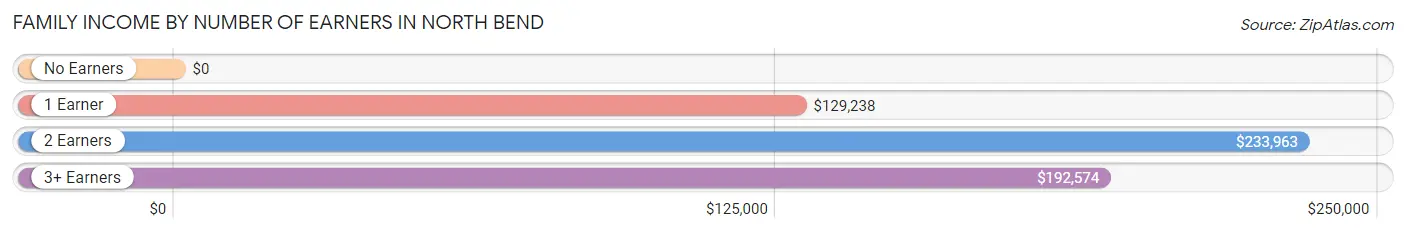
| Number of Earners | # Families | Median Income |
| No Earners | 167 (8.0%) | $0 |
| 1 Earner | 513 (24.5%) | $129,238 |
| 2 Earners | 1,044 (49.9%) | $233,963 |
| 3+ Earners | 366 (17.5%) | $192,574 |
| Total | 2,090 (100.0%) | $193,603 |
Household Income in North Bend
Household Income Brackets in North Bend
With 1,124 households falling in the category, the $200,000+ income range is the most frequent in North Bend, accounting for 40.2% of all households. In contrast, only 31 households (1.1%) fall into the $15,000 to $24,999 income bracket, making it the least populous group.
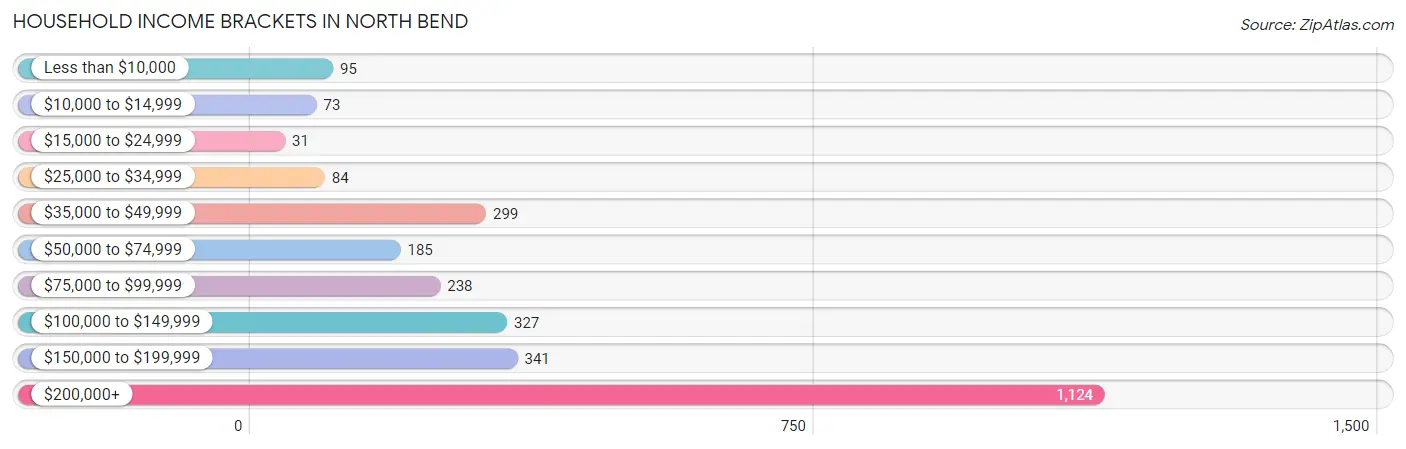
| Income Bracket | # Households | % Households |
| Less than $10,000 | 95 | 3.4% |
| $10,000 to $14,999 | 73 | 2.6% |
| $15,000 to $24,999 | 31 | 1.1% |
| $25,000 to $34,999 | 84 | 3.0% |
| $35,000 to $49,999 | 299 | 10.7% |
| $50,000 to $74,999 | 185 | 6.6% |
| $75,000 to $99,999 | 238 | 8.5% |
| $100,000 to $149,999 | 327 | 11.7% |
| $150,000 to $199,999 | 341 | 12.2% |
| $200,000+ | 1,124 | 40.2% |
Household Income by Householder Age in North Bend
The median household income in North Bend is $171,078, with the highest median household income of $233,134 found in the 25 to 44 years age bracket for the primary householder. A total of 914 households (32.7%) fall into this category. Meanwhile, the 15 to 24 years age bracket for the primary householder has the lowest median household income of $0, with 99 households (3.5%) in this group.
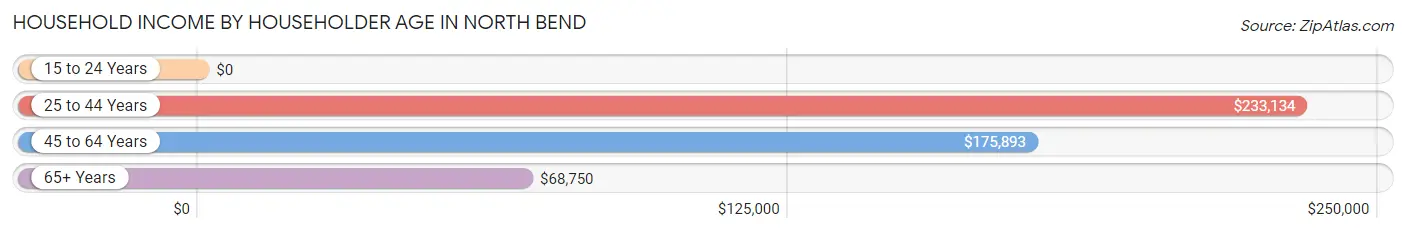
| Income Bracket | # Households | Median Income |
| 15 to 24 Years | 99 (3.5%) | $0 |
| 25 to 44 Years | 914 (32.7%) | $233,134 |
| 45 to 64 Years | 1,152 (41.2%) | $175,893 |
| 65+ Years | 632 (22.6%) | $68,750 |
| Total | 2,797 (100.0%) | $171,078 |
Poverty in North Bend
Income Below Poverty by Sex and Age in North Bend
With 5.4% poverty level for males and 6.7% for females among the residents of North Bend, 75 year old and over males and 45 to 54 year old females are the most vulnerable to poverty, with 47 males (28.5%) and 115 females (27.5%) in their respective age groups living below the poverty level.
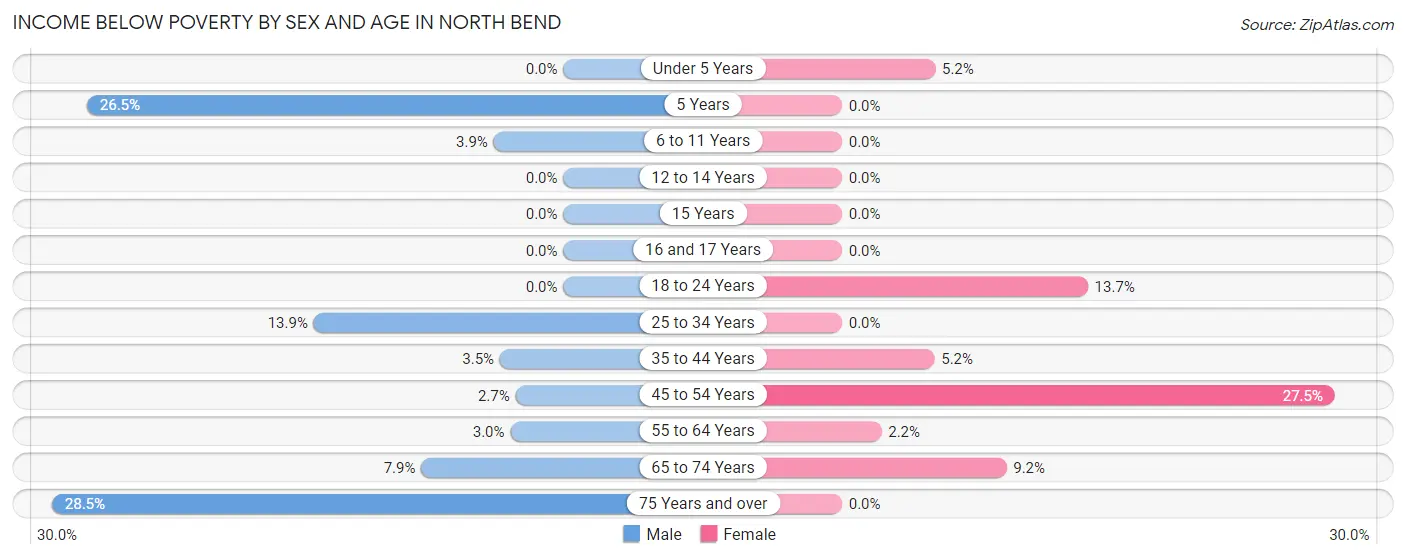
| Age Bracket | Male | Female |
| Under 5 Years | 0 (0.0%) | 14 (5.2%) |
| 5 Years | 13 (26.5%) | 0 (0.0%) |
| 6 to 11 Years | 13 (3.9%) | 0 (0.0%) |
| 12 to 14 Years | 0 (0.0%) | 0 (0.0%) |
| 15 Years | 0 (0.0%) | 0 (0.0%) |
| 16 and 17 Years | 0 (0.0%) | 0 (0.0%) |
| 18 to 24 Years | 0 (0.0%) | 43 (13.7%) |
| 25 to 34 Years | 51 (13.9%) | 0 (0.0%) |
| 35 to 44 Years | 26 (3.5%) | 34 (5.1%) |
| 45 to 54 Years | 17 (2.7%) | 115 (27.5%) |
| 55 to 64 Years | 14 (2.9%) | 11 (2.2%) |
| 65 to 74 Years | 25 (7.9%) | 34 (9.2%) |
| 75 Years and over | 47 (28.5%) | 0 (0.0%) |
| Total | 206 (5.4%) | 251 (6.7%) |
Income Above Poverty by Sex and Age in North Bend
According to the poverty statistics in North Bend, males aged under 5 years and females aged 5 years are the age groups that are most secure financially, with 100.0% of males and 100.0% of females in these age groups living above the poverty line.
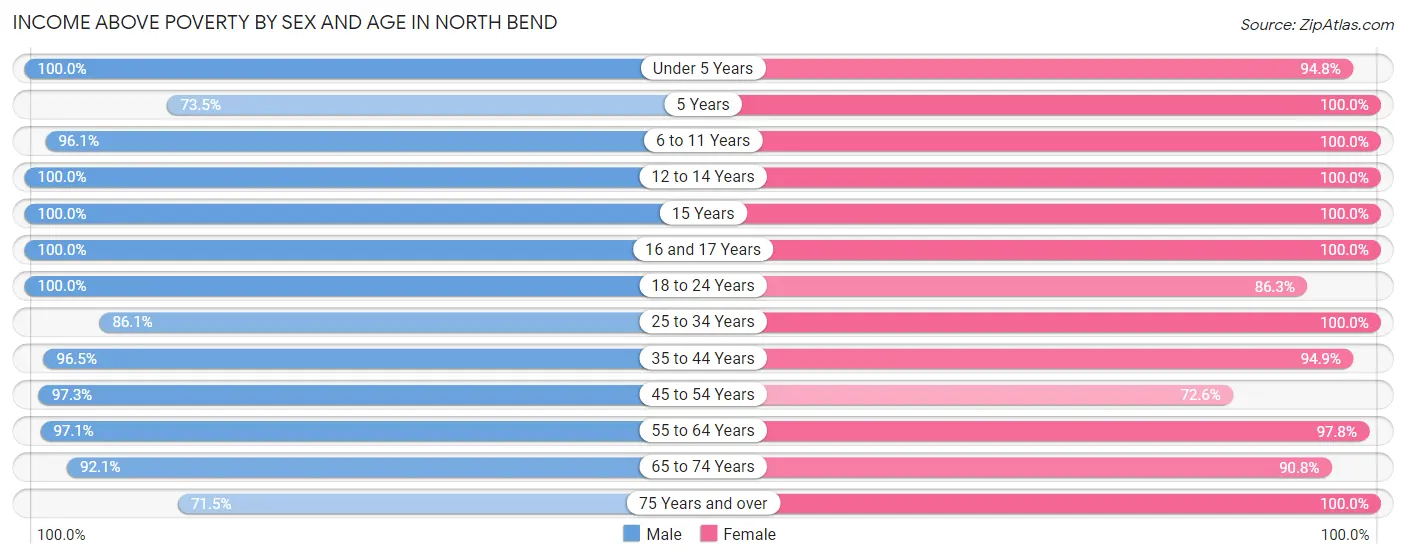
| Age Bracket | Male | Female |
| Under 5 Years | 219 (100.0%) | 256 (94.8%) |
| 5 Years | 36 (73.5%) | 14 (100.0%) |
| 6 to 11 Years | 322 (96.1%) | 285 (100.0%) |
| 12 to 14 Years | 70 (100.0%) | 208 (100.0%) |
| 15 Years | 83 (100.0%) | 50 (100.0%) |
| 16 and 17 Years | 90 (100.0%) | 48 (100.0%) |
| 18 to 24 Years | 242 (100.0%) | 271 (86.3%) |
| 25 to 34 Years | 316 (86.1%) | 494 (100.0%) |
| 35 to 44 Years | 710 (96.5%) | 626 (94.9%) |
| 45 to 54 Years | 621 (97.3%) | 304 (72.6%) |
| 55 to 64 Years | 461 (97.1%) | 488 (97.8%) |
| 65 to 74 Years | 291 (92.1%) | 337 (90.8%) |
| 75 Years and over | 118 (71.5%) | 132 (100.0%) |
| Total | 3,579 (94.6%) | 3,513 (93.3%) |
Income Below Poverty Among Married-Couple Families in North Bend
The poverty statistics for married-couple families in North Bend show that 0.7% or 13 of the total 1,834 families live below the poverty line. Families with 1 or 2 children have the highest poverty rate of 2.2%, comprising of 13 families. On the other hand, families with no children have the lowest poverty rate of 0.0%, which includes 0 families.
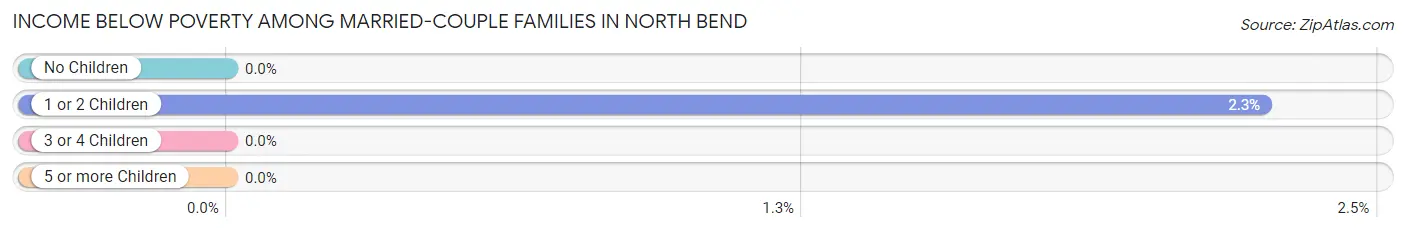
| Children | Above Poverty | Below Poverty |
| No Children | 1,039 (100.0%) | 0 (0.0%) |
| 1 or 2 Children | 566 (97.8%) | 13 (2.2%) |
| 3 or 4 Children | 216 (100.0%) | 0 (0.0%) |
| 5 or more Children | 0 (0.0%) | 0 (0.0%) |
| Total | 1,821 (99.3%) | 13 (0.7%) |
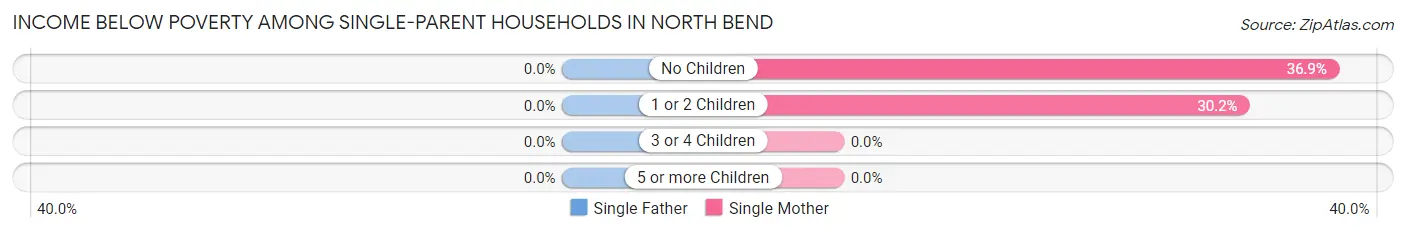
Income Below Poverty Among Single-Parent Households in North Bend
| Children | Single Father | Single Mother |
| No Children | 0 (0.0%) | 38 (36.9%) |
| 1 or 2 Children | 0 (0.0%) | 13 (30.2%) |
| 3 or 4 Children | 0 (0.0%) | 0 (0.0%) |
| 5 or more Children | 0 (0.0%) | 0 (0.0%) |
| Total | 0 (0.0%) | 51 (34.9%) |
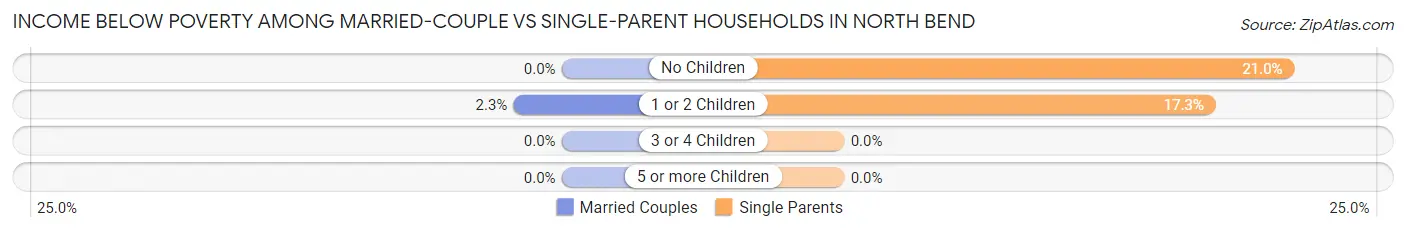
Income Below Poverty Among Married-Couple vs Single-Parent Households in North Bend
The poverty data for North Bend shows that 13 of the married-couple family households (0.7%) and 51 of the single-parent households (19.9%) are living below the poverty level. Within the married-couple family households, those with 1 or 2 children have the highest poverty rate, with 13 households (2.2%) falling below the poverty line. Among the single-parent households, those with no children have the highest poverty rate, with 38 household (21.0%) living below poverty.
| Children | Married-Couple Families | Single-Parent Households |
| No Children | 0 (0.0%) | 38 (21.0%) |
| 1 or 2 Children | 13 (2.2%) | 13 (17.3%) |
| 3 or 4 Children | 0 (0.0%) | 0 (0.0%) |
| 5 or more Children | 0 (0.0%) | 0 (0.0%) |
| Total | 13 (0.7%) | 51 (19.9%) |
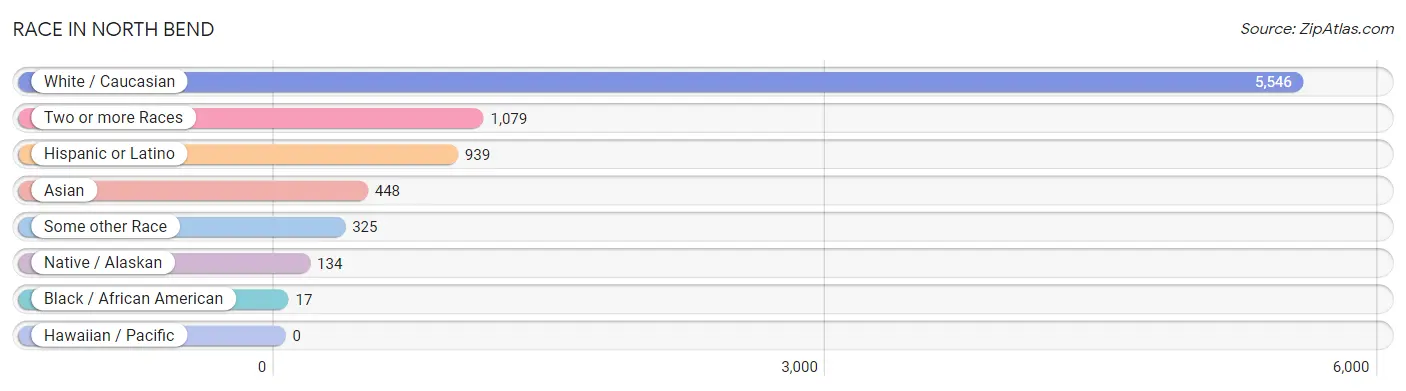
Race in North Bend
The most populous races in North Bend are White / Caucasian (5,546 | 73.5%), Two or more Races (1,079 | 14.3%), and Hispanic or Latino (939 | 12.4%).
| Race | # Population | % Population |
| Asian | 448 | 5.9% |
| Black / African American | 17 | 0.2% |
| Hawaiian / Pacific | 0 | 0.0% |
| Hispanic or Latino | 939 | 12.4% |
| Native / Alaskan | 134 | 1.8% |
| White / Caucasian | 5,546 | 73.5% |
| Two or more Races | 1,079 | 14.3% |
| Some other Race | 325 | 4.3% |
| Total | 7,549 | 100.0% |
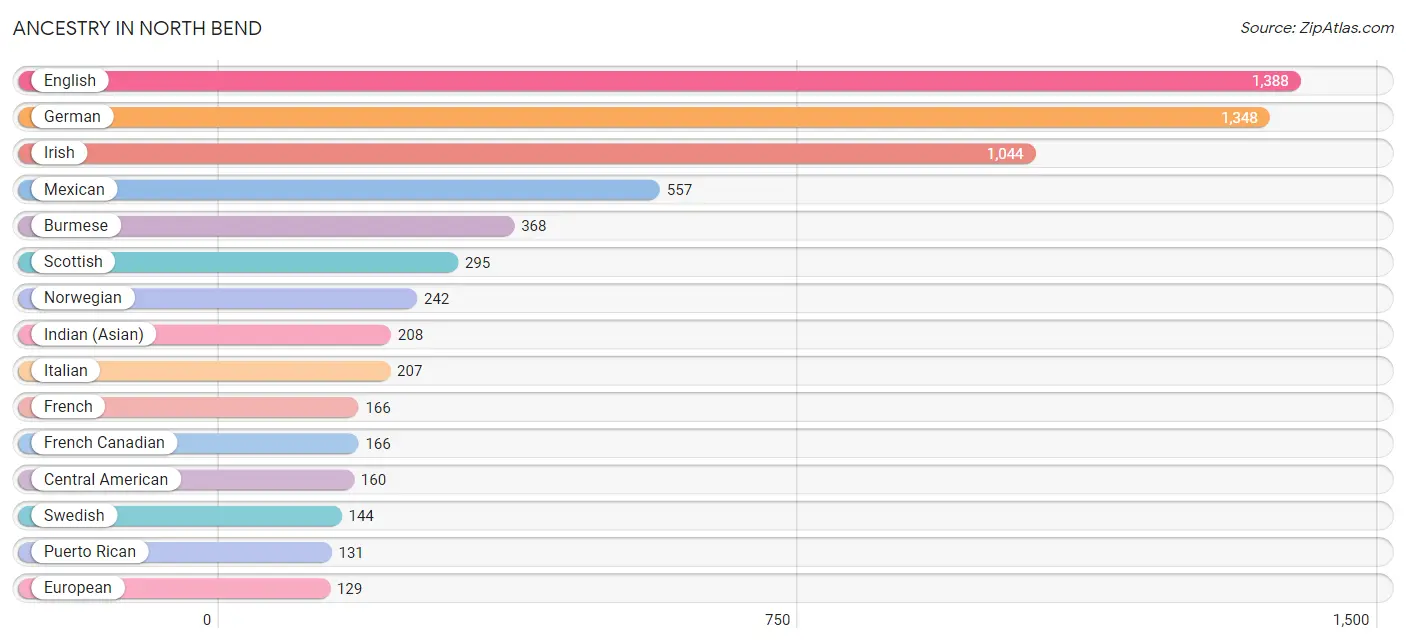
Ancestry in North Bend
The most populous ancestries reported in North Bend are English (1,388 | 18.4%), German (1,348 | 17.9%), Irish (1,044 | 13.8%), Mexican (557 | 7.4%), and Burmese (368 | 4.9%), together accounting for 62.3% of all North Bend residents.
| Ancestry | # Population | % Population |
| American | 49 | 0.6% |
| Arab | 47 | 0.6% |
| Austrian | 16 | 0.2% |
| Basque | 20 | 0.3% |
| Bhutanese | 103 | 1.4% |
| Blackfeet | 14 | 0.2% |
| British | 62 | 0.8% |
| Burmese | 368 | 4.9% |
| Canadian | 57 | 0.8% |
| Central American | 160 | 2.1% |
| Central American Indian | 12 | 0.2% |
| Cherokee | 82 | 1.1% |
| Chilean | 62 | 0.8% |
| Colombian | 29 | 0.4% |
| Czech | 35 | 0.5% |
| Danish | 52 | 0.7% |
| Dutch | 74 | 1.0% |
| Eastern European | 125 | 1.7% |
| Egyptian | 47 | 0.6% |
| English | 1,388 | 18.4% |
| European | 129 | 1.7% |
| Filipino | 16 | 0.2% |
| Finnish | 14 | 0.2% |
| French | 166 | 2.2% |
| French Canadian | 166 | 2.2% |
| German | 1,348 | 17.9% |
| Hungarian | 17 | 0.2% |
| Indian (Asian) | 208 | 2.8% |
| Irish | 1,044 | 13.8% |
| Italian | 207 | 2.7% |
| Jamaican | 47 | 0.6% |
| Korean | 129 | 1.7% |
| Lithuanian | 22 | 0.3% |
| Mexican | 557 | 7.4% |
| Northern European | 57 | 0.8% |
| Norwegian | 242 | 3.2% |
| Panamanian | 47 | 0.6% |
| Polish | 87 | 1.1% |
| Portuguese | 33 | 0.4% |
| Puerto Rican | 131 | 1.7% |
| Russian | 71 | 0.9% |
| Salvadoran | 113 | 1.5% |
| Scotch-Irish | 106 | 1.4% |
| Scottish | 295 | 3.9% |
| Shoshone | 40 | 0.5% |
| South African | 24 | 0.3% |
| South American | 91 | 1.2% |
| Subsaharan African | 24 | 0.3% |
| Swedish | 144 | 1.9% |
| Swiss | 18 | 0.2% |
| Thai | 89 | 1.2% |
| Tlingit-Haida | 34 | 0.4% |
| Welsh | 88 | 1.2% |
| Yugoslavian | 17 | 0.2% | View All 54 Rows |
Immigrants in North Bend
The most numerous immigrant groups reported in North Bend came from Latin America (303 | 4.0%), Asia (291 | 3.8%), Central America (288 | 3.8%), Mexico (216 | 2.9%), and South Central Asia (116 | 1.5%), together accounting for 16.1% of all North Bend residents.
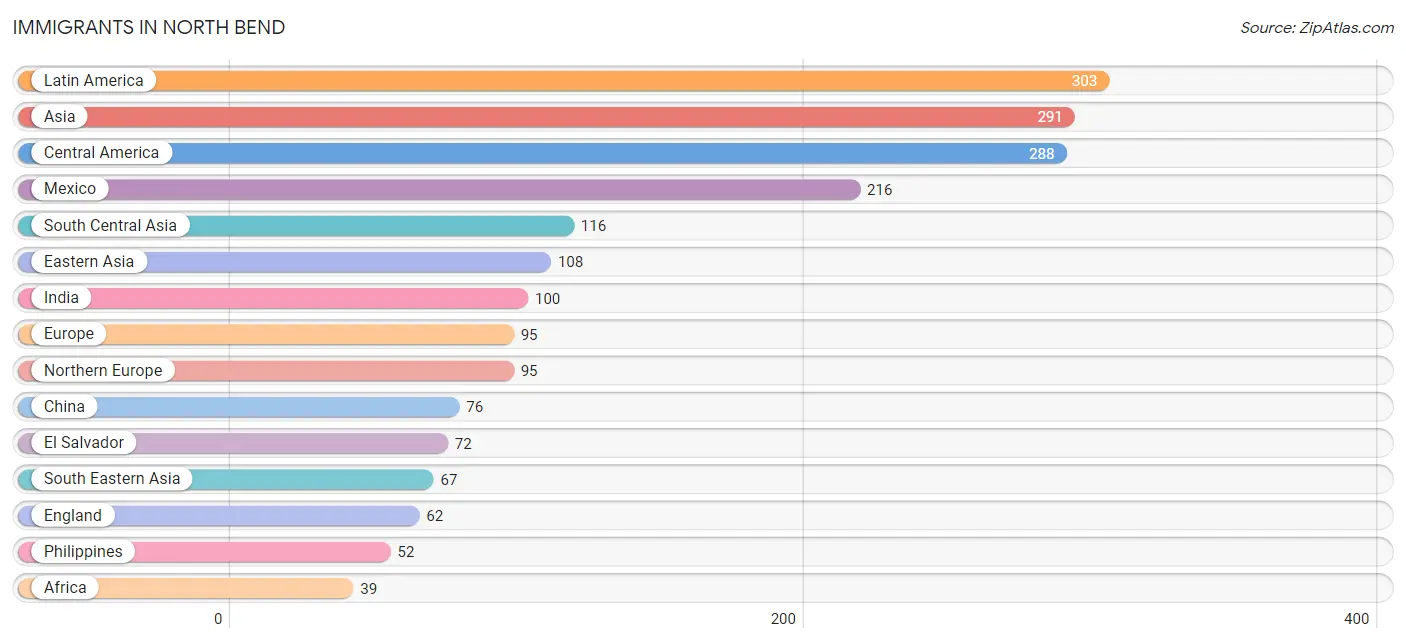
| Immigration Origin | # Population | % Population |
| Africa | 39 | 0.5% |
| Asia | 291 | 3.8% |
| Canada | 27 | 0.4% |
| Central America | 288 | 3.8% |
| Chile | 15 | 0.2% |
| China | 76 | 1.0% |
| Eastern Asia | 108 | 1.4% |
| El Salvador | 72 | 0.9% |
| England | 62 | 0.8% |
| Europe | 95 | 1.3% |
| Hong Kong | 18 | 0.2% |
| India | 100 | 1.3% |
| Korea | 32 | 0.4% |
| Latin America | 303 | 4.0% |
| Mexico | 216 | 2.9% |
| Nigeria | 15 | 0.2% |
| Northern Europe | 95 | 1.3% |
| Pakistan | 16 | 0.2% |
| Philippines | 52 | 0.7% |
| Scotland | 16 | 0.2% |
| Singapore | 15 | 0.2% |
| South Africa | 24 | 0.3% |
| South America | 15 | 0.2% |
| South Central Asia | 116 | 1.5% |
| South Eastern Asia | 67 | 0.9% |
| Sweden | 15 | 0.2% |
| Taiwan | 15 | 0.2% |
| Western Africa | 15 | 0.2% | View All 28 Rows |
Sex and Age in North Bend
Sex and Age in North Bend
The most populous age groups in North Bend are 35 to 39 Years (384 | 10.2%) for men and 40 to 44 Years (434 | 11.5%) for women.
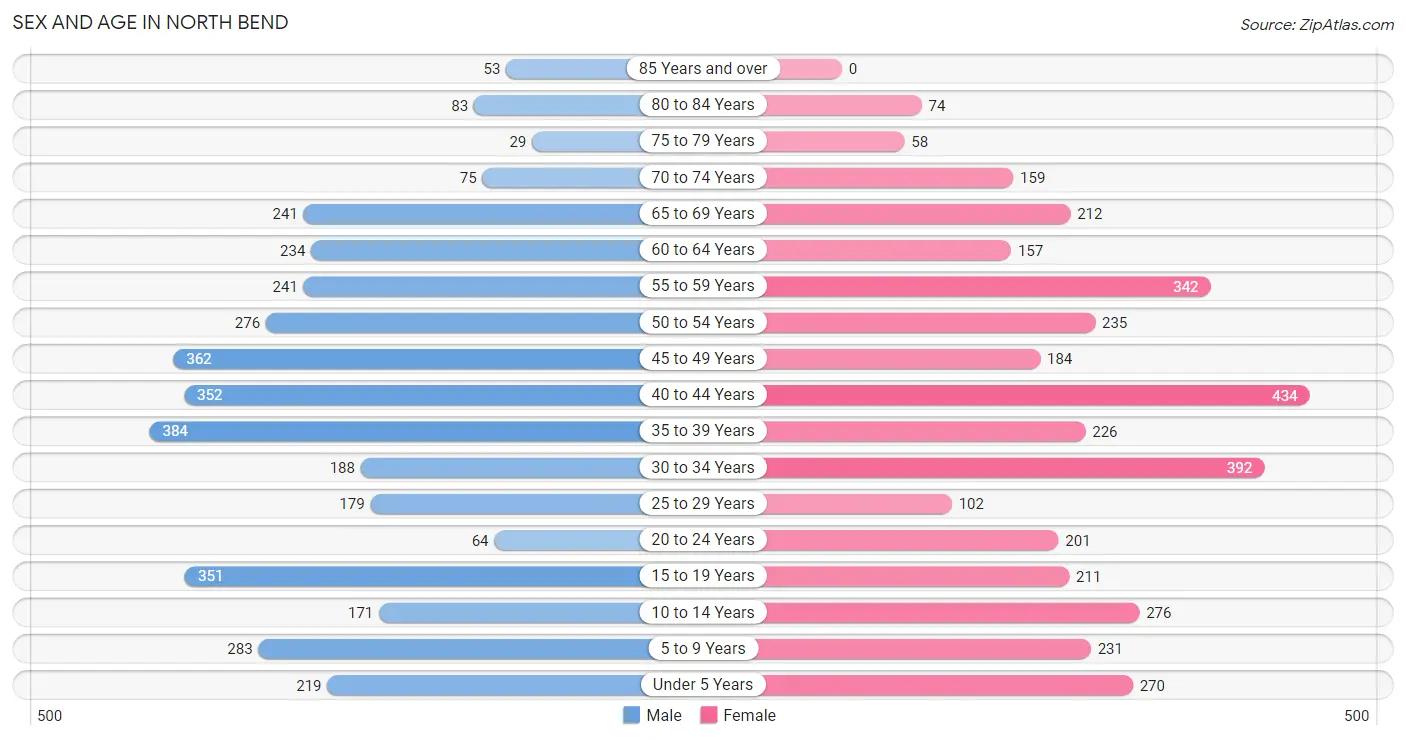
| Age Bracket | Male | Female |
| Under 5 Years | 219 (5.8%) | 270 (7.2%) |
| 5 to 9 Years | 283 (7.5%) | 231 (6.1%) |
| 10 to 14 Years | 171 (4.5%) | 276 (7.3%) |
| 15 to 19 Years | 351 (9.3%) | 211 (5.6%) |
| 20 to 24 Years | 64 (1.7%) | 201 (5.3%) |
| 25 to 29 Years | 179 (4.7%) | 102 (2.7%) |
| 30 to 34 Years | 188 (5.0%) | 392 (10.4%) |
| 35 to 39 Years | 384 (10.2%) | 226 (6.0%) |
| 40 to 44 Years | 352 (9.3%) | 434 (11.5%) |
| 45 to 49 Years | 362 (9.6%) | 184 (4.9%) |
| 50 to 54 Years | 276 (7.3%) | 235 (6.2%) |
| 55 to 59 Years | 241 (6.4%) | 342 (9.1%) |
| 60 to 64 Years | 234 (6.2%) | 157 (4.2%) |
| 65 to 69 Years | 241 (6.4%) | 212 (5.6%) |
| 70 to 74 Years | 75 (2.0%) | 159 (4.2%) |
| 75 to 79 Years | 29 (0.8%) | 58 (1.5%) |
| 80 to 84 Years | 83 (2.2%) | 74 (2.0%) |
| 85 Years and over | 53 (1.4%) | 0 (0.0%) |
| Total | 3,785 (100.0%) | 3,764 (100.0%) |
Families and Households in North Bend
Median Family Size in North Bend
The median family size in North Bend is 3.09 persons per family, with married-couple families (1,834 | 87.7%) accounting for the largest median family size of 3.15 persons per family. On the other hand, single female/mother families (146 | 7.0%) represent the smallest median family size with 2.49 persons per family.
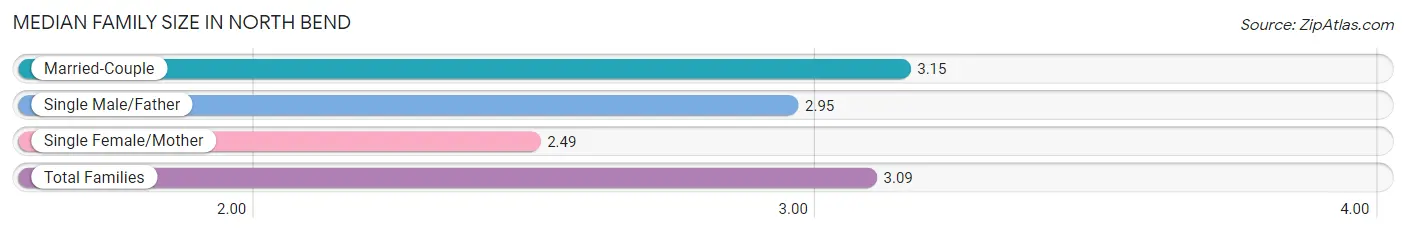
| Family Type | # Families | Family Size |
| Married-Couple | 1,834 (87.7%) | 3.15 |
| Single Male/Father | 110 (5.3%) | 2.95 |
| Single Female/Mother | 146 (7.0%) | 2.49 |
| Total Families | 2,090 (100.0%) | 3.09 |
Median Household Size in North Bend
The median household size in North Bend is 2.67 persons per household, with single male/father households (110 | 3.9%) accounting for the largest median household size of 4.01 persons per household. non-family households (707 | 25.3%) represent the smallest median household size with 1.15 persons per household.
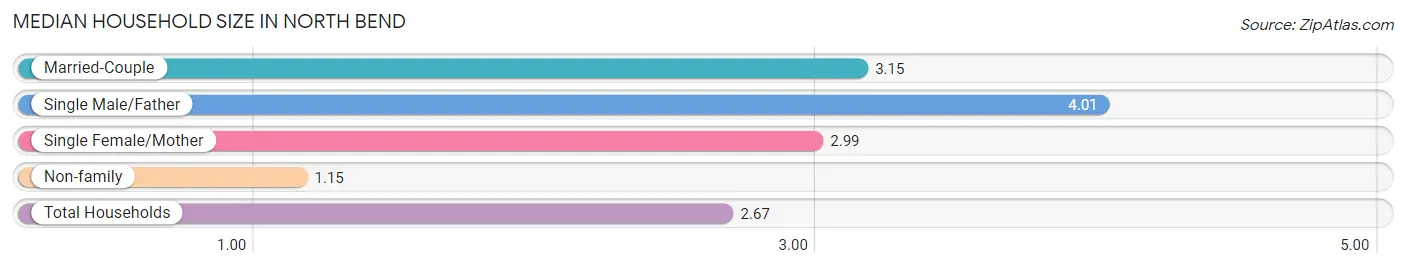
| Household Type | # Households | Household Size |
| Married-Couple | 1,834 (65.6%) | 3.15 |
| Single Male/Father | 110 (3.9%) | 4.01 |
| Single Female/Mother | 146 (5.2%) | 2.99 |
| Non-family | 707 (25.3%) | 1.15 |
| Total Households | 2,797 (100.0%) | 2.67 |
Household Size by Marriage Status in North Bend
Out of a total of 2,797 households in North Bend, 2,090 (74.7%) are family households, while 707 (25.3%) are nonfamily households. The most numerous type of family households are 2-person households, comprising 924, and the most common type of nonfamily households are 1-person households, comprising 600.
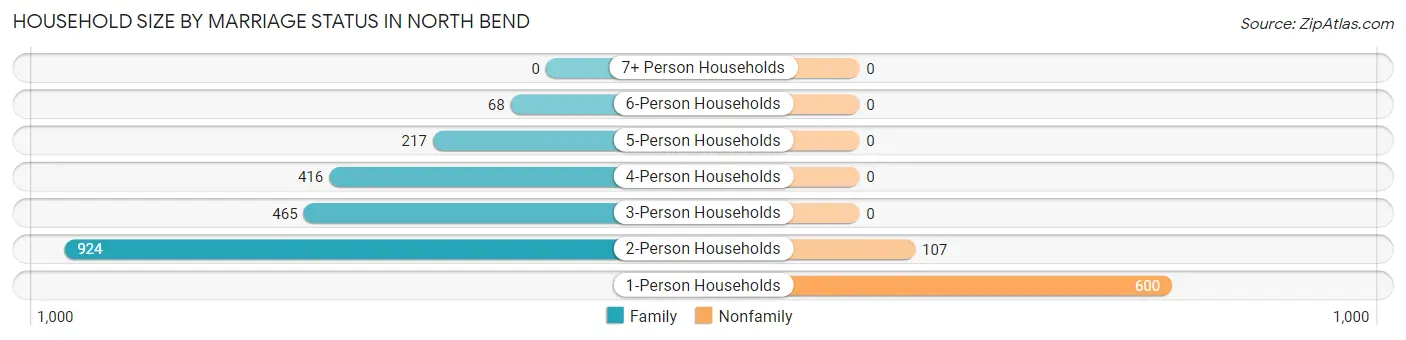
| Household Size | Family Households | Nonfamily Households |
| 1-Person Households | - | 600 (21.4%) |
| 2-Person Households | 924 (33.0%) | 107 (3.8%) |
| 3-Person Households | 465 (16.6%) | 0 (0.0%) |
| 4-Person Households | 416 (14.9%) | 0 (0.0%) |
| 5-Person Households | 217 (7.8%) | 0 (0.0%) |
| 6-Person Households | 68 (2.4%) | 0 (0.0%) |
| 7+ Person Households | 0 (0.0%) | 0 (0.0%) |
| Total | 2,090 (74.7%) | 707 (25.3%) |
Female Fertility in North Bend
Fertility by Age in North Bend
Average fertility rate in North Bend is 34.0 births per 1,000 women. Women in the age bracket of 20 to 34 years have the highest fertility rate with 52.0 births per 1,000 women. Women in the age bracket of 20 to 34 years acount for 59.0% of all women with births.
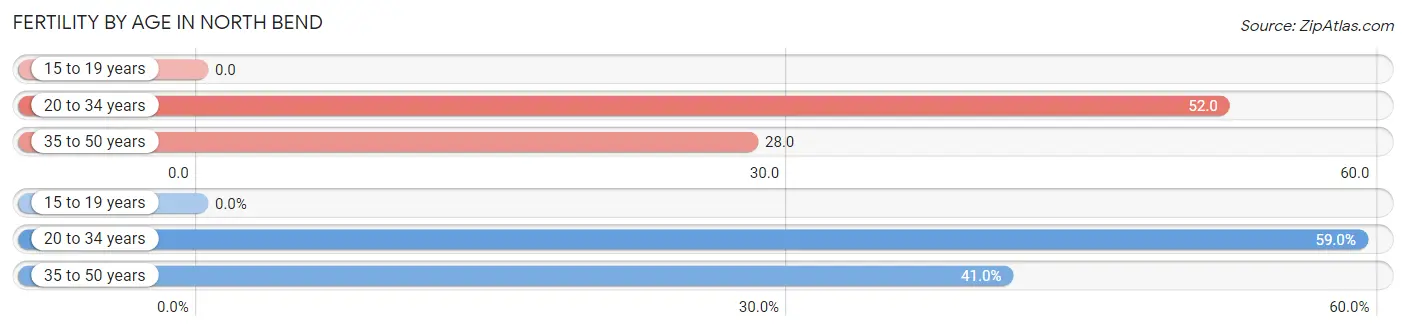
| Age Bracket | Women with Births | Births / 1,000 Women |
| 15 to 19 years | 0 (0.0%) | 0.0 |
| 20 to 34 years | 36 (59.0%) | 52.0 |
| 35 to 50 years | 25 (41.0%) | 28.0 |
| Total | 61 (100.0%) | 34.0 |
Fertility by Age by Marriage Status in North Bend
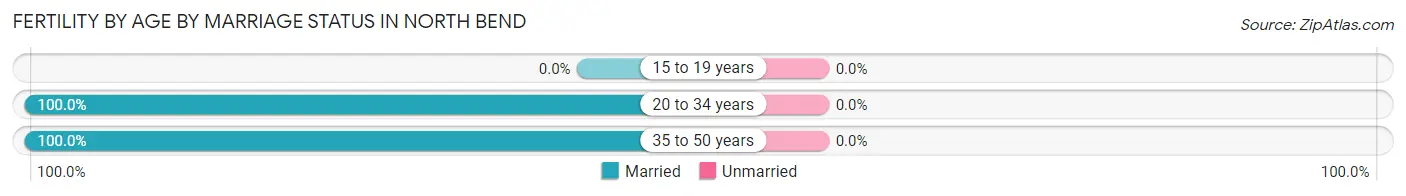
| Age Bracket | Married | Unmarried |
| 15 to 19 years | 0 (0.0%) | 0 (0.0%) |
| 20 to 34 years | 36 (100.0%) | 0 (0.0%) |
| 35 to 50 years | 25 (100.0%) | 0 (0.0%) |
| Total | 61 (100.0%) | 0 (0.0%) |
Fertility by Education in North Bend
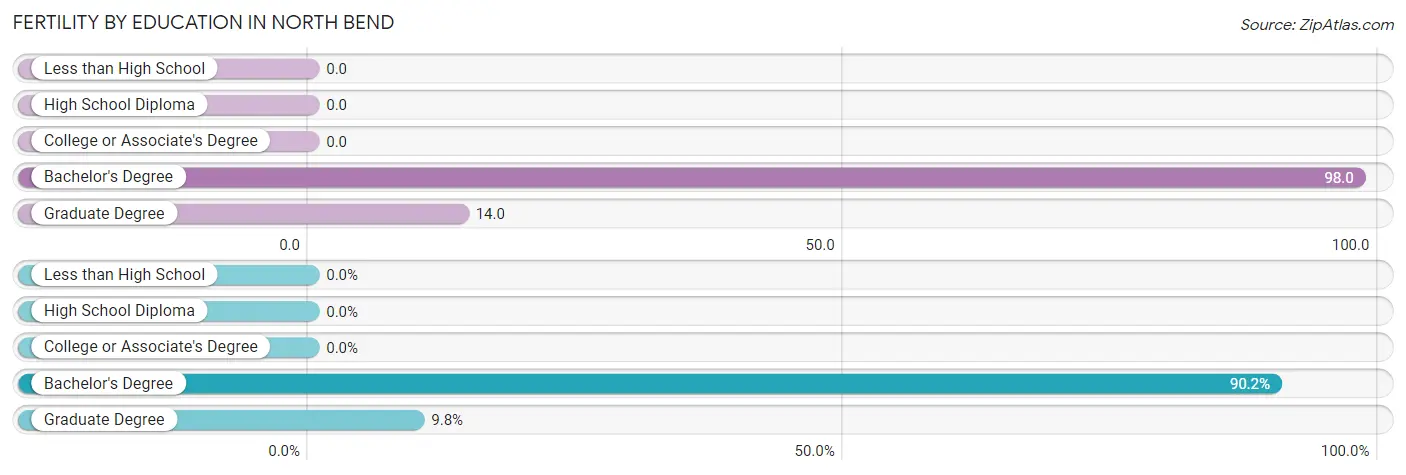
| Educational Attainment | Women with Births | Births / 1,000 Women |
| Less than High School | 0 (0.0%) | 0.0 |
| High School Diploma | 0 (0.0%) | 0.0 |
| College or Associate's Degree | 0 (0.0%) | 0.0 |
| Bachelor's Degree | 55 (90.2%) | 98.0 |
| Graduate Degree | 6 (9.8%) | 14.0 |
| Total | 61 (100.0%) | 34.0 |
Fertility by Education by Marriage Status in North Bend
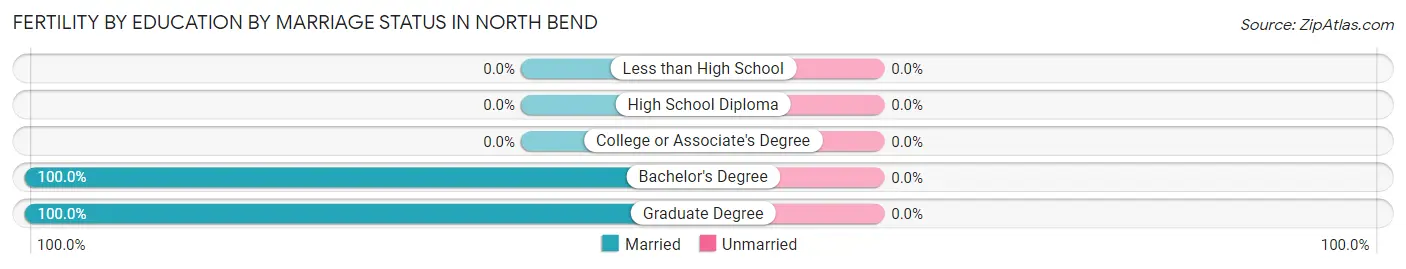
| Educational Attainment | Married | Unmarried |
| Less than High School | 0 (0.0%) | 0 (0.0%) |
| High School Diploma | 0 (0.0%) | 0 (0.0%) |
| College or Associate's Degree | 0 (0.0%) | 0 (0.0%) |
| Bachelor's Degree | 55 (100.0%) | 0 (0.0%) |
| Graduate Degree | 6 (100.0%) | 0 (0.0%) |
| Total | 61 (100.0%) | 0 (0.0%) |
Employment Characteristics in North Bend
Employment by Class of Employer in North Bend
Among the 3,836 employed individuals in North Bend, private company employees (2,768 | 72.2%), not-for-profit organizations (437 | 11.4%), and local government employees (243 | 6.3%) make up the most common classes of employment.
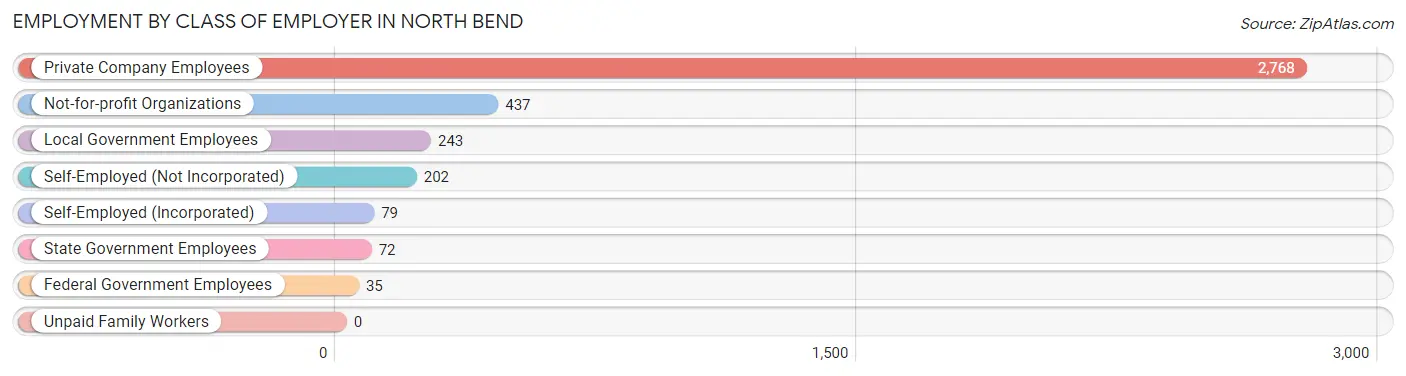
| Employer Class | # Employees | % Employees |
| Private Company Employees | 2,768 | 72.2% |
| Self-Employed (Incorporated) | 79 | 2.1% |
| Self-Employed (Not Incorporated) | 202 | 5.3% |
| Not-for-profit Organizations | 437 | 11.4% |
| Local Government Employees | 243 | 6.3% |
| State Government Employees | 72 | 1.9% |
| Federal Government Employees | 35 | 0.9% |
| Unpaid Family Workers | 0 | 0.0% |
| Total | 3,836 | 100.0% |
Employment Status by Age in North Bend
According to the labor force statistics for North Bend, out of the total population over 16 years of age (5,966), 71.0% or 4,236 individuals are in the labor force, with 2.0% or 85 of them unemployed. The age group with the highest labor force participation rate is 20 to 24 years, with 89.1% or 236 individuals in the labor force. Within the labor force, the 20 to 24 years age range has the highest percentage of unemployed individuals, with 16.9% or 40 of them being unemployed.
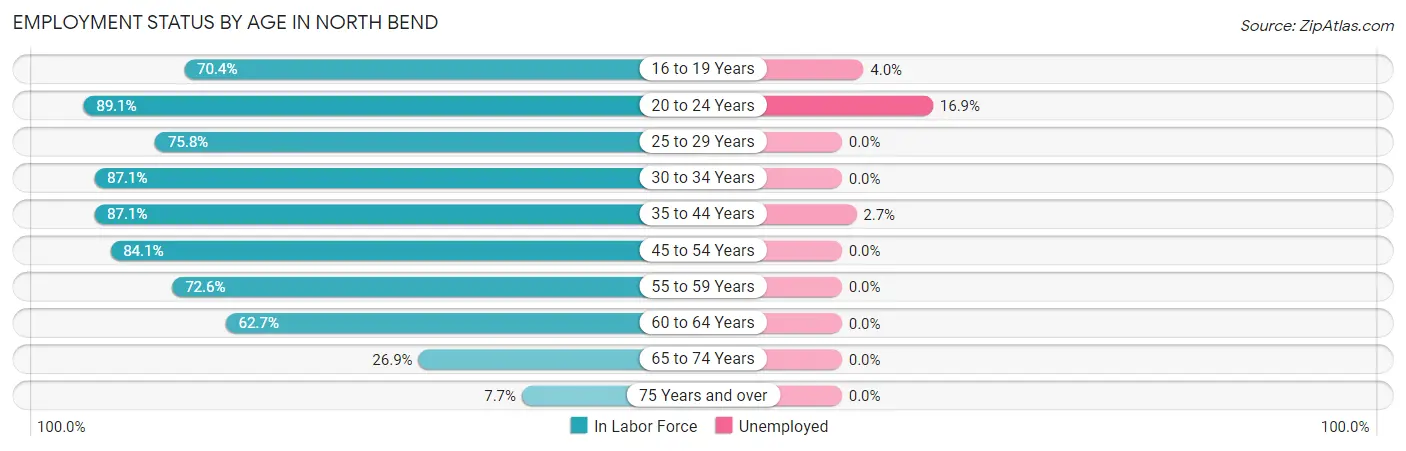
| Age Bracket | In Labor Force | Unemployed |
| 16 to 19 Years | 302 (70.4%) | 12 (4.0%) |
| 20 to 24 Years | 236 (89.1%) | 40 (16.9%) |
| 25 to 29 Years | 213 (75.8%) | 0 (0.0%) |
| 30 to 34 Years | 505 (87.1%) | 0 (0.0%) |
| 35 to 44 Years | 1,216 (87.1%) | 33 (2.7%) |
| 45 to 54 Years | 889 (84.1%) | 0 (0.0%) |
| 55 to 59 Years | 423 (72.6%) | 0 (0.0%) |
| 60 to 64 Years | 245 (62.7%) | 0 (0.0%) |
| 65 to 74 Years | 185 (26.9%) | 0 (0.0%) |
| 75 Years and over | 23 (7.7%) | 0 (0.0%) |
| Total | 4,236 (71.0%) | 85 (2.0%) |
Employment Status by Educational Attainment in North Bend
According to labor force statistics for North Bend, 81.4% of individuals (3,490) out of the total population between 25 and 64 years of age (4,288) are in the labor force, with 0.9% or 31 of them being unemployed. The group with the highest labor force participation rate are those with the educational attainment of less than high school, with 100.0% or 208 individuals in the labor force. Within the labor force, individuals with bachelor's degree or higher education have the highest percentage of unemployment, with 1.6% or 33 of them being unemployed.
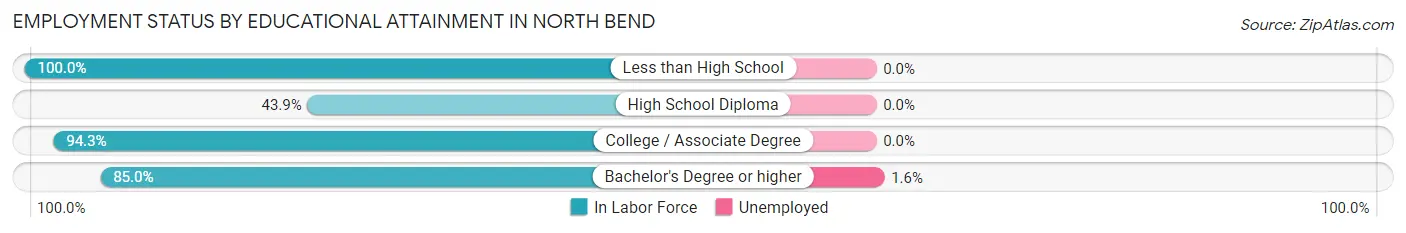
| Educational Attainment | In Labor Force | Unemployed |
| Less than High School | 208 (100.0%) | 0 (0.0%) |
| High School Diploma | 293 (43.9%) | 0 (0.0%) |
| College / Associate Degree | 897 (94.3%) | 0 (0.0%) |
| Bachelor's Degree or higher | 2,093 (85.0%) | 39 (1.6%) |
| Total | 3,490 (81.4%) | 39 (0.9%) |
Employment Occupations by Sex in North Bend
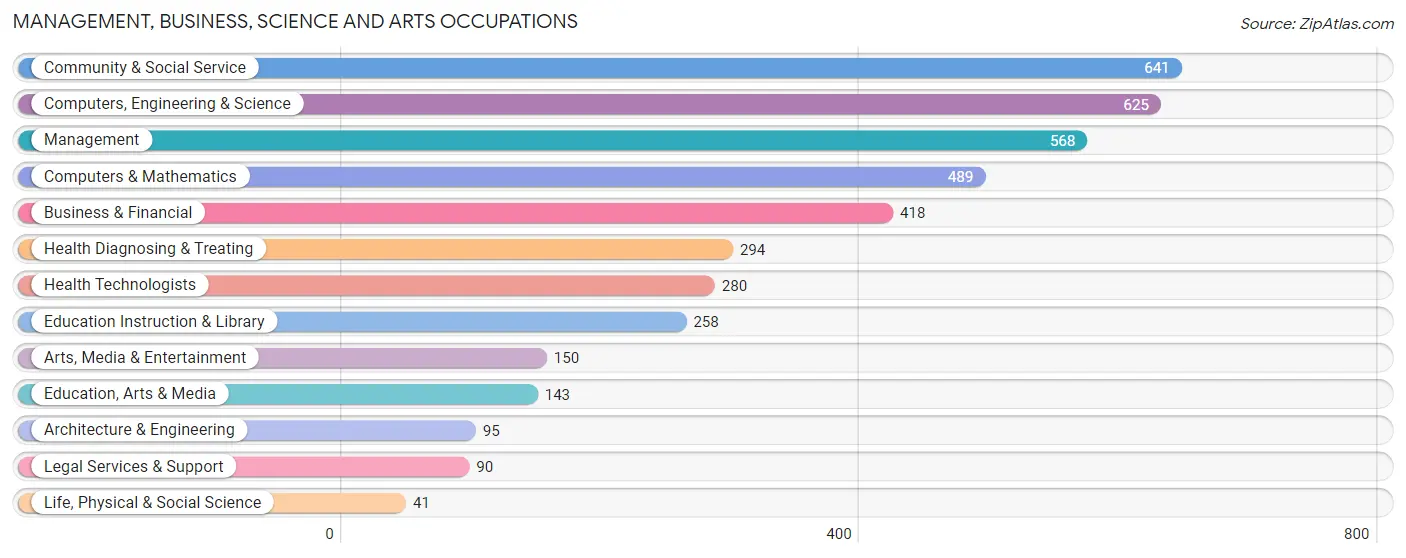
Management, Business, Science and Arts Occupations
The most common Management, Business, Science and Arts occupations in North Bend are Community & Social Service (641 | 15.4%), Computers, Engineering & Science (625 | 15.0%), Management (568 | 13.7%), Computers & Mathematics (489 | 11.8%), and Business & Financial (418 | 10.1%).
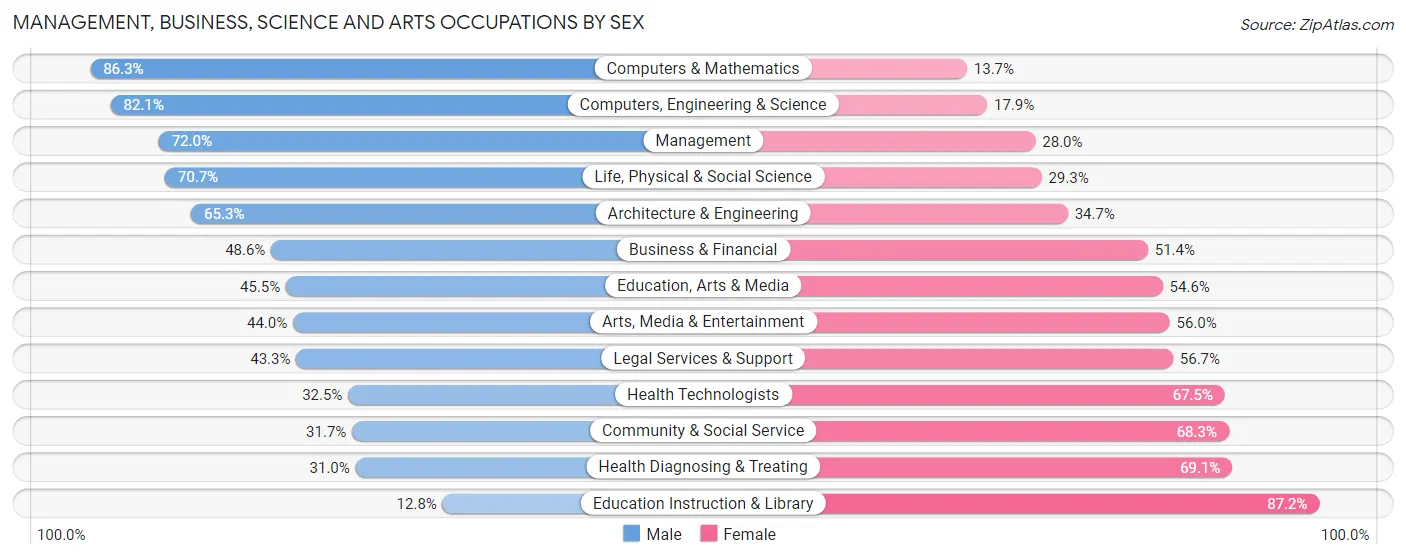
Management, Business, Science and Arts Occupations by Sex
Within the Management, Business, Science and Arts occupations in North Bend, the most male-oriented occupations are Computers & Mathematics (86.3%), Computers, Engineering & Science (82.1%), and Management (72.0%), while the most female-oriented occupations are Education Instruction & Library (87.2%), Health Diagnosing & Treating (69.1%), and Community & Social Service (68.3%).
| Occupation | Male | Female |
| Management | 409 (72.0%) | 159 (28.0%) |
| Business & Financial | 203 (48.6%) | 215 (51.4%) |
| Computers, Engineering & Science | 513 (82.1%) | 112 (17.9%) |
| Computers & Mathematics | 422 (86.3%) | 67 (13.7%) |
| Architecture & Engineering | 62 (65.3%) | 33 (34.7%) |
| Life, Physical & Social Science | 29 (70.7%) | 12 (29.3%) |
| Community & Social Service | 203 (31.7%) | 438 (68.3%) |
| Education, Arts & Media | 65 (45.5%) | 78 (54.5%) |
| Legal Services & Support | 39 (43.3%) | 51 (56.7%) |
| Education Instruction & Library | 33 (12.8%) | 225 (87.2%) |
| Arts, Media & Entertainment | 66 (44.0%) | 84 (56.0%) |
| Health Diagnosing & Treating | 91 (30.9%) | 203 (69.1%) |
| Health Technologists | 91 (32.5%) | 189 (67.5%) |
| Total (Category) | 1,419 (55.7%) | 1,127 (44.3%) |
| Total (Overall) | 2,268 (54.6%) | 1,884 (45.4%) |
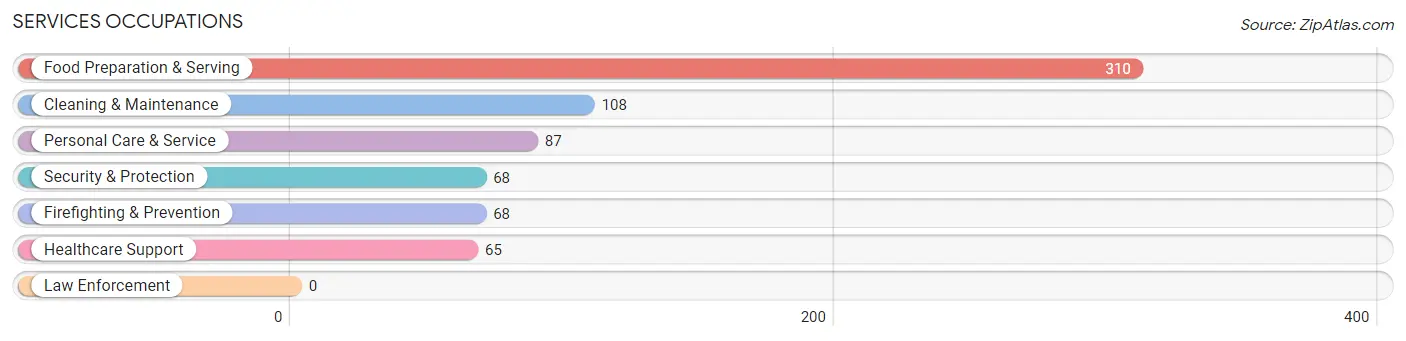
Services Occupations
The most common Services occupations in North Bend are Food Preparation & Serving (310 | 7.5%), Cleaning & Maintenance (108 | 2.6%), Personal Care & Service (87 | 2.1%), Security & Protection (68 | 1.6%), and Firefighting & Prevention (68 | 1.6%).
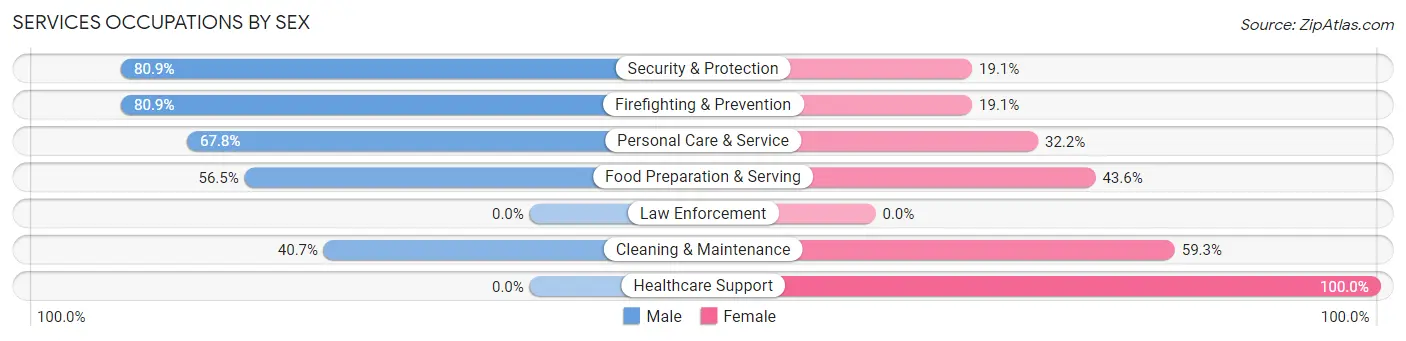
Services Occupations by Sex
Within the Services occupations in North Bend, the most male-oriented occupations are Security & Protection (80.9%), Firefighting & Prevention (80.9%), and Personal Care & Service (67.8%), while the most female-oriented occupations are Healthcare Support (100.0%), Cleaning & Maintenance (59.3%), and Food Preparation & Serving (43.5%).
| Occupation | Male | Female |
| Healthcare Support | 0 (0.0%) | 65 (100.0%) |
| Security & Protection | 55 (80.9%) | 13 (19.1%) |
| Firefighting & Prevention | 55 (80.9%) | 13 (19.1%) |
| Law Enforcement | 0 (0.0%) | 0 (0.0%) |
| Food Preparation & Serving | 175 (56.5%) | 135 (43.5%) |
| Cleaning & Maintenance | 44 (40.7%) | 64 (59.3%) |
| Personal Care & Service | 59 (67.8%) | 28 (32.2%) |
| Total (Category) | 333 (52.2%) | 305 (47.8%) |
| Total (Overall) | 2,268 (54.6%) | 1,884 (45.4%) |
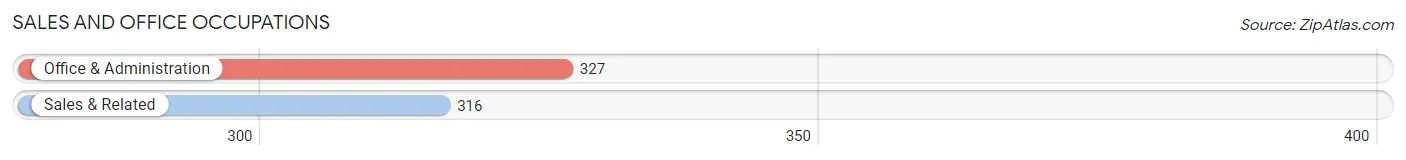
Sales and Office Occupations
The most common Sales and Office occupations in North Bend are Office & Administration (327 | 7.9%), and Sales & Related (316 | 7.6%).
Sales and Office Occupations by Sex
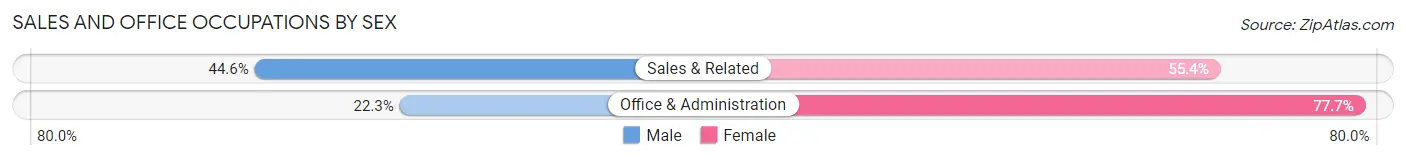
| Occupation | Male | Female |
| Sales & Related | 141 (44.6%) | 175 (55.4%) |
| Office & Administration | 73 (22.3%) | 254 (77.7%) |
| Total (Category) | 214 (33.3%) | 429 (66.7%) |
| Total (Overall) | 2,268 (54.6%) | 1,884 (45.4%) |
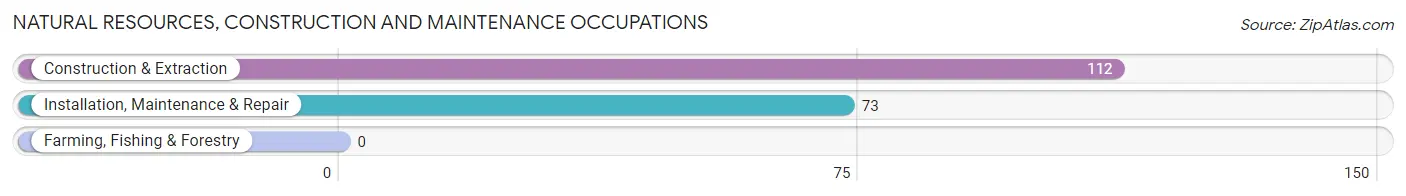
Natural Resources, Construction and Maintenance Occupations
The most common Natural Resources, Construction and Maintenance occupations in North Bend are Construction & Extraction (112 | 2.7%), and Installation, Maintenance & Repair (73 | 1.8%).
Natural Resources, Construction and Maintenance Occupations by Sex
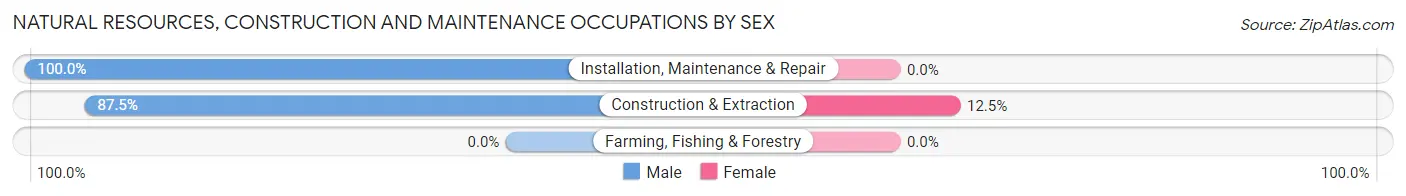
| Occupation | Male | Female |
| Farming, Fishing & Forestry | 0 (0.0%) | 0 (0.0%) |
| Construction & Extraction | 98 (87.5%) | 14 (12.5%) |
| Installation, Maintenance & Repair | 73 (100.0%) | 0 (0.0%) |
| Total (Category) | 171 (92.4%) | 14 (7.6%) |
| Total (Overall) | 2,268 (54.6%) | 1,884 (45.4%) |
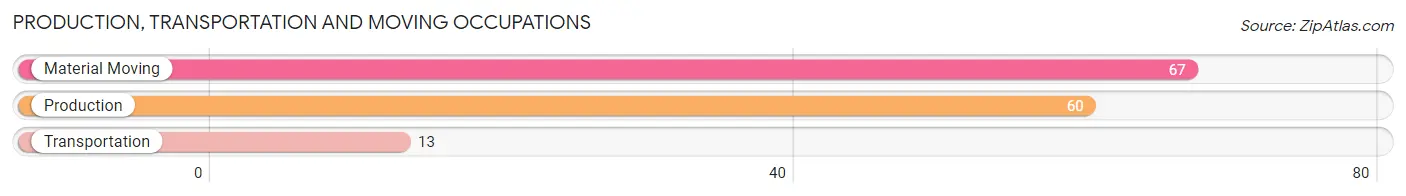
Production, Transportation and Moving Occupations
The most common Production, Transportation and Moving occupations in North Bend are Material Moving (67 | 1.6%), Production (60 | 1.5%), and Transportation (13 | 0.3%).
Production, Transportation and Moving Occupations by Sex
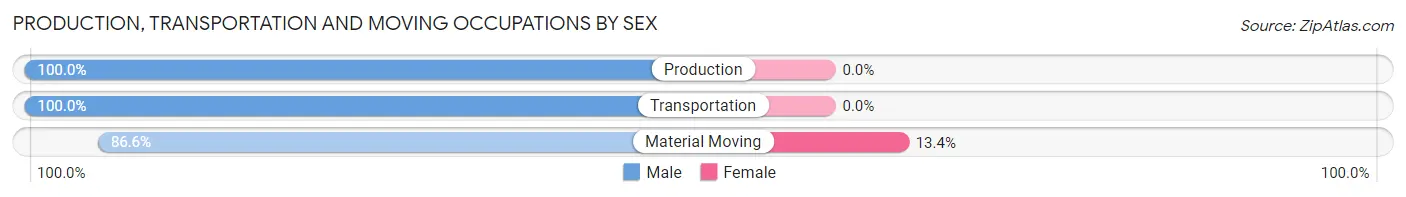
| Occupation | Male | Female |
| Production | 60 (100.0%) | 0 (0.0%) |
| Transportation | 13 (100.0%) | 0 (0.0%) |
| Material Moving | 58 (86.6%) | 9 (13.4%) |
| Total (Category) | 131 (93.6%) | 9 (6.4%) |
| Total (Overall) | 2,268 (54.6%) | 1,884 (45.4%) |
Employment Industries by Sex in North Bend
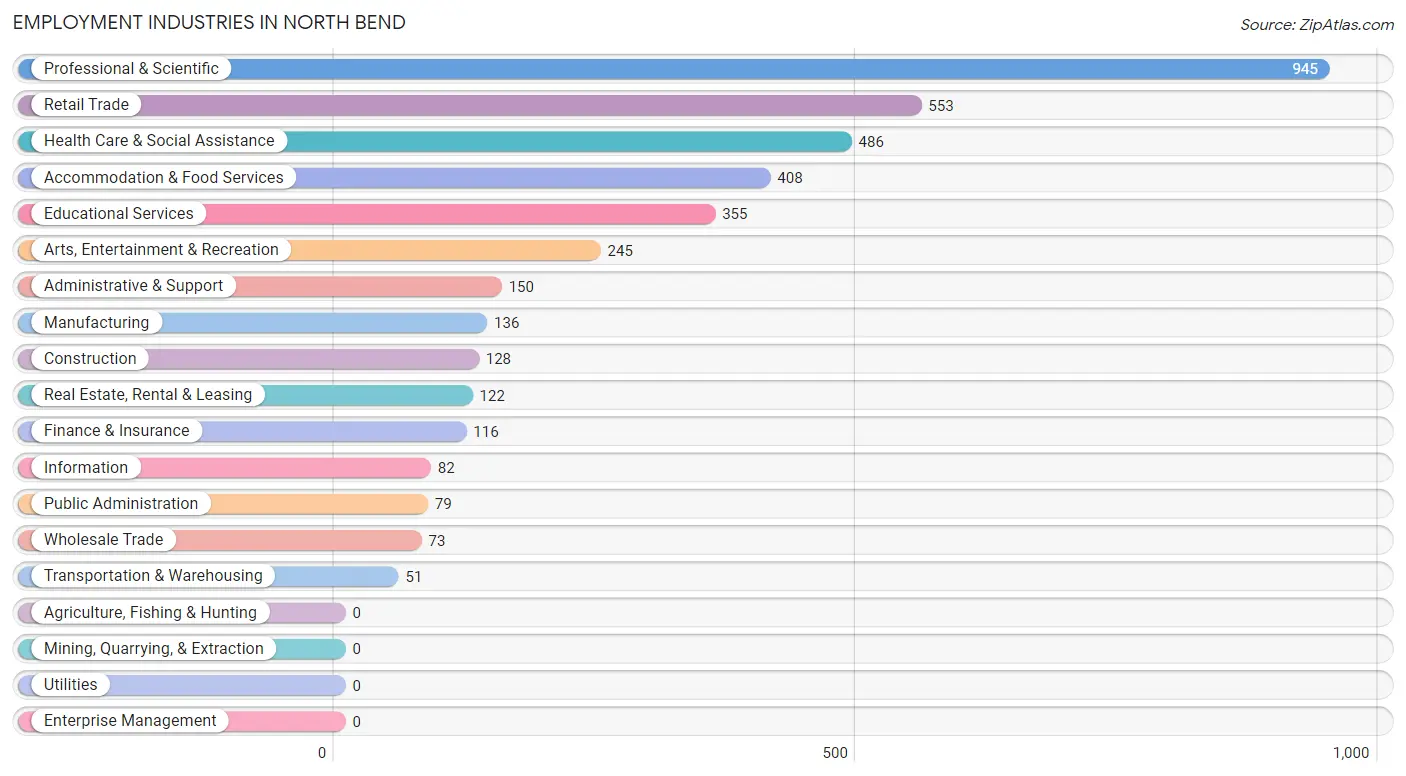
Employment Industries in North Bend
The major employment industries in North Bend include Professional & Scientific (945 | 22.8%), Retail Trade (553 | 13.3%), Health Care & Social Assistance (486 | 11.7%), Accommodation & Food Services (408 | 9.8%), and Educational Services (355 | 8.6%).
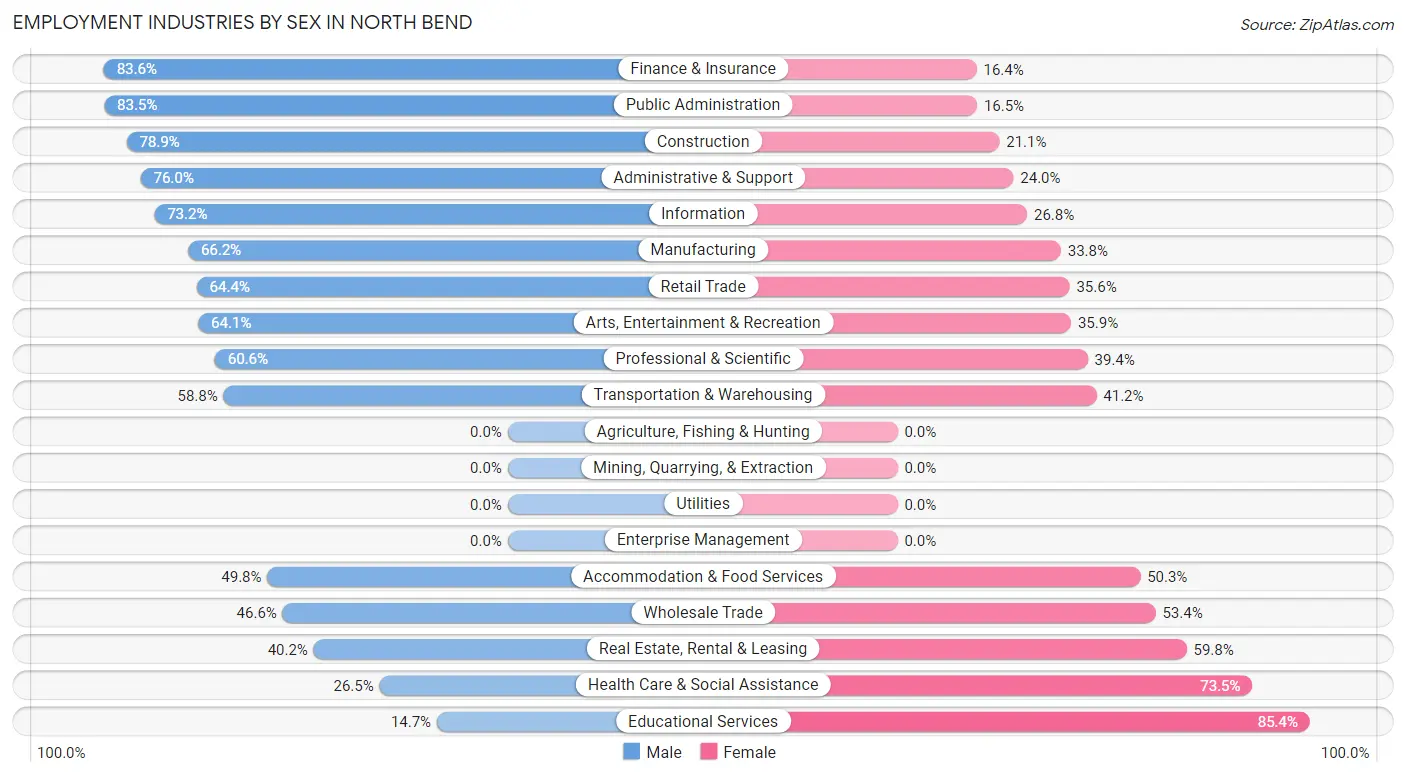
Employment Industries by Sex in North Bend
The North Bend industries that see more men than women are Finance & Insurance (83.6%), Public Administration (83.5%), and Construction (78.9%), whereas the industries that tend to have a higher number of women are Educational Services (85.4%), Health Care & Social Assistance (73.5%), and Real Estate, Rental & Leasing (59.8%).
| Industry | Male | Female |
| Agriculture, Fishing & Hunting | 0 (0.0%) | 0 (0.0%) |
| Mining, Quarrying, & Extraction | 0 (0.0%) | 0 (0.0%) |
| Construction | 101 (78.9%) | 27 (21.1%) |
| Manufacturing | 90 (66.2%) | 46 (33.8%) |
| Wholesale Trade | 34 (46.6%) | 39 (53.4%) |
| Retail Trade | 356 (64.4%) | 197 (35.6%) |
| Transportation & Warehousing | 30 (58.8%) | 21 (41.2%) |
| Utilities | 0 (0.0%) | 0 (0.0%) |
| Information | 60 (73.2%) | 22 (26.8%) |
| Finance & Insurance | 97 (83.6%) | 19 (16.4%) |
| Real Estate, Rental & Leasing | 49 (40.2%) | 73 (59.8%) |
| Professional & Scientific | 573 (60.6%) | 372 (39.4%) |
| Enterprise Management | 0 (0.0%) | 0 (0.0%) |
| Administrative & Support | 114 (76.0%) | 36 (24.0%) |
| Educational Services | 52 (14.6%) | 303 (85.4%) |
| Health Care & Social Assistance | 129 (26.5%) | 357 (73.5%) |
| Arts, Entertainment & Recreation | 157 (64.1%) | 88 (35.9%) |
| Accommodation & Food Services | 203 (49.7%) | 205 (50.2%) |
| Public Administration | 66 (83.5%) | 13 (16.5%) |
| Total | 2,268 (54.6%) | 1,884 (45.4%) |
Education in North Bend
School Enrollment in North Bend
The most common levels of schooling among the 1,644 students in North Bend are high school (469 | 28.5%), elementary school (446 | 27.1%), and middle school (282 | 17.2%).
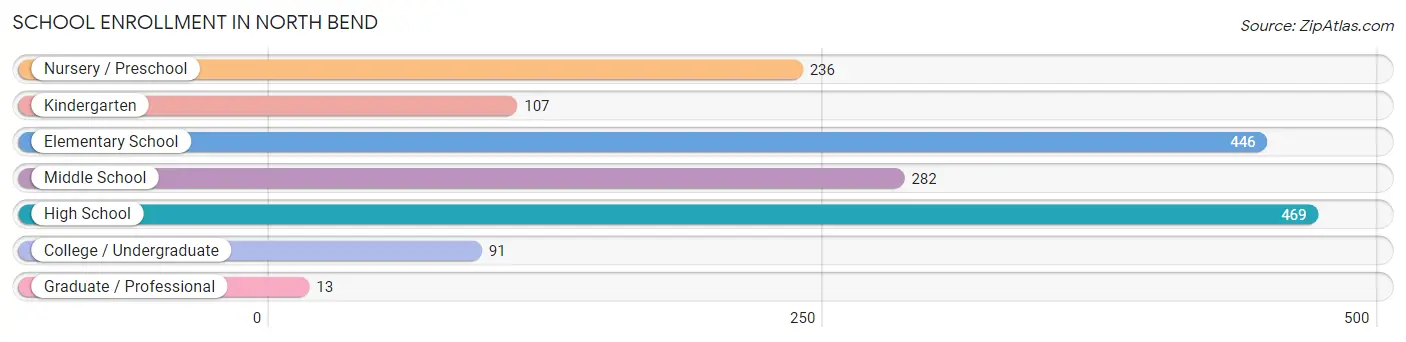
| School Level | # Students | % Students |
| Nursery / Preschool | 236 | 14.4% |
| Kindergarten | 107 | 6.5% |
| Elementary School | 446 | 27.1% |
| Middle School | 282 | 17.2% |
| High School | 469 | 28.5% |
| College / Undergraduate | 91 | 5.5% |
| Graduate / Professional | 13 | 0.8% |
| Total | 1,644 | 100.0% |
School Enrollment by Age by Funding Source in North Bend
Out of a total of 1,644 students who are enrolled in schools in North Bend, 324 (19.7%) attend a private institution, while the remaining 1,320 (80.3%) are enrolled in public schools. The age group of 3 to 4 year olds has the highest likelihood of being enrolled in private schools, with 193 (92.3% in the age bracket) enrolled. Conversely, the age group of 18 to 19 year olds has the lowest likelihood of being enrolled in a private school, with 185 (100.0% in the age bracket) attending a public institution.
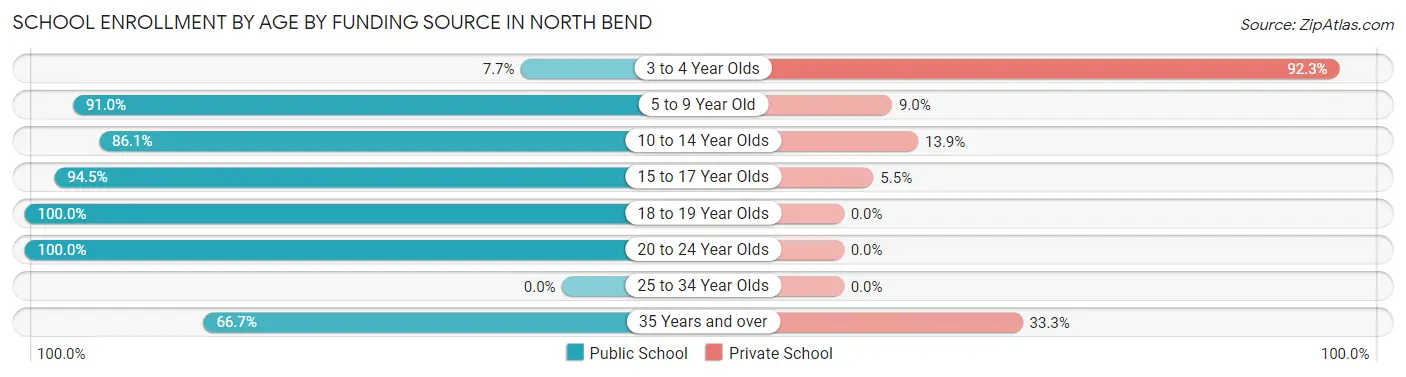
| Age Bracket | Public School | Private School |
| 3 to 4 Year Olds | 16 (7.7%) | 193 (92.3%) |
| 5 to 9 Year Old | 415 (91.0%) | 41 (9.0%) |
| 10 to 14 Year Olds | 385 (86.1%) | 62 (13.9%) |
| 15 to 17 Year Olds | 256 (94.5%) | 15 (5.5%) |
| 18 to 19 Year Olds | 185 (100.0%) | 0 (0.0%) |
| 20 to 24 Year Olds | 37 (100.0%) | 0 (0.0%) |
| 25 to 34 Year Olds | 0 (0.0%) | 0 (0.0%) |
| 35 Years and over | 26 (66.7%) | 13 (33.3%) |
| Total | 1,320 (80.3%) | 324 (19.7%) |
Educational Attainment by Field of Study in North Bend
Business (666 | 20.2%), education (450 | 13.6%), engineering (383 | 11.6%), bio, nature & agricultural (297 | 9.0%), and social sciences (253 | 7.7%) are the most common fields of study among 3,301 individuals in North Bend who have obtained a bachelor's degree or higher.
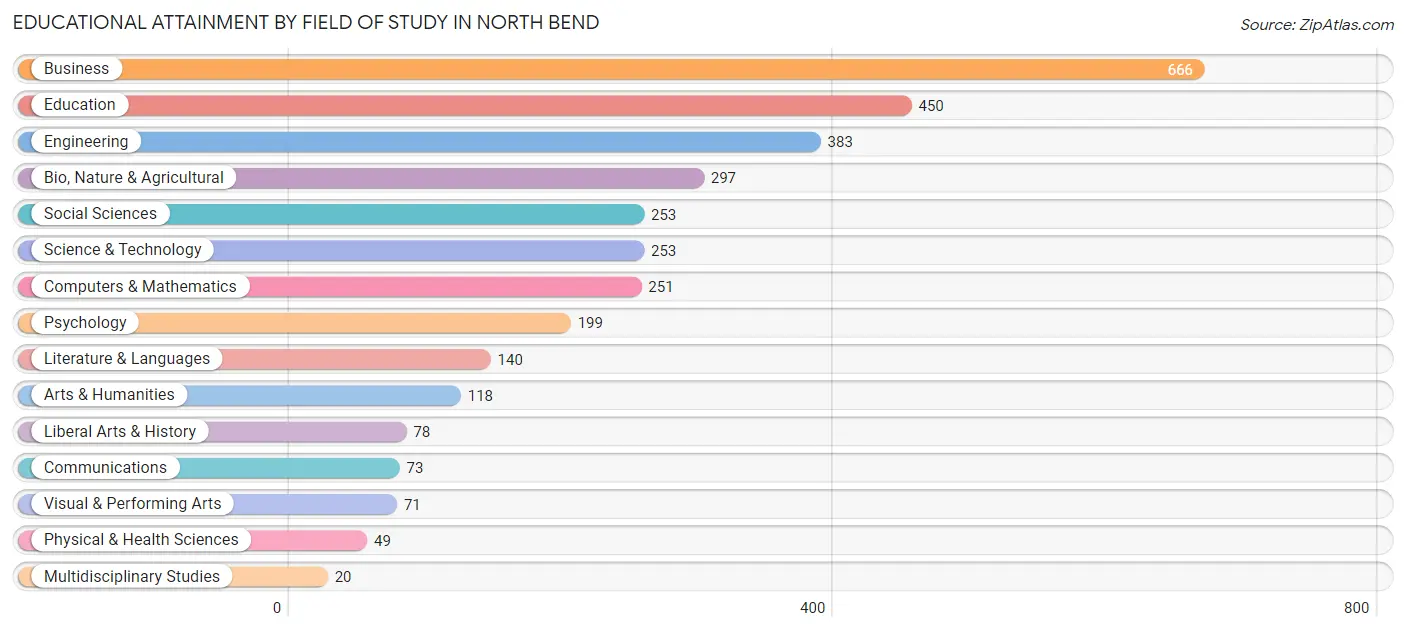
| Field of Study | # Graduates | % Graduates |
| Computers & Mathematics | 251 | 7.6% |
| Bio, Nature & Agricultural | 297 | 9.0% |
| Physical & Health Sciences | 49 | 1.5% |
| Psychology | 199 | 6.0% |
| Social Sciences | 253 | 7.7% |
| Engineering | 383 | 11.6% |
| Multidisciplinary Studies | 20 | 0.6% |
| Science & Technology | 253 | 7.7% |
| Business | 666 | 20.2% |
| Education | 450 | 13.6% |
| Literature & Languages | 140 | 4.2% |
| Liberal Arts & History | 78 | 2.4% |
| Visual & Performing Arts | 71 | 2.1% |
| Communications | 73 | 2.2% |
| Arts & Humanities | 118 | 3.6% |
| Total | 3,301 | 100.0% |
Transportation & Commute in North Bend
Vehicle Availability by Sex in North Bend
The most prevalent vehicle ownership categories in North Bend are males with 2 vehicles (1,172, accounting for 51.7%) and females with 2 vehicles (769, making up 74.7%).
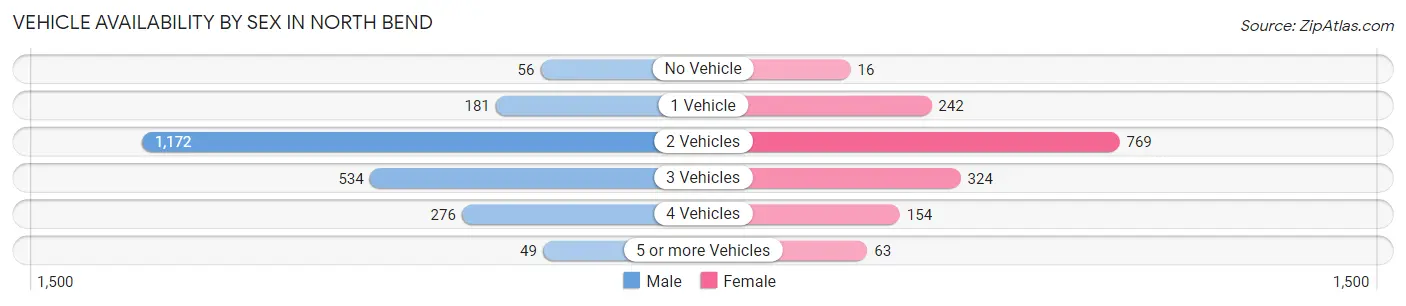
| Vehicles Available | Male | Female |
| No Vehicle | 56 (2.5%) | 16 (1.0%) |
| 1 Vehicle | 181 (8.0%) | 242 (15.4%) |
| 2 Vehicles | 1,172 (51.7%) | 769 (49.0%) |
| 3 Vehicles | 534 (23.5%) | 324 (20.7%) |
| 4 Vehicles | 276 (12.2%) | 154 (9.8%) |
| 5 or more Vehicles | 49 (2.2%) | 63 (4.0%) |
| Total | 2,268 (100.0%) | 1,568 (100.0%) |
Commute Time in North Bend
The most frequently occuring commute durations in North Bend are 20 to 24 minutes (400 commuters, 14.2%), 30 to 34 minutes (357 commuters, 12.7%), and 5 to 9 minutes (352 commuters, 12.5%).
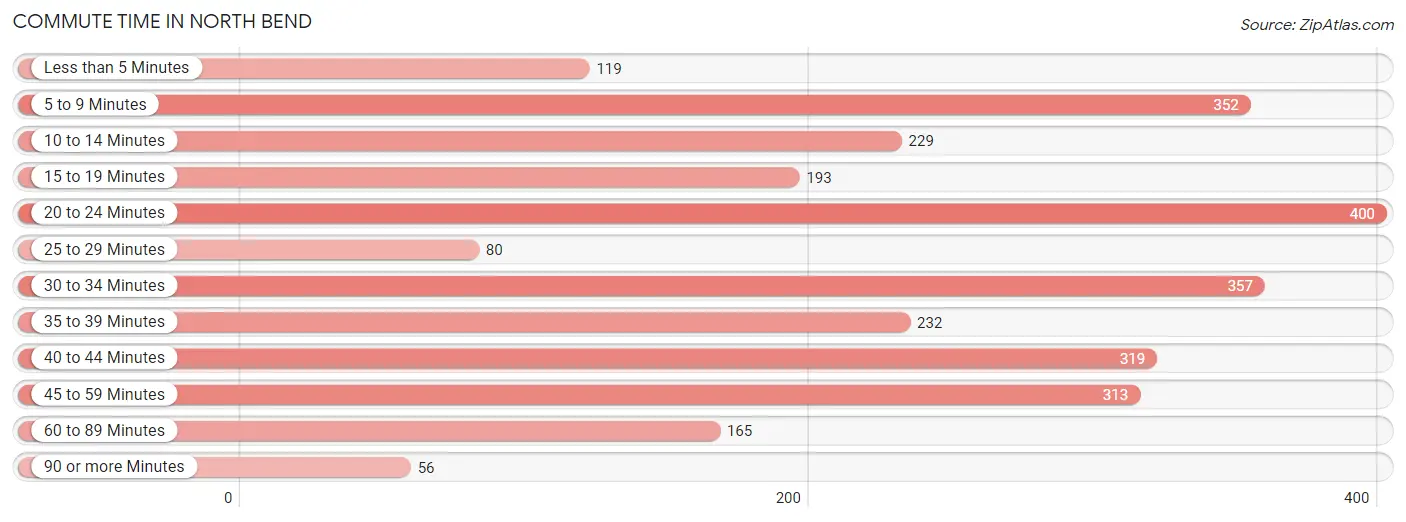
| Commute Time | # Commuters | % Commuters |
| Less than 5 Minutes | 119 | 4.2% |
| 5 to 9 Minutes | 352 | 12.5% |
| 10 to 14 Minutes | 229 | 8.1% |
| 15 to 19 Minutes | 193 | 6.9% |
| 20 to 24 Minutes | 400 | 14.2% |
| 25 to 29 Minutes | 80 | 2.8% |
| 30 to 34 Minutes | 357 | 12.7% |
| 35 to 39 Minutes | 232 | 8.2% |
| 40 to 44 Minutes | 319 | 11.3% |
| 45 to 59 Minutes | 313 | 11.1% |
| 60 to 89 Minutes | 165 | 5.9% |
| 90 or more Minutes | 56 | 2.0% |
Commute Time by Sex in North Bend
The most common commute times in North Bend are 40 to 44 minutes (243 commuters, 15.1%) for males and 20 to 24 minutes (258 commuters, 21.4%) for females.
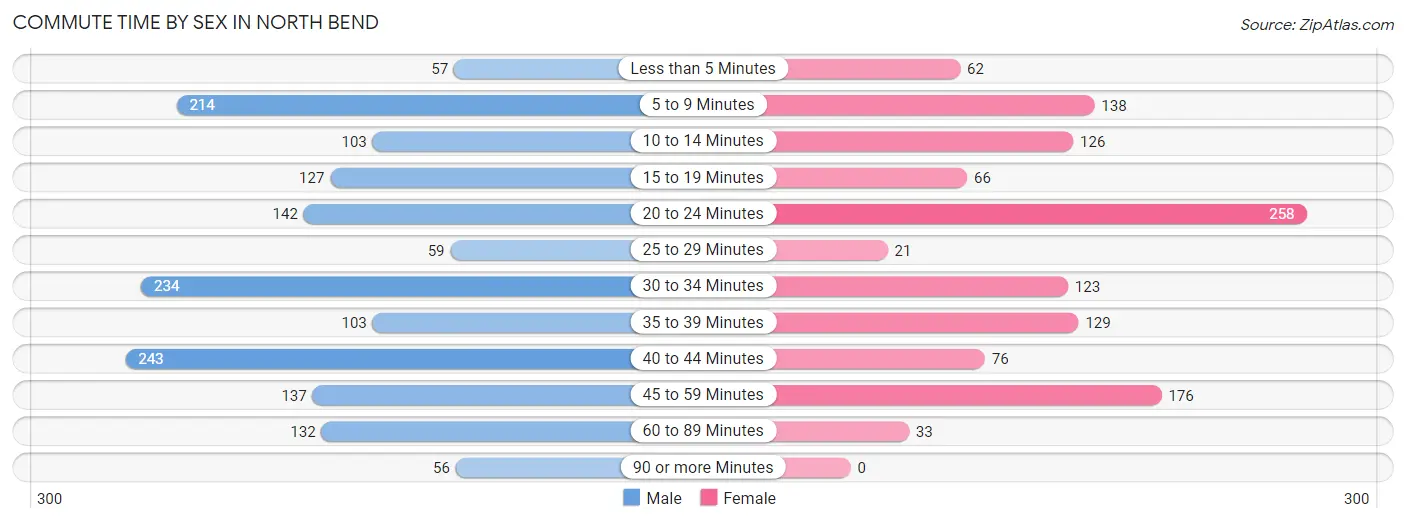
| Commute Time | Male | Female |
| Less than 5 Minutes | 57 (3.5%) | 62 (5.1%) |
| 5 to 9 Minutes | 214 (13.3%) | 138 (11.4%) |
| 10 to 14 Minutes | 103 (6.4%) | 126 (10.4%) |
| 15 to 19 Minutes | 127 (7.9%) | 66 (5.5%) |
| 20 to 24 Minutes | 142 (8.8%) | 258 (21.4%) |
| 25 to 29 Minutes | 59 (3.7%) | 21 (1.7%) |
| 30 to 34 Minutes | 234 (14.6%) | 123 (10.2%) |
| 35 to 39 Minutes | 103 (6.4%) | 129 (10.7%) |
| 40 to 44 Minutes | 243 (15.1%) | 76 (6.3%) |
| 45 to 59 Minutes | 137 (8.5%) | 176 (14.6%) |
| 60 to 89 Minutes | 132 (8.2%) | 33 (2.7%) |
| 90 or more Minutes | 56 (3.5%) | 0 (0.0%) |
Time of Departure to Work by Sex in North Bend
The most frequent times of departure to work in North Bend are 12:00 AM to 4:59 AM (254, 15.8%) for males and 6:00 AM to 6:29 AM (150, 12.4%) for females.
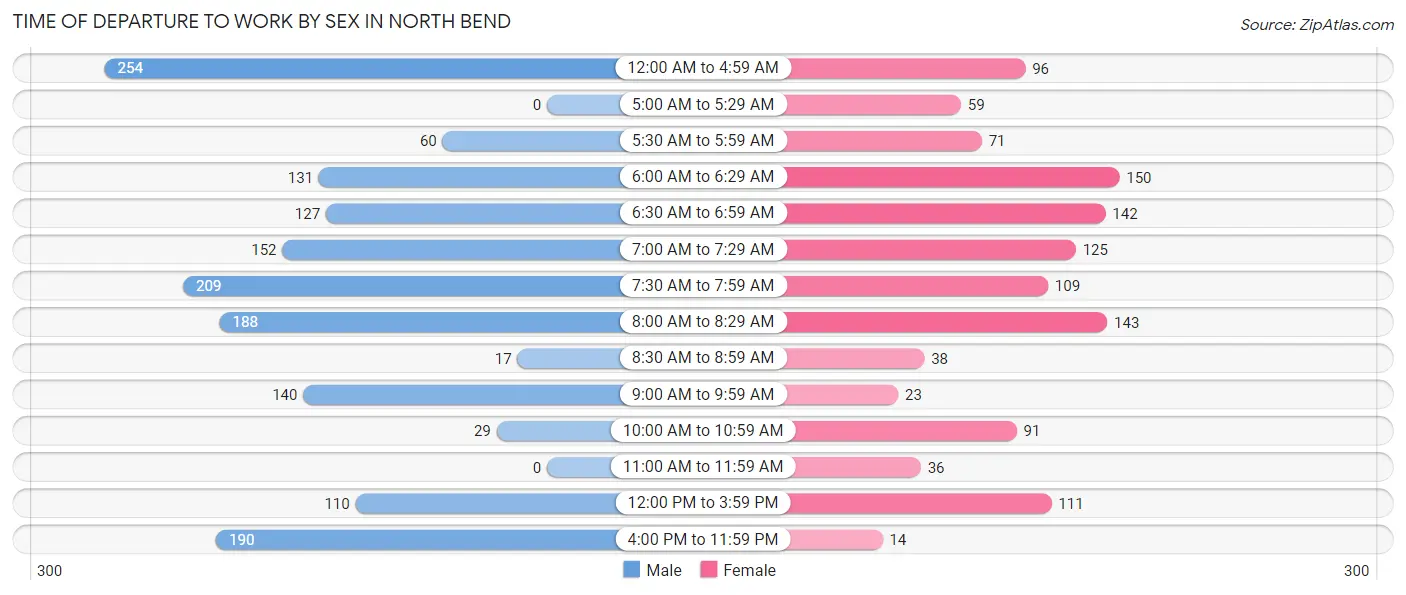
| Time of Departure | Male | Female |
| 12:00 AM to 4:59 AM | 254 (15.8%) | 96 (8.0%) |
| 5:00 AM to 5:29 AM | 0 (0.0%) | 59 (4.9%) |
| 5:30 AM to 5:59 AM | 60 (3.7%) | 71 (5.9%) |
| 6:00 AM to 6:29 AM | 131 (8.2%) | 150 (12.4%) |
| 6:30 AM to 6:59 AM | 127 (7.9%) | 142 (11.7%) |
| 7:00 AM to 7:29 AM | 152 (9.5%) | 125 (10.3%) |
| 7:30 AM to 7:59 AM | 209 (13.0%) | 109 (9.0%) |
| 8:00 AM to 8:29 AM | 188 (11.7%) | 143 (11.8%) |
| 8:30 AM to 8:59 AM | 17 (1.1%) | 38 (3.2%) |
| 9:00 AM to 9:59 AM | 140 (8.7%) | 23 (1.9%) |
| 10:00 AM to 10:59 AM | 29 (1.8%) | 91 (7.5%) |
| 11:00 AM to 11:59 AM | 0 (0.0%) | 36 (3.0%) |
| 12:00 PM to 3:59 PM | 110 (6.9%) | 111 (9.2%) |
| 4:00 PM to 11:59 PM | 190 (11.8%) | 14 (1.2%) |
| Total | 1,607 (100.0%) | 1,208 (100.0%) |
Housing Occupancy in North Bend
Occupancy by Ownership in North Bend
Of the total 2,797 dwellings in North Bend, owner-occupied units account for 2,045 (73.1%), while renter-occupied units make up 752 (26.9%).
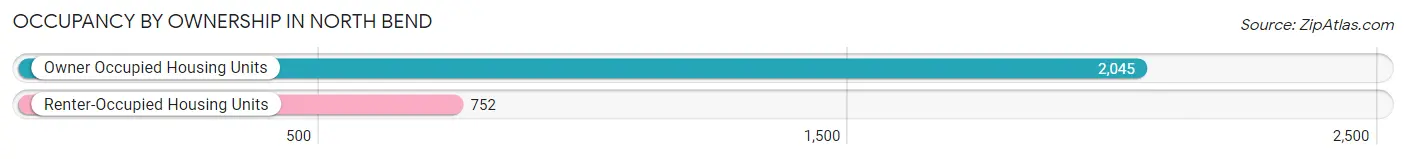
| Occupancy | # Housing Units | % Housing Units |
| Owner Occupied Housing Units | 2,045 | 73.1% |
| Renter-Occupied Housing Units | 752 | 26.9% |
| Total Occupied Housing Units | 2,797 | 100.0% |
Occupancy by Household Size in North Bend
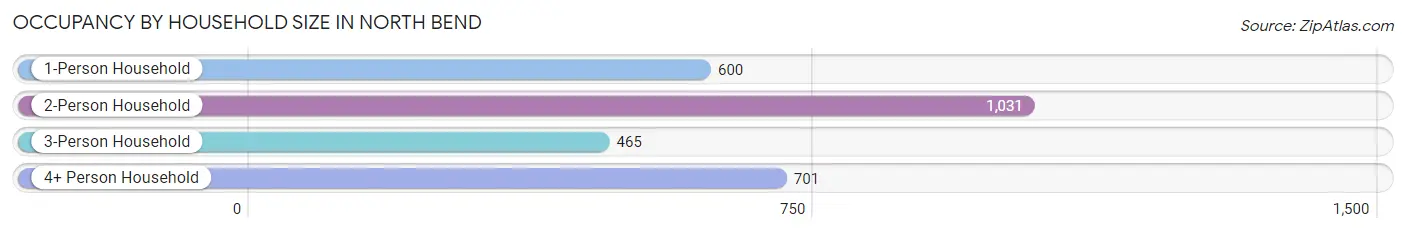
| Household Size | # Housing Units | % Housing Units |
| 1-Person Household | 600 | 21.4% |
| 2-Person Household | 1,031 | 36.9% |
| 3-Person Household | 465 | 16.6% |
| 4+ Person Household | 701 | 25.1% |
| Total Housing Units | 2,797 | 100.0% |
Occupancy by Ownership by Household Size in North Bend
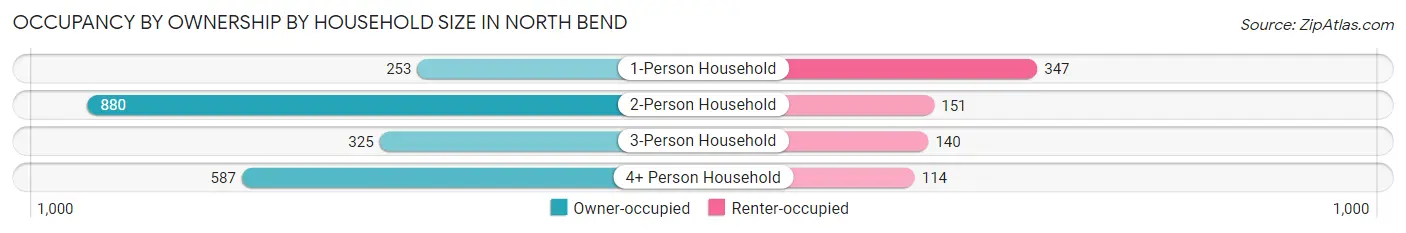
| Household Size | Owner-occupied | Renter-occupied |
| 1-Person Household | 253 (42.2%) | 347 (57.8%) |
| 2-Person Household | 880 (85.4%) | 151 (14.6%) |
| 3-Person Household | 325 (69.9%) | 140 (30.1%) |
| 4+ Person Household | 587 (83.7%) | 114 (16.3%) |
| Total Housing Units | 2,045 (73.1%) | 752 (26.9%) |
Occupancy by Educational Attainment in North Bend
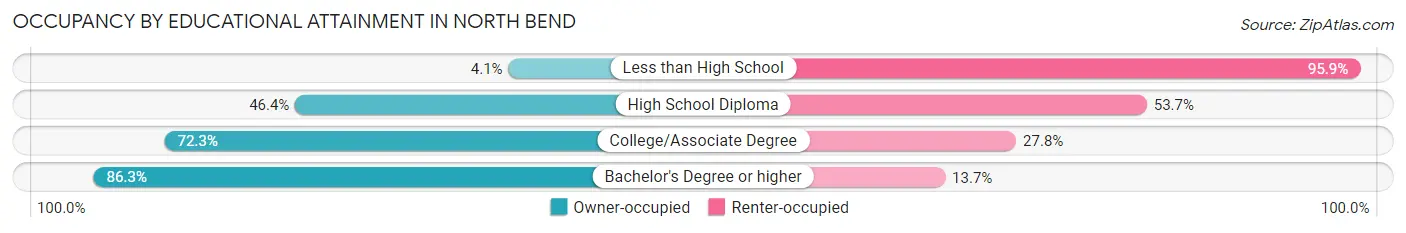
| Household Size | Owner-occupied | Renter-occupied |
| Less than High School | 5 (4.1%) | 118 (95.9%) |
| High School Diploma | 197 (46.4%) | 228 (53.6%) |
| College/Associate Degree | 505 (72.3%) | 194 (27.8%) |
| Bachelor's Degree or higher | 1,338 (86.3%) | 212 (13.7%) |
Occupancy by Age of Householder in North Bend
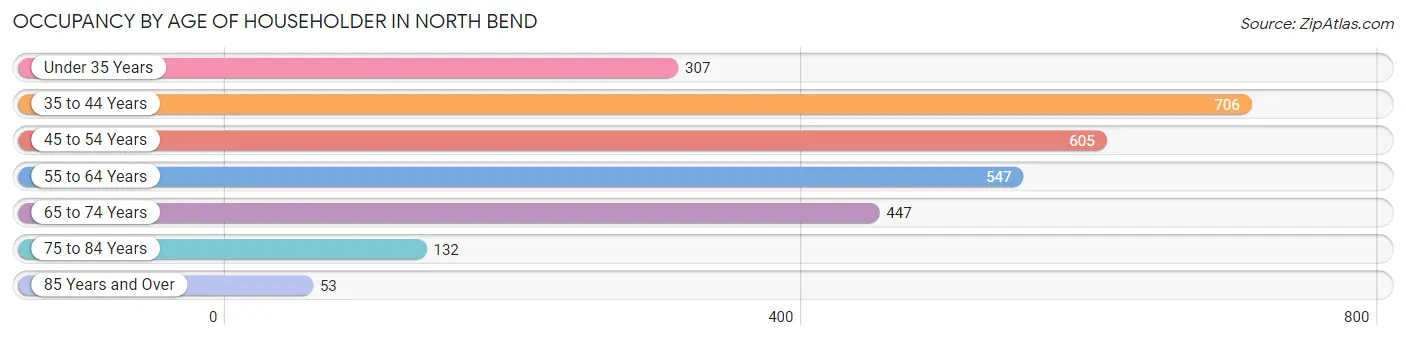
| Age Bracket | # Households | % Households |
| Under 35 Years | 307 | 11.0% |
| 35 to 44 Years | 706 | 25.2% |
| 45 to 54 Years | 605 | 21.6% |
| 55 to 64 Years | 547 | 19.6% |
| 65 to 74 Years | 447 | 16.0% |
| 75 to 84 Years | 132 | 4.7% |
| 85 Years and Over | 53 | 1.9% |
| Total | 2,797 | 100.0% |
Housing Finances in North Bend
Median Income by Occupancy in North Bend
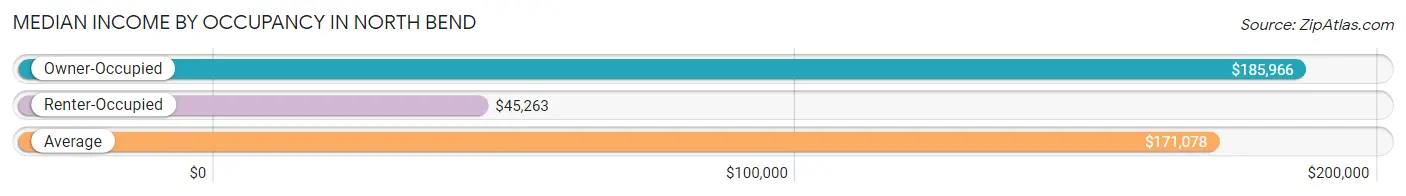
| Occupancy Type | # Households | Median Income |
| Owner-Occupied | 2,045 (73.1%) | $185,966 |
| Renter-Occupied | 752 (26.9%) | $45,263 |
| Average | 2,797 (100.0%) | $171,078 |
Occupancy by Householder Income Bracket in North Bend
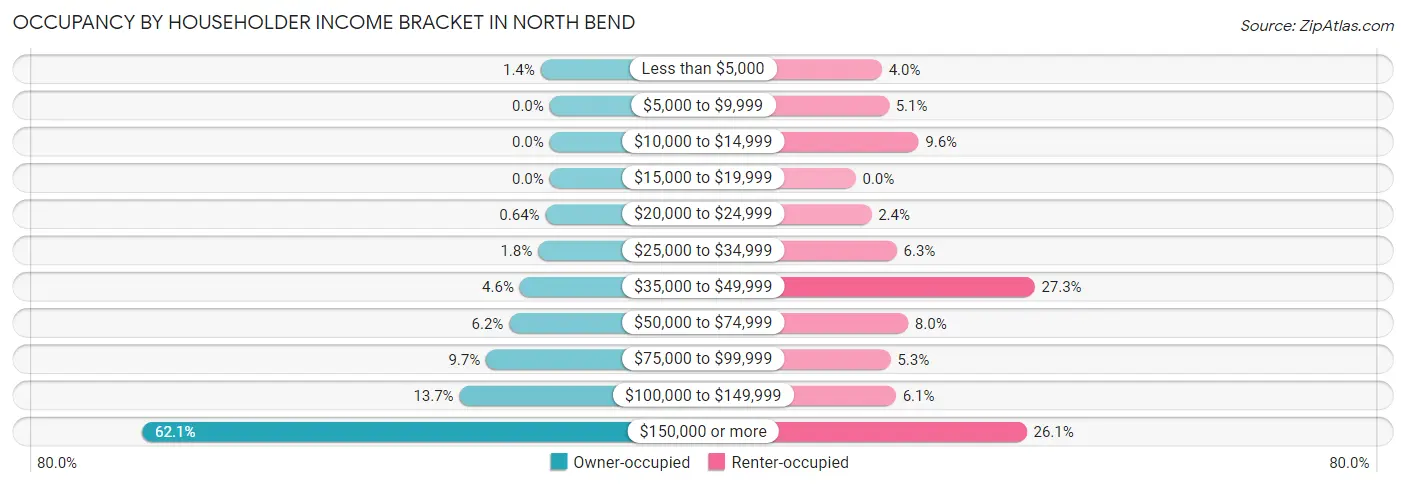
| Income Bracket | Owner-occupied | Renter-occupied |
| Less than $5,000 | 28 (1.4%) | 30 (4.0%) |
| $5,000 to $9,999 | 0 (0.0%) | 38 (5.1%) |
| $10,000 to $14,999 | 0 (0.0%) | 72 (9.6%) |
| $15,000 to $19,999 | 0 (0.0%) | 0 (0.0%) |
| $20,000 to $24,999 | 13 (0.6%) | 18 (2.4%) |
| $25,000 to $34,999 | 36 (1.8%) | 47 (6.2%) |
| $35,000 to $49,999 | 93 (4.5%) | 205 (27.3%) |
| $50,000 to $74,999 | 126 (6.2%) | 60 (8.0%) |
| $75,000 to $99,999 | 198 (9.7%) | 40 (5.3%) |
| $100,000 to $149,999 | 281 (13.7%) | 46 (6.1%) |
| $150,000 or more | 1,270 (62.1%) | 196 (26.1%) |
| Total | 2,045 (100.0%) | 752 (100.0%) |
Monthly Housing Cost Tiers in North Bend
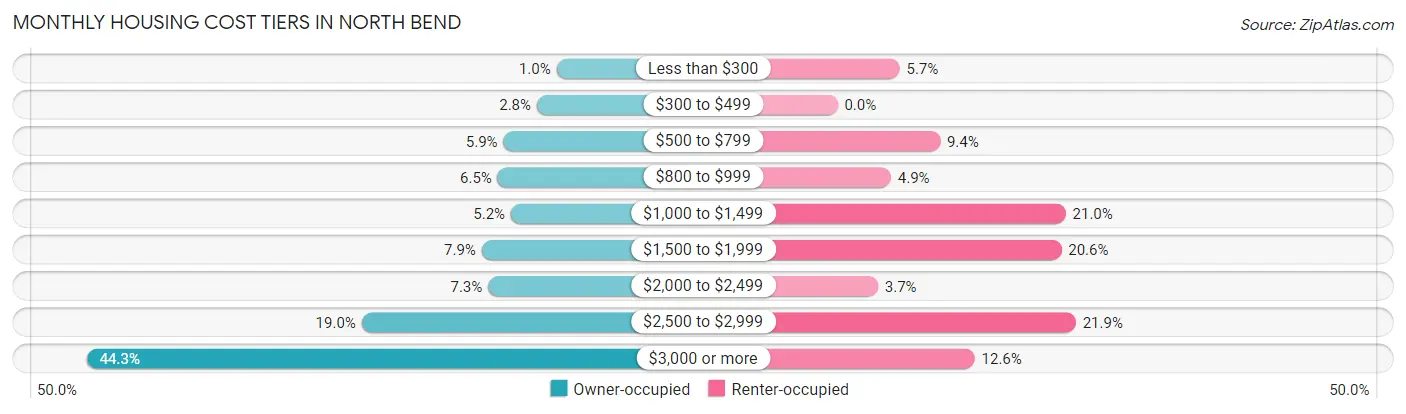
| Monthly Cost | Owner-occupied | Renter-occupied |
| Less than $300 | 21 (1.0%) | 43 (5.7%) |
| $300 to $499 | 58 (2.8%) | 0 (0.0%) |
| $500 to $799 | 121 (5.9%) | 71 (9.4%) |
| $800 to $999 | 132 (6.5%) | 37 (4.9%) |
| $1,000 to $1,499 | 107 (5.2%) | 158 (21.0%) |
| $1,500 to $1,999 | 162 (7.9%) | 155 (20.6%) |
| $2,000 to $2,499 | 150 (7.3%) | 28 (3.7%) |
| $2,500 to $2,999 | 388 (19.0%) | 165 (21.9%) |
| $3,000 or more | 906 (44.3%) | 95 (12.6%) |
| Total | 2,045 (100.0%) | 752 (100.0%) |
Physical Housing Characteristics in North Bend
Housing Structures in North Bend
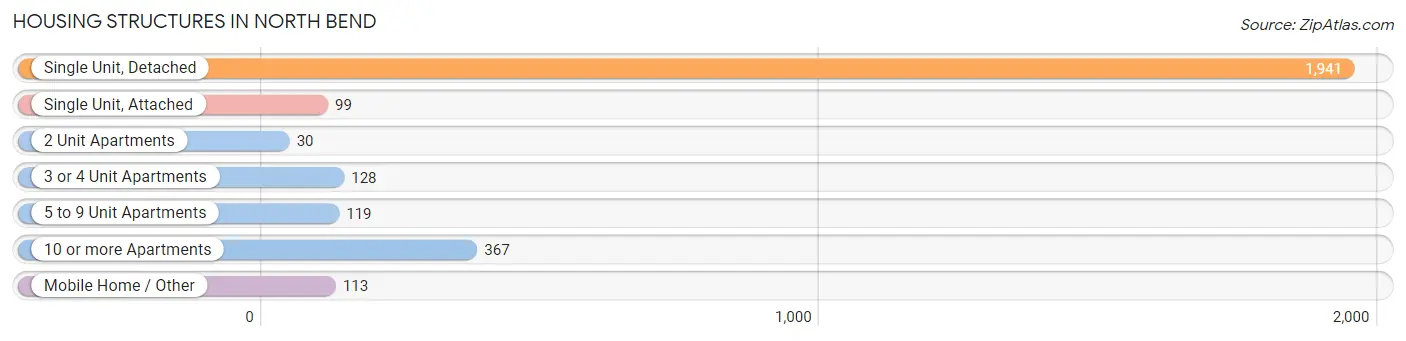
| Structure Type | # Housing Units | % Housing Units |
| Single Unit, Detached | 1,941 | 69.4% |
| Single Unit, Attached | 99 | 3.5% |
| 2 Unit Apartments | 30 | 1.1% |
| 3 or 4 Unit Apartments | 128 | 4.6% |
| 5 to 9 Unit Apartments | 119 | 4.3% |
| 10 or more Apartments | 367 | 13.1% |
| Mobile Home / Other | 113 | 4.0% |
| Total | 2,797 | 100.0% |
Housing Structures by Occupancy in North Bend
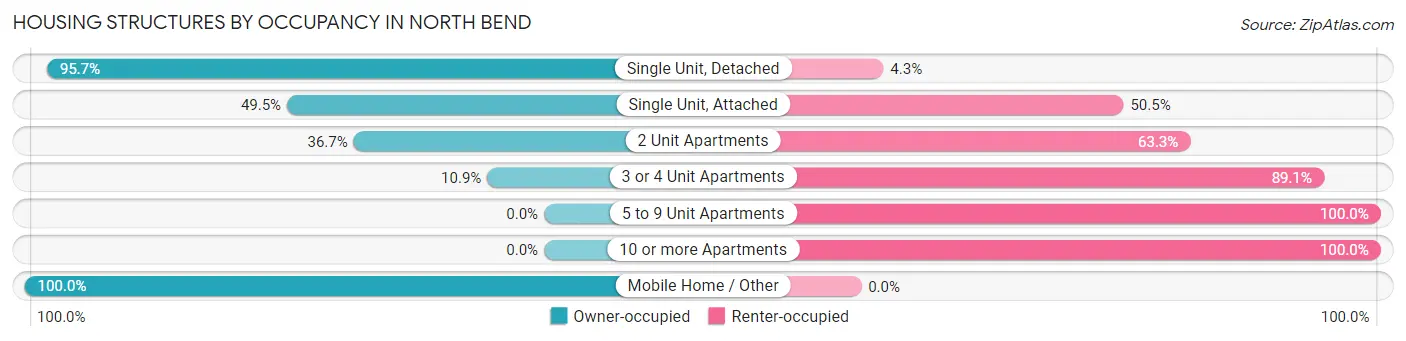
| Structure Type | Owner-occupied | Renter-occupied |
| Single Unit, Detached | 1,858 (95.7%) | 83 (4.3%) |
| Single Unit, Attached | 49 (49.5%) | 50 (50.5%) |
| 2 Unit Apartments | 11 (36.7%) | 19 (63.3%) |
| 3 or 4 Unit Apartments | 14 (10.9%) | 114 (89.1%) |
| 5 to 9 Unit Apartments | 0 (0.0%) | 119 (100.0%) |
| 10 or more Apartments | 0 (0.0%) | 367 (100.0%) |
| Mobile Home / Other | 113 (100.0%) | 0 (0.0%) |
| Total | 2,045 (73.1%) | 752 (26.9%) |
Housing Structures by Number of Rooms in North Bend
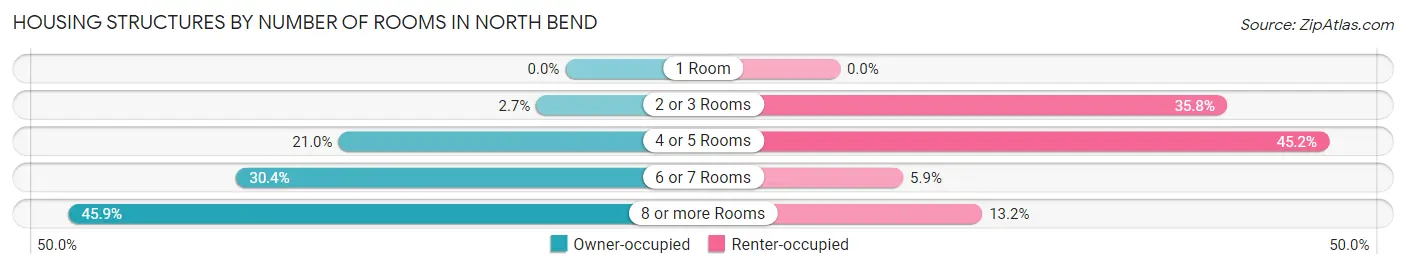
| Number of Rooms | Owner-occupied | Renter-occupied |
| 1 Room | 0 (0.0%) | 0 (0.0%) |
| 2 or 3 Rooms | 55 (2.7%) | 269 (35.8%) |
| 4 or 5 Rooms | 429 (21.0%) | 340 (45.2%) |
| 6 or 7 Rooms | 622 (30.4%) | 44 (5.9%) |
| 8 or more Rooms | 939 (45.9%) | 99 (13.2%) |
| Total | 2,045 (100.0%) | 752 (100.0%) |
Housing Structure by Heating Type in North Bend
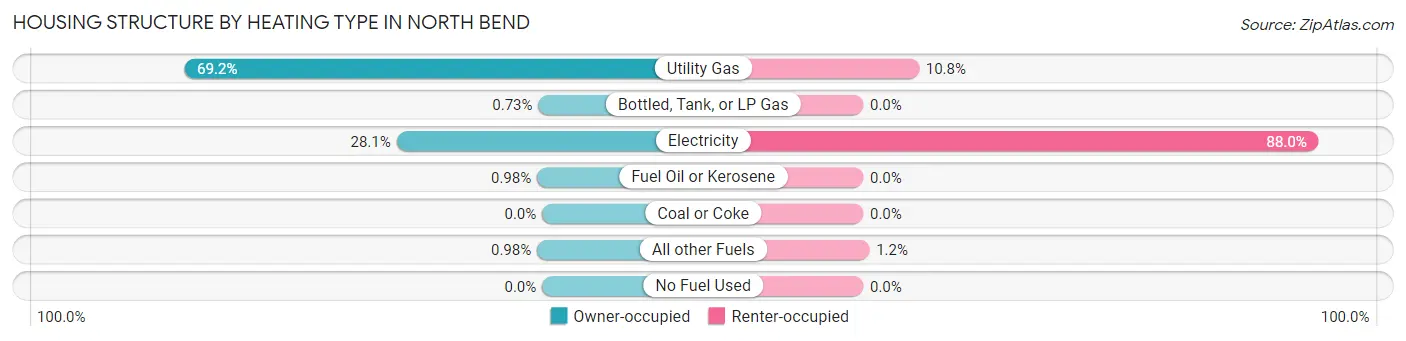
| Heating Type | Owner-occupied | Renter-occupied |
| Utility Gas | 1,415 (69.2%) | 81 (10.8%) |
| Bottled, Tank, or LP Gas | 15 (0.7%) | 0 (0.0%) |
| Electricity | 575 (28.1%) | 662 (88.0%) |
| Fuel Oil or Kerosene | 20 (1.0%) | 0 (0.0%) |
| Coal or Coke | 0 (0.0%) | 0 (0.0%) |
| All other Fuels | 20 (1.0%) | 9 (1.2%) |
| No Fuel Used | 0 (0.0%) | 0 (0.0%) |
| Total | 2,045 (100.0%) | 752 (100.0%) |
Household Vehicle Usage in North Bend
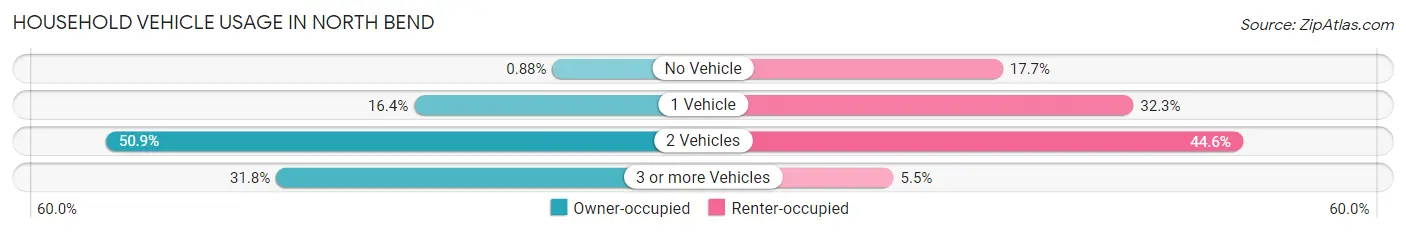
| Vehicles per Household | Owner-occupied | Renter-occupied |
| No Vehicle | 18 (0.9%) | 133 (17.7%) |
| 1 Vehicle | 335 (16.4%) | 243 (32.3%) |
| 2 Vehicles | 1,041 (50.9%) | 335 (44.6%) |
| 3 or more Vehicles | 651 (31.8%) | 41 (5.4%) |
| Total | 2,045 (100.0%) | 752 (100.0%) |
Real Estate & Mortgages in North Bend
Real Estate and Mortgage Overview in North Bend
| Characteristic | Without Mortgage | With Mortgage |
| Housing Units | 491 | 1,554 |
| Median Property Value | $665,700 | $911,500 |
| Median Household Income | $84,406 | $1,182 |
| Monthly Housing Costs | $858 | $906 |
| Real Estate Taxes | $5,202 | $0 |
Property Value by Mortgage Status in North Bend
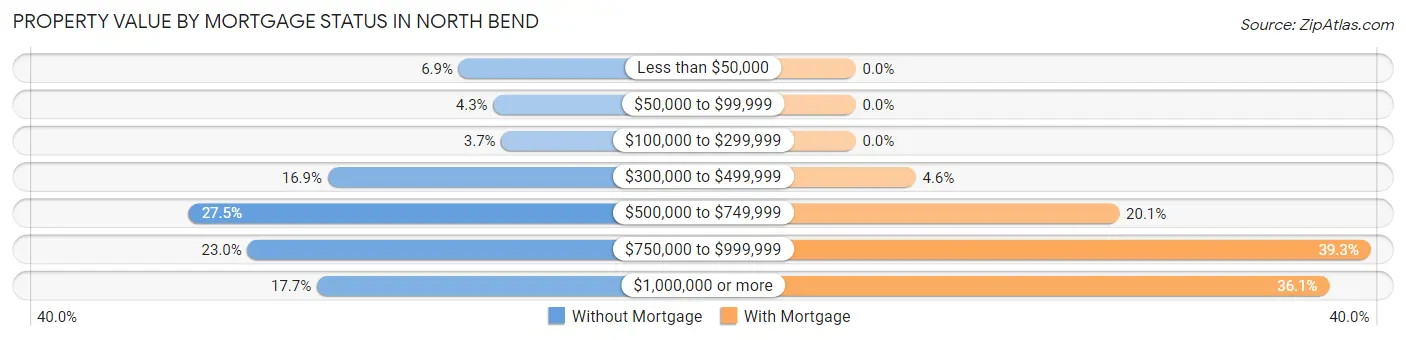
| Property Value | Without Mortgage | With Mortgage |
| Less than $50,000 | 34 (6.9%) | 0 (0.0%) |
| $50,000 to $99,999 | 21 (4.3%) | 0 (0.0%) |
| $100,000 to $299,999 | 18 (3.7%) | 0 (0.0%) |
| $300,000 to $499,999 | 83 (16.9%) | 71 (4.6%) |
| $500,000 to $749,999 | 135 (27.5%) | 312 (20.1%) |
| $750,000 to $999,999 | 113 (23.0%) | 610 (39.3%) |
| $1,000,000 or more | 87 (17.7%) | 561 (36.1%) |
| Total | 491 (100.0%) | 1,554 (100.0%) |
Household Income by Mortgage Status in North Bend
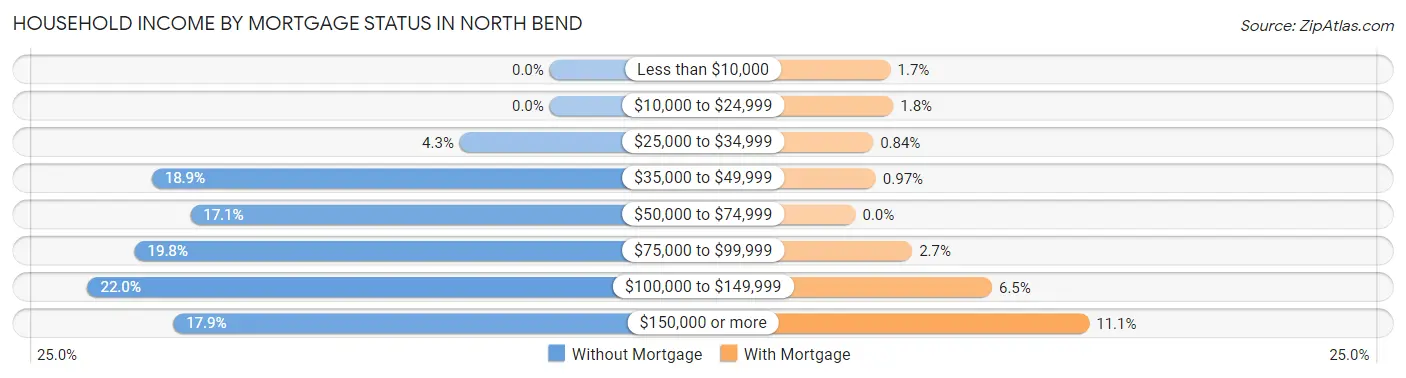
| Household Income | Without Mortgage | With Mortgage |
| Less than $10,000 | 0 (0.0%) | 26 (1.7%) |
| $10,000 to $24,999 | 0 (0.0%) | 28 (1.8%) |
| $25,000 to $34,999 | 21 (4.3%) | 13 (0.8%) |
| $35,000 to $49,999 | 93 (18.9%) | 15 (1.0%) |
| $50,000 to $74,999 | 84 (17.1%) | 0 (0.0%) |
| $75,000 to $99,999 | 97 (19.8%) | 42 (2.7%) |
| $100,000 to $149,999 | 108 (22.0%) | 101 (6.5%) |
| $150,000 or more | 88 (17.9%) | 173 (11.1%) |
| Total | 491 (100.0%) | 1,554 (100.0%) |
Property Value to Household Income Ratio in North Bend
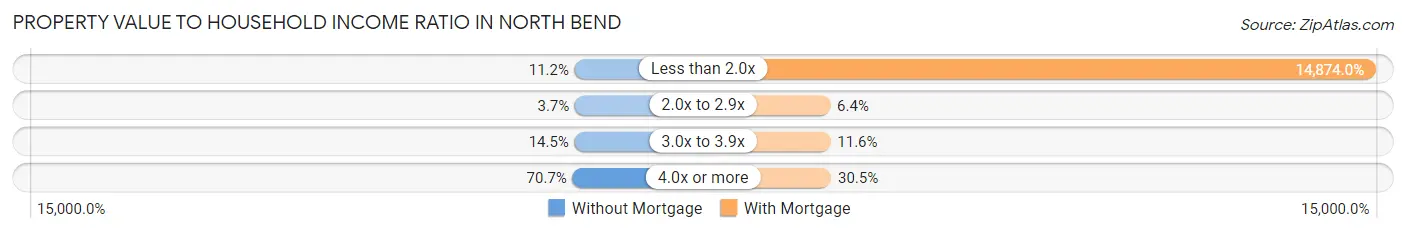
| Value-to-Income Ratio | Without Mortgage | With Mortgage |
| Less than 2.0x | 55 (11.2%) | 231,142 (14,874.0%) |
| 2.0x to 2.9x | 18 (3.7%) | 99 (6.4%) |
| 3.0x to 3.9x | 71 (14.5%) | 180 (11.6%) |
| 4.0x or more | 347 (70.7%) | 474 (30.5%) |
| Total | 491 (100.0%) | 1,554 (100.0%) |
Real Estate Taxes by Mortgage Status in North Bend
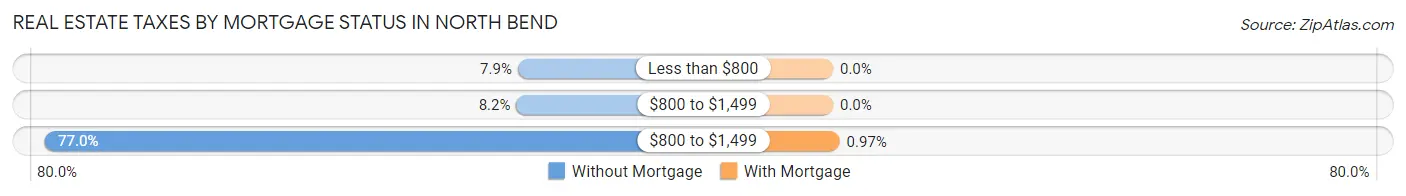
| Property Taxes | Without Mortgage | With Mortgage |
| Less than $800 | 39 (7.9%) | 0 (0.0%) |
| $800 to $1,499 | 40 (8.2%) | 0 (0.0%) |
| $800 to $1,499 | 378 (77.0%) | 15 (1.0%) |
| Total | 491 (100.0%) | 1,554 (100.0%) |
Health & Disability in North Bend
Health Insurance Coverage by Age in North Bend
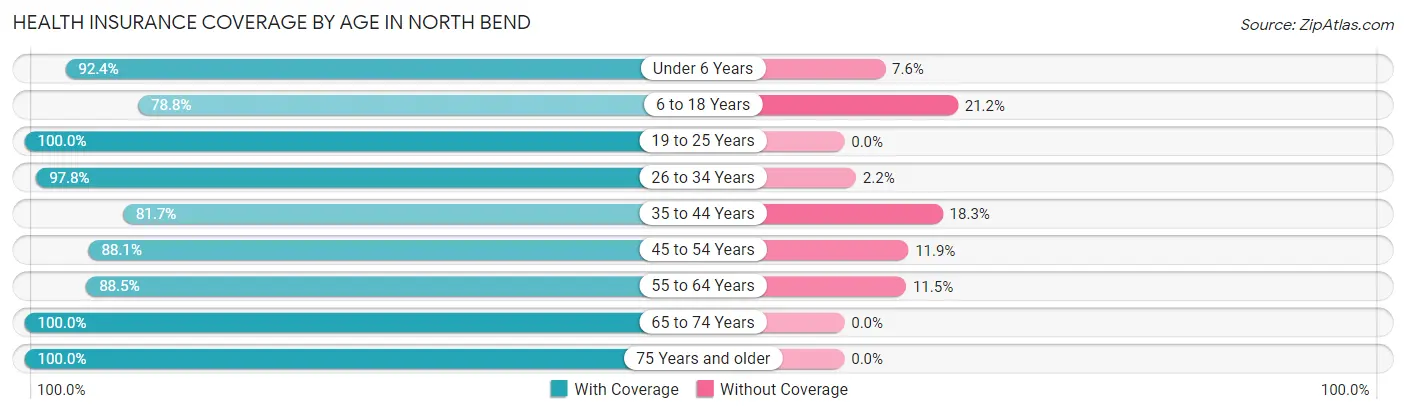
| Age Bracket | With Coverage | Without Coverage |
| Under 6 Years | 510 (92.4%) | 42 (7.6%) |
| 6 to 18 Years | 1,102 (78.8%) | 296 (21.2%) |
| 19 to 25 Years | 357 (100.0%) | 0 (0.0%) |
| 26 to 34 Years | 813 (97.8%) | 18 (2.2%) |
| 35 to 44 Years | 1,140 (81.7%) | 256 (18.3%) |
| 45 to 54 Years | 931 (88.1%) | 126 (11.9%) |
| 55 to 64 Years | 862 (88.5%) | 112 (11.5%) |
| 65 to 74 Years | 687 (100.0%) | 0 (0.0%) |
| 75 Years and older | 297 (100.0%) | 0 (0.0%) |
| Total | 6,699 (88.7%) | 850 (11.3%) |
Health Insurance Coverage by Citizenship Status in North Bend
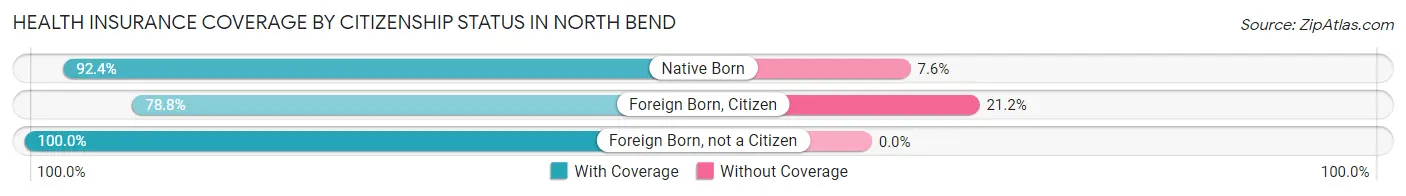
| Citizenship Status | With Coverage | Without Coverage |
| Native Born | 510 (92.4%) | 42 (7.6%) |
| Foreign Born, Citizen | 1,102 (78.8%) | 296 (21.2%) |
| Foreign Born, not a Citizen | 357 (100.0%) | 0 (0.0%) |
Health Insurance Coverage by Household Income in North Bend
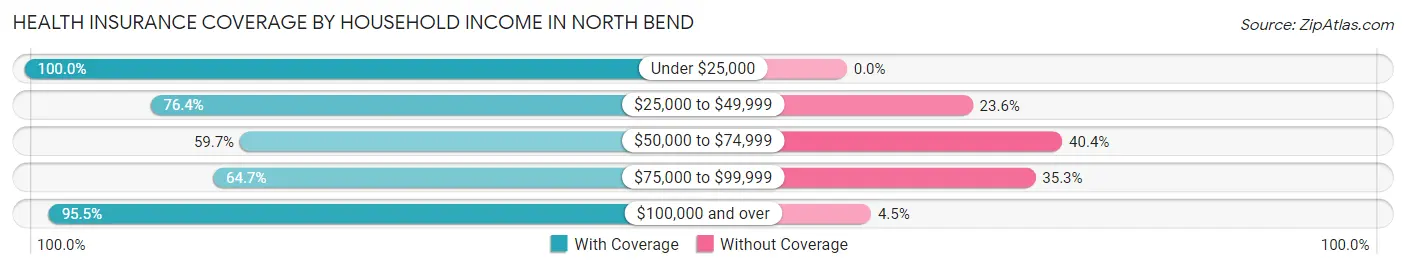
| Household Income | With Coverage | Without Coverage |
| Under $25,000 | 307 (100.0%) | 0 (0.0%) |
| $25,000 to $49,999 | 431 (76.4%) | 133 (23.6%) |
| $50,000 to $74,999 | 371 (59.7%) | 251 (40.4%) |
| $75,000 to $99,999 | 410 (64.7%) | 224 (35.3%) |
| $100,000 and over | 5,104 (95.5%) | 242 (4.5%) |
Public vs Private Health Insurance Coverage by Age in North Bend
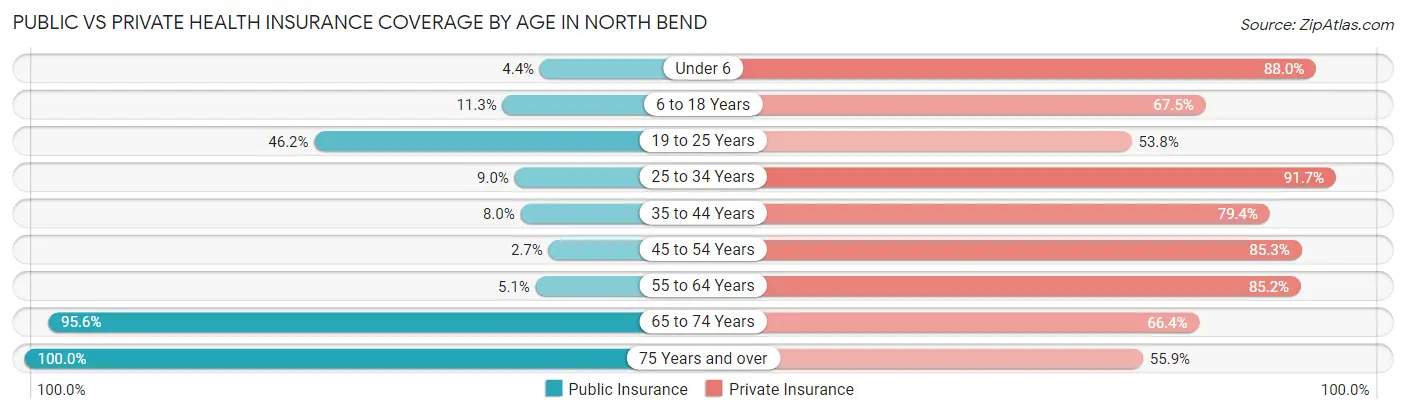
| Age Bracket | Public Insurance | Private Insurance |
| Under 6 | 24 (4.3%) | 486 (88.0%) |
| 6 to 18 Years | 158 (11.3%) | 944 (67.5%) |
| 19 to 25 Years | 165 (46.2%) | 192 (53.8%) |
| 25 to 34 Years | 75 (9.0%) | 762 (91.7%) |
| 35 to 44 Years | 111 (8.0%) | 1,109 (79.4%) |
| 45 to 54 Years | 29 (2.7%) | 902 (85.3%) |
| 55 to 64 Years | 50 (5.1%) | 830 (85.2%) |
| 65 to 74 Years | 657 (95.6%) | 456 (66.4%) |
| 75 Years and over | 297 (100.0%) | 166 (55.9%) |
| Total | 1,566 (20.7%) | 5,847 (77.4%) |
Disability Status by Sex by Age in North Bend
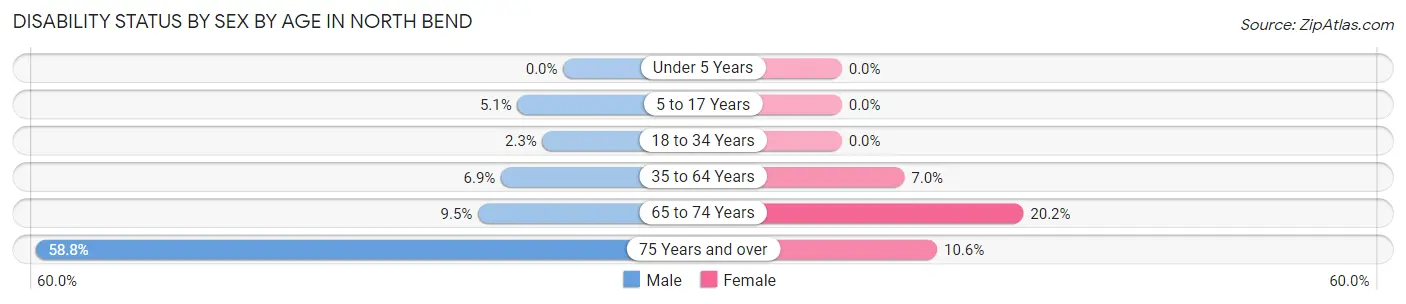
| Age Bracket | Male | Female |
| Under 5 Years | 0 (0.0%) | 0 (0.0%) |
| 5 to 17 Years | 32 (5.1%) | 0 (0.0%) |
| 18 to 34 Years | 14 (2.3%) | 0 (0.0%) |
| 35 to 64 Years | 128 (6.9%) | 110 (7.0%) |
| 65 to 74 Years | 30 (9.5%) | 75 (20.2%) |
| 75 Years and over | 97 (58.8%) | 14 (10.6%) |
Disability Class by Sex by Age in North Bend
Disability Class: Hearing Difficulty
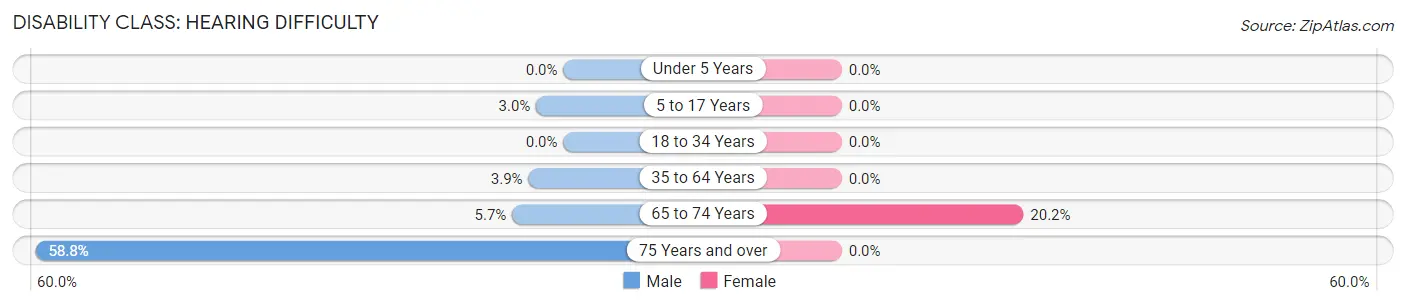
| Age Bracket | Male | Female |
| Under 5 Years | 0 (0.0%) | 0 (0.0%) |
| 5 to 17 Years | 19 (3.0%) | 0 (0.0%) |
| 18 to 34 Years | 0 (0.0%) | 0 (0.0%) |
| 35 to 64 Years | 72 (3.9%) | 0 (0.0%) |
| 65 to 74 Years | 18 (5.7%) | 75 (20.2%) |
| 75 Years and over | 97 (58.8%) | 0 (0.0%) |
Disability Class: Vision Difficulty
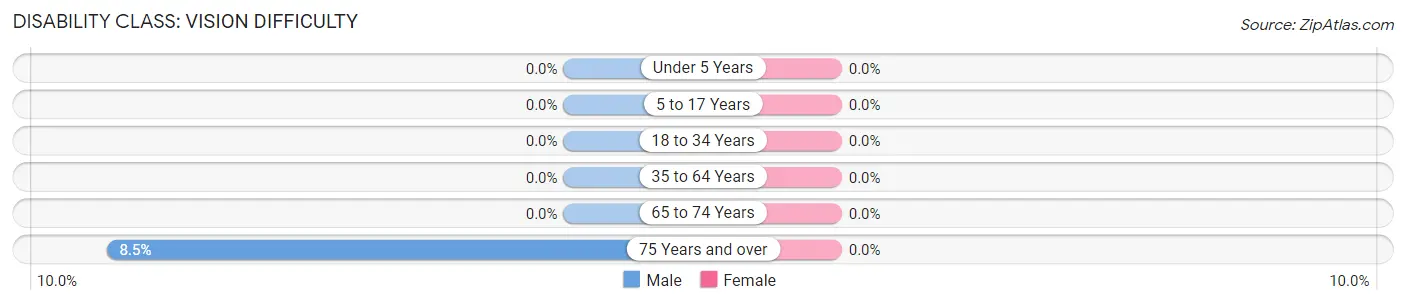
| Age Bracket | Male | Female |
| Under 5 Years | 0 (0.0%) | 0 (0.0%) |
| 5 to 17 Years | 0 (0.0%) | 0 (0.0%) |
| 18 to 34 Years | 0 (0.0%) | 0 (0.0%) |
| 35 to 64 Years | 0 (0.0%) | 0 (0.0%) |
| 65 to 74 Years | 0 (0.0%) | 0 (0.0%) |
| 75 Years and over | 14 (8.5%) | 0 (0.0%) |
Disability Class: Cognitive Difficulty
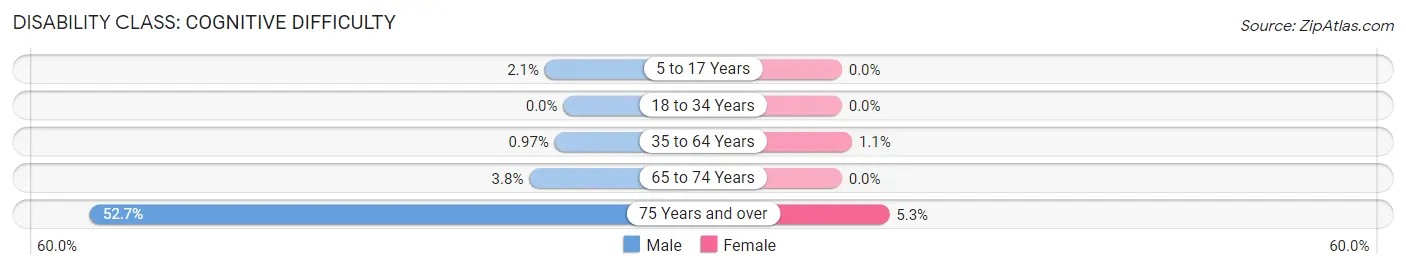
| Age Bracket | Male | Female |
| 5 to 17 Years | 13 (2.1%) | 0 (0.0%) |
| 18 to 34 Years | 0 (0.0%) | 0 (0.0%) |
| 35 to 64 Years | 18 (1.0%) | 18 (1.1%) |
| 65 to 74 Years | 12 (3.8%) | 0 (0.0%) |
| 75 Years and over | 87 (52.7%) | 7 (5.3%) |
Disability Class: Ambulatory Difficulty
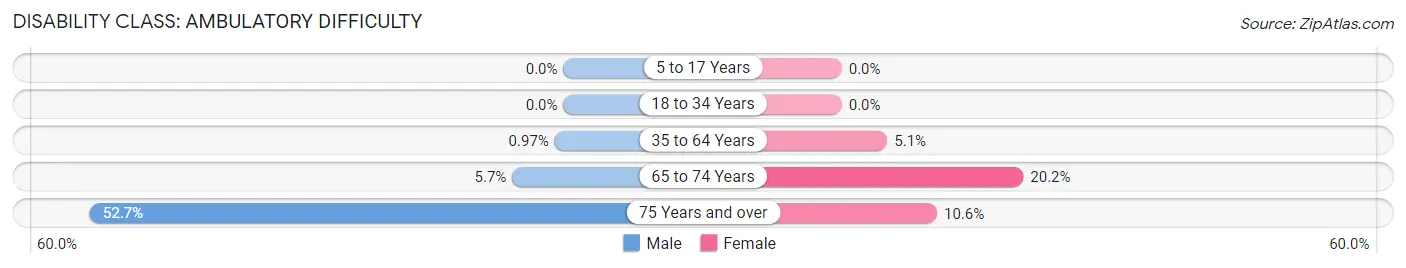
| Age Bracket | Male | Female |
| 5 to 17 Years | 0 (0.0%) | 0 (0.0%) |
| 18 to 34 Years | 0 (0.0%) | 0 (0.0%) |
| 35 to 64 Years | 18 (1.0%) | 80 (5.1%) |
| 65 to 74 Years | 18 (5.7%) | 75 (20.2%) |
| 75 Years and over | 87 (52.7%) | 14 (10.6%) |
Disability Class: Self-Care Difficulty
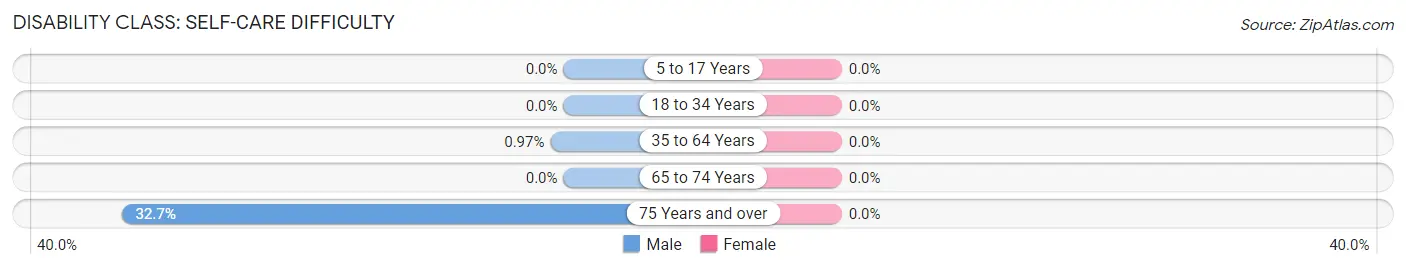
| Age Bracket | Male | Female |
| 5 to 17 Years | 0 (0.0%) | 0 (0.0%) |
| 18 to 34 Years | 0 (0.0%) | 0 (0.0%) |
| 35 to 64 Years | 18 (1.0%) | 0 (0.0%) |
| 65 to 74 Years | 0 (0.0%) | 0 (0.0%) |
| 75 Years and over | 54 (32.7%) | 0 (0.0%) |
Technology Access in North Bend
Computing Device Access in North Bend
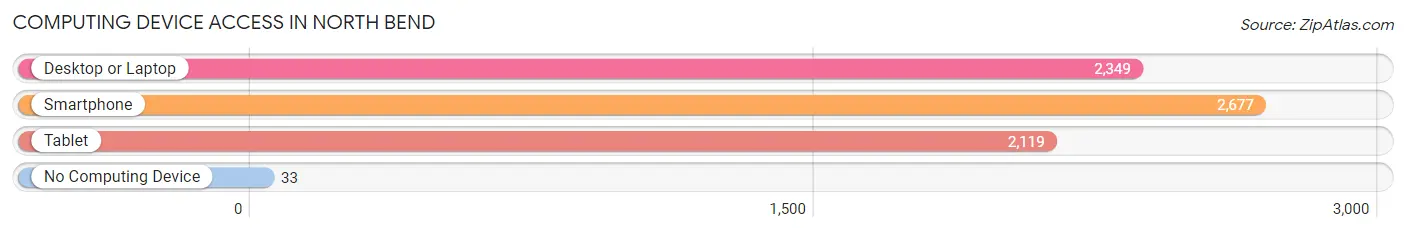
| Device Type | # Households | % Households |
| Desktop or Laptop | 2,349 | 84.0% |
| Smartphone | 2,677 | 95.7% |
| Tablet | 2,119 | 75.8% |
| No Computing Device | 33 | 1.2% |
| Total | 2,797 | 100.0% |
Internet Access in North Bend
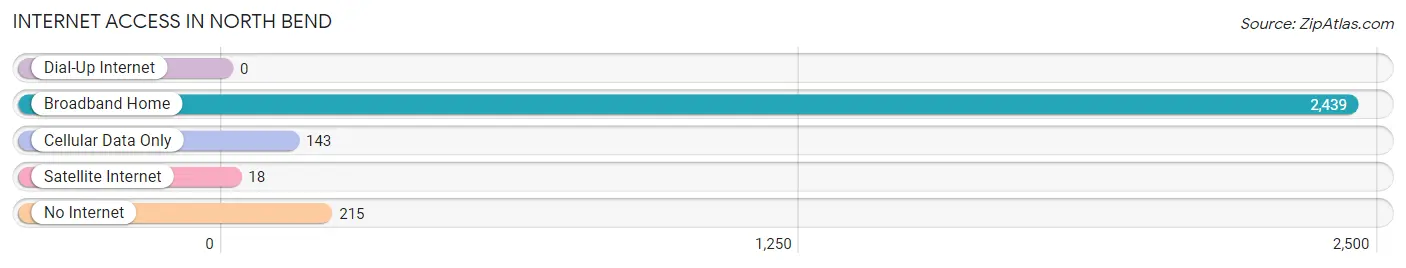
| Internet Type | # Households | % Households |
| Dial-Up Internet | 0 | 0.0% |
| Broadband Home | 2,439 | 87.2% |
| Cellular Data Only | 143 | 5.1% |
| Satellite Internet | 18 | 0.6% |
| No Internet | 215 | 7.7% |
| Total | 2,797 | 100.0% |
North Bend Summary
North Bend, Washington is a small city located in King County, Washington, United States. It is situated in the foothills of the Cascade Mountains, approximately 25 miles east of Seattle. The city is located at the confluence of the Snoqualmie and Tolt Rivers, and is surrounded by the Snoqualmie National Forest. The city is home to approximately 6,800 people, and is part of the Seattle metropolitan area.
History
North Bend was first settled in the late 1800s by homesteaders and loggers. The city was officially incorporated in 1909, and was named after the nearby North Bend on the Snoqualmie River. The city was initially a logging and farming community, and was home to several sawmills and lumber mills. In the early 1900s, the city was also home to a number of coal mines, which provided employment for many of the city’s residents.
In the mid-1900s, the city began to transition from a logging and farming community to a more suburban community. The city was home to a number of new businesses, including a shopping center, a movie theater, and a bowling alley. The city also began to attract new residents, and the population began to grow.
Geography
North Bend is located in the foothills of the Cascade Mountains, approximately 25 miles east of Seattle. The city is situated at the confluence of the Snoqualmie and Tolt Rivers, and is surrounded by the Snoqualmie National Forest. The city is located at an elevation of approximately 500 feet, and has a total area of 4.2 square miles.
The city is located in a temperate climate, with warm summers and mild winters. The average annual temperature is approximately 50 degrees Fahrenheit, and the average annual precipitation is approximately 40 inches.
Economy
North Bend’s economy is largely based on tourism and retail. The city is home to a number of tourist attractions, including the North Bend Premium Outlets, the Snoqualmie Falls, and the Snoqualmie Valley Railroad. The city is also home to a number of retail stores, restaurants, and other businesses.
The city is also home to a number of manufacturing and industrial businesses, including a number of wood products companies. The city is also home to a number of technology companies, including Microsoft and Amazon.
Demographics
As of the 2010 census, the population of North Bend was 6,845. The racial makeup of the city was 87.3% White, 2.2% African American, 0.7% Native American, 2.2% Asian, 0.2% Pacific Islander, 3.2% from other races, and 4.2% from two or more races. Hispanic or Latino of any race were 8.2% of the population.
The median household income in North Bend was $63,944, and the median family income was $76,944. The per capita income in North Bend was $30,944. Approximately 8.2% of the population was below the poverty line.
Common Questions
What is Per Capita Income in North Bend?
Per Capita income in North Bend is $72,456.
What is the Median Family Income in North Bend?
Median Family Income in North Bend is $193,603.
What is the Median Household income in North Bend?
Median Household Income in North Bend is $171,078.
What is Income or Wage Gap in North Bend?
Income or Wage Gap in North Bend is 49.1%.
Women in North Bend earn 50.9 cents for every dollar earned by a man.
What is Inequality or Gini Index in North Bend?
Inequality or Gini Index in North Bend is 0.46.
What is the Total Population of North Bend?
Total Population of North Bend is 7,549.
What is the Total Male Population of North Bend?
Total Male Population of North Bend is 3,785.
What is the Total Female Population of North Bend?
Total Female Population of North Bend is 3,764.
What is the Ratio of Males per 100 Females in North Bend?
There are 100.56 Males per 100 Females in North Bend.
What is the Ratio of Females per 100 Males in North Bend?
There are 99.45 Females per 100 Males in North Bend.
What is the Median Population Age in North Bend?
Median Population Age in North Bend is 40.3 Years.
What is the Average Family Size in North Bend
Average Family Size in North Bend is 3.1 People.
What is the Average Household Size in North Bend
Average Household Size in North Bend is 2.7 People.
How Large is the Labor Force in North Bend?
There are 4,236 People in the Labor Forcein in North Bend.
What is the Percentage of People in the Labor Force in North Bend?
71.0% of People are in the Labor Force in North Bend.
What is the Unemployment Rate in North Bend?
Unemployment Rate in North Bend is 2.0%.