La Grande, WA Map & Demographics
La Grande Map
La Grande Overview
$56,158
PER CAPITA INCOME
0.06
INEQUALITY / GINI INDEX
219
TOTAL POPULATION
157
MALE POPULATION
62
FEMALE POPULATION
253.23
MALES / 100 FEMALES
39.49
FEMALES / 100 MALES
25.9
MEDIAN AGE
3.5
AVG FAMILY SIZE
4.8
AVG HOUSEHOLD SIZE
132
LABOR FORCE [ PEOPLE ]
100.0%
PERCENT IN LABOR FORCE
Income in La Grande
Income Overview in La Grande
| Characteristic | Number | Measure |
| Per Capita Income | 219 | $56,158 |
| Median Family Income | 46 | $0 |
| Mean Family Income | 46 | $0 |
| Median Household Income | 46 | $0 |
| Mean Household Income | 46 | $0 |
| Income Deficit | 46 | $0 |
| Wage / Income Gap (%) | 219 | 0.00% |
| Wage / Income Gap ($) | 219 | 100.00¢ per $1 |
| Gini / Inequality Index | 219 | 0.06 |
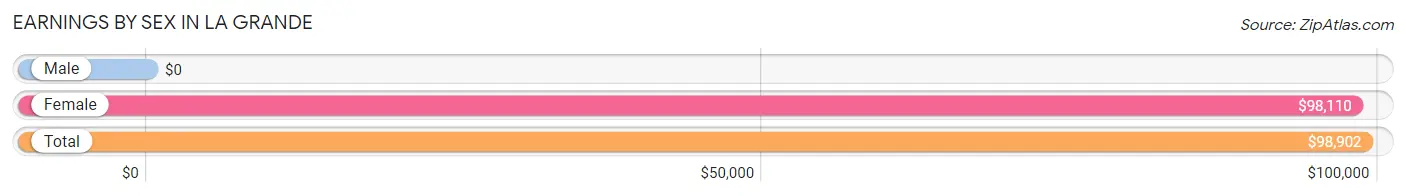
Earnings by Sex in La Grande
| Sex | Number | Average Earnings |
| Male | 70 (53.0%) | $0 |
| Female | 62 (47.0%) | $98,110 |
| Total | 132 (100.0%) | $98,902 |
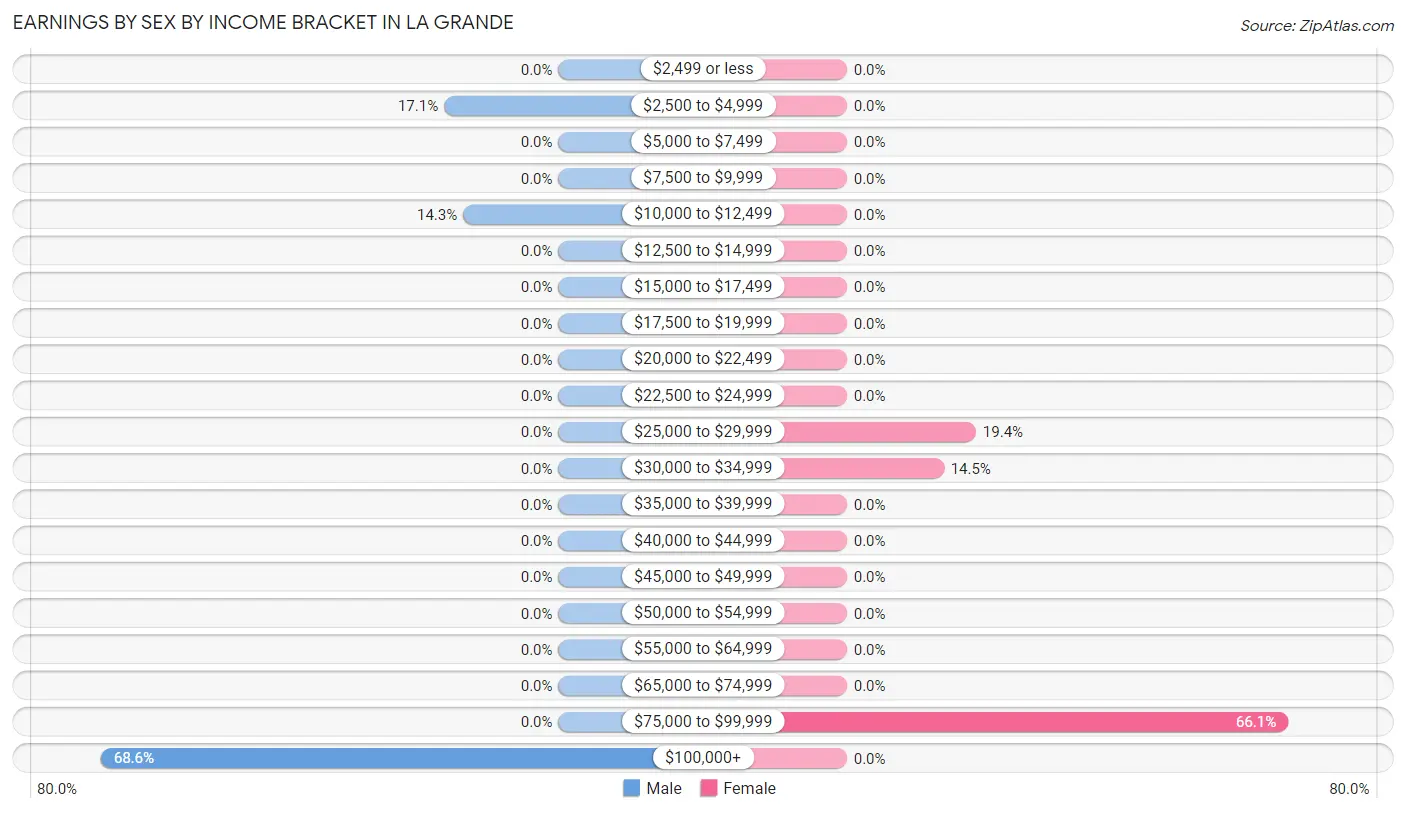
Earnings by Sex by Income Bracket in La Grande
The most common earnings brackets in La Grande are $100,000+ for men (48 | 68.6%) and $75,000 to $99,999 for women (41 | 66.1%).
| Income | Male | Female |
| $2,499 or less | 0 (0.0%) | 0 (0.0%) |
| $2,500 to $4,999 | 12 (17.1%) | 0 (0.0%) |
| $5,000 to $7,499 | 0 (0.0%) | 0 (0.0%) |
| $7,500 to $9,999 | 0 (0.0%) | 0 (0.0%) |
| $10,000 to $12,499 | 10 (14.3%) | 0 (0.0%) |
| $12,500 to $14,999 | 0 (0.0%) | 0 (0.0%) |
| $15,000 to $17,499 | 0 (0.0%) | 0 (0.0%) |
| $17,500 to $19,999 | 0 (0.0%) | 0 (0.0%) |
| $20,000 to $22,499 | 0 (0.0%) | 0 (0.0%) |
| $22,500 to $24,999 | 0 (0.0%) | 0 (0.0%) |
| $25,000 to $29,999 | 0 (0.0%) | 12 (19.4%) |
| $30,000 to $34,999 | 0 (0.0%) | 9 (14.5%) |
| $35,000 to $39,999 | 0 (0.0%) | 0 (0.0%) |
| $40,000 to $44,999 | 0 (0.0%) | 0 (0.0%) |
| $45,000 to $49,999 | 0 (0.0%) | 0 (0.0%) |
| $50,000 to $54,999 | 0 (0.0%) | 0 (0.0%) |
| $55,000 to $64,999 | 0 (0.0%) | 0 (0.0%) |
| $65,000 to $74,999 | 0 (0.0%) | 0 (0.0%) |
| $75,000 to $99,999 | 0 (0.0%) | 41 (66.1%) |
| $100,000+ | 48 (68.6%) | 0 (0.0%) |
| Total | 70 (100.0%) | 62 (100.0%) |
Earnings by Sex by Educational Attainment in La Grande
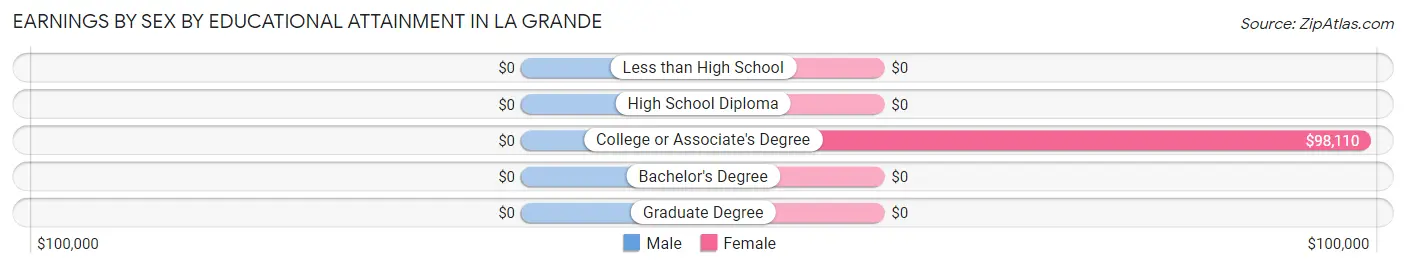
| Educational Attainment | Male Income | Female Income |
| Less than High School | - | - |
| High School Diploma | - | - |
| College or Associate's Degree | - | - |
| Bachelor's Degree | - | - |
| Graduate Degree | - | - |
| Total | - | - |
Family Income in La Grande
Family Income Brackets in La Grande
According to the La Grande family income data, there are 46 families falling into the $200,000+ income range, which is the most common income bracket and makes up 100.0% of all families.
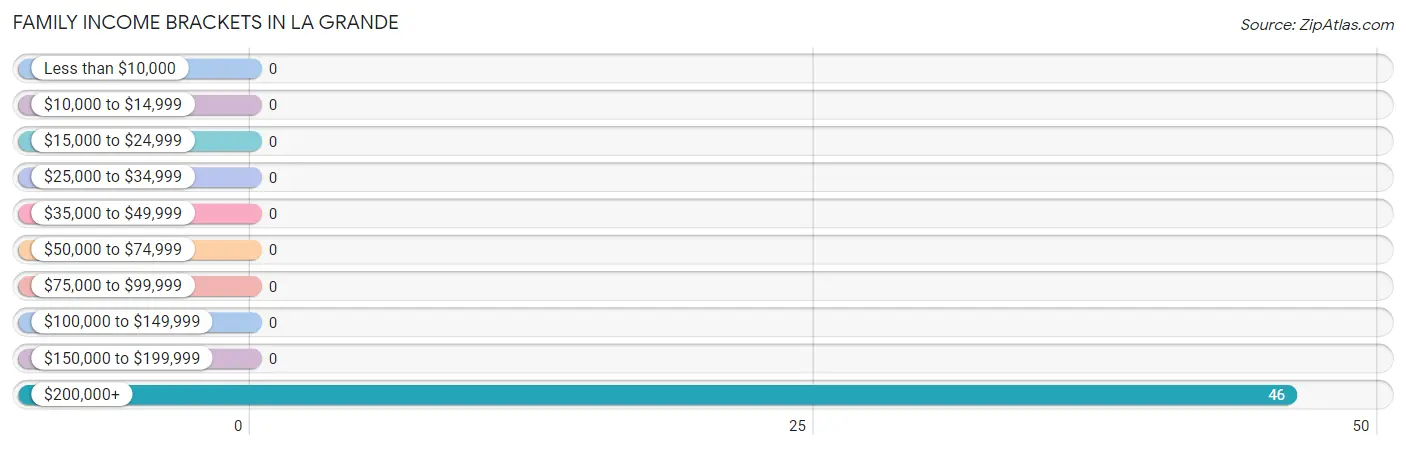
| Income Bracket | # Families | % Families |
| Less than $10,000 | 0 | 0.0% |
| $10,000 to $14,999 | 0 | 0.0% |
| $15,000 to $24,999 | 0 | 0.0% |
| $25,000 to $34,999 | 0 | 0.0% |
| $35,000 to $49,999 | 0 | 0.0% |
| $50,000 to $74,999 | 0 | 0.0% |
| $75,000 to $99,999 | 0 | 0.0% |
| $100,000 to $149,999 | 0 | 0.0% |
| $150,000 to $199,999 | 0 | 0.0% |
| $200,000+ | 46 | 100.0% |
Family Income by Famaliy Size in La Grande
| Income Bracket | # Families | Median Income |
| 2-Person Families | 0 (0.0%) | $0 |
| 3-Person Families | 41 (89.1%) | $0 |
| 4-Person Families | 5 (10.9%) | $0 |
| 5-Person Families | 0 (0.0%) | $0 |
| 6-Person Families | 0 (0.0%) | $0 |
| 7+ Person Families | 0 (0.0%) | $0 |
| Total | 46 (100.0%) | $0 |
Family Income by Number of Earners in La Grande
| Number of Earners | # Families | Median Income |
| No Earners | 0 (0.0%) | $0 |
| 1 Earner | 0 (0.0%) | $0 |
| 2 Earners | 41 (89.1%) | $0 |
| 3+ Earners | 5 (10.9%) | $0 |
| Total | 46 (100.0%) | $0 |
Household Income in La Grande
Household Income Brackets in La Grande
With 46 households falling in the category, the $200,000+ income range is the most frequent in La Grande, accounting for 100.0% of all households.
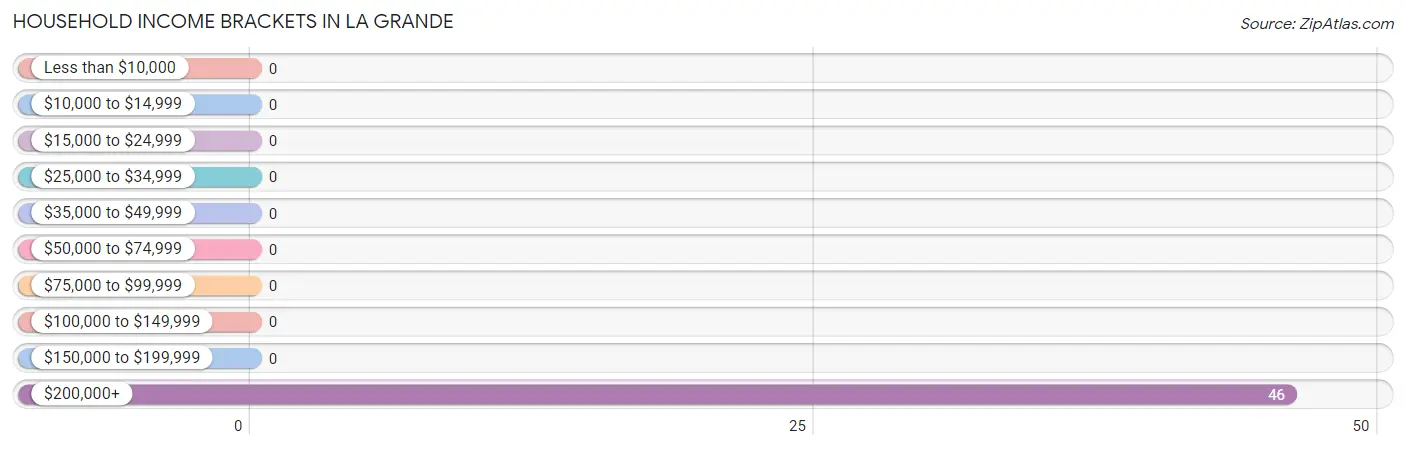
| Income Bracket | # Households | % Households |
| Less than $10,000 | 0 | 0.0% |
| $10,000 to $14,999 | 0 | 0.0% |
| $15,000 to $24,999 | 0 | 0.0% |
| $25,000 to $34,999 | 0 | 0.0% |
| $35,000 to $49,999 | 0 | 0.0% |
| $50,000 to $74,999 | 0 | 0.0% |
| $75,000 to $99,999 | 0 | 0.0% |
| $100,000 to $149,999 | 0 | 0.0% |
| $150,000 to $199,999 | 0 | 0.0% |
| $200,000+ | 46 | 100.0% |
Household Income by Householder Age in La Grande
| Income Bracket | # Households | Median Income |
| 15 to 24 Years | 0 (0.0%) | $0 |
| 25 to 44 Years | 41 (89.1%) | $0 |
| 45 to 64 Years | 0 (0.0%) | $0 |
| 65+ Years | 5 (10.9%) | $0 |
| Total | 46 (100.0%) | $0 |
Poverty in La Grande
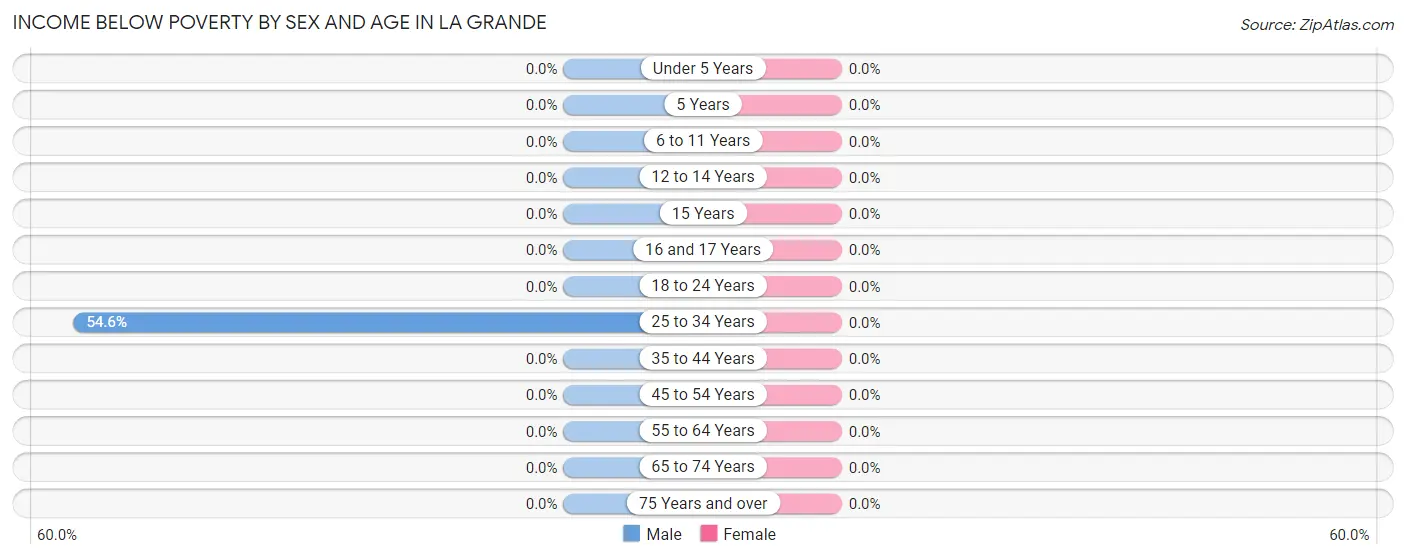
Income Below Poverty by Sex and Age in La Grande
| Age Bracket | Male | Female |
| Under 5 Years | 0 (0.0%) | 0 (0.0%) |
| 5 Years | 0 (0.0%) | 0 (0.0%) |
| 6 to 11 Years | 0 (0.0%) | 0 (0.0%) |
| 12 to 14 Years | 0 (0.0%) | 0 (0.0%) |
| 15 Years | 0 (0.0%) | 0 (0.0%) |
| 16 and 17 Years | 0 (0.0%) | 0 (0.0%) |
| 18 to 24 Years | 0 (0.0%) | 0 (0.0%) |
| 25 to 34 Years | 12 (54.5%) | 0 (0.0%) |
| 35 to 44 Years | 0 (0.0%) | 0 (0.0%) |
| 45 to 54 Years | 0 (0.0%) | 0 (0.0%) |
| 55 to 64 Years | 0 (0.0%) | 0 (0.0%) |
| 65 to 74 Years | 0 (0.0%) | 0 (0.0%) |
| 75 Years and over | 0 (0.0%) | 0 (0.0%) |
| Total | 12 (10.7%) | 0 (0.0%) |
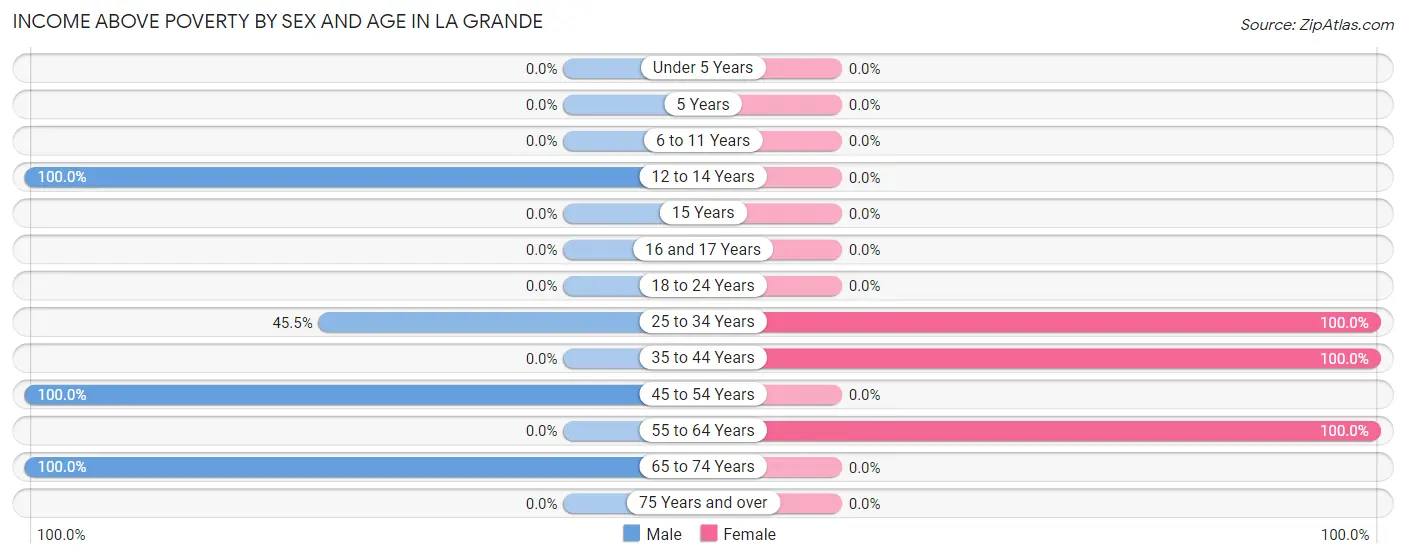
Income Above Poverty by Sex and Age in La Grande
According to the poverty statistics in La Grande, males aged 12 to 14 years and females aged 25 to 34 years are the age groups that are most secure financially, with 100.0% of males and 100.0% of females in these age groups living above the poverty line.
| Age Bracket | Male | Female |
| Under 5 Years | 0 (0.0%) | 0 (0.0%) |
| 5 Years | 0 (0.0%) | 0 (0.0%) |
| 6 to 11 Years | 0 (0.0%) | 0 (0.0%) |
| 12 to 14 Years | 42 (100.0%) | 0 (0.0%) |
| 15 Years | 0 (0.0%) | 0 (0.0%) |
| 16 and 17 Years | 0 (0.0%) | 0 (0.0%) |
| 18 to 24 Years | 0 (0.0%) | 0 (0.0%) |
| 25 to 34 Years | 10 (45.5%) | 12 (100.0%) |
| 35 to 44 Years | 0 (0.0%) | 41 (100.0%) |
| 45 to 54 Years | 43 (100.0%) | 0 (0.0%) |
| 55 to 64 Years | 0 (0.0%) | 9 (100.0%) |
| 65 to 74 Years | 5 (100.0%) | 0 (0.0%) |
| 75 Years and over | 0 (0.0%) | 0 (0.0%) |
| Total | 100 (89.3%) | 62 (100.0%) |
Income Below Poverty Among Married-Couple Families in La Grande
| Children | Above Poverty | Below Poverty |
| No Children | 5 (100.0%) | 0 (0.0%) |
| 1 or 2 Children | 41 (100.0%) | 0 (0.0%) |
| 3 or 4 Children | 0 (0.0%) | 0 (0.0%) |
| 5 or more Children | 0 (0.0%) | 0 (0.0%) |
| Total | 46 (100.0%) | 0 (0.0%) |
Income Below Poverty Among Single-Parent Households in La Grande
| Children | Single Father | Single Mother |
| No Children | 0 (0.0%) | 0 (0.0%) |
| 1 or 2 Children | 0 (0.0%) | 0 (0.0%) |
| 3 or 4 Children | 0 (0.0%) | 0 (0.0%) |
| 5 or more Children | 0 (0.0%) | 0 (0.0%) |
| Total | 0 (0.0%) | 0 (0.0%) |
Income Below Poverty Among Married-Couple vs Single-Parent Households in La Grande
| Children | Married-Couple Families | Single-Parent Households |
| No Children | 0 (0.0%) | 0 (0.0%) |
| 1 or 2 Children | 0 (0.0%) | 0 (0.0%) |
| 3 or 4 Children | 0 (0.0%) | 0 (0.0%) |
| 5 or more Children | 0 (0.0%) | 0 (0.0%) |
| Total | 0 (0.0%) | 0 (0.0%) |
Race in La Grande
The most populous races in La Grande are White / Caucasian (174 | 79.4%), and Two or more Races (45 | 20.5%).
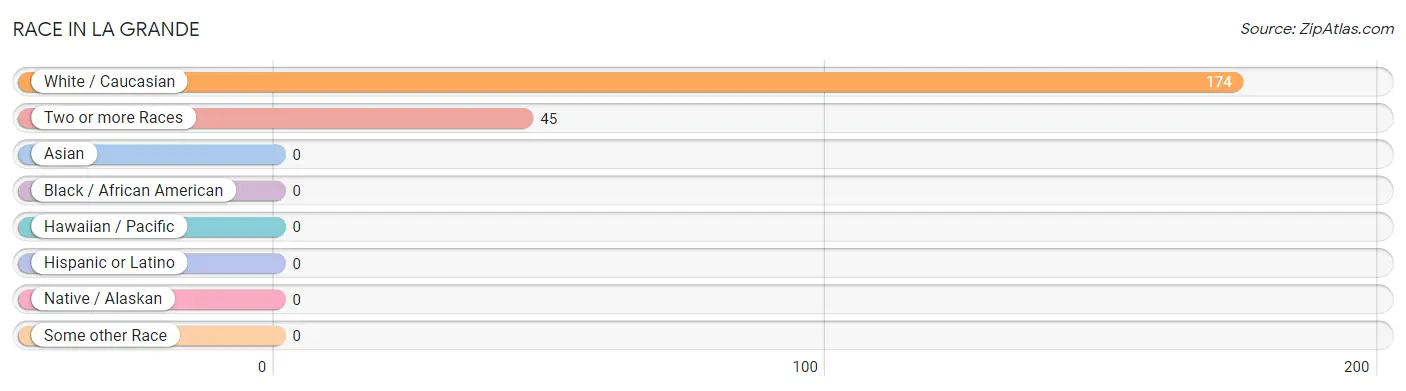
| Race | # Population | % Population |
| Asian | 0 | 0.0% |
| Black / African American | 0 | 0.0% |
| Hawaiian / Pacific | 0 | 0.0% |
| Hispanic or Latino | 0 | 0.0% |
| Native / Alaskan | 0 | 0.0% |
| White / Caucasian | 174 | 79.4% |
| Two or more Races | 45 | 20.5% |
| Some other Race | 0 | 0.0% |
| Total | 219 | 100.0% |
Ancestry in La Grande
The most populous ancestries reported in La Grande are Irish (126 | 57.5%), English (48 | 21.9%), French (45 | 20.5%), and German (5 | 2.3%), together accounting for 102.3% of all La Grande residents.
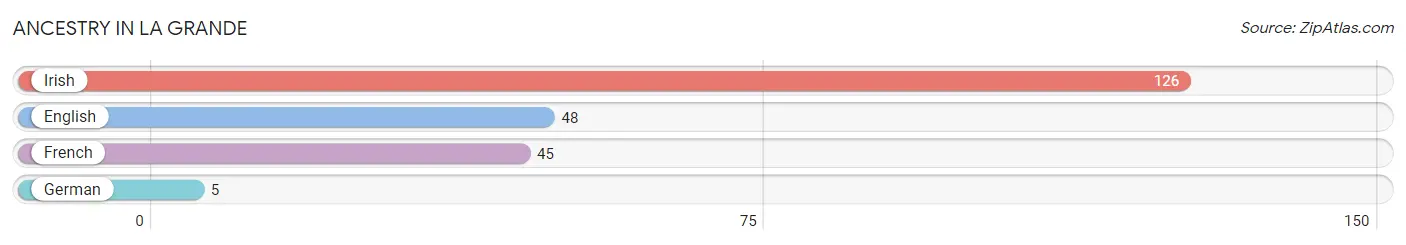
| Ancestry | # Population | % Population |
| English | 48 | 21.9% |
| French | 45 | 20.5% |
| German | 5 | 2.3% |
| Irish | 126 | 57.5% | View All 4 Rows |
Immigrants in La Grande

| Immigration Origin | # Population | % Population | View All 0 Rows |
Sex and Age in La Grande
Sex and Age in La Grande
The most populous age groups in La Grande are Under 5 Years (45 | 28.7%) for men and 40 to 44 Years (41 | 66.1%) for women.
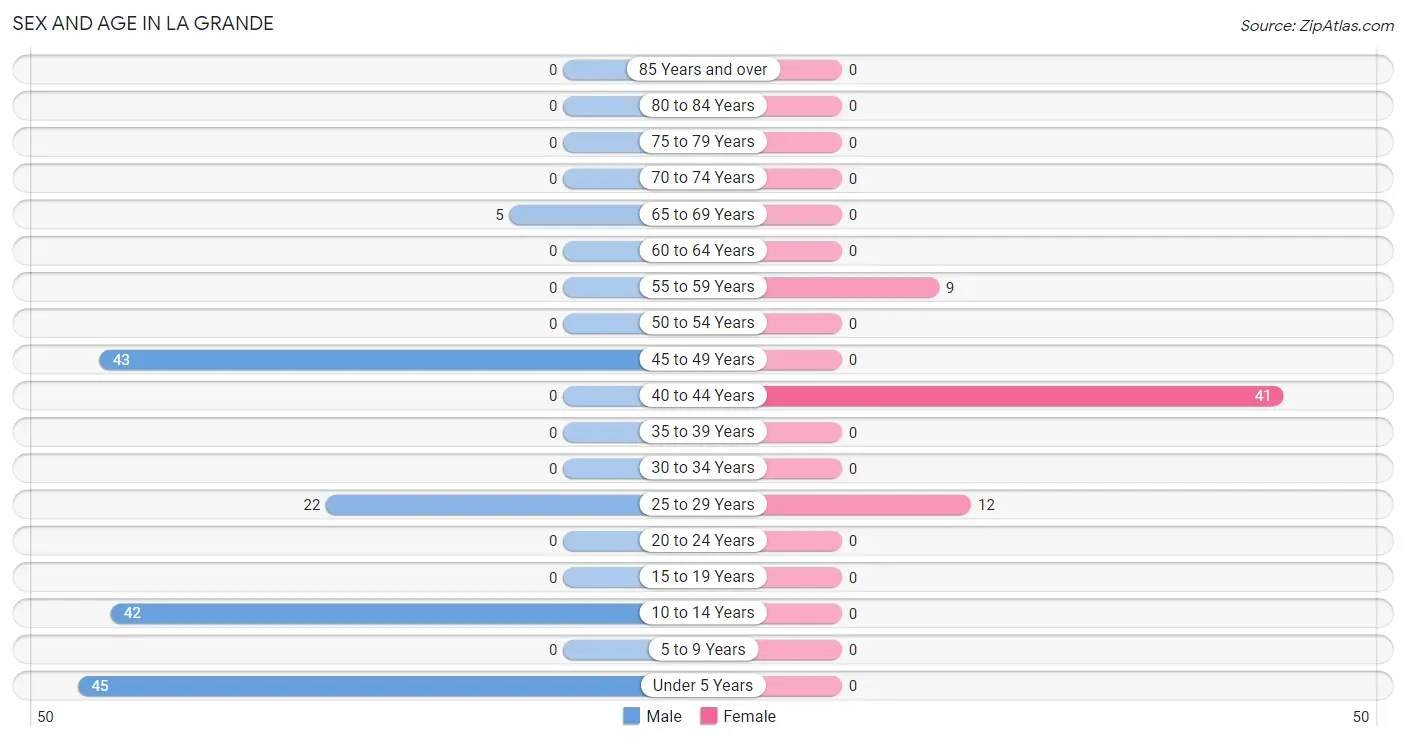
| Age Bracket | Male | Female |
| Under 5 Years | 45 (28.7%) | 0 (0.0%) |
| 5 to 9 Years | 0 (0.0%) | 0 (0.0%) |
| 10 to 14 Years | 42 (26.8%) | 0 (0.0%) |
| 15 to 19 Years | 0 (0.0%) | 0 (0.0%) |
| 20 to 24 Years | 0 (0.0%) | 0 (0.0%) |
| 25 to 29 Years | 22 (14.0%) | 12 (19.4%) |
| 30 to 34 Years | 0 (0.0%) | 0 (0.0%) |
| 35 to 39 Years | 0 (0.0%) | 0 (0.0%) |
| 40 to 44 Years | 0 (0.0%) | 41 (66.1%) |
| 45 to 49 Years | 43 (27.4%) | 0 (0.0%) |
| 50 to 54 Years | 0 (0.0%) | 0 (0.0%) |
| 55 to 59 Years | 0 (0.0%) | 9 (14.5%) |
| 60 to 64 Years | 0 (0.0%) | 0 (0.0%) |
| 65 to 69 Years | 5 (3.2%) | 0 (0.0%) |
| 70 to 74 Years | 0 (0.0%) | 0 (0.0%) |
| 75 to 79 Years | 0 (0.0%) | 0 (0.0%) |
| 80 to 84 Years | 0 (0.0%) | 0 (0.0%) |
| 85 Years and over | 0 (0.0%) | 0 (0.0%) |
| Total | 157 (100.0%) | 62 (100.0%) |
Families and Households in La Grande
Median Family Size in La Grande
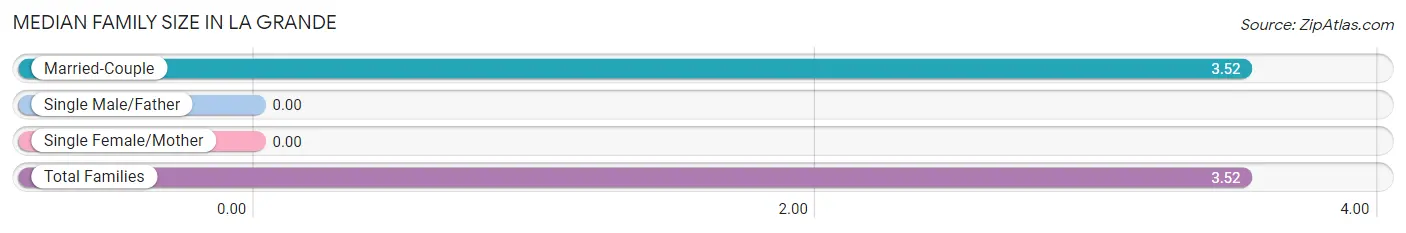
| Family Type | # Families | Family Size |
| Married-Couple | 46 (100.0%) | 3.52 |
| Single Male/Father | 0 (0.0%) | - |
| Single Female/Mother | 0 (0.0%) | - |
| Total Families | 46 (100.0%) | 3.52 |
Median Household Size in La Grande
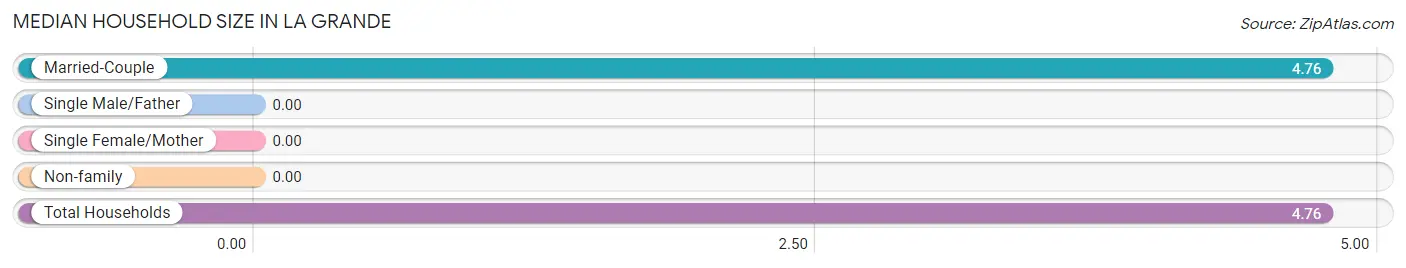
| Household Type | # Households | Household Size |
| Married-Couple | 46 (100.0%) | 4.76 |
| Single Male/Father | 0 (0.0%) | - |
| Single Female/Mother | 0 (0.0%) | - |
| Non-family | 0 (0.0%) | - |
| Total Households | 46 (100.0%) | 4.76 |
Household Size by Marriage Status in La Grande
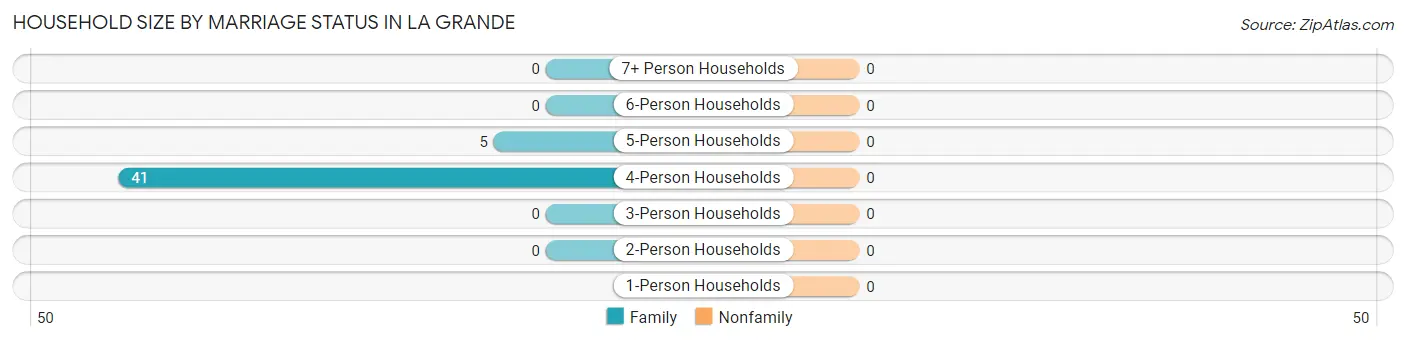
| Household Size | Family Households | Nonfamily Households |
| 1-Person Households | - | 0 (0.0%) |
| 2-Person Households | 0 (0.0%) | 0 (0.0%) |
| 3-Person Households | 0 (0.0%) | 0 (0.0%) |
| 4-Person Households | 41 (89.1%) | 0 (0.0%) |
| 5-Person Households | 5 (10.9%) | 0 (0.0%) |
| 6-Person Households | 0 (0.0%) | 0 (0.0%) |
| 7+ Person Households | 0 (0.0%) | 0 (0.0%) |
| Total | 46 (100.0%) | 0 (0.0%) |
Female Fertility in La Grande
Fertility by Age in La Grande
| Age Bracket | Women with Births | Births / 1,000 Women |
| 15 to 19 years | 0 (0.0%) | 0.0 |
| 20 to 34 years | 0 (0.0%) | 0.0 |
| 35 to 50 years | 0 (0.0%) | 0.0 |
| Total | 0 (0.0%) | 0.0 |
Fertility by Age by Marriage Status in La Grande
| Age Bracket | Married | Unmarried |
| 15 to 19 years | 0 (0.0%) | 0 (0.0%) |
| 20 to 34 years | 0 (0.0%) | 0 (0.0%) |
| 35 to 50 years | 0 (0.0%) | 0 (0.0%) |
| Total | 0 (0.0%) | 0 (0.0%) |
Fertility by Education in La Grande
| Educational Attainment | Women with Births | Births / 1,000 Women |
| Less than High School | 0 (0.0%) | 0.0 |
| High School Diploma | 0 (0.0%) | 0.0 |
| College or Associate's Degree | 0 (0.0%) | 0.0 |
| Bachelor's Degree | 0 (0.0%) | 0.0 |
| Graduate Degree | 0 (0.0%) | 0.0 |
| Total | 0 (0.0%) | 0.0 |
Fertility by Education by Marriage Status in La Grande
| Educational Attainment | Married | Unmarried |
| Less than High School | 0 (0.0%) | 0 (0.0%) |
| High School Diploma | 0 (0.0%) | 0 (0.0%) |
| College or Associate's Degree | 0 (0.0%) | 0 (0.0%) |
| Bachelor's Degree | 0 (0.0%) | 0 (0.0%) |
| Graduate Degree | 0 (0.0%) | 0 (0.0%) |
| Total | 0 (0.0%) | 0 (0.0%) |
Employment Characteristics in La Grande
Employment by Class of Employer in La Grande
Among the 132 employed individuals in La Grande, private company employees (77 | 58.3%), state government employees (41 | 31.1%), and self-employed (incorporated) (14 | 10.6%) make up the most common classes of employment.
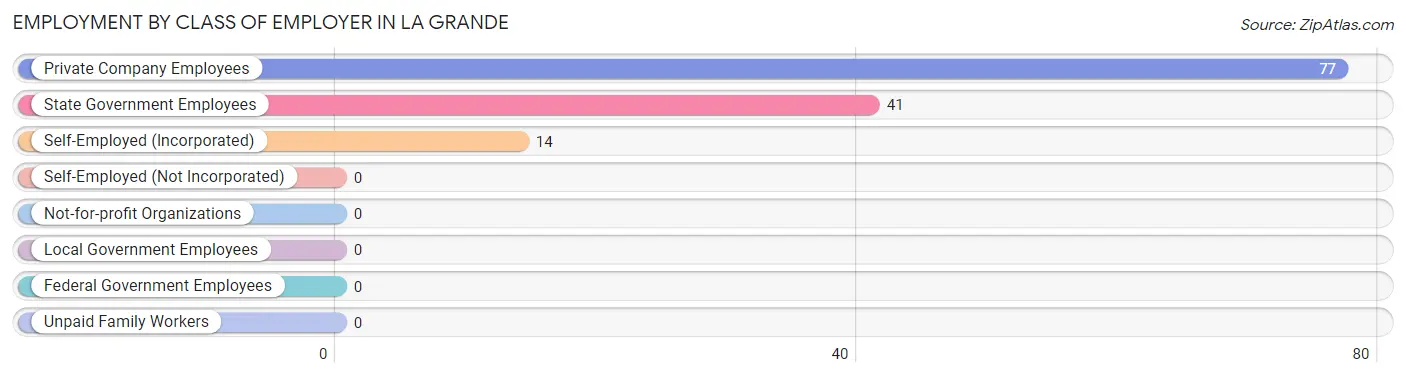
| Employer Class | # Employees | % Employees |
| Private Company Employees | 77 | 58.3% |
| Self-Employed (Incorporated) | 14 | 10.6% |
| Self-Employed (Not Incorporated) | 0 | 0.0% |
| Not-for-profit Organizations | 0 | 0.0% |
| Local Government Employees | 0 | 0.0% |
| State Government Employees | 41 | 31.1% |
| Federal Government Employees | 0 | 0.0% |
| Unpaid Family Workers | 0 | 0.0% |
| Total | 132 | 100.0% |
Employment Status by Age in La Grande
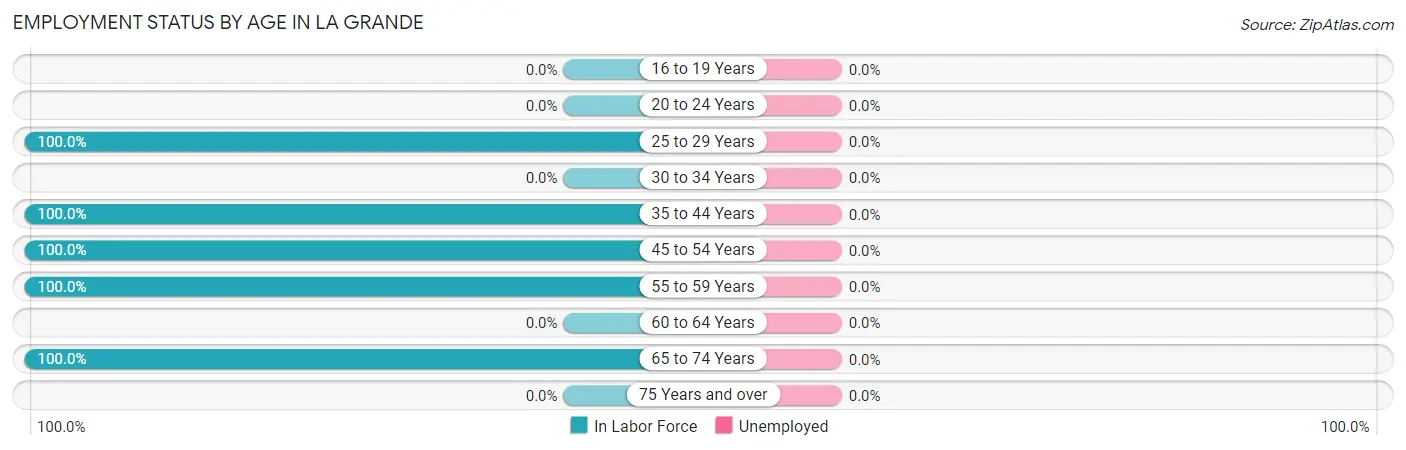
| Age Bracket | In Labor Force | Unemployed |
| 16 to 19 Years | 0 (0.0%) | 0 (0.0%) |
| 20 to 24 Years | 0 (0.0%) | 0 (0.0%) |
| 25 to 29 Years | 34 (100.0%) | 0 (0.0%) |
| 30 to 34 Years | 0 (0.0%) | 0 (0.0%) |
| 35 to 44 Years | 41 (100.0%) | 0 (0.0%) |
| 45 to 54 Years | 43 (100.0%) | 0 (0.0%) |
| 55 to 59 Years | 9 (100.0%) | 0 (0.0%) |
| 60 to 64 Years | 0 (0.0%) | 0 (0.0%) |
| 65 to 74 Years | 5 (100.0%) | 0 (0.0%) |
| 75 Years and over | 0 (0.0%) | 0 (0.0%) |
| Total | 132 (100.0%) | 0 (0.0%) |
Employment Status by Educational Attainment in La Grande
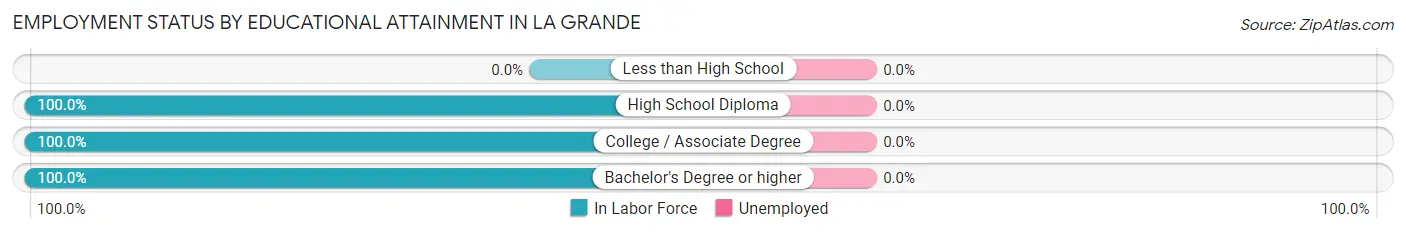
| Educational Attainment | In Labor Force | Unemployed |
| Less than High School | 0 (0.0%) | 0 (0.0%) |
| High School Diploma | 43 (100.0%) | 0 (0.0%) |
| College / Associate Degree | 74 (100.0%) | 0 (0.0%) |
| Bachelor's Degree or higher | 10 (100.0%) | 0 (0.0%) |
| Total | 127 (100.0%) | 0 (0.0%) |
Employment Occupations by Sex in La Grande
Management, Business, Science and Arts Occupations
The most common Management, Business, Science and Arts occupations in La Grande are Computers, Engineering & Science (43 | 32.6%), Computers & Mathematics (43 | 32.6%), Business & Financial (41 | 31.1%), Management (19 | 14.4%), and Health Diagnosing & Treating (5 | 3.8%).
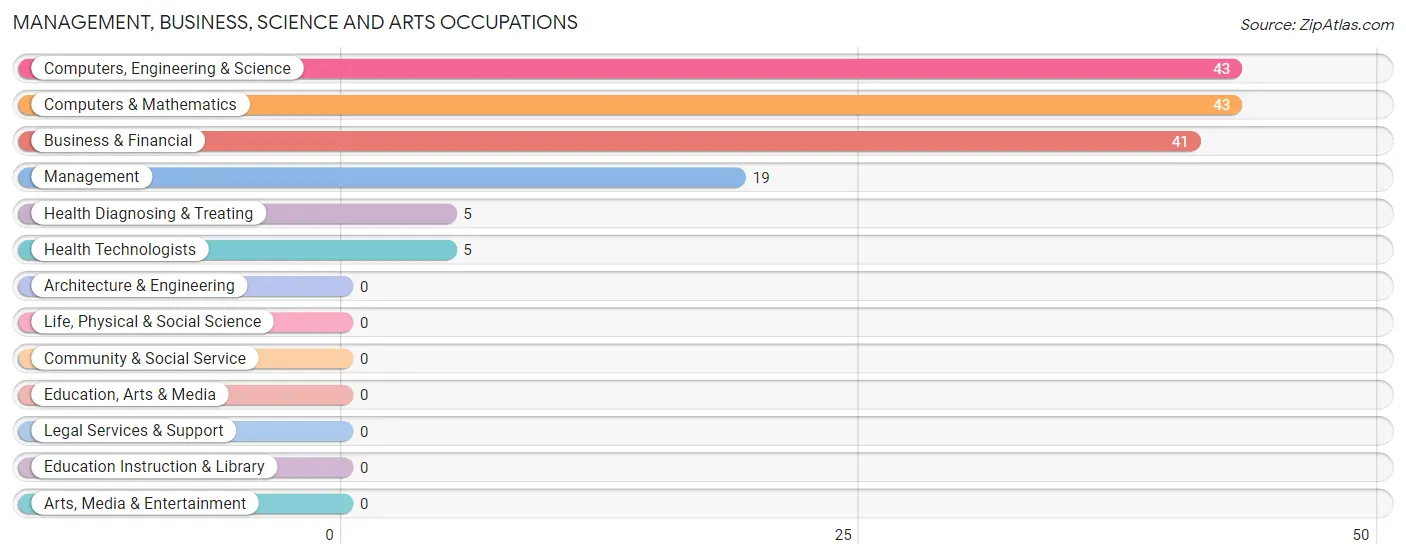
Management, Business, Science and Arts Occupations by Sex
Within the Management, Business, Science and Arts occupations in La Grande, the most male-oriented occupations are Computers, Engineering & Science (100.0%), Computers & Mathematics (100.0%), and Health Diagnosing & Treating (100.0%), while the most female-oriented occupations are Business & Financial (100.0%), and Management (47.4%).
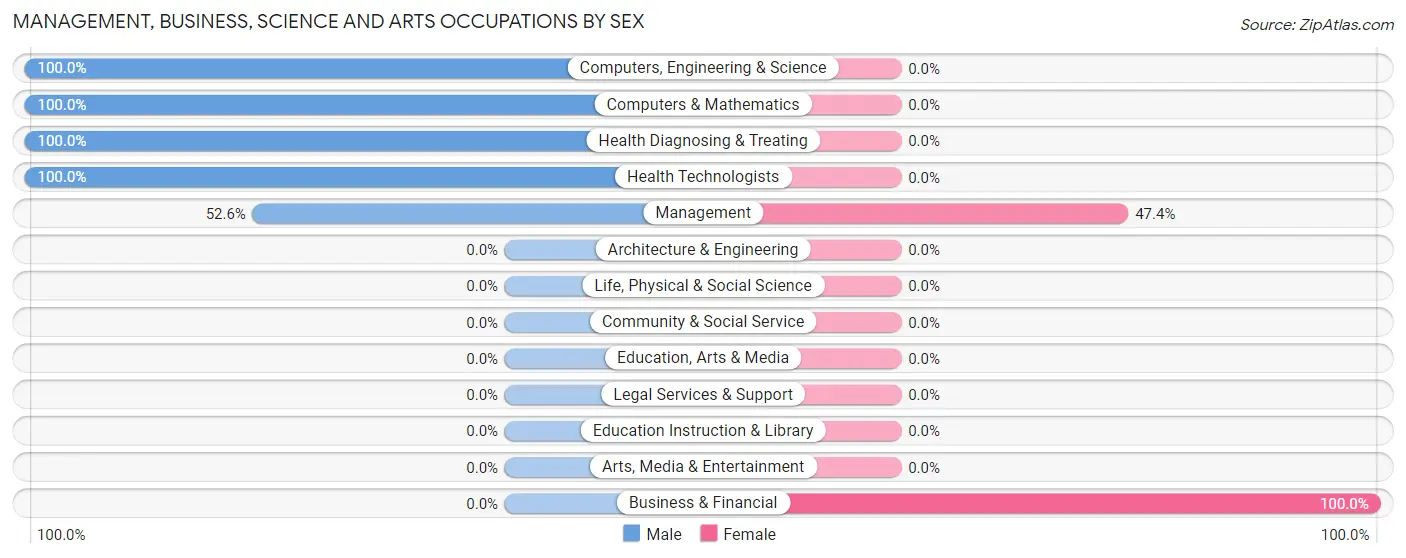
| Occupation | Male | Female |
| Management | 10 (52.6%) | 9 (47.4%) |
| Business & Financial | 0 (0.0%) | 41 (100.0%) |
| Computers, Engineering & Science | 43 (100.0%) | 0 (0.0%) |
| Computers & Mathematics | 43 (100.0%) | 0 (0.0%) |
| Architecture & Engineering | 0 (0.0%) | 0 (0.0%) |
| Life, Physical & Social Science | 0 (0.0%) | 0 (0.0%) |
| Community & Social Service | 0 (0.0%) | 0 (0.0%) |
| Education, Arts & Media | 0 (0.0%) | 0 (0.0%) |
| Legal Services & Support | 0 (0.0%) | 0 (0.0%) |
| Education Instruction & Library | 0 (0.0%) | 0 (0.0%) |
| Arts, Media & Entertainment | 0 (0.0%) | 0 (0.0%) |
| Health Diagnosing & Treating | 5 (100.0%) | 0 (0.0%) |
| Health Technologists | 5 (100.0%) | 0 (0.0%) |
| Total (Category) | 58 (53.7%) | 50 (46.3%) |
| Total (Overall) | 70 (53.0%) | 62 (47.0%) |
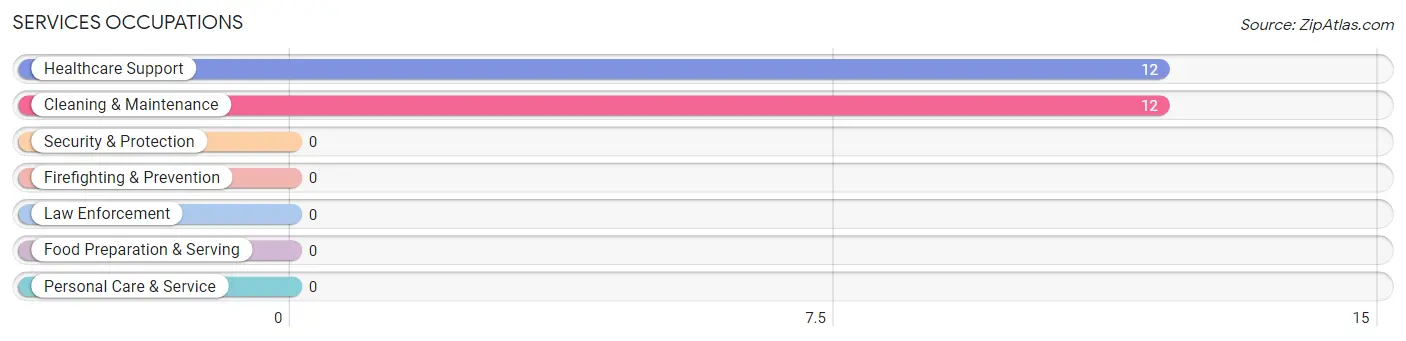
Services Occupations
The most common Services occupations in La Grande are Healthcare Support (12 | 9.1%), and Cleaning & Maintenance (12 | 9.1%).
Services Occupations by Sex
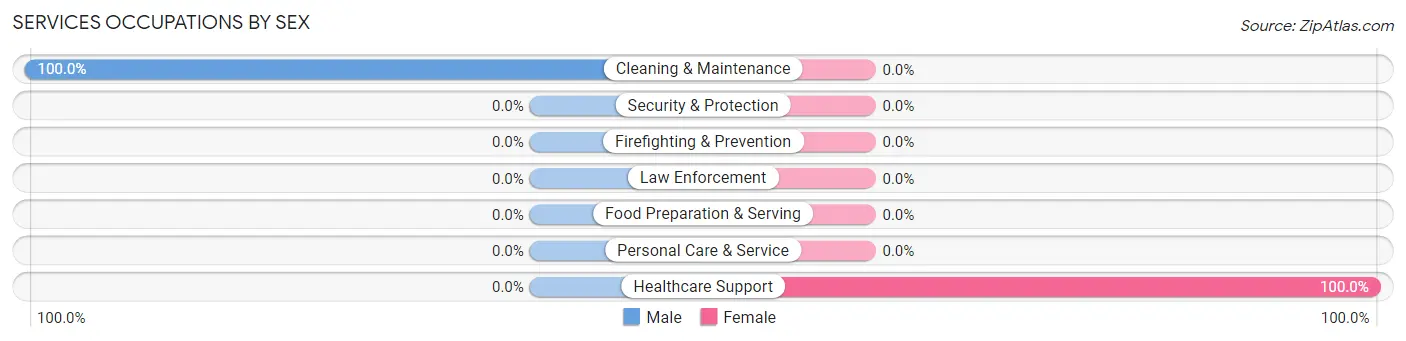
| Occupation | Male | Female |
| Healthcare Support | 0 (0.0%) | 12 (100.0%) |
| Security & Protection | 0 (0.0%) | 0 (0.0%) |
| Firefighting & Prevention | 0 (0.0%) | 0 (0.0%) |
| Law Enforcement | 0 (0.0%) | 0 (0.0%) |
| Food Preparation & Serving | 0 (0.0%) | 0 (0.0%) |
| Cleaning & Maintenance | 12 (100.0%) | 0 (0.0%) |
| Personal Care & Service | 0 (0.0%) | 0 (0.0%) |
| Total (Category) | 12 (50.0%) | 12 (50.0%) |
| Total (Overall) | 70 (53.0%) | 62 (47.0%) |
Sales and Office Occupations
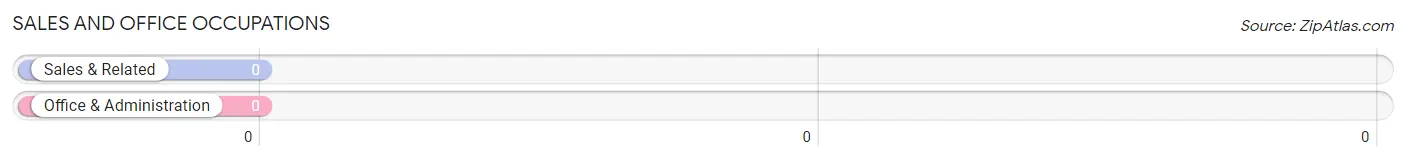
Sales and Office Occupations by Sex
| Occupation | Male | Female |
| Sales & Related | 0 (0.0%) | 0 (0.0%) |
| Office & Administration | 0 (0.0%) | 0 (0.0%) |
| Total (Category) | 0 (0.0%) | 0 (0.0%) |
| Total (Overall) | 70 (53.0%) | 62 (47.0%) |
Natural Resources, Construction and Maintenance Occupations
Natural Resources, Construction and Maintenance Occupations by Sex
| Occupation | Male | Female |
| Farming, Fishing & Forestry | 0 (0.0%) | 0 (0.0%) |
| Construction & Extraction | 0 (0.0%) | 0 (0.0%) |
| Installation, Maintenance & Repair | 0 (0.0%) | 0 (0.0%) |
| Total (Category) | 0 (0.0%) | 0 (0.0%) |
| Total (Overall) | 70 (53.0%) | 62 (47.0%) |
Production, Transportation and Moving Occupations
Production, Transportation and Moving Occupations by Sex
| Occupation | Male | Female |
| Production | 0 (0.0%) | 0 (0.0%) |
| Transportation | 0 (0.0%) | 0 (0.0%) |
| Material Moving | 0 (0.0%) | 0 (0.0%) |
| Total (Category) | 0 (0.0%) | 0 (0.0%) |
| Total (Overall) | 70 (53.0%) | 62 (47.0%) |
Employment Industries by Sex in La Grande
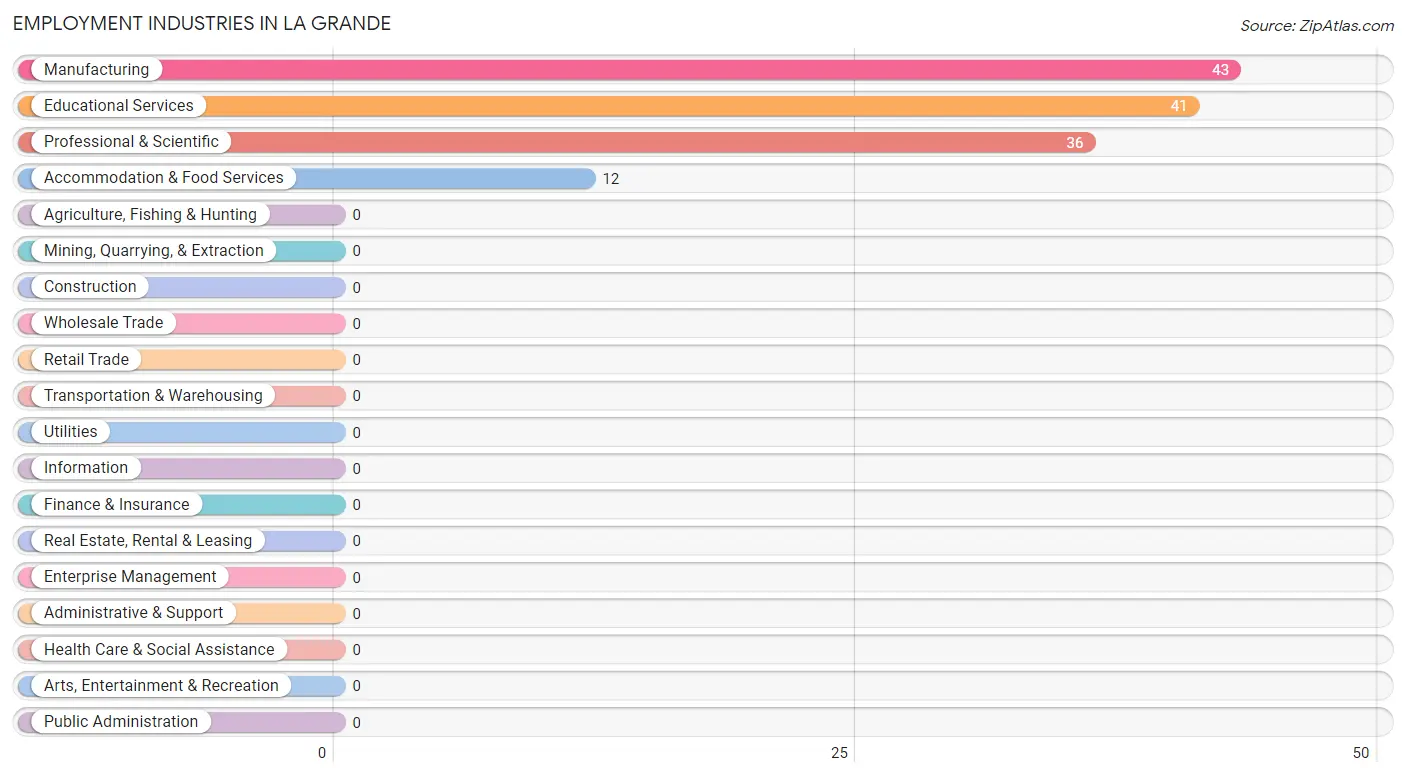
Employment Industries in La Grande
The major employment industries in La Grande include Manufacturing (43 | 32.6%), Educational Services (41 | 31.1%), Professional & Scientific (36 | 27.3%), and Accommodation & Food Services (12 | 9.1%).
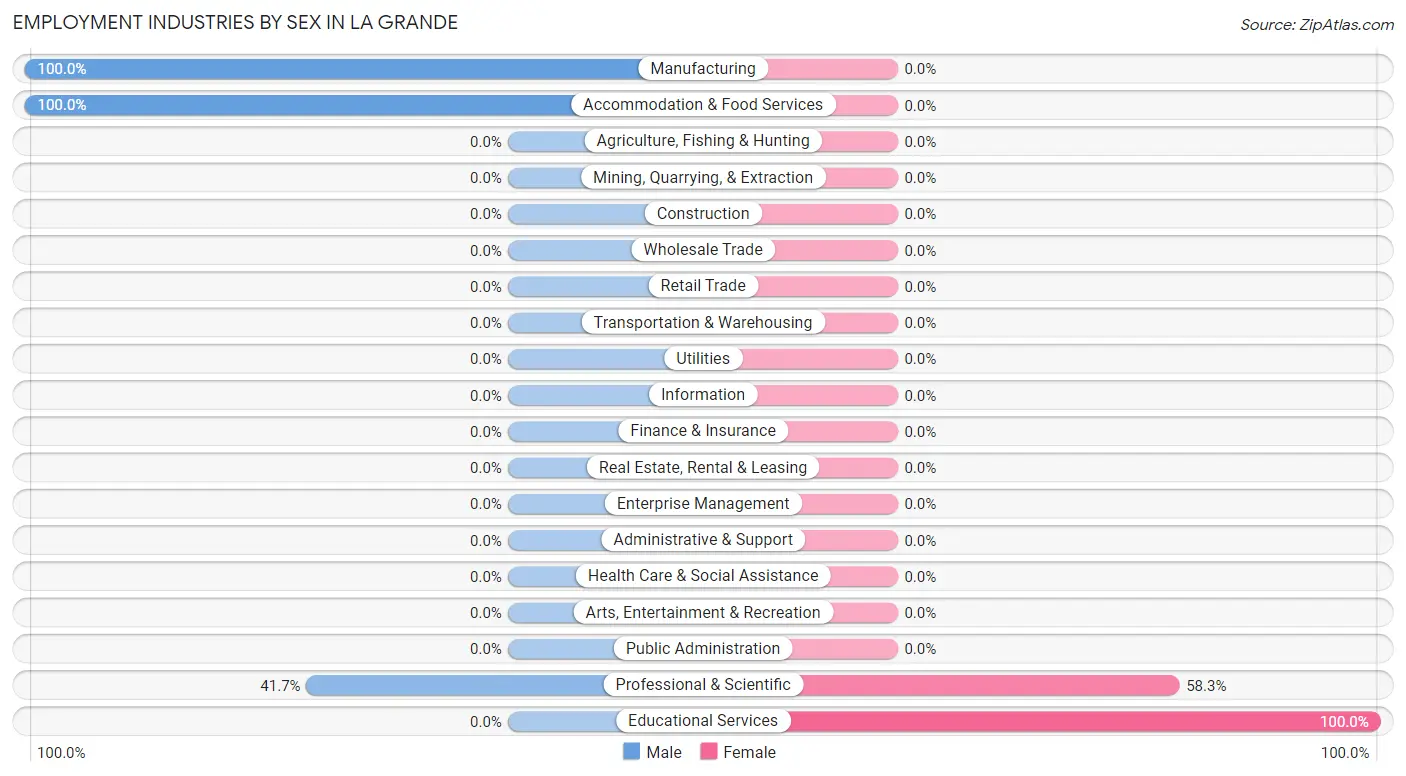
Employment Industries by Sex in La Grande
The La Grande industries that see more men than women are Manufacturing (100.0%), Accommodation & Food Services (100.0%), and Professional & Scientific (41.7%), whereas the industries that tend to have a higher number of women are Educational Services (100.0%), and Professional & Scientific (58.3%).
| Industry | Male | Female |
| Agriculture, Fishing & Hunting | 0 (0.0%) | 0 (0.0%) |
| Mining, Quarrying, & Extraction | 0 (0.0%) | 0 (0.0%) |
| Construction | 0 (0.0%) | 0 (0.0%) |
| Manufacturing | 43 (100.0%) | 0 (0.0%) |
| Wholesale Trade | 0 (0.0%) | 0 (0.0%) |
| Retail Trade | 0 (0.0%) | 0 (0.0%) |
| Transportation & Warehousing | 0 (0.0%) | 0 (0.0%) |
| Utilities | 0 (0.0%) | 0 (0.0%) |
| Information | 0 (0.0%) | 0 (0.0%) |
| Finance & Insurance | 0 (0.0%) | 0 (0.0%) |
| Real Estate, Rental & Leasing | 0 (0.0%) | 0 (0.0%) |
| Professional & Scientific | 15 (41.7%) | 21 (58.3%) |
| Enterprise Management | 0 (0.0%) | 0 (0.0%) |
| Administrative & Support | 0 (0.0%) | 0 (0.0%) |
| Educational Services | 0 (0.0%) | 41 (100.0%) |
| Health Care & Social Assistance | 0 (0.0%) | 0 (0.0%) |
| Arts, Entertainment & Recreation | 0 (0.0%) | 0 (0.0%) |
| Accommodation & Food Services | 12 (100.0%) | 0 (0.0%) |
| Public Administration | 0 (0.0%) | 0 (0.0%) |
| Total | 70 (53.0%) | 62 (47.0%) |
Education in La Grande
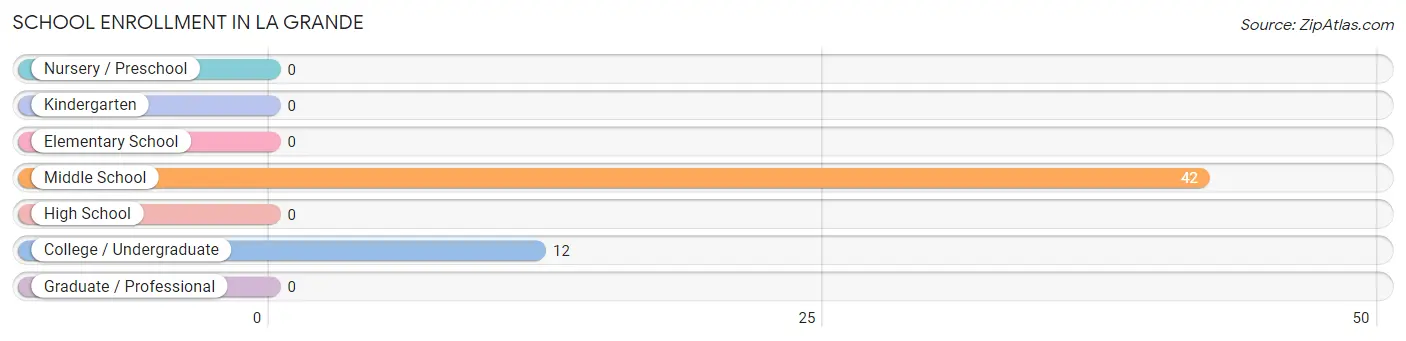
School Enrollment in La Grande
The most common levels of schooling among the 54 students in La Grande are middle school (42 | 77.8%), and college / undergraduate (12 | 22.2%).
| School Level | # Students | % Students |
| Nursery / Preschool | 0 | 0.0% |
| Kindergarten | 0 | 0.0% |
| Elementary School | 0 | 0.0% |
| Middle School | 42 | 77.8% |
| High School | 0 | 0.0% |
| College / Undergraduate | 12 | 22.2% |
| Graduate / Professional | 0 | 0.0% |
| Total | 54 | 100.0% |
School Enrollment by Age by Funding Source in La Grande
Out of a total of 54 students who are enrolled in schools in La Grande, 12 (22.2%) attend a private institution, while the remaining 42 (77.8%) are enrolled in public schools. The age group of 25 to 34 year olds has the highest likelihood of being enrolled in private schools, with 12 (100.0% in the age bracket) enrolled. Conversely, the age group of 10 to 14 year olds has the lowest likelihood of being enrolled in a private school, with 42 (100.0% in the age bracket) attending a public institution.
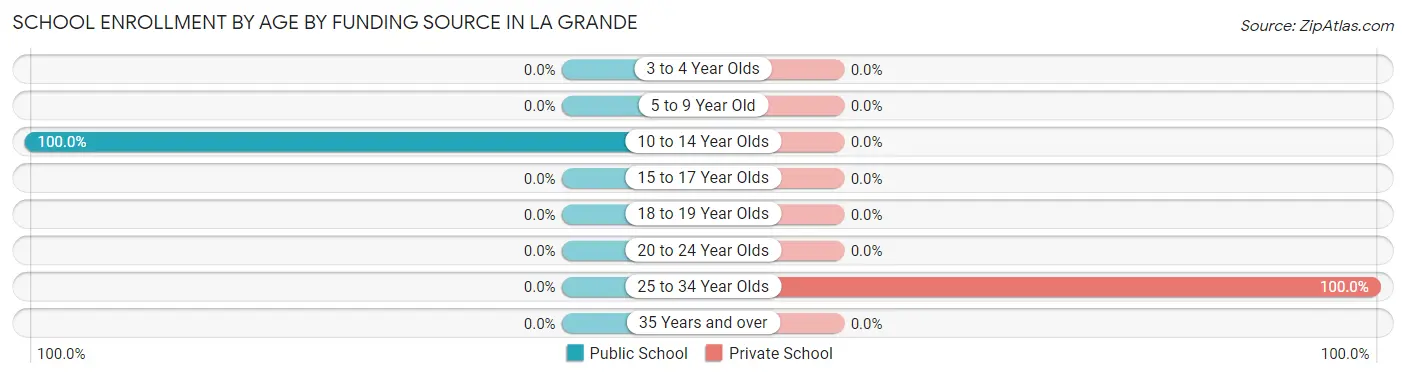
| Age Bracket | Public School | Private School |
| 3 to 4 Year Olds | 0 (0.0%) | 0 (0.0%) |
| 5 to 9 Year Old | 0 (0.0%) | 0 (0.0%) |
| 10 to 14 Year Olds | 42 (100.0%) | 0 (0.0%) |
| 15 to 17 Year Olds | 0 (0.0%) | 0 (0.0%) |
| 18 to 19 Year Olds | 0 (0.0%) | 0 (0.0%) |
| 20 to 24 Year Olds | 0 (0.0%) | 0 (0.0%) |
| 25 to 34 Year Olds | 0 (0.0%) | 12 (100.0%) |
| 35 Years and over | 0 (0.0%) | 0 (0.0%) |
| Total | 42 (77.8%) | 12 (22.2%) |
Educational Attainment by Field of Study in La Grande
Psychology (10 | 66.7%), and science & technology (5 | 33.3%) are the most common fields of study among 15 individuals in La Grande who have obtained a bachelor's degree or higher.
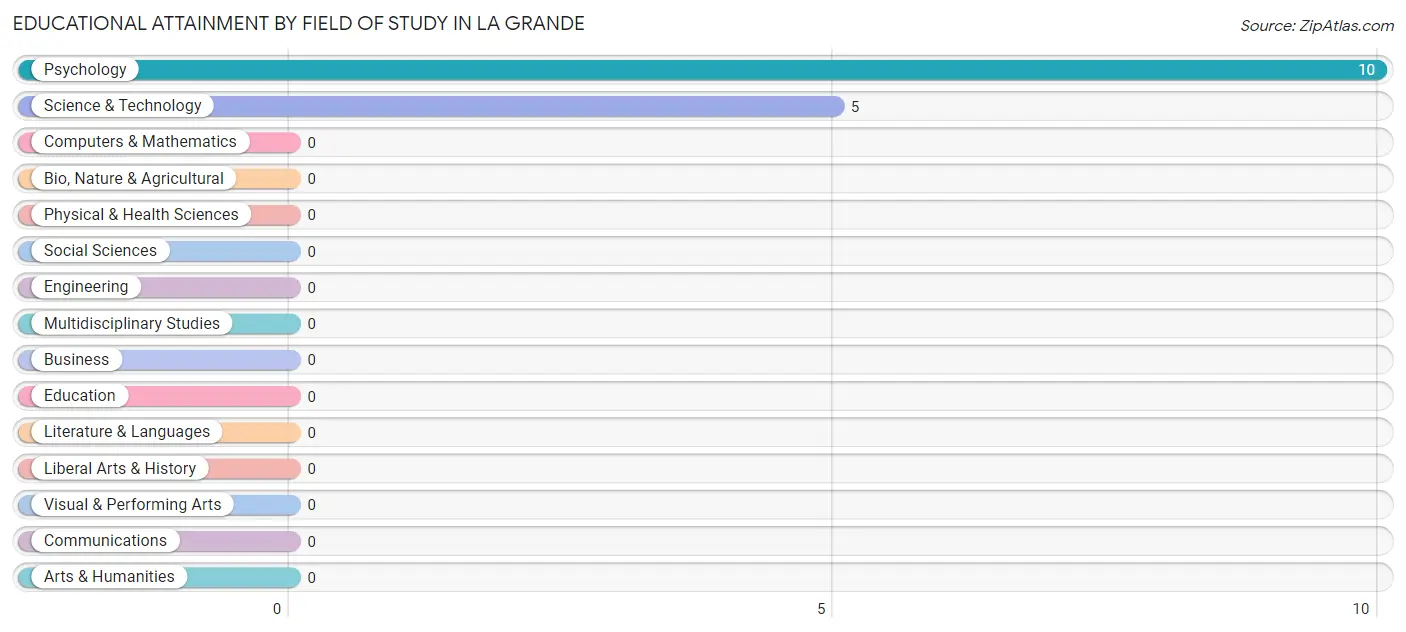
| Field of Study | # Graduates | % Graduates |
| Computers & Mathematics | 0 | 0.0% |
| Bio, Nature & Agricultural | 0 | 0.0% |
| Physical & Health Sciences | 0 | 0.0% |
| Psychology | 10 | 66.7% |
| Social Sciences | 0 | 0.0% |
| Engineering | 0 | 0.0% |
| Multidisciplinary Studies | 0 | 0.0% |
| Science & Technology | 5 | 33.3% |
| Business | 0 | 0.0% |
| Education | 0 | 0.0% |
| Literature & Languages | 0 | 0.0% |
| Liberal Arts & History | 0 | 0.0% |
| Visual & Performing Arts | 0 | 0.0% |
| Communications | 0 | 0.0% |
| Arts & Humanities | 0 | 0.0% |
| Total | 15 | 100.0% |
Transportation & Commute in La Grande
Vehicle Availability by Sex in La Grande
The most prevalent vehicle ownership categories in La Grande are males with 2 vehicles (43, accounting for 61.4%) and females with 2 vehicles (41, making up 69.4%).
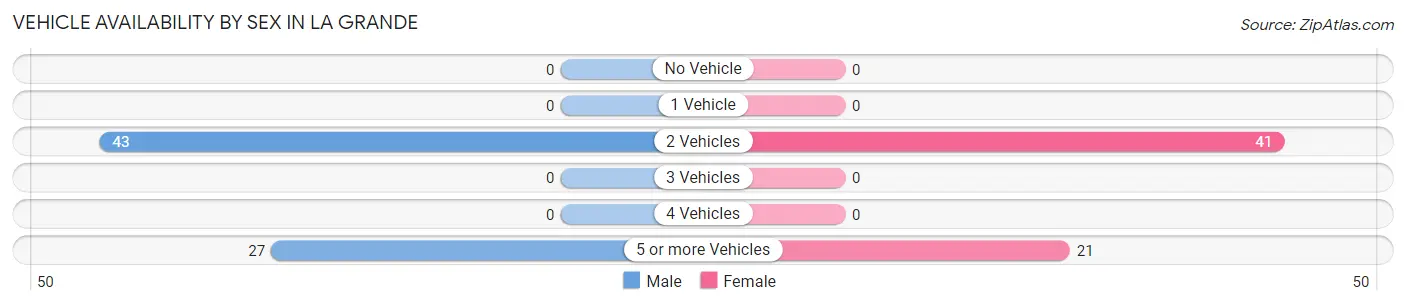
| Vehicles Available | Male | Female |
| No Vehicle | 0 (0.0%) | 0 (0.0%) |
| 1 Vehicle | 0 (0.0%) | 0 (0.0%) |
| 2 Vehicles | 43 (61.4%) | 41 (66.1%) |
| 3 Vehicles | 0 (0.0%) | 0 (0.0%) |
| 4 Vehicles | 0 (0.0%) | 0 (0.0%) |
| 5 or more Vehicles | 27 (38.6%) | 21 (33.9%) |
| Total | 70 (100.0%) | 62 (100.0%) |
Commute Time in La Grande
The most frequently occuring commute durations in La Grande are 45 to 59 minutes (84 commuters, 63.6%), 15 to 19 minutes (36 commuters, 27.3%), and 25 to 29 minutes (12 commuters, 9.1%).
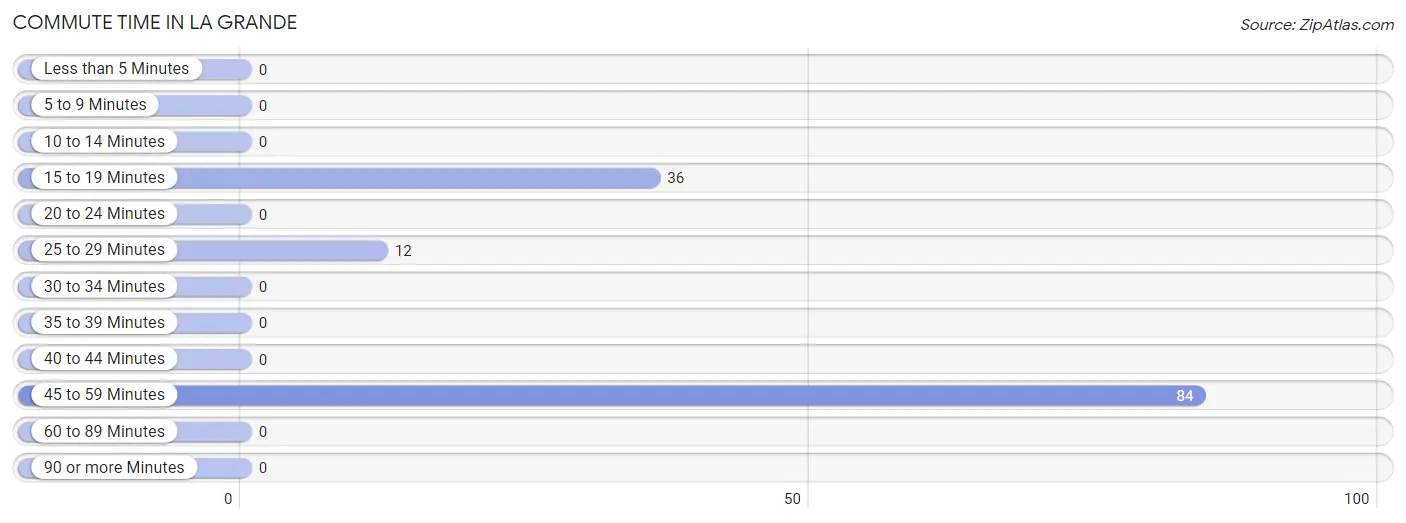
| Commute Time | # Commuters | % Commuters |
| Less than 5 Minutes | 0 | 0.0% |
| 5 to 9 Minutes | 0 | 0.0% |
| 10 to 14 Minutes | 0 | 0.0% |
| 15 to 19 Minutes | 36 | 27.3% |
| 20 to 24 Minutes | 0 | 0.0% |
| 25 to 29 Minutes | 12 | 9.1% |
| 30 to 34 Minutes | 0 | 0.0% |
| 35 to 39 Minutes | 0 | 0.0% |
| 40 to 44 Minutes | 0 | 0.0% |
| 45 to 59 Minutes | 84 | 63.6% |
| 60 to 89 Minutes | 0 | 0.0% |
| 90 or more Minutes | 0 | 0.0% |
Commute Time by Sex in La Grande
The most common commute times in La Grande are 45 to 59 minutes (43 commuters, 61.4%) for males and 45 to 59 minutes (41 commuters, 66.1%) for females.
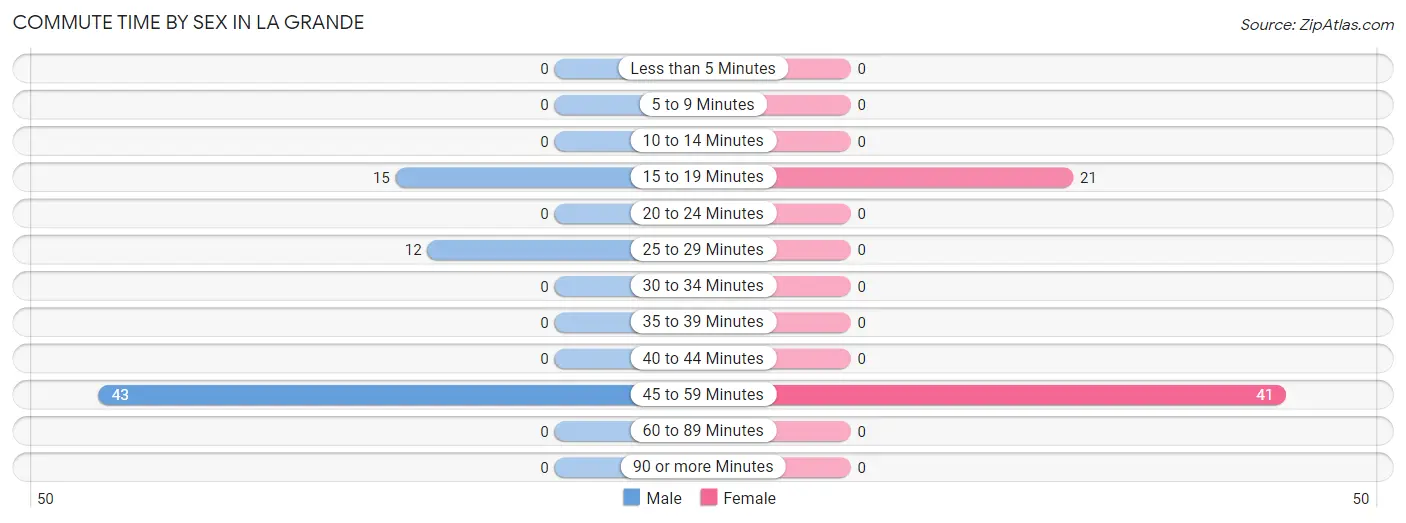
| Commute Time | Male | Female |
| Less than 5 Minutes | 0 (0.0%) | 0 (0.0%) |
| 5 to 9 Minutes | 0 (0.0%) | 0 (0.0%) |
| 10 to 14 Minutes | 0 (0.0%) | 0 (0.0%) |
| 15 to 19 Minutes | 15 (21.4%) | 21 (33.9%) |
| 20 to 24 Minutes | 0 (0.0%) | 0 (0.0%) |
| 25 to 29 Minutes | 12 (17.1%) | 0 (0.0%) |
| 30 to 34 Minutes | 0 (0.0%) | 0 (0.0%) |
| 35 to 39 Minutes | 0 (0.0%) | 0 (0.0%) |
| 40 to 44 Minutes | 0 (0.0%) | 0 (0.0%) |
| 45 to 59 Minutes | 43 (61.4%) | 41 (66.1%) |
| 60 to 89 Minutes | 0 (0.0%) | 0 (0.0%) |
| 90 or more Minutes | 0 (0.0%) | 0 (0.0%) |
Time of Departure to Work by Sex in La Grande
The most frequent times of departure to work in La Grande are 12:00 AM to 4:59 AM (43, 61.4%) for males and 6:30 AM to 6:59 AM (41, 66.1%) for females.
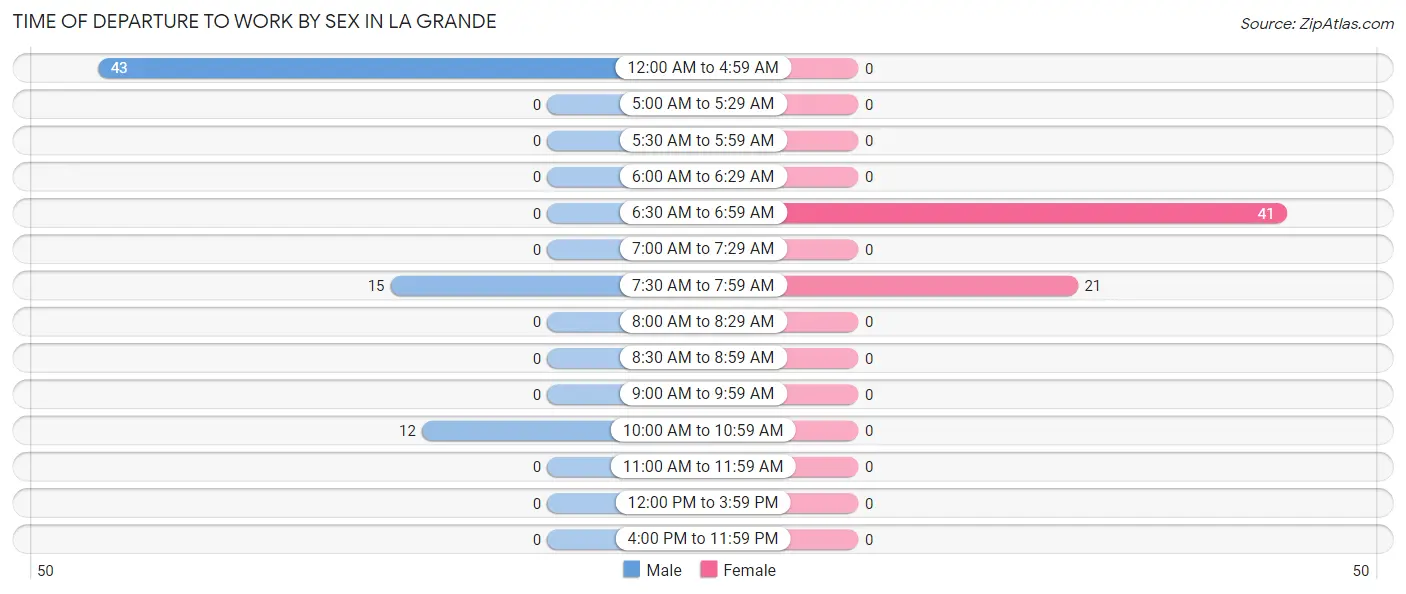
| Time of Departure | Male | Female |
| 12:00 AM to 4:59 AM | 43 (61.4%) | 0 (0.0%) |
| 5:00 AM to 5:29 AM | 0 (0.0%) | 0 (0.0%) |
| 5:30 AM to 5:59 AM | 0 (0.0%) | 0 (0.0%) |
| 6:00 AM to 6:29 AM | 0 (0.0%) | 0 (0.0%) |
| 6:30 AM to 6:59 AM | 0 (0.0%) | 41 (66.1%) |
| 7:00 AM to 7:29 AM | 0 (0.0%) | 0 (0.0%) |
| 7:30 AM to 7:59 AM | 15 (21.4%) | 21 (33.9%) |
| 8:00 AM to 8:29 AM | 0 (0.0%) | 0 (0.0%) |
| 8:30 AM to 8:59 AM | 0 (0.0%) | 0 (0.0%) |
| 9:00 AM to 9:59 AM | 0 (0.0%) | 0 (0.0%) |
| 10:00 AM to 10:59 AM | 12 (17.1%) | 0 (0.0%) |
| 11:00 AM to 11:59 AM | 0 (0.0%) | 0 (0.0%) |
| 12:00 PM to 3:59 PM | 0 (0.0%) | 0 (0.0%) |
| 4:00 PM to 11:59 PM | 0 (0.0%) | 0 (0.0%) |
| Total | 70 (100.0%) | 62 (100.0%) |
Housing Occupancy in La Grande
Occupancy by Ownership in La Grande
Of the total 46 dwellings in La Grande, owner-occupied units account for 46 (100.0%), while renter-occupied units make up 0 (0.0%).
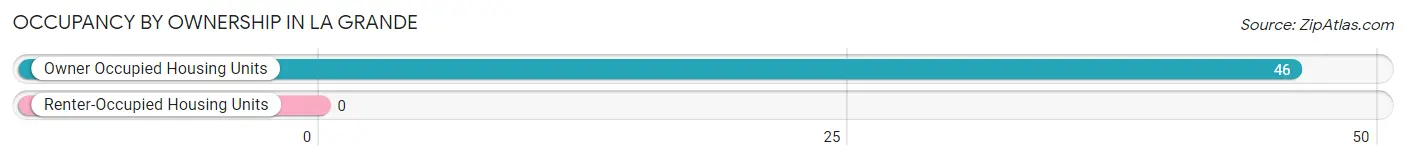
| Occupancy | # Housing Units | % Housing Units |
| Owner Occupied Housing Units | 46 | 100.0% |
| Renter-Occupied Housing Units | 0 | 0.0% |
| Total Occupied Housing Units | 46 | 100.0% |
Occupancy by Household Size in La Grande
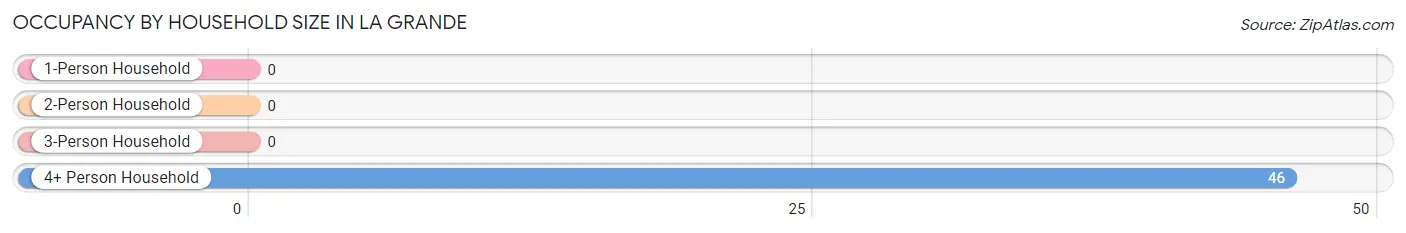
| Household Size | # Housing Units | % Housing Units |
| 1-Person Household | 0 | 0.0% |
| 2-Person Household | 0 | 0.0% |
| 3-Person Household | 0 | 0.0% |
| 4+ Person Household | 46 | 100.0% |
| Total Housing Units | 46 | 100.0% |
Occupancy by Ownership by Household Size in La Grande
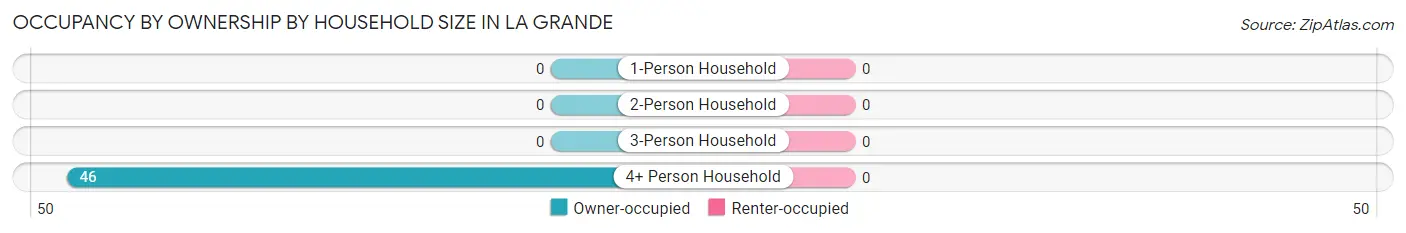
| Household Size | Owner-occupied | Renter-occupied |
| 1-Person Household | 0 (0.0%) | 0 (0.0%) |
| 2-Person Household | 0 (0.0%) | 0 (0.0%) |
| 3-Person Household | 0 (0.0%) | 0 (0.0%) |
| 4+ Person Household | 46 (100.0%) | 0 (0.0%) |
| Total Housing Units | 46 (100.0%) | 0 (0.0%) |
Occupancy by Educational Attainment in La Grande
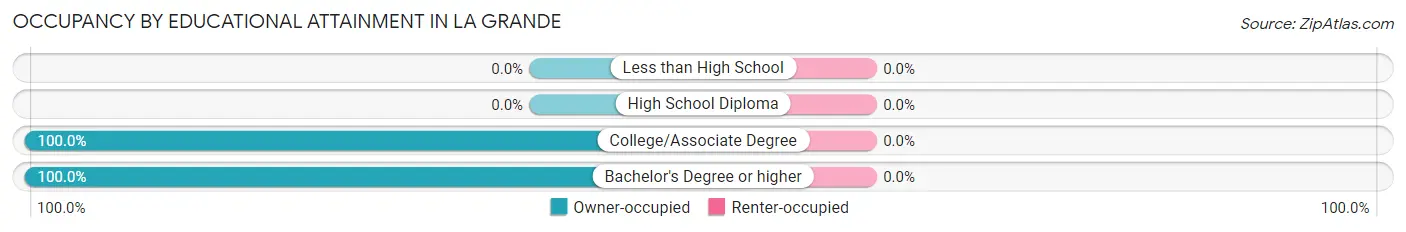
| Household Size | Owner-occupied | Renter-occupied |
| Less than High School | 0 (0.0%) | 0 (0.0%) |
| High School Diploma | 0 (0.0%) | 0 (0.0%) |
| College/Associate Degree | 41 (100.0%) | 0 (0.0%) |
| Bachelor's Degree or higher | 5 (100.0%) | 0 (0.0%) |
Occupancy by Age of Householder in La Grande
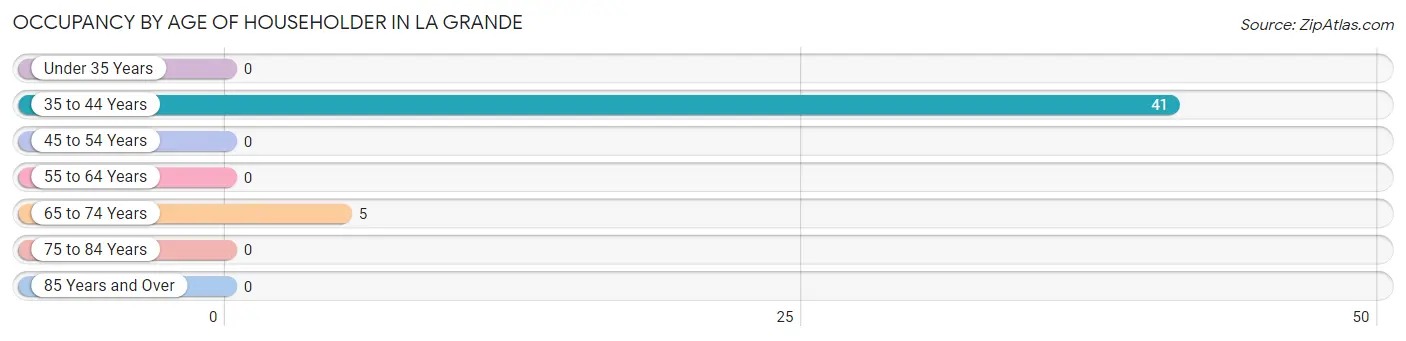
| Age Bracket | # Households | % Households |
| Under 35 Years | 0 | 0.0% |
| 35 to 44 Years | 41 | 89.1% |
| 45 to 54 Years | 0 | 0.0% |
| 55 to 64 Years | 0 | 0.0% |
| 65 to 74 Years | 5 | 10.9% |
| 75 to 84 Years | 0 | 0.0% |
| 85 Years and Over | 0 | 0.0% |
| Total | 46 | 100.0% |
Housing Finances in La Grande
Median Income by Occupancy in La Grande
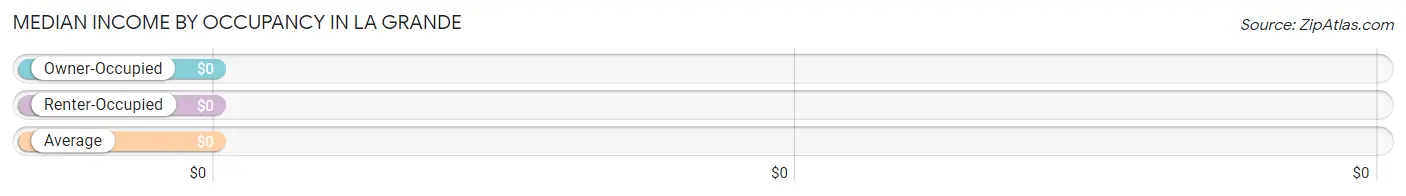
| Occupancy Type | # Households | Median Income |
| Owner-Occupied | 46 (100.0%) | $0 |
| Renter-Occupied | 0 (0.0%) | $0 |
| Average | 46 (100.0%) | $0 |
Occupancy by Householder Income Bracket in La Grande
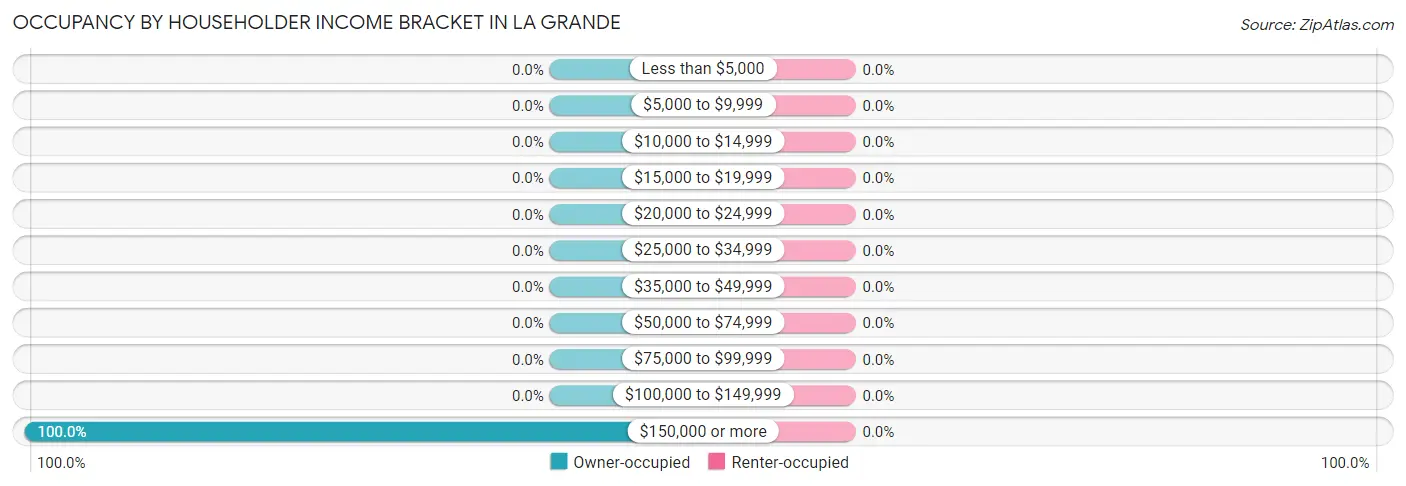
| Income Bracket | Owner-occupied | Renter-occupied |
| Less than $5,000 | 0 (0.0%) | 0 (0.0%) |
| $5,000 to $9,999 | 0 (0.0%) | 0 (0.0%) |
| $10,000 to $14,999 | 0 (0.0%) | 0 (0.0%) |
| $15,000 to $19,999 | 0 (0.0%) | 0 (0.0%) |
| $20,000 to $24,999 | 0 (0.0%) | 0 (0.0%) |
| $25,000 to $34,999 | 0 (0.0%) | 0 (0.0%) |
| $35,000 to $49,999 | 0 (0.0%) | 0 (0.0%) |
| $50,000 to $74,999 | 0 (0.0%) | 0 (0.0%) |
| $75,000 to $99,999 | 0 (0.0%) | 0 (0.0%) |
| $100,000 to $149,999 | 0 (0.0%) | 0 (0.0%) |
| $150,000 or more | 46 (100.0%) | 0 (0.0%) |
| Total | 46 (100.0%) | 0 (0.0%) |
Monthly Housing Cost Tiers in La Grande
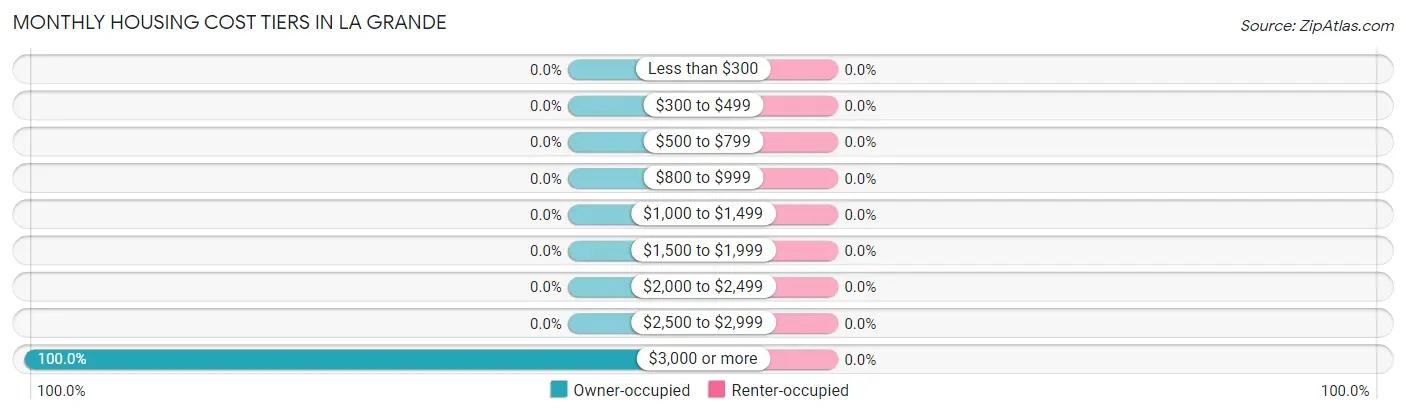
| Monthly Cost | Owner-occupied | Renter-occupied |
| Less than $300 | 0 (0.0%) | 0 (0.0%) |
| $300 to $499 | 0 (0.0%) | 0 (0.0%) |
| $500 to $799 | 0 (0.0%) | 0 (0.0%) |
| $800 to $999 | 0 (0.0%) | 0 (0.0%) |
| $1,000 to $1,499 | 0 (0.0%) | 0 (0.0%) |
| $1,500 to $1,999 | 0 (0.0%) | 0 (0.0%) |
| $2,000 to $2,499 | 0 (0.0%) | 0 (0.0%) |
| $2,500 to $2,999 | 0 (0.0%) | 0 (0.0%) |
| $3,000 or more | 46 (100.0%) | 0 (0.0%) |
| Total | 46 (100.0%) | 0 (0.0%) |
Physical Housing Characteristics in La Grande
Housing Structures in La Grande
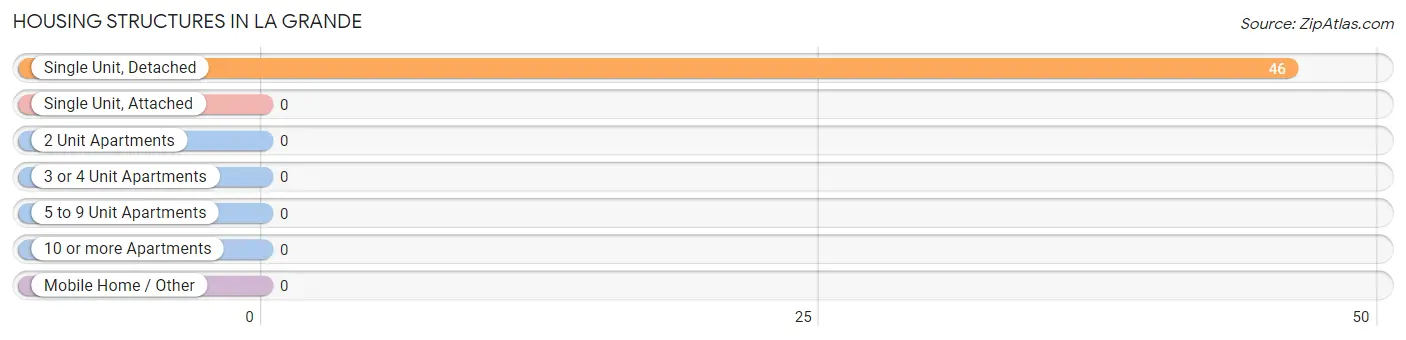
| Structure Type | # Housing Units | % Housing Units |
| Single Unit, Detached | 46 | 100.0% |
| Single Unit, Attached | 0 | 0.0% |
| 2 Unit Apartments | 0 | 0.0% |
| 3 or 4 Unit Apartments | 0 | 0.0% |
| 5 to 9 Unit Apartments | 0 | 0.0% |
| 10 or more Apartments | 0 | 0.0% |
| Mobile Home / Other | 0 | 0.0% |
| Total | 46 | 100.0% |
Housing Structures by Occupancy in La Grande
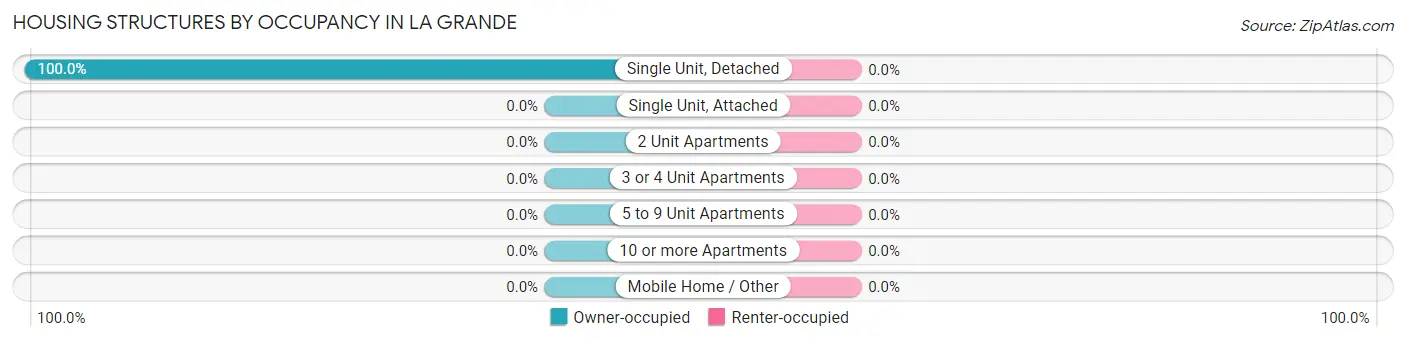
| Structure Type | Owner-occupied | Renter-occupied |
| Single Unit, Detached | 46 (100.0%) | 0 (0.0%) |
| Single Unit, Attached | 0 (0.0%) | 0 (0.0%) |
| 2 Unit Apartments | 0 (0.0%) | 0 (0.0%) |
| 3 or 4 Unit Apartments | 0 (0.0%) | 0 (0.0%) |
| 5 to 9 Unit Apartments | 0 (0.0%) | 0 (0.0%) |
| 10 or more Apartments | 0 (0.0%) | 0 (0.0%) |
| Mobile Home / Other | 0 (0.0%) | 0 (0.0%) |
| Total | 46 (100.0%) | 0 (0.0%) |
Housing Structures by Number of Rooms in La Grande
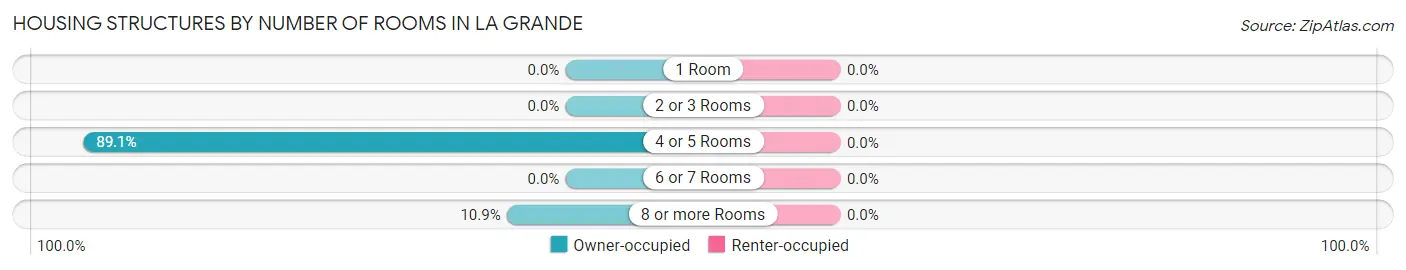
| Number of Rooms | Owner-occupied | Renter-occupied |
| 1 Room | 0 (0.0%) | 0 (0.0%) |
| 2 or 3 Rooms | 0 (0.0%) | 0 (0.0%) |
| 4 or 5 Rooms | 41 (89.1%) | 0 (0.0%) |
| 6 or 7 Rooms | 0 (0.0%) | 0 (0.0%) |
| 8 or more Rooms | 5 (10.9%) | 0 (0.0%) |
| Total | 46 (100.0%) | 0 (0.0%) |
Housing Structure by Heating Type in La Grande
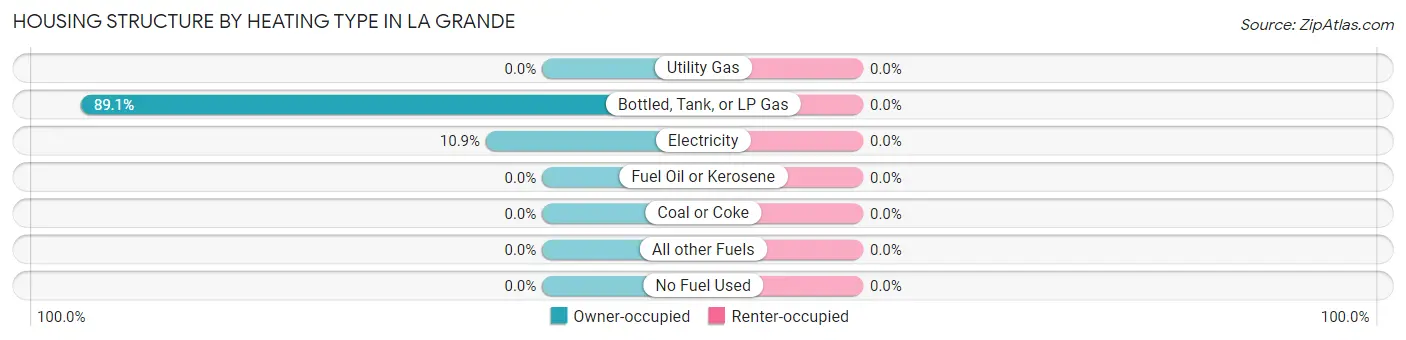
| Heating Type | Owner-occupied | Renter-occupied |
| Utility Gas | 0 (0.0%) | 0 (0.0%) |
| Bottled, Tank, or LP Gas | 41 (89.1%) | 0 (0.0%) |
| Electricity | 5 (10.9%) | 0 (0.0%) |
| Fuel Oil or Kerosene | 0 (0.0%) | 0 (0.0%) |
| Coal or Coke | 0 (0.0%) | 0 (0.0%) |
| All other Fuels | 0 (0.0%) | 0 (0.0%) |
| No Fuel Used | 0 (0.0%) | 0 (0.0%) |
| Total | 46 (100.0%) | 0 (0.0%) |
Household Vehicle Usage in La Grande
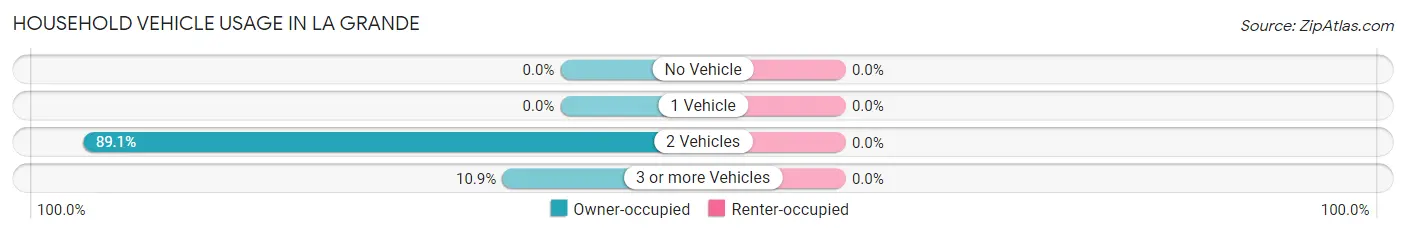
| Vehicles per Household | Owner-occupied | Renter-occupied |
| No Vehicle | 0 (0.0%) | 0 (0.0%) |
| 1 Vehicle | 0 (0.0%) | 0 (0.0%) |
| 2 Vehicles | 41 (89.1%) | 0 (0.0%) |
| 3 or more Vehicles | 5 (10.9%) | 0 (0.0%) |
| Total | 46 (100.0%) | 0 (0.0%) |
Real Estate & Mortgages in La Grande
Real Estate and Mortgage Overview in La Grande
| Characteristic | Without Mortgage | With Mortgage |
| Housing Units | 0 | 46 |
| Median Property Value | - | - |
| Median Household Income | - | - |
| Monthly Housing Costs | - | - |
| Real Estate Taxes | - | - |
Property Value by Mortgage Status in La Grande
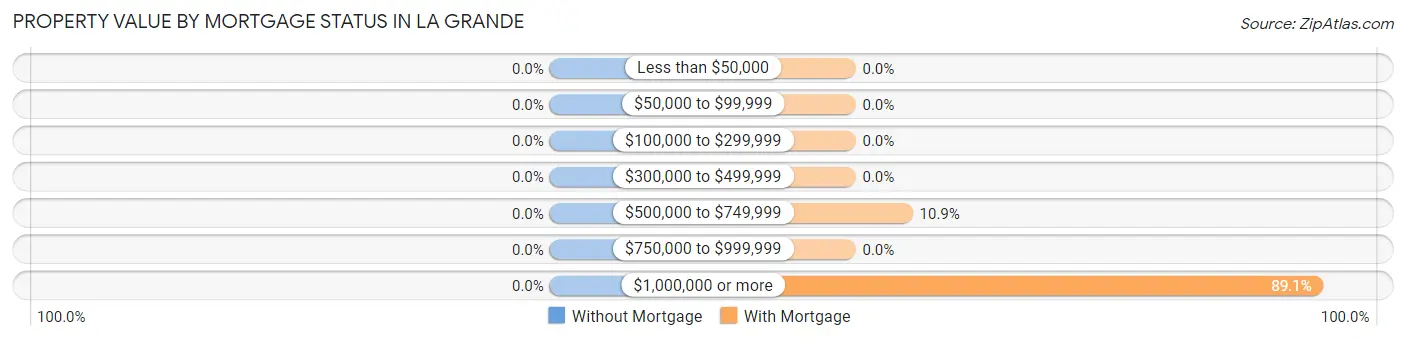
| Property Value | Without Mortgage | With Mortgage |
| Less than $50,000 | 0 (0.0%) | 0 (0.0%) |
| $50,000 to $99,999 | 0 (0.0%) | 0 (0.0%) |
| $100,000 to $299,999 | 0 (0.0%) | 0 (0.0%) |
| $300,000 to $499,999 | 0 (0.0%) | 0 (0.0%) |
| $500,000 to $749,999 | 0 (0.0%) | 5 (10.9%) |
| $750,000 to $999,999 | 0 (0.0%) | 0 (0.0%) |
| $1,000,000 or more | 0 (0.0%) | 41 (89.1%) |
| Total | 0 (0.0%) | 46 (100.0%) |
Household Income by Mortgage Status in La Grande
| Household Income | Without Mortgage | With Mortgage |
| Less than $10,000 | 0 (0.0%) | 0 (0.0%) |
| $10,000 to $24,999 | 0 (0.0%) | 0 (0.0%) |
| $25,000 to $34,999 | 0 (0.0%) | 0 (0.0%) |
| $35,000 to $49,999 | 0 (0.0%) | 0 (0.0%) |
| $50,000 to $74,999 | 0 (0.0%) | 0 (0.0%) |
| $75,000 to $99,999 | 0 (0.0%) | 0 (0.0%) |
| $100,000 to $149,999 | 0 (0.0%) | 0 (0.0%) |
| $150,000 or more | 0 (0.0%) | 0 (0.0%) |
| Total | 0 (0.0%) | 46 (100.0%) |
Property Value to Household Income Ratio in La Grande
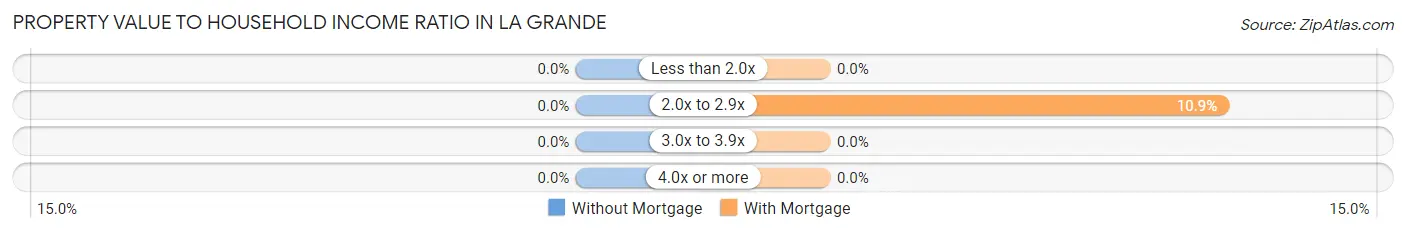
| Value-to-Income Ratio | Without Mortgage | With Mortgage |
| Less than 2.0x | 0 (0.0%) | 0 (0.0%) |
| 2.0x to 2.9x | 0 (0.0%) | 5 (10.9%) |
| 3.0x to 3.9x | 0 (0.0%) | 0 (0.0%) |
| 4.0x or more | 0 (0.0%) | 0 (0.0%) |
| Total | 0 (0.0%) | 46 (100.0%) |
Real Estate Taxes by Mortgage Status in La Grande
| Property Taxes | Without Mortgage | With Mortgage |
| Less than $800 | 0 (0.0%) | 0 (0.0%) |
| $800 to $1,499 | 0 (0.0%) | 0 (0.0%) |
| $800 to $1,499 | 0 (0.0%) | 0 (0.0%) |
| Total | 0 (0.0%) | 46 (100.0%) |
Health & Disability in La Grande
Health Insurance Coverage by Age in La Grande
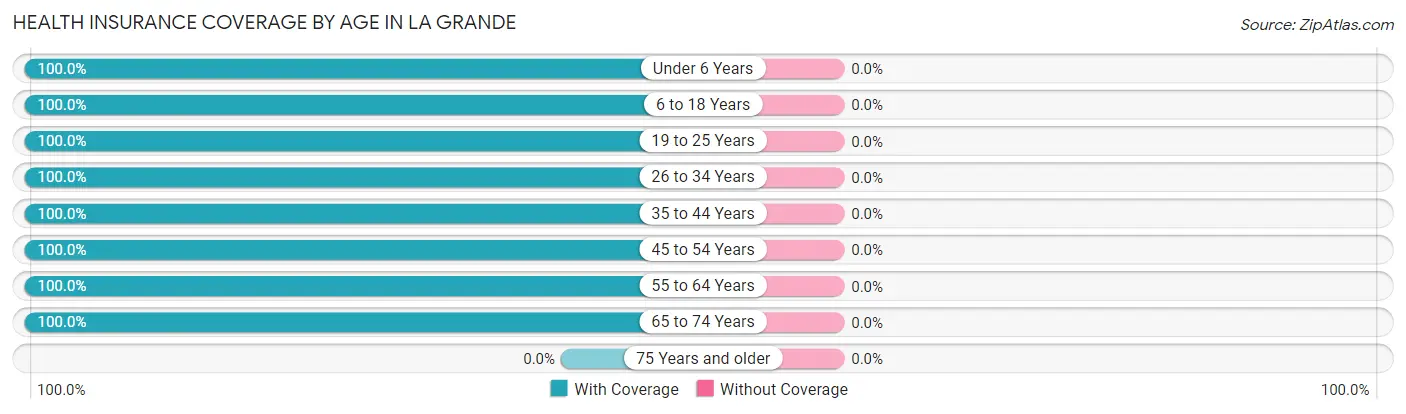
| Age Bracket | With Coverage | Without Coverage |
| Under 6 Years | 45 (100.0%) | 0 (0.0%) |
| 6 to 18 Years | 42 (100.0%) | 0 (0.0%) |
| 19 to 25 Years | 24 (100.0%) | 0 (0.0%) |
| 26 to 34 Years | 10 (100.0%) | 0 (0.0%) |
| 35 to 44 Years | 41 (100.0%) | 0 (0.0%) |
| 45 to 54 Years | 43 (100.0%) | 0 (0.0%) |
| 55 to 64 Years | 9 (100.0%) | 0 (0.0%) |
| 65 to 74 Years | 5 (100.0%) | 0 (0.0%) |
| 75 Years and older | 0 (0.0%) | 0 (0.0%) |
| Total | 219 (100.0%) | 0 (0.0%) |
Health Insurance Coverage by Citizenship Status in La Grande

| Citizenship Status | With Coverage | Without Coverage |
| Native Born | 45 (100.0%) | 0 (0.0%) |
| Foreign Born, Citizen | 42 (100.0%) | 0 (0.0%) |
| Foreign Born, not a Citizen | 24 (100.0%) | 0 (0.0%) |
Health Insurance Coverage by Household Income in La Grande
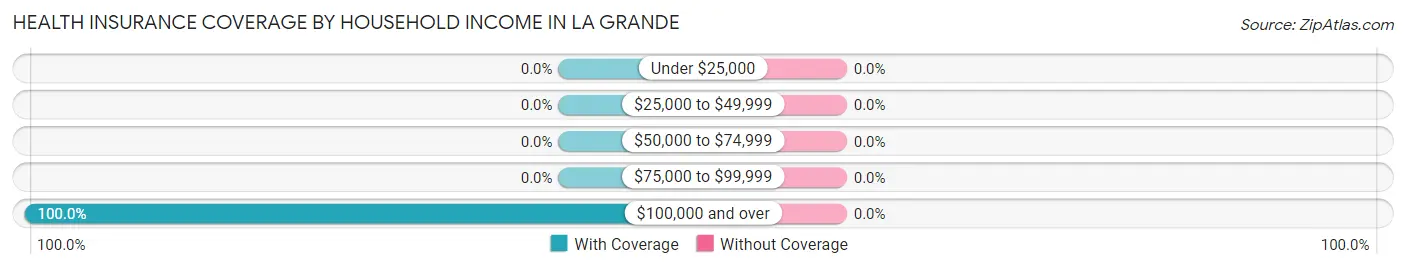
| Household Income | With Coverage | Without Coverage |
| Under $25,000 | 0 (0.0%) | 0 (0.0%) |
| $25,000 to $49,999 | 0 (0.0%) | 0 (0.0%) |
| $50,000 to $74,999 | 0 (0.0%) | 0 (0.0%) |
| $75,000 to $99,999 | 0 (0.0%) | 0 (0.0%) |
| $100,000 and over | 219 (100.0%) | 0 (0.0%) |
Public vs Private Health Insurance Coverage by Age in La Grande
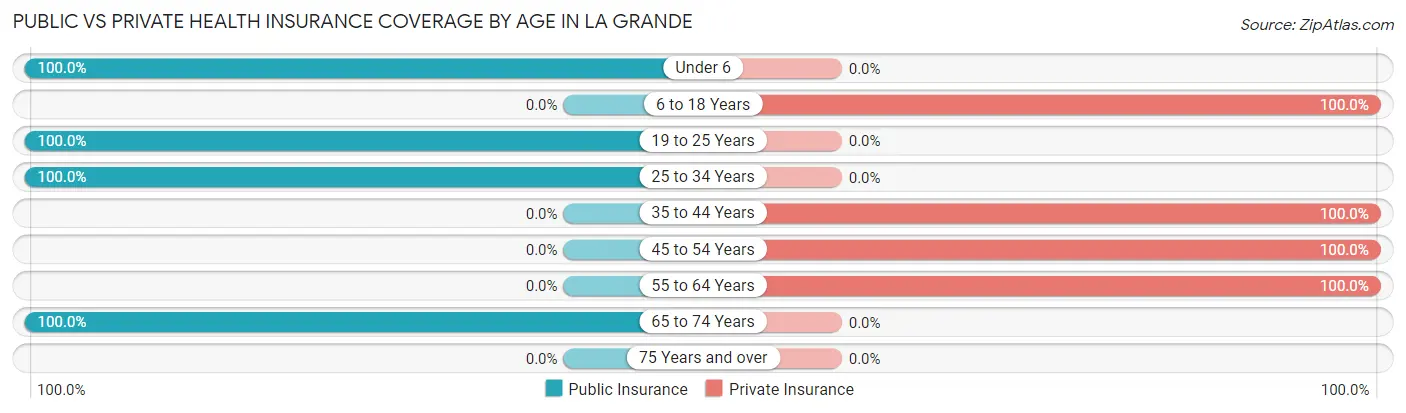
| Age Bracket | Public Insurance | Private Insurance |
| Under 6 | 45 (100.0%) | 0 (0.0%) |
| 6 to 18 Years | 0 (0.0%) | 42 (100.0%) |
| 19 to 25 Years | 24 (100.0%) | 0 (0.0%) |
| 25 to 34 Years | 10 (100.0%) | 0 (0.0%) |
| 35 to 44 Years | 0 (0.0%) | 41 (100.0%) |
| 45 to 54 Years | 0 (0.0%) | 43 (100.0%) |
| 55 to 64 Years | 0 (0.0%) | 9 (100.0%) |
| 65 to 74 Years | 5 (100.0%) | 0 (0.0%) |
| 75 Years and over | 0 (0.0%) | 0 (0.0%) |
| Total | 84 (38.4%) | 135 (61.6%) |
Disability Status by Sex by Age in La Grande
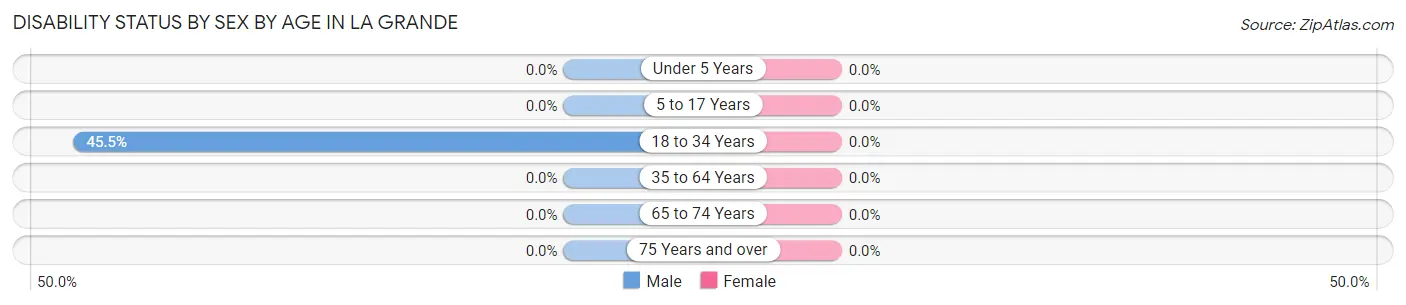
| Age Bracket | Male | Female |
| Under 5 Years | 0 (0.0%) | 0 (0.0%) |
| 5 to 17 Years | 0 (0.0%) | 0 (0.0%) |
| 18 to 34 Years | 10 (45.5%) | 0 (0.0%) |
| 35 to 64 Years | 0 (0.0%) | 0 (0.0%) |
| 65 to 74 Years | 0 (0.0%) | 0 (0.0%) |
| 75 Years and over | 0 (0.0%) | 0 (0.0%) |
Disability Class by Sex by Age in La Grande
Disability Class: Hearing Difficulty
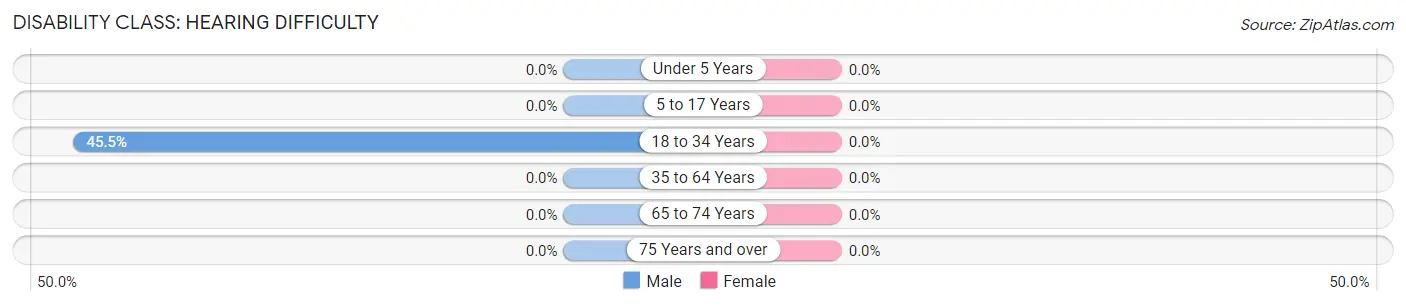
| Age Bracket | Male | Female |
| Under 5 Years | 0 (0.0%) | 0 (0.0%) |
| 5 to 17 Years | 0 (0.0%) | 0 (0.0%) |
| 18 to 34 Years | 10 (45.5%) | 0 (0.0%) |
| 35 to 64 Years | 0 (0.0%) | 0 (0.0%) |
| 65 to 74 Years | 0 (0.0%) | 0 (0.0%) |
| 75 Years and over | 0 (0.0%) | 0 (0.0%) |
Disability Class: Vision Difficulty
| Age Bracket | Male | Female |
| Under 5 Years | 0 (0.0%) | 0 (0.0%) |
| 5 to 17 Years | 0 (0.0%) | 0 (0.0%) |
| 18 to 34 Years | 0 (0.0%) | 0 (0.0%) |
| 35 to 64 Years | 0 (0.0%) | 0 (0.0%) |
| 65 to 74 Years | 0 (0.0%) | 0 (0.0%) |
| 75 Years and over | 0 (0.0%) | 0 (0.0%) |
Disability Class: Cognitive Difficulty

| Age Bracket | Male | Female |
| 5 to 17 Years | 0 (0.0%) | 0 (0.0%) |
| 18 to 34 Years | 0 (0.0%) | 0 (0.0%) |
| 35 to 64 Years | 0 (0.0%) | 0 (0.0%) |
| 65 to 74 Years | 0 (0.0%) | 0 (0.0%) |
| 75 Years and over | 0 (0.0%) | 0 (0.0%) |
Disability Class: Ambulatory Difficulty
| Age Bracket | Male | Female |
| 5 to 17 Years | 0 (0.0%) | 0 (0.0%) |
| 18 to 34 Years | 0 (0.0%) | 0 (0.0%) |
| 35 to 64 Years | 0 (0.0%) | 0 (0.0%) |
| 65 to 74 Years | 0 (0.0%) | 0 (0.0%) |
| 75 Years and over | 0 (0.0%) | 0 (0.0%) |
Disability Class: Self-Care Difficulty
| Age Bracket | Male | Female |
| 5 to 17 Years | 0 (0.0%) | 0 (0.0%) |
| 18 to 34 Years | 0 (0.0%) | 0 (0.0%) |
| 35 to 64 Years | 0 (0.0%) | 0 (0.0%) |
| 65 to 74 Years | 0 (0.0%) | 0 (0.0%) |
| 75 Years and over | 0 (0.0%) | 0 (0.0%) |
Technology Access in La Grande
Computing Device Access in La Grande
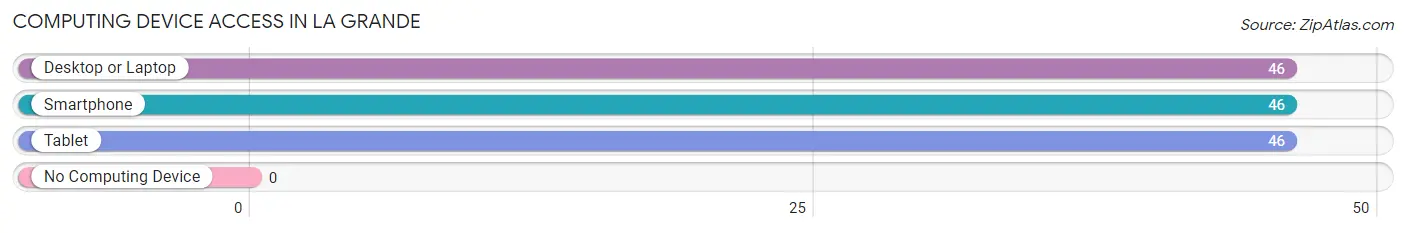
| Device Type | # Households | % Households |
| Desktop or Laptop | 46 | 100.0% |
| Smartphone | 46 | 100.0% |
| Tablet | 46 | 100.0% |
| No Computing Device | 0 | 0.0% |
| Total | 46 | 100.0% |
Internet Access in La Grande
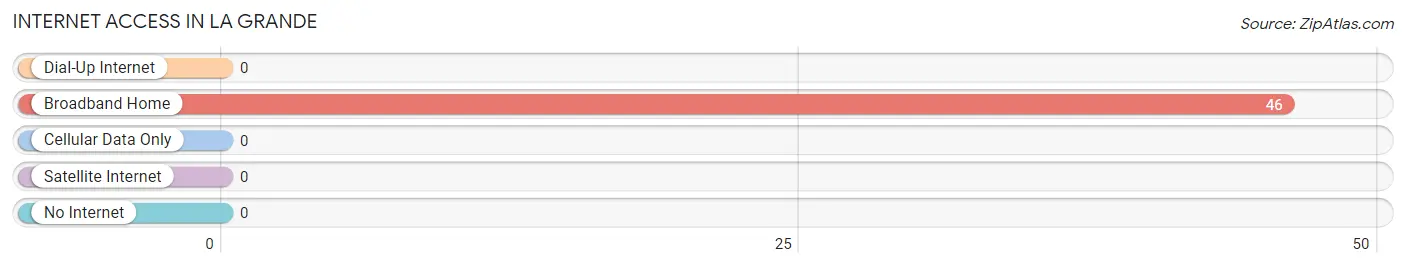
| Internet Type | # Households | % Households |
| Dial-Up Internet | 0 | 0.0% |
| Broadband Home | 46 | 100.0% |
| Cellular Data Only | 0 | 0.0% |
| Satellite Internet | 0 | 0.0% |
| No Internet | 0 | 0.0% |
| Total | 46 | 100.0% |
La Grande Summary
La Grande is a small city located in the northeastern corner of Washington State, in the United States. It is situated in the foothills of the Cascade Mountains, and is the county seat of Whitman County. La Grande has a population of approximately 8,000 people, and is the largest city in the county.
History
La Grande was first settled in 1883 by a group of settlers from the nearby town of Palouse. The settlers were attracted to the area by the abundance of natural resources, including timber, water, and fertile soil. The town was originally named "Palouse Junction", but was later changed to "La Grande" in honor of the nearby Grande Ronde River.
The town quickly grew, and by the early 1900s, it had become a major hub for the timber industry. The town was also home to several sawmills, a flour mill, and a brickyard. In the 1920s, the town began to diversify its economy, and by the 1940s, it had become a major agricultural center.
Geography
La Grande is located in the northeastern corner of Washington State, in the United States. It is situated in the foothills of the Cascade Mountains, and is the county seat of Whitman County. The city is located at an elevation of 1,890 feet (576 meters) above sea level.
The city is located on the banks of the Grande Ronde River, and is surrounded by rolling hills and forests. The nearby mountains provide a stunning backdrop to the city, and the nearby Palouse River provides a picturesque view of the surrounding countryside.
Economy
La Grande's economy is largely based on agriculture and timber. The city is home to several large farms, and the surrounding area is home to numerous timber companies. The city is also home to several manufacturing companies, including a paper mill and a furniture factory.
The city is also home to several retail stores, restaurants, and other businesses. The city is also home to several educational institutions, including a community college and a technical college.
Demographics
As of the 2010 census, La Grande had a population of 8,000 people. The racial makeup of the city was 90.2% White, 0.7% African American, 0.7% Native American, 0.7% Asian, 0.2% Pacific Islander, and 6.2% from other races. Hispanic or Latino of any race were 4.2% of the population.
The median household income in La Grande was $37,000, and the median family income was $45,000. The per capita income for the city was $19,000. About 11.2% of families and 14.2% of the population were below the poverty line, including 17.2% of those under age 18 and 8.2% of those age 65 or over.
Conclusion
La Grande is a small city located in the northeastern corner of Washington State, in the United States. It is situated in the foothills of the Cascade Mountains, and is the county seat of Whitman County. La Grande has a population of approximately 8,000 people, and is the largest city in the county. The city's economy is largely based on agriculture and timber, and it is home to several educational institutions. The city has a diverse population, with a median household income of $37,000 and a median family income of $45,000. La Grande is a vibrant and diverse city, and is a great place to live and work.
Common Questions
What is Per Capita Income in La Grande?
Per Capita income in La Grande is $56,158.
What is Inequality or Gini Index in La Grande?
Inequality or Gini Index in La Grande is 0.06.
What is the Total Population of La Grande?
Total Population of La Grande is 219.
What is the Total Male Population of La Grande?
Total Male Population of La Grande is 157.
What is the Total Female Population of La Grande?
Total Female Population of La Grande is 62.
What is the Ratio of Males per 100 Females in La Grande?
There are 253.23 Males per 100 Females in La Grande.
What is the Ratio of Females per 100 Males in La Grande?
There are 39.49 Females per 100 Males in La Grande.
What is the Median Population Age in La Grande?
Median Population Age in La Grande is 25.9 Years.
What is the Average Family Size in La Grande
Average Family Size in La Grande is 3.5 People.
What is the Average Household Size in La Grande
Average Household Size in La Grande is 4.8 People.
How Large is the Labor Force in La Grande?
There are 132 People in the Labor Forcein in La Grande.
What is the Percentage of People in the Labor Force in La Grande?
100.0% of People are in the Labor Force in La Grande.