Zip Codes with the Highest Percentage of Population Employed in Computer, Engineering & Science in Puyallup, WA
RELATED REPORTS & OPTIONS
Computer, Engineering & Science
Puyallup
Compare Zip Codes
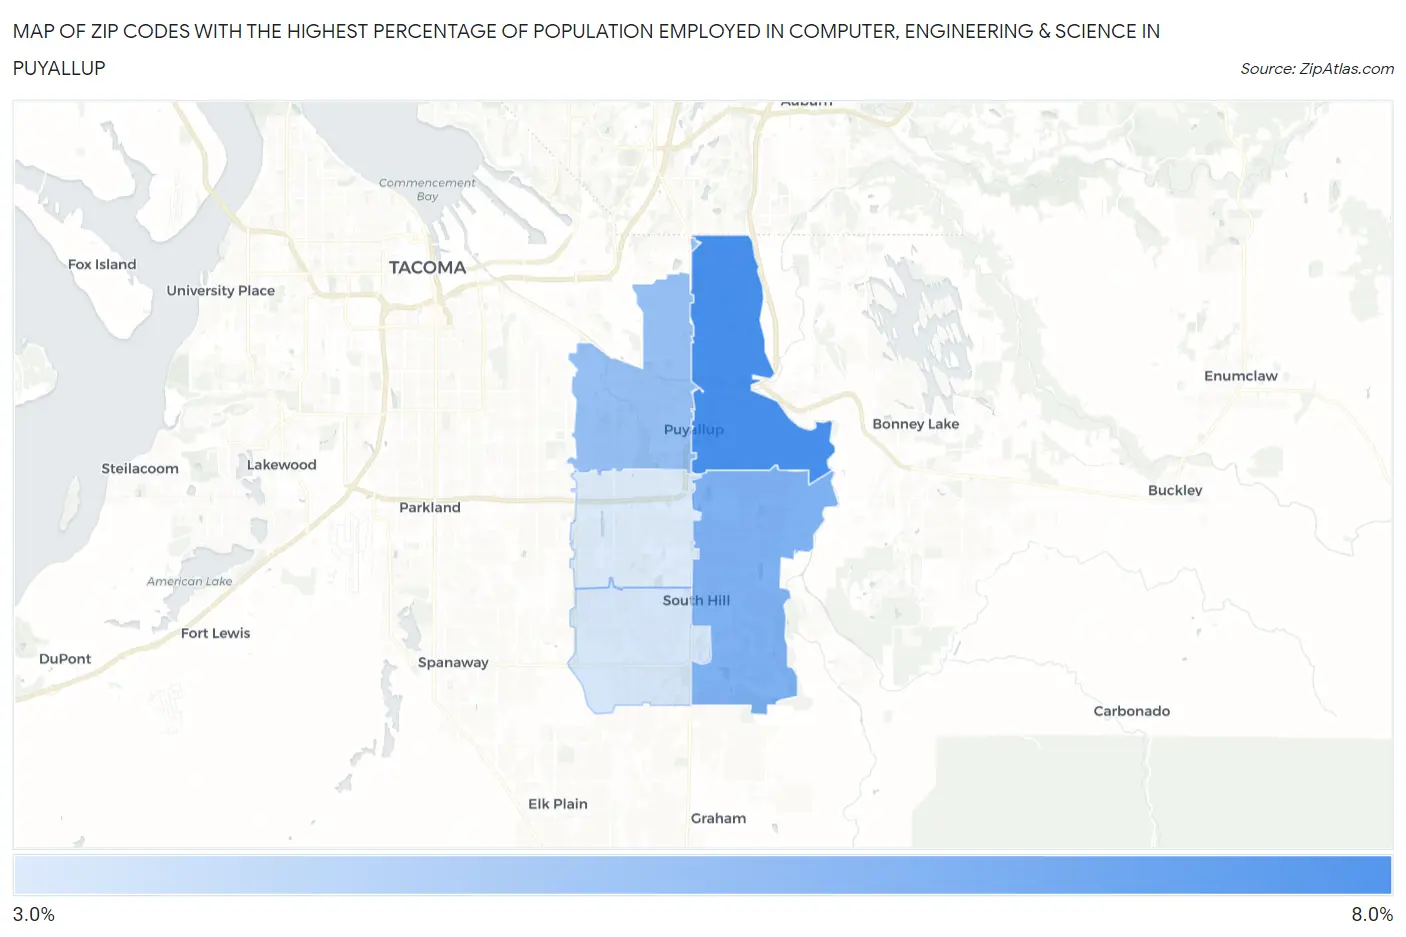
Map of Zip Codes with the Highest Percentage of Population Employed in Computer, Engineering & Science in Puyallup
3.7%
6.2%
Zip Codes with the Highest Percentage of Population Employed in Computer, Engineering & Science in Puyallup, WA
| Zip Code | % Employed | vs State | vs National | |
| 1. | 98372 | 6.2% | 10.2%(-3.99)#240 | 6.8%(-0.598)#8,429 |
| 2. | 98374 | 5.2% | 10.2%(-4.94)#295 | 6.8%(-1.55)#10,774 |
| 3. | 98371 | 4.8% | 10.2%(-5.33)#321 | 6.8%(-1.93)#11,860 |
| 4. | 98375 | 3.8% | 10.2%(-6.39)#378 | 6.8%(-3.00)#15,259 |
| 5. | 98373 | 3.7% | 10.2%(-6.50)#383 | 6.8%(-3.11)#15,640 |
1
Common Questions
What are the Top 3 Zip Codes with the Highest Percentage of Population Employed in Computer, Engineering & Science in Puyallup, WA?
Top 3 Zip Codes with the Highest Percentage of Population Employed in Computer, Engineering & Science in Puyallup, WA are:
What zip code has the Highest Percentage of Population Employed in Computer, Engineering & Science in Puyallup, WA?
98372 has the Highest Percentage of Population Employed in Computer, Engineering & Science in Puyallup, WA with 6.2%.
What is the Percentage of Population Employed in Computer, Engineering & Science in Puyallup, WA?
Percentage of Population Employed in Computer, Engineering & Science in Puyallup is 4.9%.
What is the Percentage of Population Employed in Computer, Engineering & Science in Washington?
Percentage of Population Employed in Computer, Engineering & Science in Washington is 10.2%.
What is the Percentage of Population Employed in Computer, Engineering & Science in the United States?
Percentage of Population Employed in Computer, Engineering & Science in the United States is 6.8%.