Zip Codes with the Highest Percentage of Population Employed in Computer, Engineering & Science in Lynnwood, WA
RELATED REPORTS & OPTIONS
Computer, Engineering & Science
Lynnwood
Compare Zip Codes
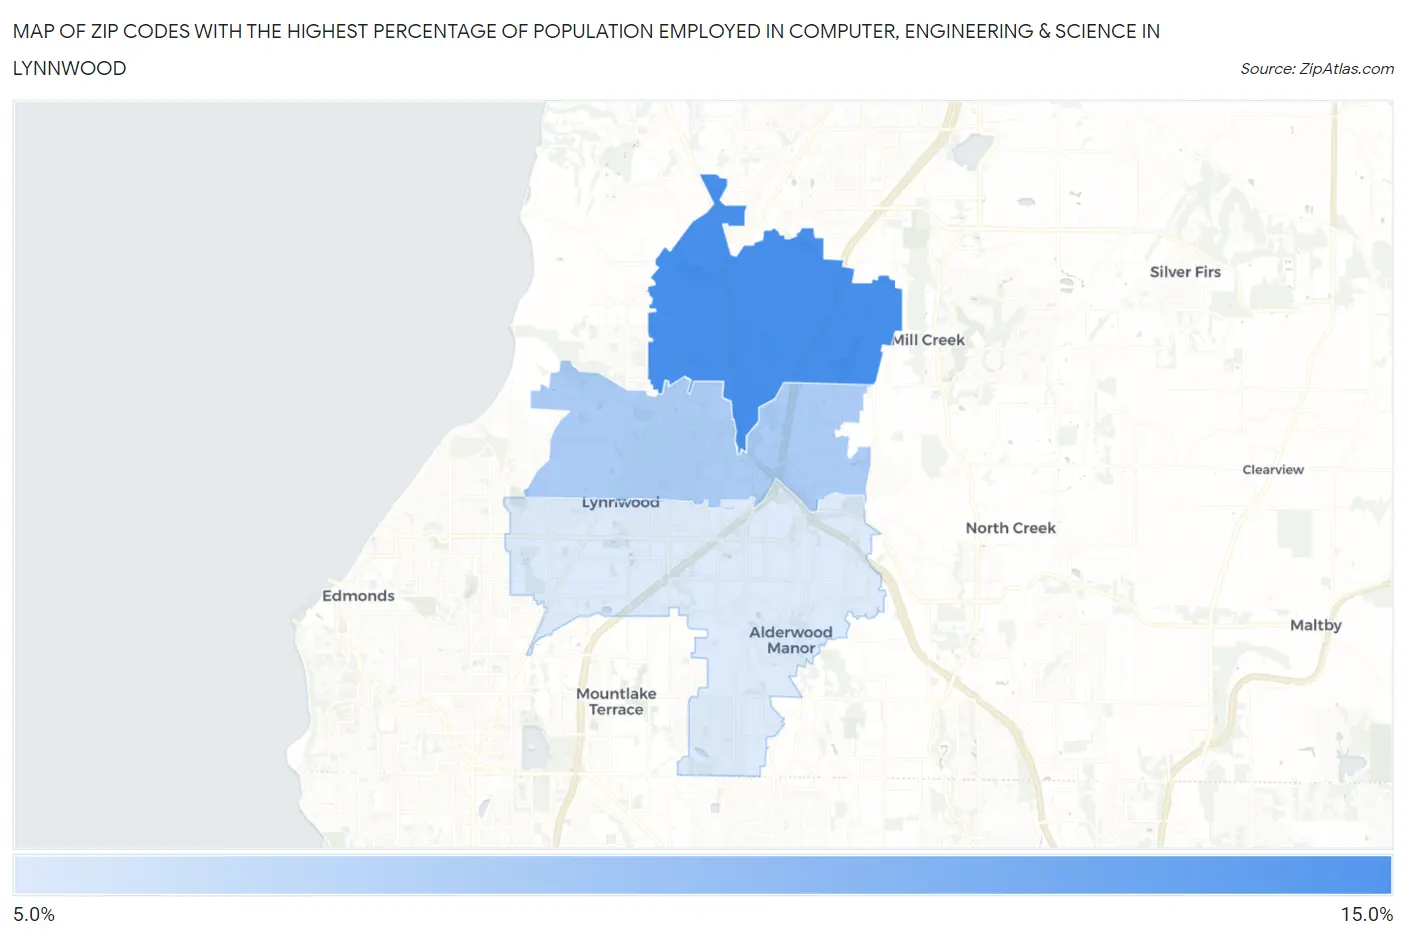
Map of Zip Codes with the Highest Percentage of Population Employed in Computer, Engineering & Science in Lynnwood
10.7%
11.7%
Zip Codes with the Highest Percentage of Population Employed in Computer, Engineering & Science in Lynnwood, WA
| Zip Code | % Employed | vs State | vs National | |
| 1. | 98087 | 11.7% | 10.2%(+1.51)#93 | 6.8%(+4.90)#2,199 |
| 2. | 98037 | 11.0% | 10.2%(+0.885)#102 | 6.8%(+4.28)#2,543 |
| 3. | 98036 | 10.7% | 10.2%(+0.575)#106 | 6.8%(+3.97)#2,707 |
1
Common Questions
What are the Top Zip Codes with the Highest Percentage of Population Employed in Computer, Engineering & Science in Lynnwood, WA?
Top Zip Codes with the Highest Percentage of Population Employed in Computer, Engineering & Science in Lynnwood, WA are:
What zip code has the Highest Percentage of Population Employed in Computer, Engineering & Science in Lynnwood, WA?
98087 has the Highest Percentage of Population Employed in Computer, Engineering & Science in Lynnwood, WA with 11.7%.
What is the Percentage of Population Employed in Computer, Engineering & Science in Lynnwood, WA?
Percentage of Population Employed in Computer, Engineering & Science in Lynnwood is 8.1%.
What is the Percentage of Population Employed in Computer, Engineering & Science in Washington?
Percentage of Population Employed in Computer, Engineering & Science in Washington is 10.2%.
What is the Percentage of Population Employed in Computer, Engineering & Science in the United States?
Percentage of Population Employed in Computer, Engineering & Science in the United States is 6.8%.