Zip Codes with the Highest Percentage of Population Employed in Computer, Engineering & Science in Kent, WA
RELATED REPORTS & OPTIONS
Computer, Engineering & Science
Kent
Compare Zip Codes
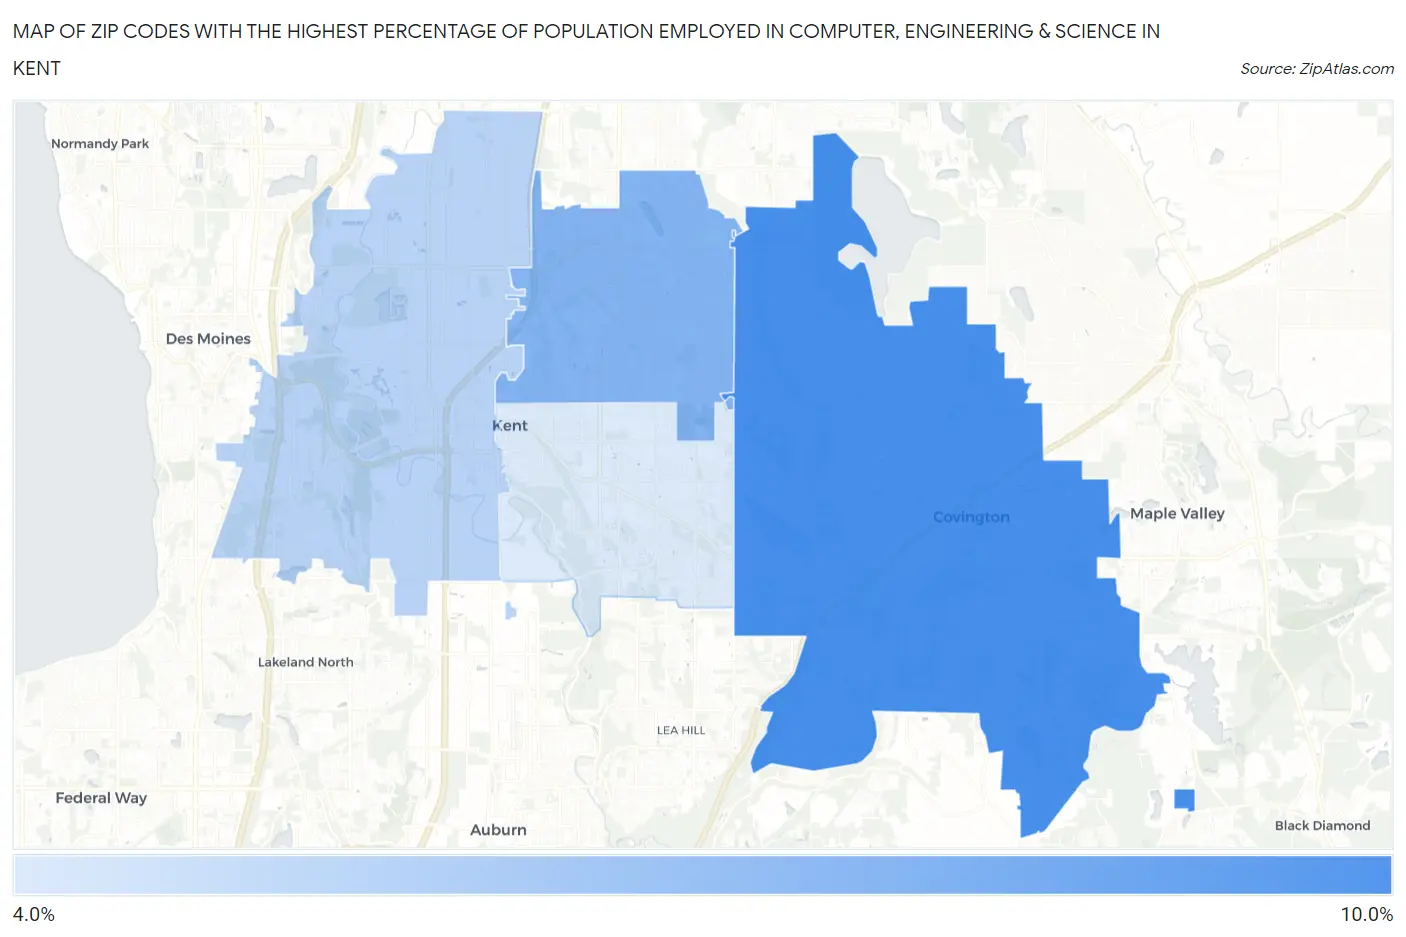
Map of Zip Codes with the Highest Percentage of Population Employed in Computer, Engineering & Science in Kent
5.0%
9.1%
Zip Codes with the Highest Percentage of Population Employed in Computer, Engineering & Science in Kent, WA
| Zip Code | % Employed | vs State | vs National | |
| 1. | 98042 | 9.1% | 10.2%(-1.03)#134 | 6.8%(+2.37)#3,933 |
| 2. | 98031 | 7.4% | 10.2%(-2.74)#180 | 6.8%(+0.655)#6,127 |
| 3. | 98032 | 6.0% | 10.2%(-4.21)#247 | 6.8%(-0.813)#8,951 |
| 4. | 98030 | 5.0% | 10.2%(-5.19)#311 | 6.8%(-1.79)#11,454 |
1
Common Questions
What are the Top 3 Zip Codes with the Highest Percentage of Population Employed in Computer, Engineering & Science in Kent, WA?
Top 3 Zip Codes with the Highest Percentage of Population Employed in Computer, Engineering & Science in Kent, WA are:
What zip code has the Highest Percentage of Population Employed in Computer, Engineering & Science in Kent, WA?
98042 has the Highest Percentage of Population Employed in Computer, Engineering & Science in Kent, WA with 9.1%.
What is the Percentage of Population Employed in Computer, Engineering & Science in Kent, WA?
Percentage of Population Employed in Computer, Engineering & Science in Kent is 6.8%.
What is the Percentage of Population Employed in Computer, Engineering & Science in Washington?
Percentage of Population Employed in Computer, Engineering & Science in Washington is 10.2%.
What is the Percentage of Population Employed in Computer, Engineering & Science in the United States?
Percentage of Population Employed in Computer, Engineering & Science in the United States is 6.8%.