Zip Codes with the Highest Percentage of Population Employed in Computer, Engineering & Science in Renton, WA
RELATED REPORTS & OPTIONS
Computer, Engineering & Science
Renton
Compare Zip Codes
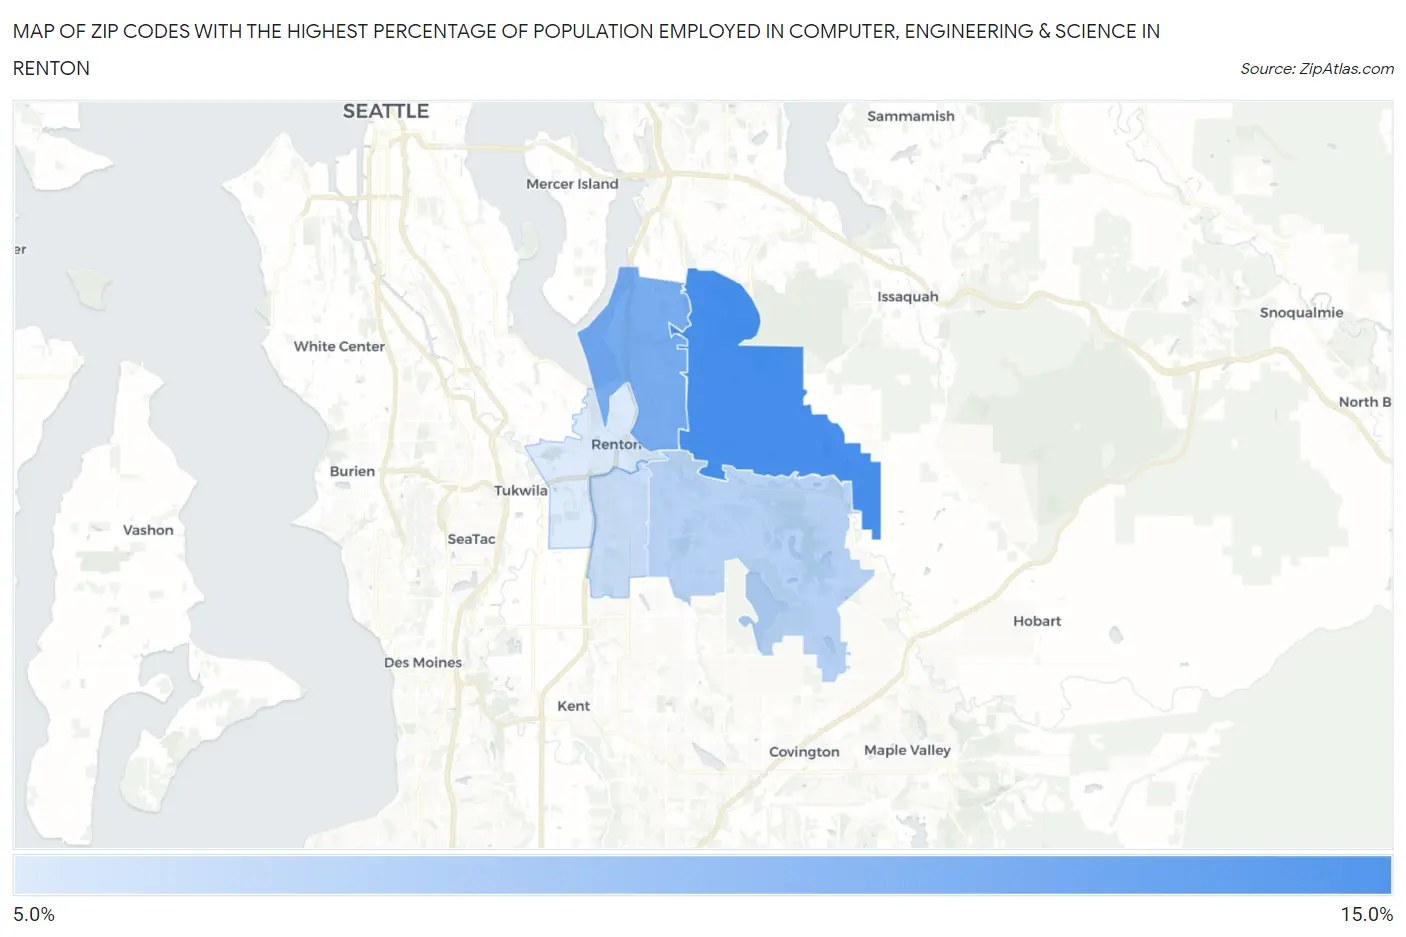
Map of Zip Codes with the Highest Percentage of Population Employed in Computer, Engineering & Science in Renton
9.8%
14.7%
Zip Codes with the Highest Percentage of Population Employed in Computer, Engineering & Science in Renton, WA
| Zip Code | % Employed | vs State | vs National | |
| 1. | 98059 | 14.7% | 10.2%(+4.58)#62 | 6.8%(+7.98)#1,165 |
| 2. | 98056 | 13.2% | 10.2%(+2.99)#75 | 6.8%(+6.39)#1,587 |
| 3. | 98058 | 11.0% | 10.2%(+0.856)#103 | 6.8%(+4.25)#2,562 |
| 4. | 98055 | 10.5% | 10.2%(+0.336)#109 | 6.8%(+3.73)#2,872 |
| 5. | 98057 | 9.8% | 10.2%(-0.324)#117 | 6.8%(+3.07)#3,339 |
1
Common Questions
What are the Top 3 Zip Codes with the Highest Percentage of Population Employed in Computer, Engineering & Science in Renton, WA?
Top 3 Zip Codes with the Highest Percentage of Population Employed in Computer, Engineering & Science in Renton, WA are:
What zip code has the Highest Percentage of Population Employed in Computer, Engineering & Science in Renton, WA?
98059 has the Highest Percentage of Population Employed in Computer, Engineering & Science in Renton, WA with 14.7%.
What is the Percentage of Population Employed in Computer, Engineering & Science in Renton, WA?
Percentage of Population Employed in Computer, Engineering & Science in Renton is 11.4%.
What is the Percentage of Population Employed in Computer, Engineering & Science in Washington?
Percentage of Population Employed in Computer, Engineering & Science in Washington is 10.2%.
What is the Percentage of Population Employed in Computer, Engineering & Science in the United States?
Percentage of Population Employed in Computer, Engineering & Science in the United States is 6.8%.