Marrowstone, WA Map & Demographics
Marrowstone Map
Marrowstone Overview
$51,731
PER CAPITA INCOME
$71,786
AVG FAMILY INCOME
$71,389
AVG HOUSEHOLD INCOME
$3,878
FAMILY INCOME DEFICIT
0.55
INEQUALITY / GINI INDEX
882
TOTAL POPULATION
477
MALE POPULATION
405
FEMALE POPULATION
117.78
MALES / 100 FEMALES
84.91
FEMALES / 100 MALES
59.8
MEDIAN AGE
2.3
AVG FAMILY SIZE
2.0
AVG HOUSEHOLD SIZE
354
LABOR FORCE [ PEOPLE ]
43.4%
PERCENT IN LABOR FORCE
3.4%
UNEMPLOYMENT RATE
Income in Marrowstone
Income Overview in Marrowstone
Per Capita Income in Marrowstone is $51,731, while median incomes of families and households are $71,786 and $71,389 respectively.
| Characteristic | Number | Measure |
| Per Capita Income | 882 | $51,731 |
| Median Family Income | 296 | $71,786 |
| Mean Family Income | 296 | $119,313 |
| Median Household Income | 444 | $71,389 |
| Mean Household Income | 444 | $102,682 |
| Income Deficit | 296 | $3,878 |
| Wage / Income Gap (%) | 882 | 0.00% |
| Wage / Income Gap ($) | 882 | 100.00¢ per $1 |
| Gini / Inequality Index | 882 | 0.55 |
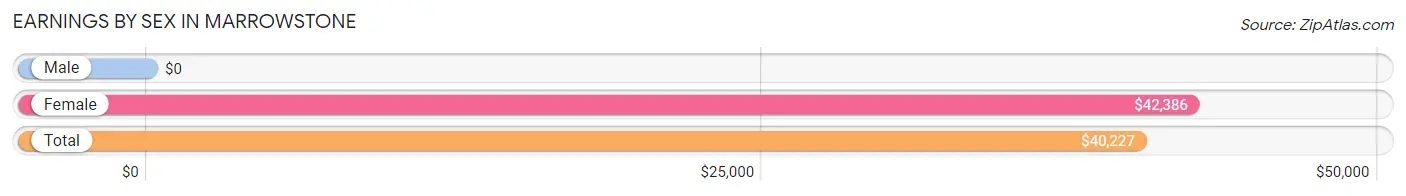
Earnings by Sex in Marrowstone
| Sex | Number | Average Earnings |
| Male | 242 (59.6%) | $0 |
| Female | 164 (40.4%) | $42,386 |
| Total | 406 (100.0%) | $40,227 |
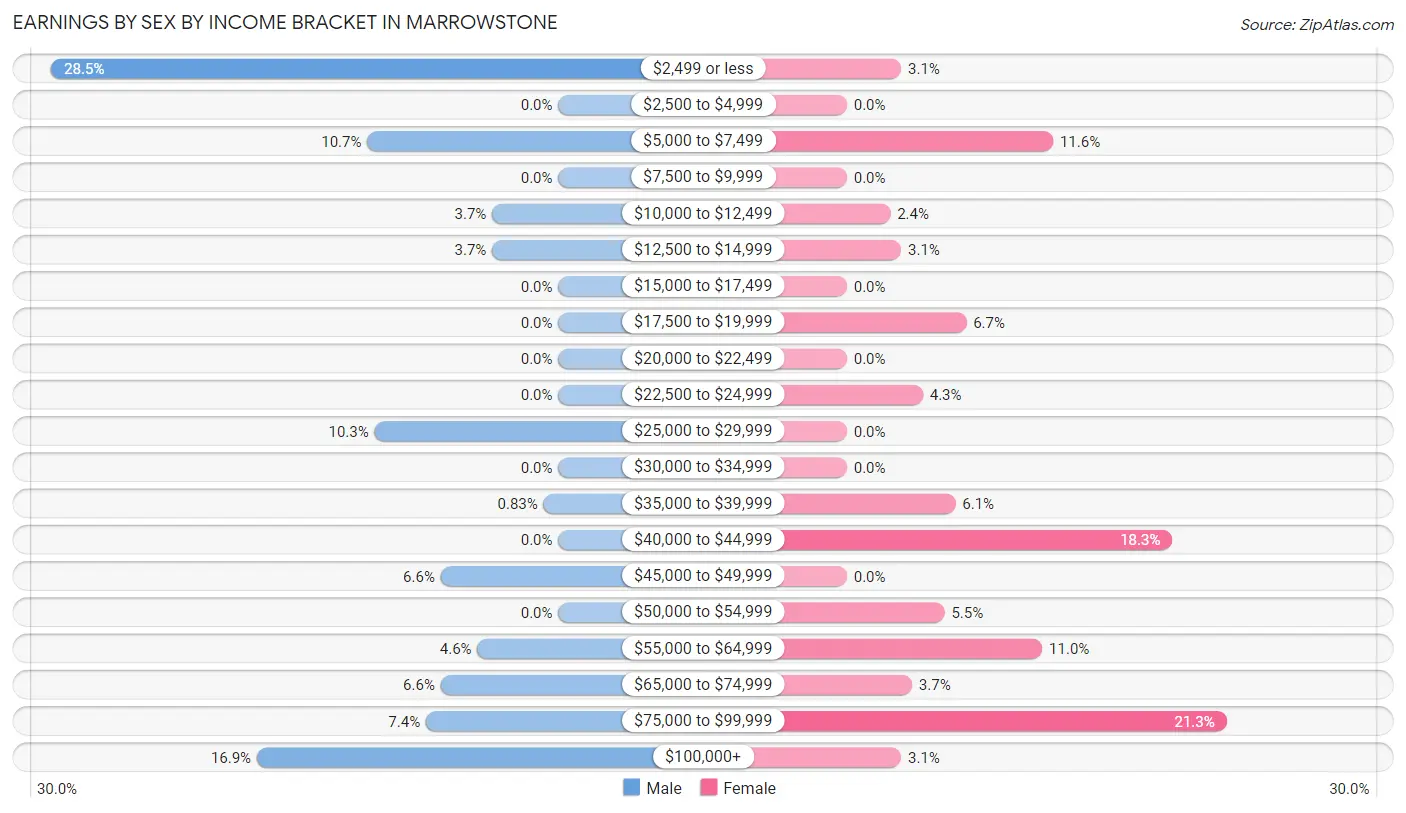
Earnings by Sex by Income Bracket in Marrowstone
The most common earnings brackets in Marrowstone are $2,499 or less for men (69 | 28.5%) and $75,000 to $99,999 for women (35 | 21.3%).
| Income | Male | Female |
| $2,499 or less | 69 (28.5%) | 5 (3.0%) |
| $2,500 to $4,999 | 0 (0.0%) | 0 (0.0%) |
| $5,000 to $7,499 | 26 (10.7%) | 19 (11.6%) |
| $7,500 to $9,999 | 0 (0.0%) | 0 (0.0%) |
| $10,000 to $12,499 | 9 (3.7%) | 4 (2.4%) |
| $12,500 to $14,999 | 9 (3.7%) | 5 (3.0%) |
| $15,000 to $17,499 | 0 (0.0%) | 0 (0.0%) |
| $17,500 to $19,999 | 0 (0.0%) | 11 (6.7%) |
| $20,000 to $22,499 | 0 (0.0%) | 0 (0.0%) |
| $22,500 to $24,999 | 0 (0.0%) | 7 (4.3%) |
| $25,000 to $29,999 | 25 (10.3%) | 0 (0.0%) |
| $30,000 to $34,999 | 0 (0.0%) | 0 (0.0%) |
| $35,000 to $39,999 | 2 (0.8%) | 10 (6.1%) |
| $40,000 to $44,999 | 0 (0.0%) | 30 (18.3%) |
| $45,000 to $49,999 | 16 (6.6%) | 0 (0.0%) |
| $50,000 to $54,999 | 0 (0.0%) | 9 (5.5%) |
| $55,000 to $64,999 | 11 (4.5%) | 18 (11.0%) |
| $65,000 to $74,999 | 16 (6.6%) | 6 (3.7%) |
| $75,000 to $99,999 | 18 (7.4%) | 35 (21.3%) |
| $100,000+ | 41 (16.9%) | 5 (3.0%) |
| Total | 242 (100.0%) | 164 (100.0%) |
Earnings by Sex by Educational Attainment in Marrowstone
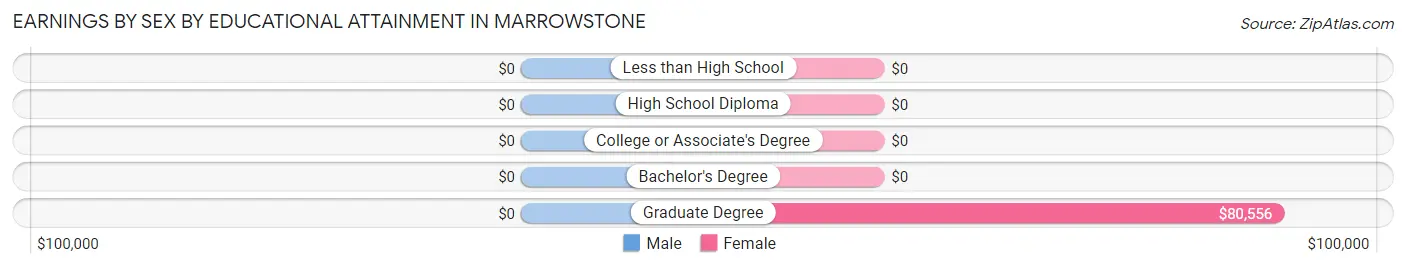
| Educational Attainment | Male Income | Female Income |
| Less than High School | - | - |
| High School Diploma | - | - |
| College or Associate's Degree | - | - |
| Bachelor's Degree | - | - |
| Graduate Degree | - | - |
| Total | - | - |
Family Income in Marrowstone
Family Income Brackets in Marrowstone
According to the Marrowstone family income data, there are 57 families falling into the $200,000+ income range, which is the most common income bracket and makes up 19.3% of all families.
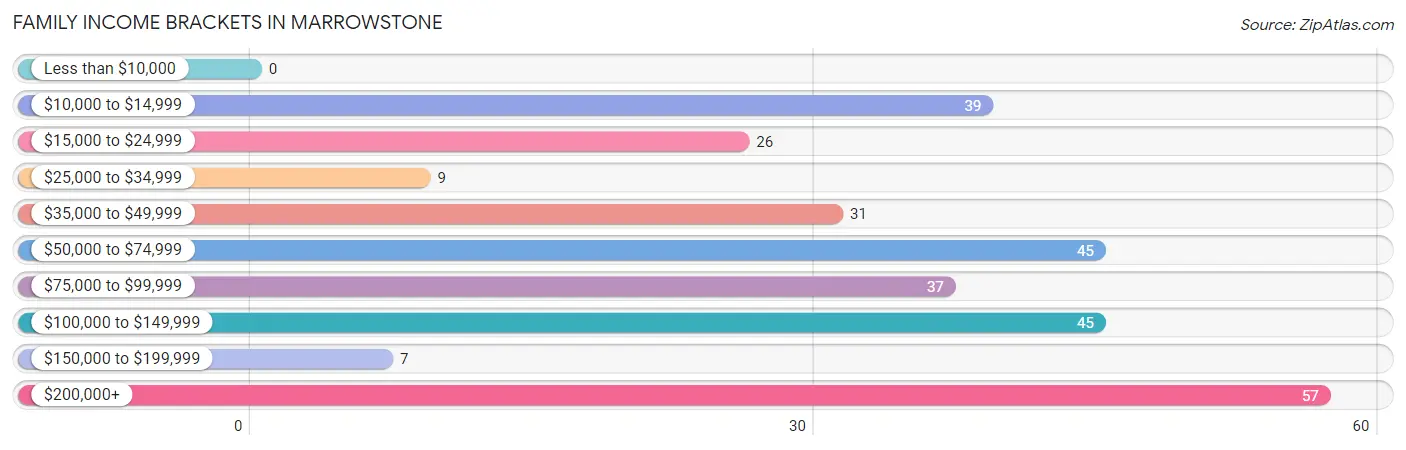
| Income Bracket | # Families | % Families |
| Less than $10,000 | 0 | 0.0% |
| $10,000 to $14,999 | 39 | 13.2% |
| $15,000 to $24,999 | 26 | 8.8% |
| $25,000 to $34,999 | 9 | 3.0% |
| $35,000 to $49,999 | 31 | 10.5% |
| $50,000 to $74,999 | 45 | 15.2% |
| $75,000 to $99,999 | 37 | 12.5% |
| $100,000 to $149,999 | 45 | 15.2% |
| $150,000 to $199,999 | 7 | 2.4% |
| $200,000+ | 57 | 19.3% |
Family Income by Famaliy Size in Marrowstone
2-person families (268 | 90.5%) account for the highest median family income in Marrowstone with $64,853 per family, while 2-person families (268 | 90.5%) have the highest median income of $32,426 per family member.
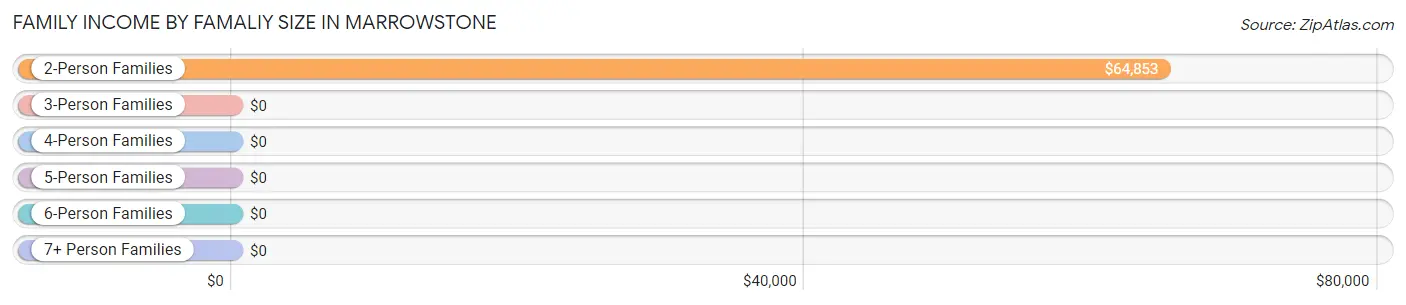
| Income Bracket | # Families | Median Income |
| 2-Person Families | 268 (90.5%) | $64,853 |
| 3-Person Families | 0 (0.0%) | $0 |
| 4-Person Families | 22 (7.4%) | $0 |
| 5-Person Families | 6 (2.0%) | $0 |
| 6-Person Families | 0 (0.0%) | $0 |
| 7+ Person Families | 0 (0.0%) | $0 |
| Total | 296 (100.0%) | $71,786 |
Family Income by Number of Earners in Marrowstone
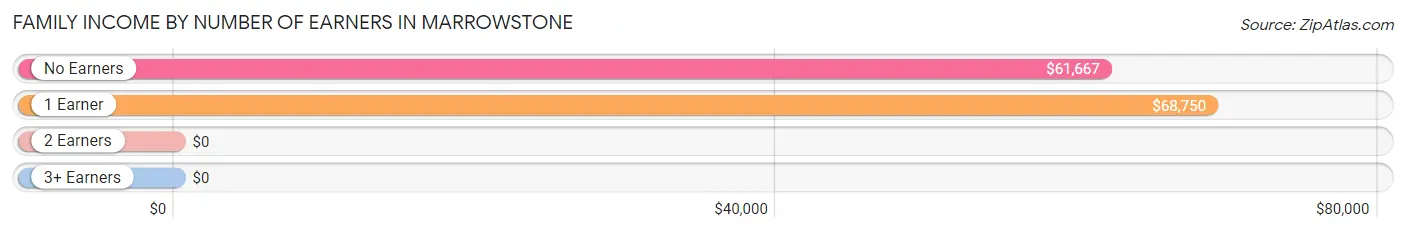
| Number of Earners | # Families | Median Income |
| No Earners | 94 (31.8%) | $61,667 |
| 1 Earner | 100 (33.8%) | $68,750 |
| 2 Earners | 102 (34.5%) | $0 |
| 3+ Earners | 0 (0.0%) | $0 |
| Total | 296 (100.0%) | $71,786 |
Household Income in Marrowstone
Household Income Brackets in Marrowstone
With 64 households falling in the category, the $75,000 to $99,999 income range is the most frequent in Marrowstone, accounting for 14.4% of all households. In contrast, only 20 households (4.5%) fall into the $25,000 to $34,999 income bracket, making it the least populous group.
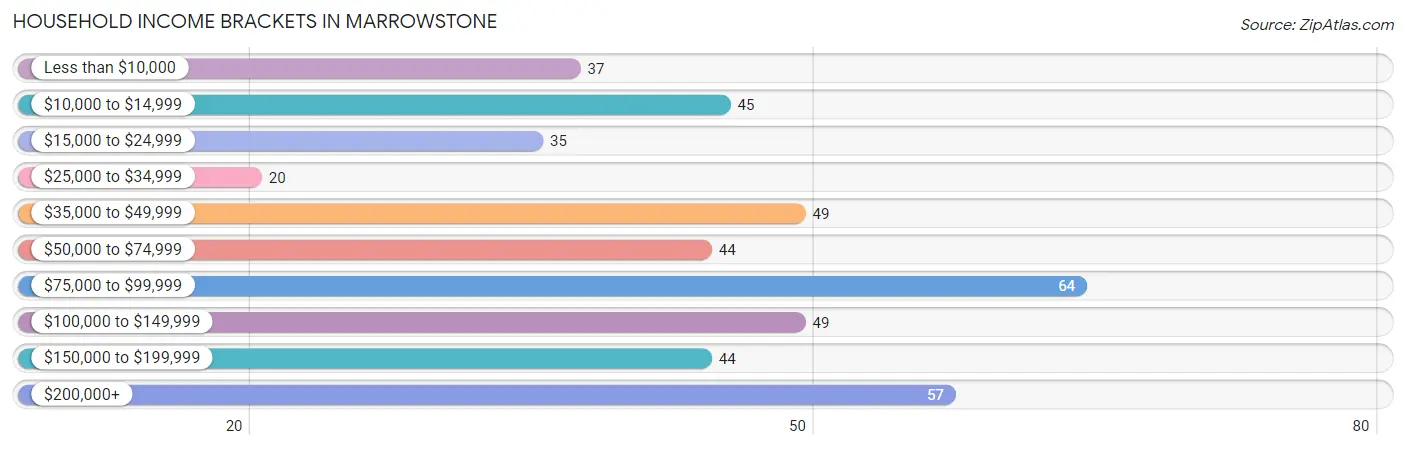
| Income Bracket | # Households | % Households |
| Less than $10,000 | 37 | 8.3% |
| $10,000 to $14,999 | 45 | 10.1% |
| $15,000 to $24,999 | 35 | 7.9% |
| $25,000 to $34,999 | 20 | 4.5% |
| $35,000 to $49,999 | 49 | 11.0% |
| $50,000 to $74,999 | 44 | 9.9% |
| $75,000 to $99,999 | 64 | 14.4% |
| $100,000 to $149,999 | 49 | 11.0% |
| $150,000 to $199,999 | 44 | 9.9% |
| $200,000+ | 57 | 12.8% |
Household Income by Householder Age in Marrowstone
The median household income in Marrowstone is $71,389, with the highest median household income of $81,111 found in the 45 to 64 years age bracket for the primary householder. A total of 212 households (47.7%) fall into this category.
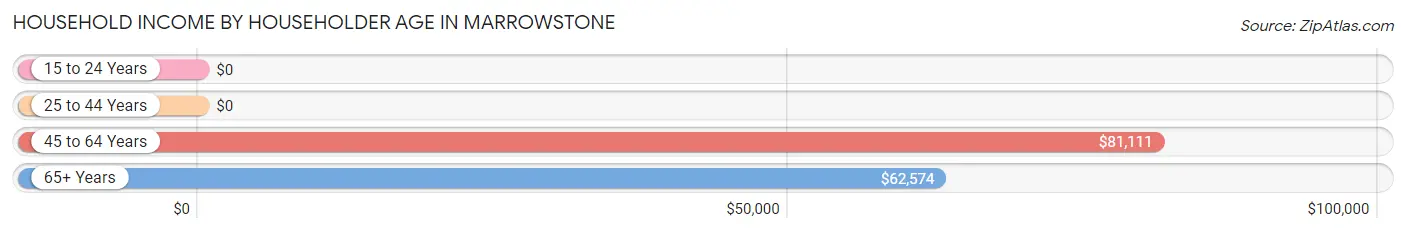
| Income Bracket | # Households | Median Income |
| 15 to 24 Years | 0 (0.0%) | $0 |
| 25 to 44 Years | 39 (8.8%) | $0 |
| 45 to 64 Years | 212 (47.7%) | $81,111 |
| 65+ Years | 193 (43.5%) | $62,574 |
| Total | 444 (100.0%) | $71,389 |
Poverty in Marrowstone
Income Below Poverty by Sex and Age in Marrowstone
With 24.5% poverty level for males and 17.3% for females among the residents of Marrowstone, 55 to 64 year old males and 65 to 74 year old females are the most vulnerable to poverty, with 67 males (53.6%) and 39 females (26.0%) in their respective age groups living below the poverty level.
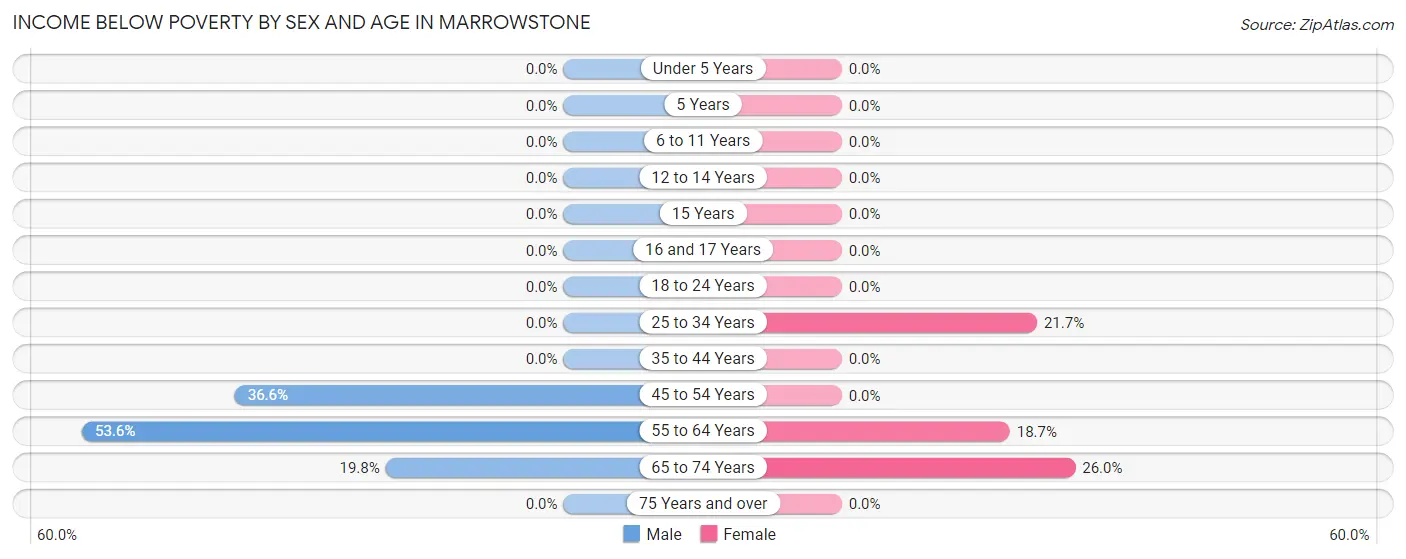
| Age Bracket | Male | Female |
| Under 5 Years | 0 (0.0%) | 0 (0.0%) |
| 5 Years | 0 (0.0%) | 0 (0.0%) |
| 6 to 11 Years | 0 (0.0%) | 0 (0.0%) |
| 12 to 14 Years | 0 (0.0%) | 0 (0.0%) |
| 15 Years | 0 (0.0%) | 0 (0.0%) |
| 16 and 17 Years | 0 (0.0%) | 0 (0.0%) |
| 18 to 24 Years | 0 (0.0%) | 0 (0.0%) |
| 25 to 34 Years | 0 (0.0%) | 5 (21.7%) |
| 35 to 44 Years | 0 (0.0%) | 0 (0.0%) |
| 45 to 54 Years | 30 (36.6%) | 0 (0.0%) |
| 55 to 64 Years | 67 (53.6%) | 26 (18.7%) |
| 65 to 74 Years | 20 (19.8%) | 39 (26.0%) |
| 75 Years and over | 0 (0.0%) | 0 (0.0%) |
| Total | 117 (24.5%) | 70 (17.3%) |
Income Above Poverty by Sex and Age in Marrowstone
According to the poverty statistics in Marrowstone, males aged 5 years and females aged 15 years are the age groups that are most secure financially, with 100.0% of males and 100.0% of females in these age groups living above the poverty line.
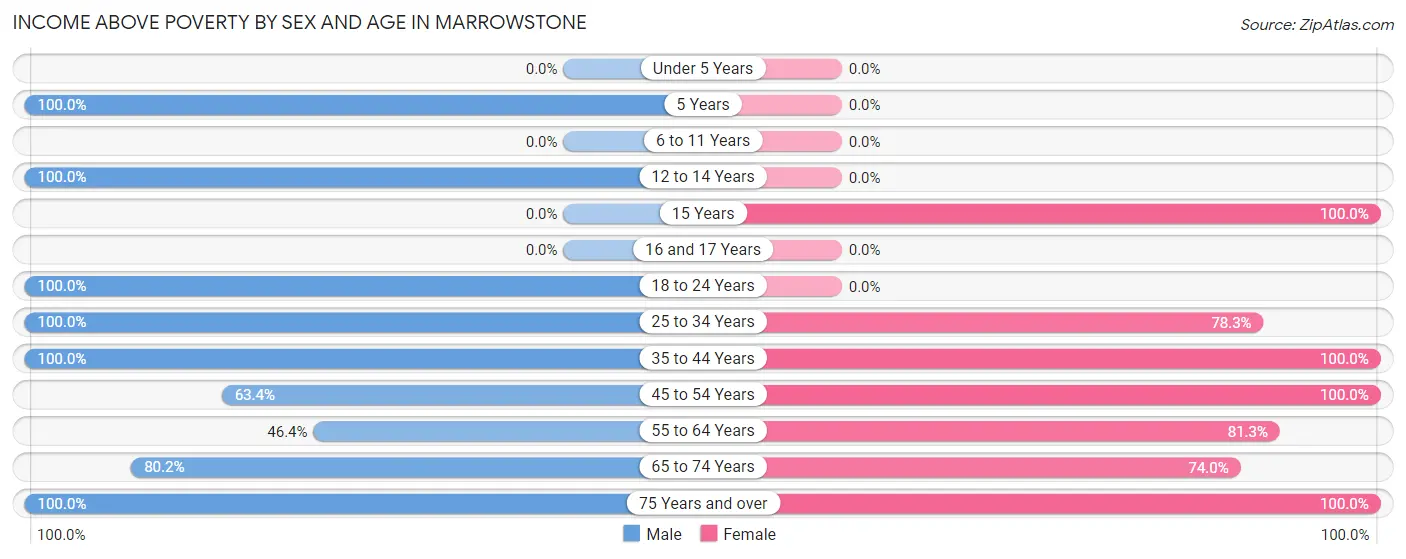
| Age Bracket | Male | Female |
| Under 5 Years | 0 (0.0%) | 0 (0.0%) |
| 5 Years | 11 (100.0%) | 0 (0.0%) |
| 6 to 11 Years | 0 (0.0%) | 0 (0.0%) |
| 12 to 14 Years | 39 (100.0%) | 0 (0.0%) |
| 15 Years | 0 (0.0%) | 16 (100.0%) |
| 16 and 17 Years | 0 (0.0%) | 0 (0.0%) |
| 18 to 24 Years | 21 (100.0%) | 0 (0.0%) |
| 25 to 34 Years | 16 (100.0%) | 18 (78.3%) |
| 35 to 44 Years | 28 (100.0%) | 8 (100.0%) |
| 45 to 54 Years | 52 (63.4%) | 45 (100.0%) |
| 55 to 64 Years | 58 (46.4%) | 113 (81.3%) |
| 65 to 74 Years | 81 (80.2%) | 111 (74.0%) |
| 75 Years and over | 54 (100.0%) | 24 (100.0%) |
| Total | 360 (75.5%) | 335 (82.7%) |
Income Below Poverty Among Married-Couple Families in Marrowstone
The poverty statistics for married-couple families in Marrowstone show that 23.2% or 65 of the total 280 families live below the poverty line. Families with no children have the highest poverty rate of 25.2%, comprising of 65 families. On the other hand, families with 1 or 2 children have the lowest poverty rate of 0.0%, which includes 0 families.
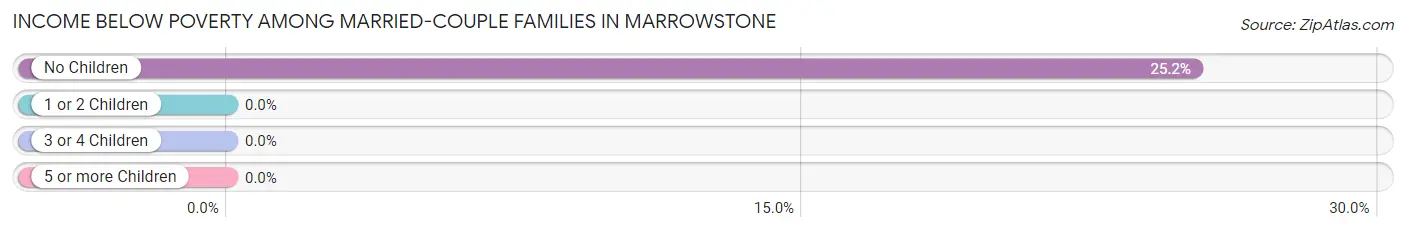
| Children | Above Poverty | Below Poverty |
| No Children | 193 (74.8%) | 65 (25.2%) |
| 1 or 2 Children | 22 (100.0%) | 0 (0.0%) |
| 3 or 4 Children | 0 (0.0%) | 0 (0.0%) |
| 5 or more Children | 0 (0.0%) | 0 (0.0%) |
| Total | 215 (76.8%) | 65 (23.2%) |
Income Below Poverty Among Single-Parent Households in Marrowstone
| Children | Single Father | Single Mother |
| No Children | 0 (0.0%) | 0 (0.0%) |
| 1 or 2 Children | 0 (0.0%) | 0 (0.0%) |
| 3 or 4 Children | 0 (0.0%) | 0 (0.0%) |
| 5 or more Children | 0 (0.0%) | 0 (0.0%) |
| Total | 0 (0.0%) | 0 (0.0%) |
Income Below Poverty Among Married-Couple vs Single-Parent Households in Marrowstone
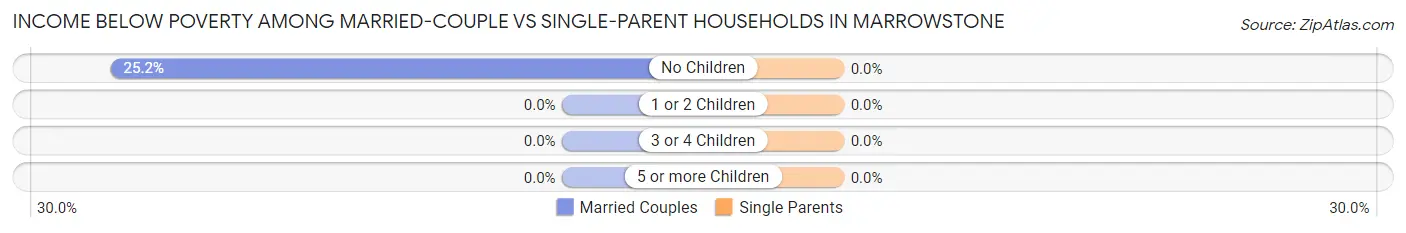
| Children | Married-Couple Families | Single-Parent Households |
| No Children | 65 (25.2%) | 0 (0.0%) |
| 1 or 2 Children | 0 (0.0%) | 0 (0.0%) |
| 3 or 4 Children | 0 (0.0%) | 0 (0.0%) |
| 5 or more Children | 0 (0.0%) | 0 (0.0%) |
| Total | 65 (23.2%) | 0 (0.0%) |
Race in Marrowstone
The most populous races in Marrowstone are White / Caucasian (863 | 97.9%), Hispanic or Latino (10 | 1.1%), and Two or more Races (10 | 1.1%).
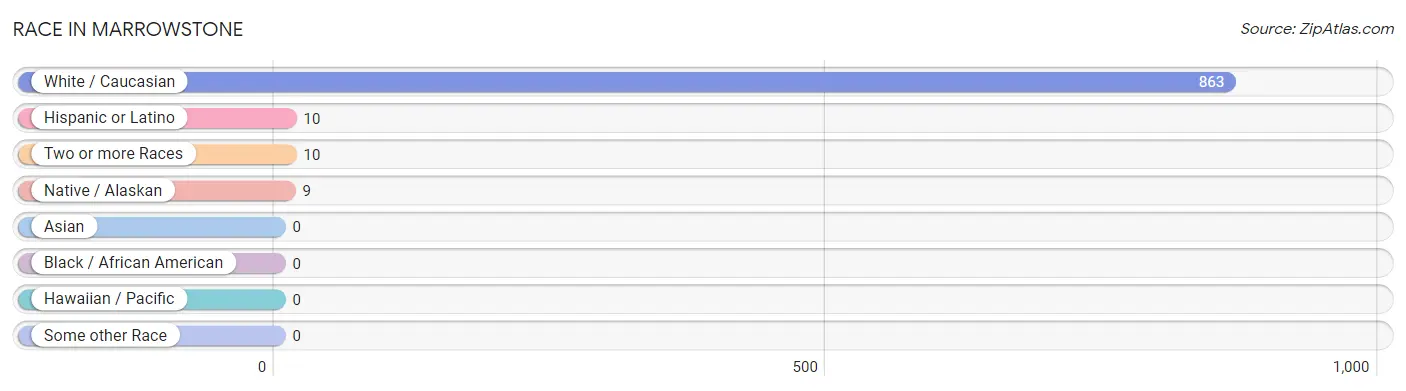
| Race | # Population | % Population |
| Asian | 0 | 0.0% |
| Black / African American | 0 | 0.0% |
| Hawaiian / Pacific | 0 | 0.0% |
| Hispanic or Latino | 10 | 1.1% |
| Native / Alaskan | 9 | 1.0% |
| White / Caucasian | 863 | 97.9% |
| Two or more Races | 10 | 1.1% |
| Some other Race | 0 | 0.0% |
| Total | 882 | 100.0% |
Ancestry in Marrowstone
The most populous ancestries reported in Marrowstone are German (236 | 26.8%), English (114 | 12.9%), Swedish (86 | 9.8%), Danish (82 | 9.3%), and Irish (65 | 7.4%), together accounting for 66.1% of all Marrowstone residents.
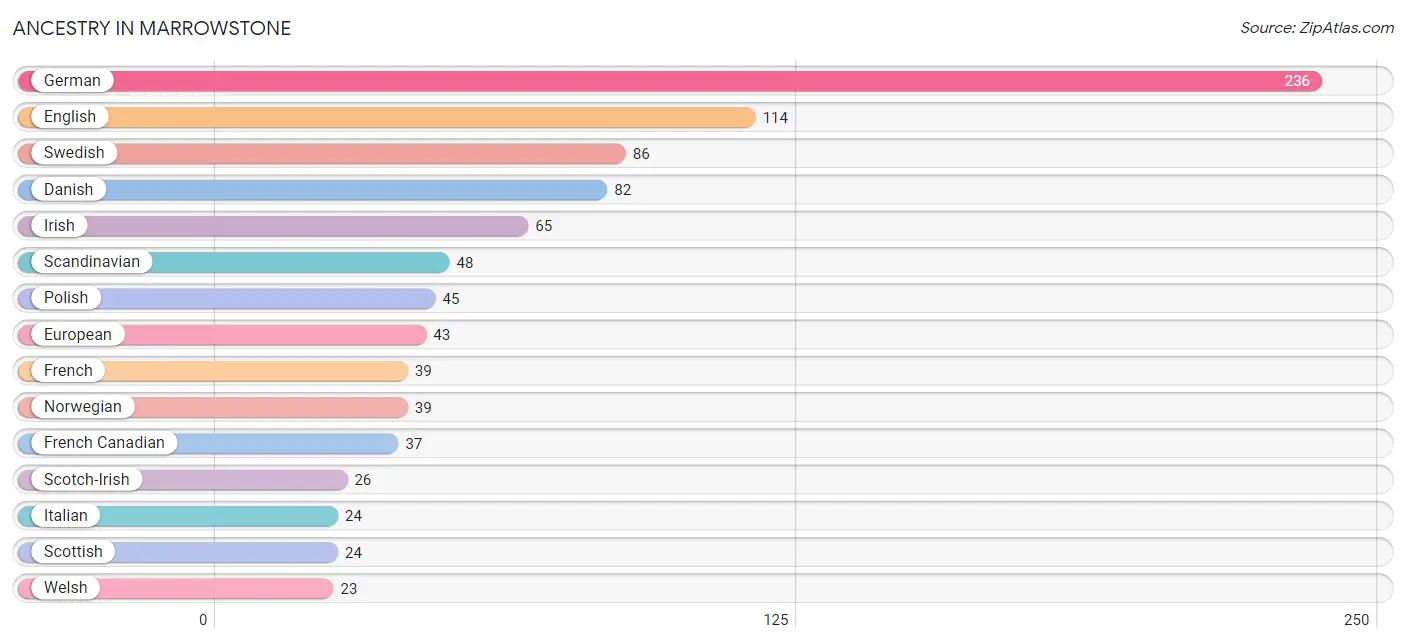
| Ancestry | # Population | % Population |
| American | 16 | 1.8% |
| Belgian | 18 | 2.0% |
| British | 16 | 1.8% |
| Canadian | 8 | 0.9% |
| Danish | 82 | 9.3% |
| Dutch | 21 | 2.4% |
| English | 114 | 12.9% |
| European | 43 | 4.9% |
| Finnish | 8 | 0.9% |
| French | 39 | 4.4% |
| French Canadian | 37 | 4.2% |
| German | 236 | 26.8% |
| Hungarian | 16 | 1.8% |
| Irish | 65 | 7.4% |
| Italian | 24 | 2.7% |
| Mexican | 10 | 1.1% |
| Navajo | 10 | 1.1% |
| Northern European | 7 | 0.8% |
| Norwegian | 39 | 4.4% |
| Polish | 45 | 5.1% |
| Russian | 11 | 1.3% |
| Scandinavian | 48 | 5.4% |
| Scotch-Irish | 26 | 2.9% |
| Scottish | 24 | 2.7% |
| Slovak | 5 | 0.6% |
| Swedish | 86 | 9.8% |
| Welsh | 23 | 2.6% | View All 27 Rows |
Immigrants in Marrowstone
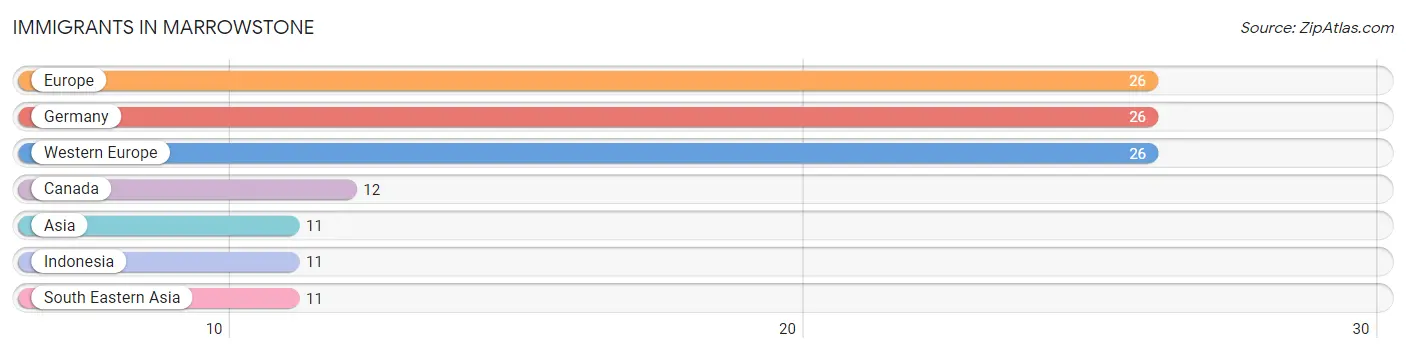
The most numerous immigrant groups reported in Marrowstone came from Europe (26 | 2.9%), Germany (26 | 2.9%), Western Europe (26 | 2.9%), Canada (12 | 1.4%), and Asia (11 | 1.3%), together accounting for 11.5% of all Marrowstone residents.
| Immigration Origin | # Population | % Population |
| Asia | 11 | 1.3% |
| Canada | 12 | 1.4% |
| Europe | 26 | 2.9% |
| Germany | 26 | 2.9% |
| Indonesia | 11 | 1.3% |
| South Eastern Asia | 11 | 1.3% |
| Western Europe | 26 | 2.9% | View All 7 Rows |
Sex and Age in Marrowstone
Sex and Age in Marrowstone
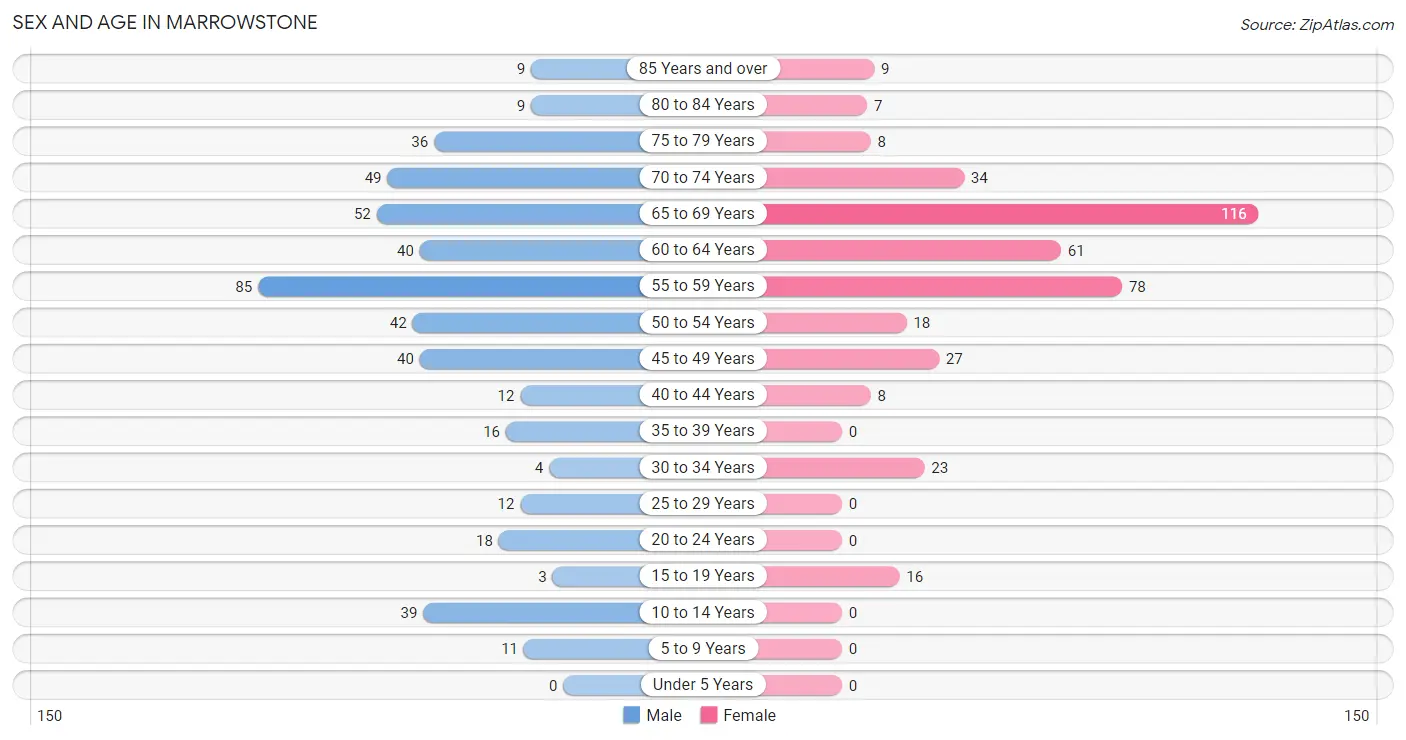
The most populous age groups in Marrowstone are 55 to 59 Years (85 | 17.8%) for men and 65 to 69 Years (116 | 28.6%) for women.
| Age Bracket | Male | Female |
| Under 5 Years | 0 (0.0%) | 0 (0.0%) |
| 5 to 9 Years | 11 (2.3%) | 0 (0.0%) |
| 10 to 14 Years | 39 (8.2%) | 0 (0.0%) |
| 15 to 19 Years | 3 (0.6%) | 16 (4.0%) |
| 20 to 24 Years | 18 (3.8%) | 0 (0.0%) |
| 25 to 29 Years | 12 (2.5%) | 0 (0.0%) |
| 30 to 34 Years | 4 (0.8%) | 23 (5.7%) |
| 35 to 39 Years | 16 (3.4%) | 0 (0.0%) |
| 40 to 44 Years | 12 (2.5%) | 8 (2.0%) |
| 45 to 49 Years | 40 (8.4%) | 27 (6.7%) |
| 50 to 54 Years | 42 (8.8%) | 18 (4.4%) |
| 55 to 59 Years | 85 (17.8%) | 78 (19.3%) |
| 60 to 64 Years | 40 (8.4%) | 61 (15.1%) |
| 65 to 69 Years | 52 (10.9%) | 116 (28.6%) |
| 70 to 74 Years | 49 (10.3%) | 34 (8.4%) |
| 75 to 79 Years | 36 (7.5%) | 8 (2.0%) |
| 80 to 84 Years | 9 (1.9%) | 7 (1.7%) |
| 85 Years and over | 9 (1.9%) | 9 (2.2%) |
| Total | 477 (100.0%) | 405 (100.0%) |
Families and Households in Marrowstone
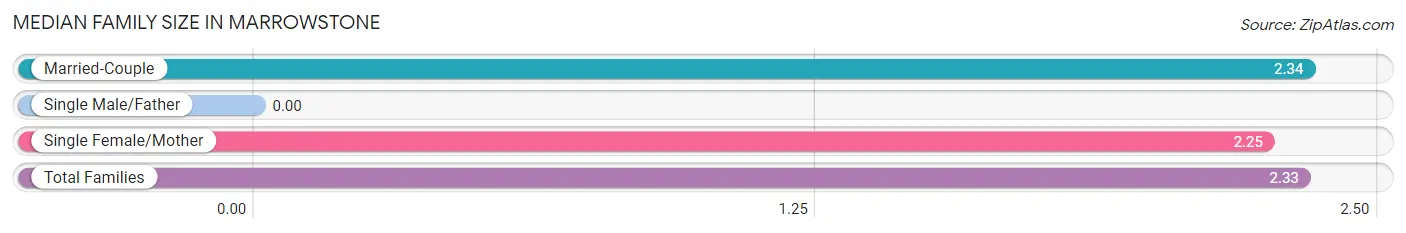
Median Family Size in Marrowstone
| Family Type | # Families | Family Size |
| Married-Couple | 280 (94.6%) | 2.34 |
| Single Male/Father | 0 (0.0%) | - |
| Single Female/Mother | 16 (5.4%) | 2.25 |
| Total Families | 296 (100.0%) | 2.33 |
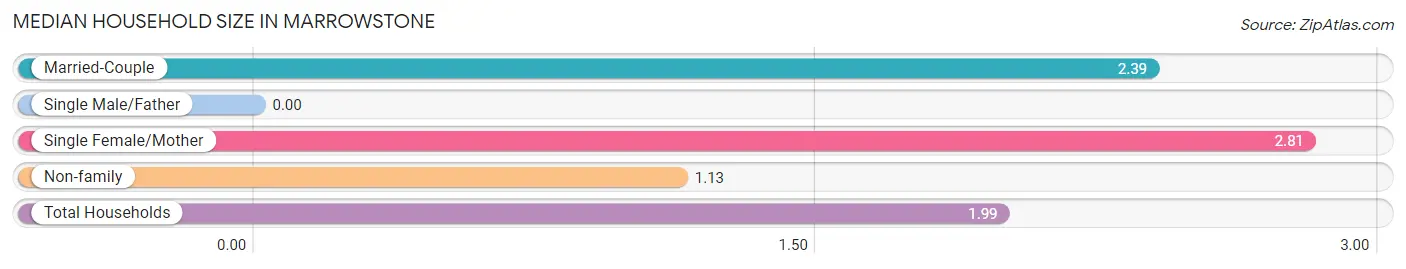
Median Household Size in Marrowstone
| Household Type | # Households | Household Size |
| Married-Couple | 280 (63.1%) | 2.39 |
| Single Male/Father | 0 (0.0%) | - |
| Single Female/Mother | 16 (3.6%) | 2.81 |
| Non-family | 148 (33.3%) | 1.13 |
| Total Households | 444 (100.0%) | 1.99 |
Household Size by Marriage Status in Marrowstone
Out of a total of 444 households in Marrowstone, 296 (66.7%) are family households, while 148 (33.3%) are nonfamily households. The most numerous type of family households are 2-person households, comprising 256, and the most common type of nonfamily households are 1-person households, comprising 132.
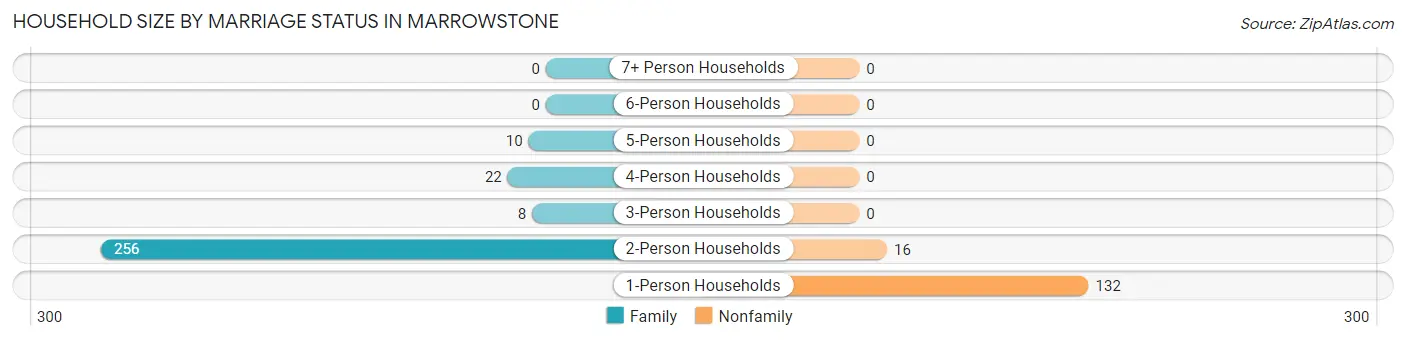
| Household Size | Family Households | Nonfamily Households |
| 1-Person Households | - | 132 (29.7%) |
| 2-Person Households | 256 (57.7%) | 16 (3.6%) |
| 3-Person Households | 8 (1.8%) | 0 (0.0%) |
| 4-Person Households | 22 (5.0%) | 0 (0.0%) |
| 5-Person Households | 10 (2.2%) | 0 (0.0%) |
| 6-Person Households | 0 (0.0%) | 0 (0.0%) |
| 7+ Person Households | 0 (0.0%) | 0 (0.0%) |
| Total | 296 (66.7%) | 148 (33.3%) |
Female Fertility in Marrowstone
Fertility by Age in Marrowstone
| Age Bracket | Women with Births | Births / 1,000 Women |
| 15 to 19 years | 0 (0.0%) | 0.0 |
| 20 to 34 years | 0 (0.0%) | 0.0 |
| 35 to 50 years | 0 (0.0%) | 0.0 |
| Total | 0 (0.0%) | 0.0 |
Fertility by Age by Marriage Status in Marrowstone
| Age Bracket | Married | Unmarried |
| 15 to 19 years | 0 (0.0%) | 0 (0.0%) |
| 20 to 34 years | 0 (0.0%) | 0 (0.0%) |
| 35 to 50 years | 0 (0.0%) | 0 (0.0%) |
| Total | 0 (0.0%) | 0 (0.0%) |
Fertility by Education in Marrowstone
| Educational Attainment | Women with Births | Births / 1,000 Women |
| Less than High School | 0 (0.0%) | 0.0 |
| High School Diploma | 0 (0.0%) | 0.0 |
| College or Associate's Degree | 0 (0.0%) | 0.0 |
| Bachelor's Degree | 0 (0.0%) | 0.0 |
| Graduate Degree | 0 (0.0%) | 0.0 |
| Total | 0 (0.0%) | 0.0 |
Fertility by Education by Marriage Status in Marrowstone
| Educational Attainment | Married | Unmarried |
| Less than High School | 0 (0.0%) | 0 (0.0%) |
| High School Diploma | 0 (0.0%) | 0 (0.0%) |
| College or Associate's Degree | 0 (0.0%) | 0 (0.0%) |
| Bachelor's Degree | 0 (0.0%) | 0 (0.0%) |
| Graduate Degree | 0 (0.0%) | 0 (0.0%) |
| Total | 0 (0.0%) | 0 (0.0%) |
Employment Characteristics in Marrowstone
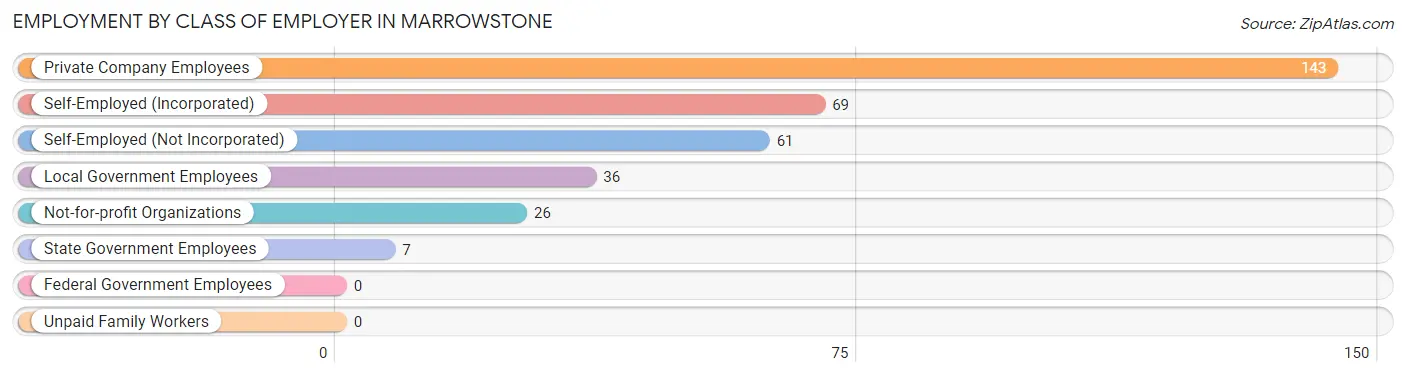
Employment by Class of Employer in Marrowstone
Among the 342 employed individuals in Marrowstone, private company employees (143 | 41.8%), self-employed (incorporated) (69 | 20.2%), and self-employed (not incorporated) (61 | 17.8%) make up the most common classes of employment.
| Employer Class | # Employees | % Employees |
| Private Company Employees | 143 | 41.8% |
| Self-Employed (Incorporated) | 69 | 20.2% |
| Self-Employed (Not Incorporated) | 61 | 17.8% |
| Not-for-profit Organizations | 26 | 7.6% |
| Local Government Employees | 36 | 10.5% |
| State Government Employees | 7 | 2.1% |
| Federal Government Employees | 0 | 0.0% |
| Unpaid Family Workers | 0 | 0.0% |
| Total | 342 | 100.0% |
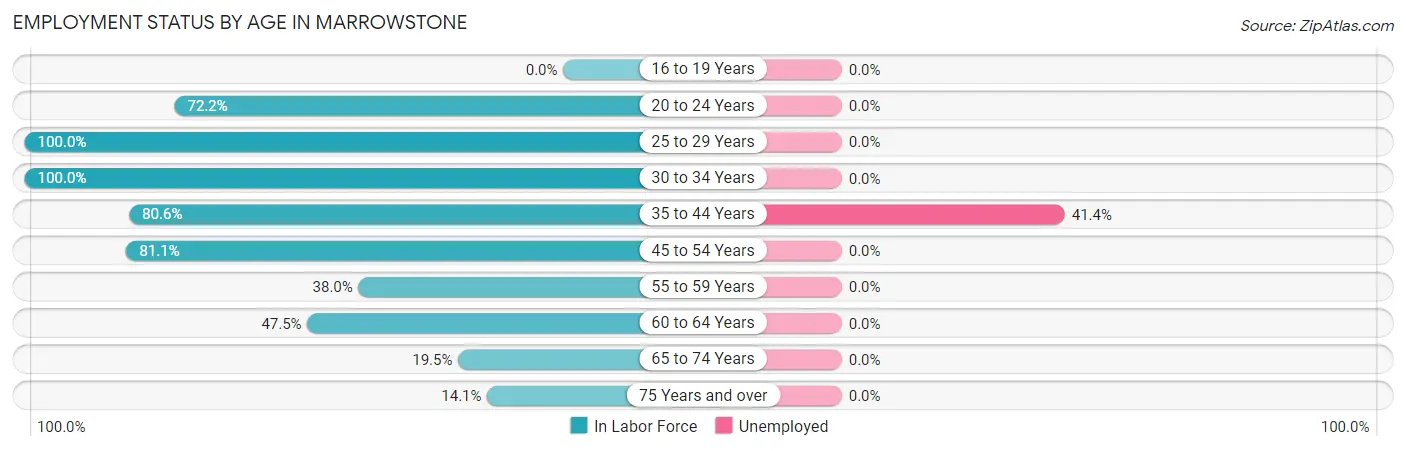
Employment Status by Age in Marrowstone
According to the labor force statistics for Marrowstone, out of the total population over 16 years of age (816), 43.4% or 354 individuals are in the labor force, with 3.4% or 12 of them unemployed. The age group with the highest labor force participation rate is 25 to 29 years, with 100.0% or 12 individuals in the labor force. Within the labor force, the 35 to 44 years age range has the highest percentage of unemployed individuals, with 41.4% or 12 of them being unemployed.
| Age Bracket | In Labor Force | Unemployed |
| 16 to 19 Years | 0 (0.0%) | 0 (0.0%) |
| 20 to 24 Years | 13 (72.2%) | 0 (0.0%) |
| 25 to 29 Years | 12 (100.0%) | 0 (0.0%) |
| 30 to 34 Years | 27 (100.0%) | 0 (0.0%) |
| 35 to 44 Years | 29 (80.6%) | 12 (41.4%) |
| 45 to 54 Years | 103 (81.1%) | 0 (0.0%) |
| 55 to 59 Years | 62 (38.0%) | 0 (0.0%) |
| 60 to 64 Years | 48 (47.5%) | 0 (0.0%) |
| 65 to 74 Years | 49 (19.5%) | 0 (0.0%) |
| 75 Years and over | 11 (14.1%) | 0 (0.0%) |
| Total | 354 (43.4%) | 12 (3.4%) |
Employment Status by Educational Attainment in Marrowstone
According to labor force statistics for Marrowstone, 60.3% of individuals (281) out of the total population between 25 and 64 years of age (466) are in the labor force, with 4.3% or 12 of them being unemployed. The group with the highest labor force participation rate are those with the educational attainment of high school diploma, with 100.0% or 52 individuals in the labor force. Within the labor force, individuals with high school diploma education have the highest percentage of unemployment, with 23.1% or 12 of them being unemployed.
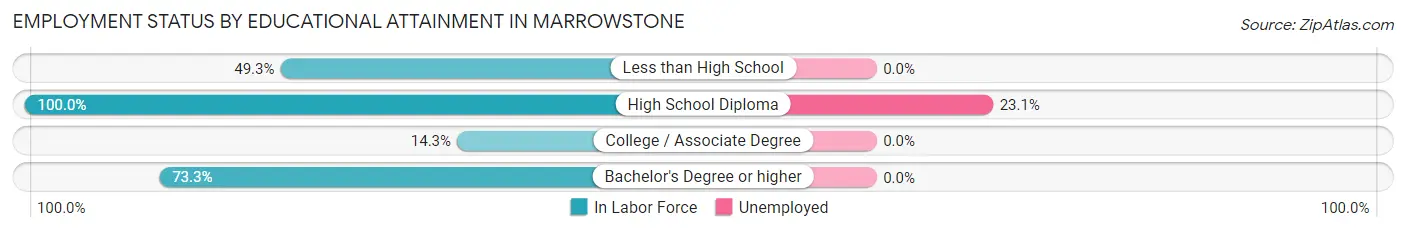
| Educational Attainment | In Labor Force | Unemployed |
| Less than High School | 34 (49.3%) | 0 (0.0%) |
| High School Diploma | 52 (100.0%) | 12 (23.1%) |
| College / Associate Degree | 14 (14.3%) | 0 (0.0%) |
| Bachelor's Degree or higher | 181 (73.3%) | 0 (0.0%) |
| Total | 281 (60.3%) | 20 (4.3%) |
Employment Occupations by Sex in Marrowstone
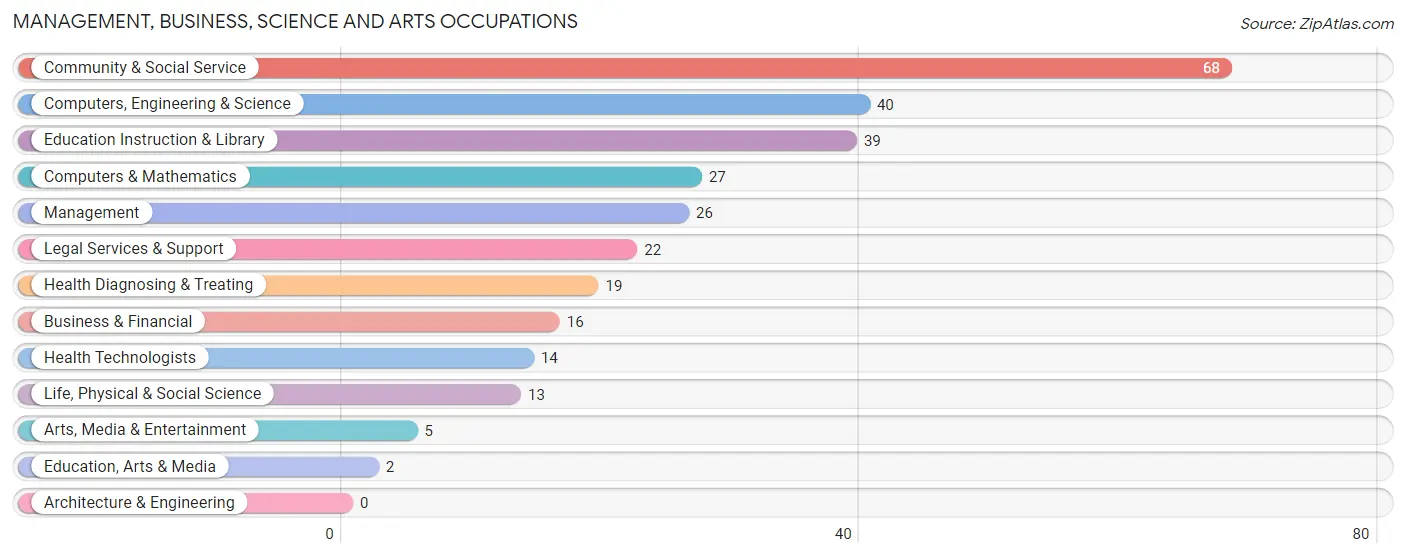
Management, Business, Science and Arts Occupations
The most common Management, Business, Science and Arts occupations in Marrowstone are Community & Social Service (68 | 19.9%), Computers, Engineering & Science (40 | 11.7%), Education Instruction & Library (39 | 11.4%), Computers & Mathematics (27 | 7.9%), and Management (26 | 7.6%).
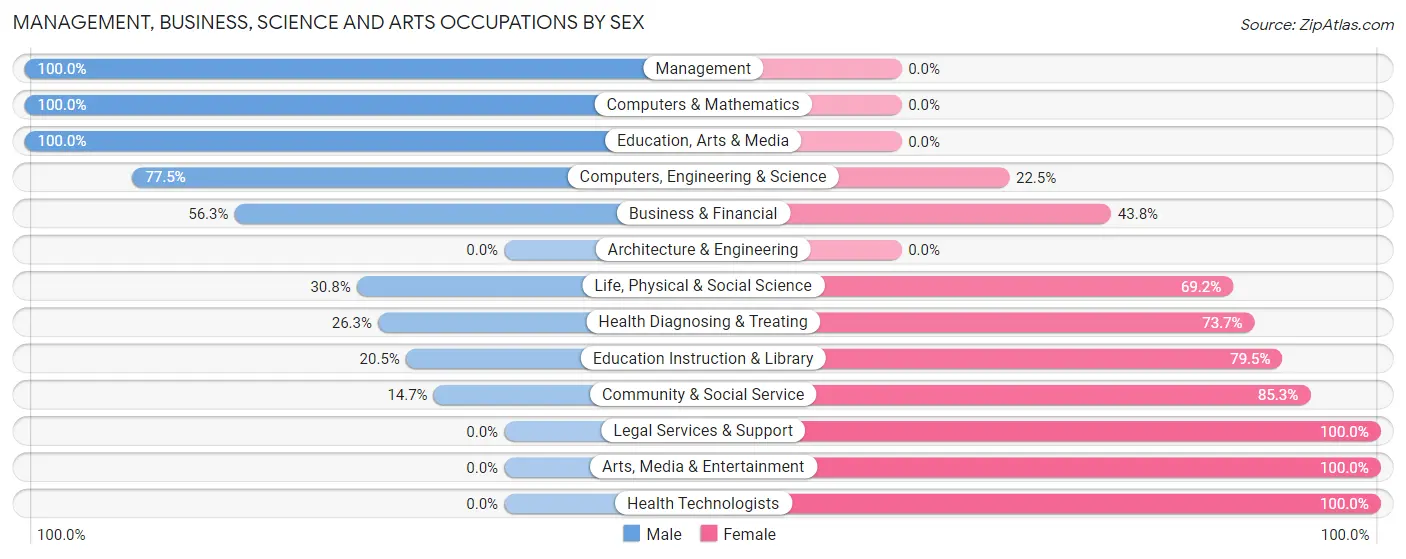
Management, Business, Science and Arts Occupations by Sex
Within the Management, Business, Science and Arts occupations in Marrowstone, the most male-oriented occupations are Management (100.0%), Computers & Mathematics (100.0%), and Education, Arts & Media (100.0%), while the most female-oriented occupations are Legal Services & Support (100.0%), Arts, Media & Entertainment (100.0%), and Health Technologists (100.0%).
| Occupation | Male | Female |
| Management | 26 (100.0%) | 0 (0.0%) |
| Business & Financial | 9 (56.2%) | 7 (43.8%) |
| Computers, Engineering & Science | 31 (77.5%) | 9 (22.5%) |
| Computers & Mathematics | 27 (100.0%) | 0 (0.0%) |
| Architecture & Engineering | 0 (0.0%) | 0 (0.0%) |
| Life, Physical & Social Science | 4 (30.8%) | 9 (69.2%) |
| Community & Social Service | 10 (14.7%) | 58 (85.3%) |
| Education, Arts & Media | 2 (100.0%) | 0 (0.0%) |
| Legal Services & Support | 0 (0.0%) | 22 (100.0%) |
| Education Instruction & Library | 8 (20.5%) | 31 (79.5%) |
| Arts, Media & Entertainment | 0 (0.0%) | 5 (100.0%) |
| Health Diagnosing & Treating | 5 (26.3%) | 14 (73.7%) |
| Health Technologists | 0 (0.0%) | 14 (100.0%) |
| Total (Category) | 81 (47.9%) | 88 (52.1%) |
| Total (Overall) | 189 (55.3%) | 153 (44.7%) |
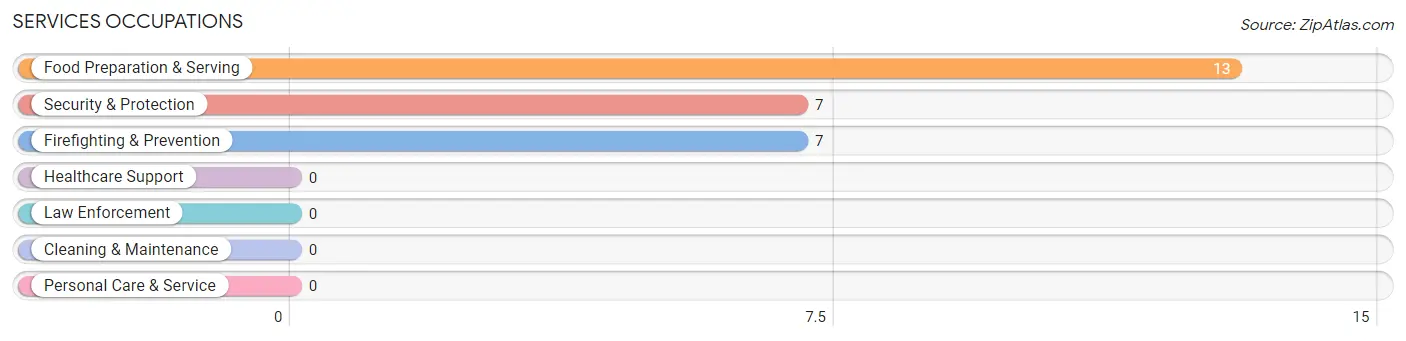
Services Occupations
The most common Services occupations in Marrowstone are Food Preparation & Serving (13 | 3.8%), Security & Protection (7 | 2.1%), and Firefighting & Prevention (7 | 2.1%).
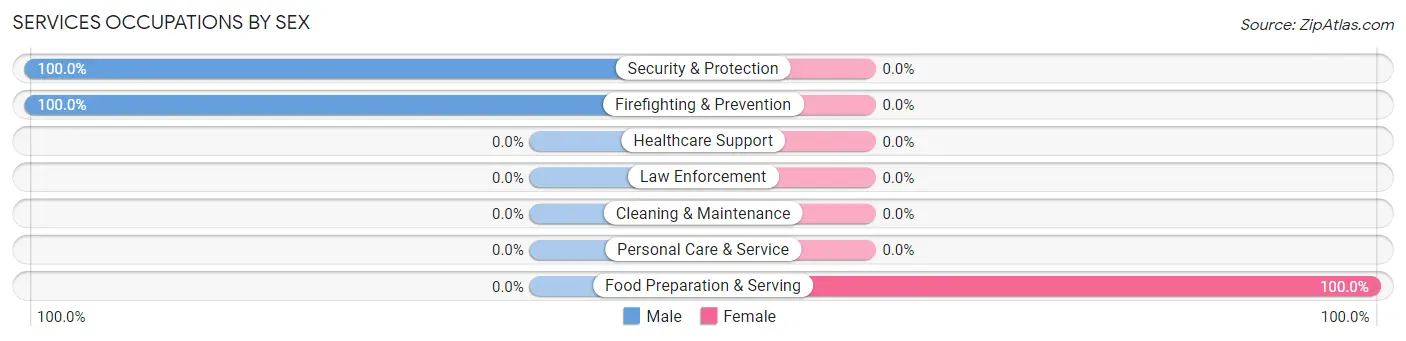
Services Occupations by Sex
| Occupation | Male | Female |
| Healthcare Support | 0 (0.0%) | 0 (0.0%) |
| Security & Protection | 7 (100.0%) | 0 (0.0%) |
| Firefighting & Prevention | 7 (100.0%) | 0 (0.0%) |
| Law Enforcement | 0 (0.0%) | 0 (0.0%) |
| Food Preparation & Serving | 0 (0.0%) | 13 (100.0%) |
| Cleaning & Maintenance | 0 (0.0%) | 0 (0.0%) |
| Personal Care & Service | 0 (0.0%) | 0 (0.0%) |
| Total (Category) | 7 (35.0%) | 13 (65.0%) |
| Total (Overall) | 189 (55.3%) | 153 (44.7%) |
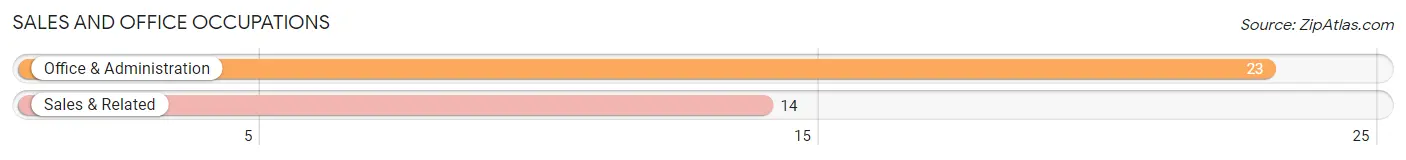
Sales and Office Occupations
The most common Sales and Office occupations in Marrowstone are Office & Administration (23 | 6.7%), and Sales & Related (14 | 4.1%).
Sales and Office Occupations by Sex
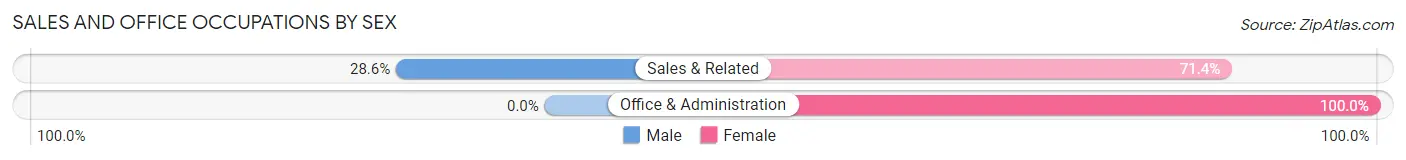
| Occupation | Male | Female |
| Sales & Related | 4 (28.6%) | 10 (71.4%) |
| Office & Administration | 0 (0.0%) | 23 (100.0%) |
| Total (Category) | 4 (10.8%) | 33 (89.2%) |
| Total (Overall) | 189 (55.3%) | 153 (44.7%) |
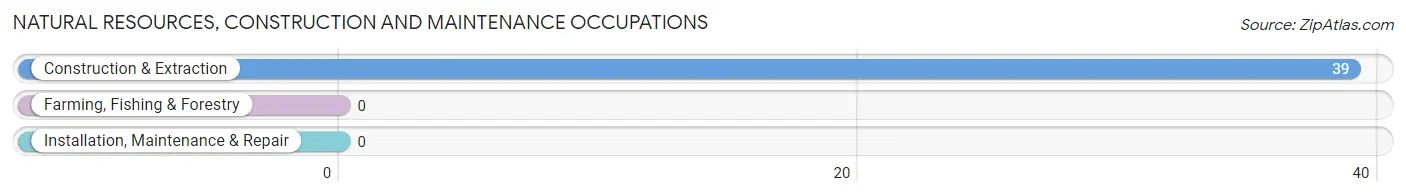
Natural Resources, Construction and Maintenance Occupations
The most common Natural Resources, Construction and Maintenance occupations in Marrowstone are , and Construction & Extraction (39 | 11.4%).
Natural Resources, Construction and Maintenance Occupations by Sex
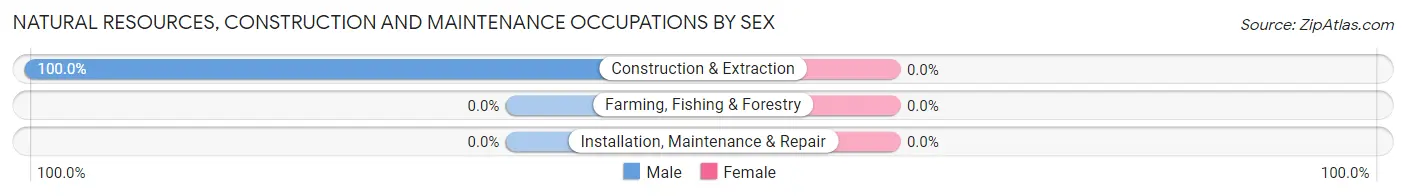
| Occupation | Male | Female |
| Farming, Fishing & Forestry | 0 (0.0%) | 0 (0.0%) |
| Construction & Extraction | 39 (100.0%) | 0 (0.0%) |
| Installation, Maintenance & Repair | 0 (0.0%) | 0 (0.0%) |
| Total (Category) | 39 (100.0%) | 0 (0.0%) |
| Total (Overall) | 189 (55.3%) | 153 (44.7%) |
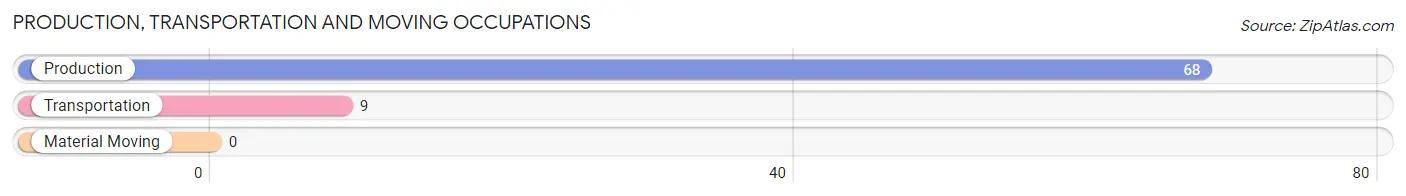
Production, Transportation and Moving Occupations
The most common Production, Transportation and Moving occupations in Marrowstone are Production (68 | 19.9%), and Transportation (9 | 2.6%).
Production, Transportation and Moving Occupations by Sex
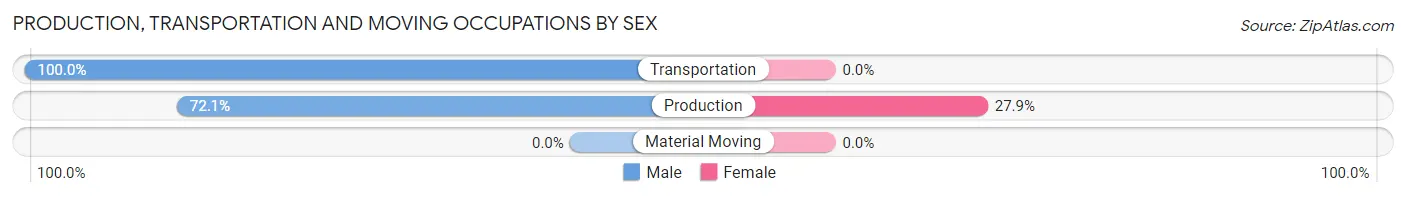
| Occupation | Male | Female |
| Production | 49 (72.1%) | 19 (27.9%) |
| Transportation | 9 (100.0%) | 0 (0.0%) |
| Material Moving | 0 (0.0%) | 0 (0.0%) |
| Total (Category) | 58 (75.3%) | 19 (24.7%) |
| Total (Overall) | 189 (55.3%) | 153 (44.7%) |
Employment Industries by Sex in Marrowstone
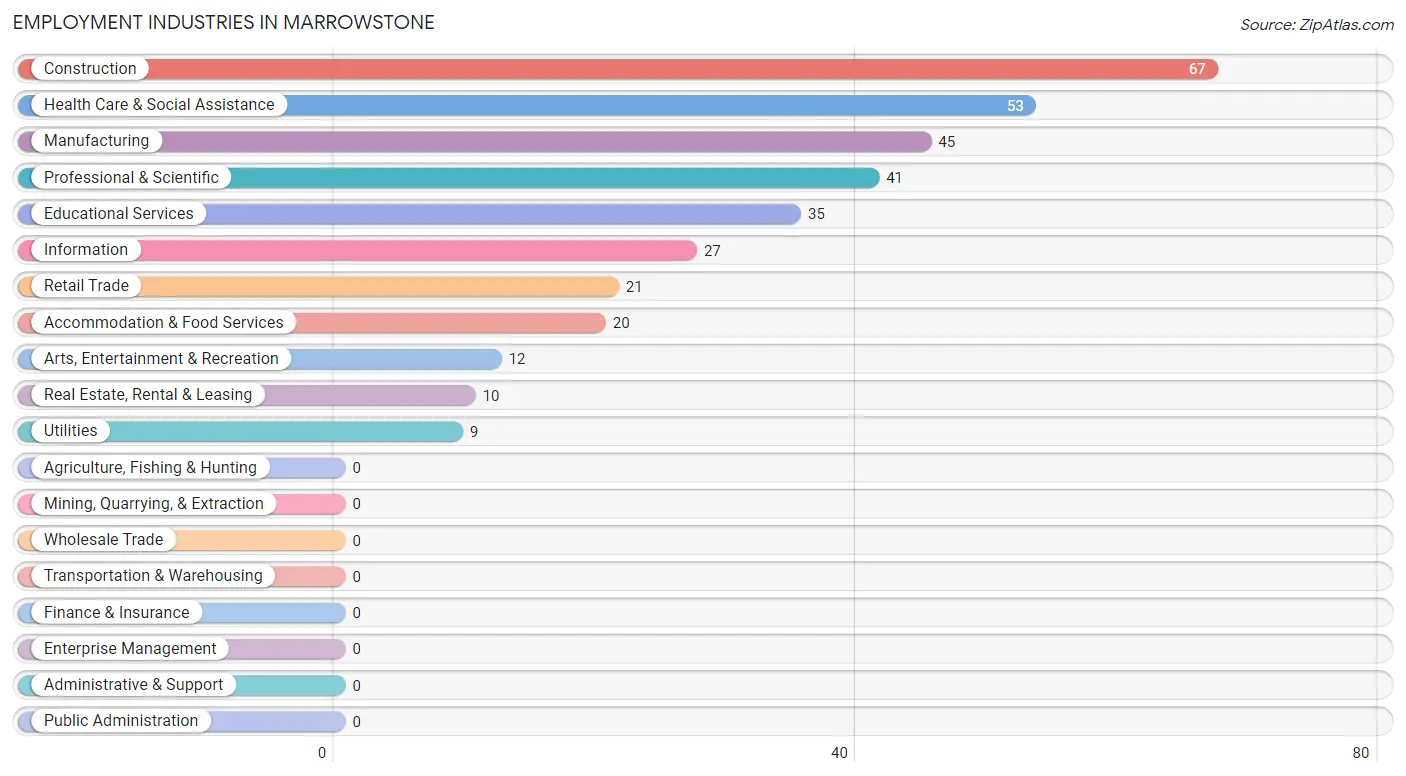
Employment Industries in Marrowstone
The major employment industries in Marrowstone include Construction (67 | 19.6%), Health Care & Social Assistance (53 | 15.5%), Manufacturing (45 | 13.2%), Professional & Scientific (41 | 12.0%), and Educational Services (35 | 10.2%).
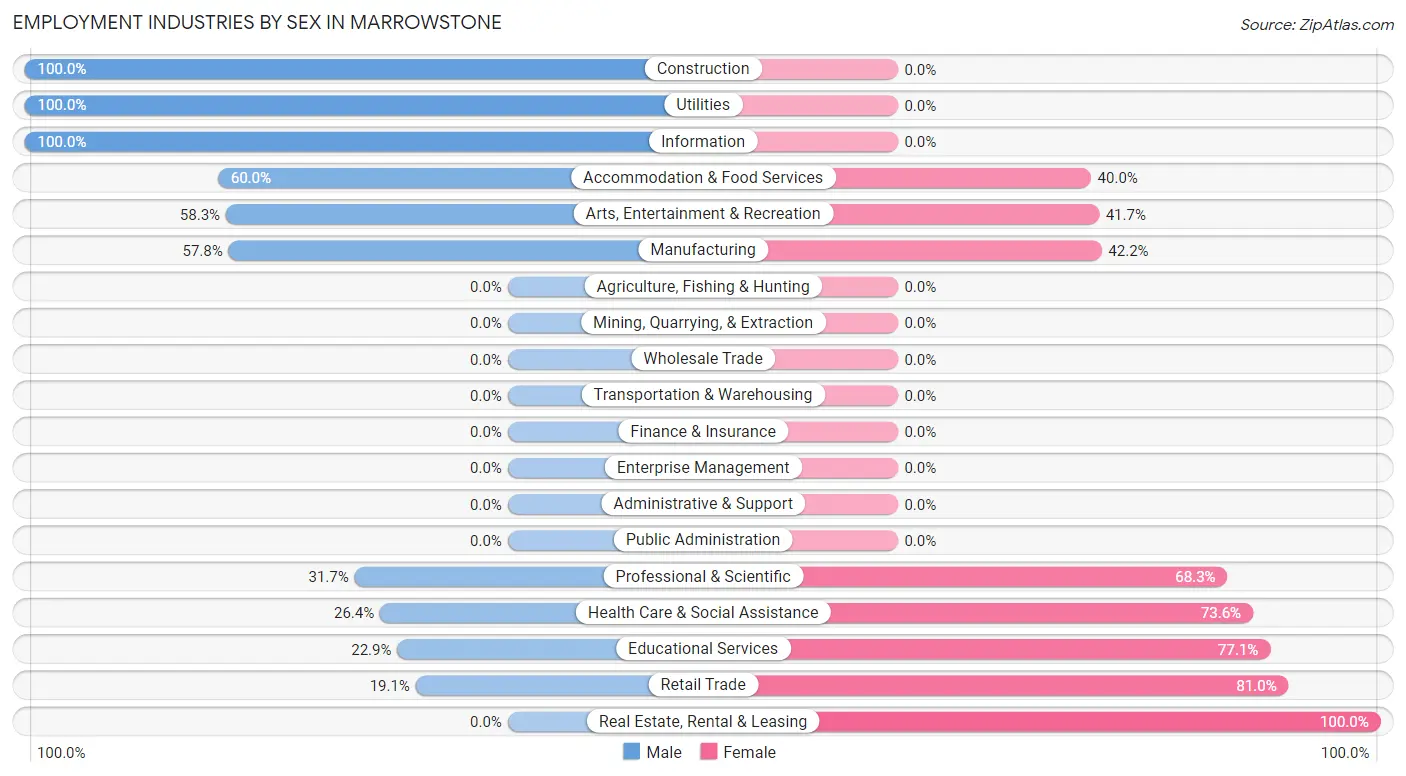
Employment Industries by Sex in Marrowstone
The Marrowstone industries that see more men than women are Construction (100.0%), Utilities (100.0%), and Information (100.0%), whereas the industries that tend to have a higher number of women are Real Estate, Rental & Leasing (100.0%), Retail Trade (80.9%), and Educational Services (77.1%).
| Industry | Male | Female |
| Agriculture, Fishing & Hunting | 0 (0.0%) | 0 (0.0%) |
| Mining, Quarrying, & Extraction | 0 (0.0%) | 0 (0.0%) |
| Construction | 67 (100.0%) | 0 (0.0%) |
| Manufacturing | 26 (57.8%) | 19 (42.2%) |
| Wholesale Trade | 0 (0.0%) | 0 (0.0%) |
| Retail Trade | 4 (19.1%) | 17 (80.9%) |
| Transportation & Warehousing | 0 (0.0%) | 0 (0.0%) |
| Utilities | 9 (100.0%) | 0 (0.0%) |
| Information | 27 (100.0%) | 0 (0.0%) |
| Finance & Insurance | 0 (0.0%) | 0 (0.0%) |
| Real Estate, Rental & Leasing | 0 (0.0%) | 10 (100.0%) |
| Professional & Scientific | 13 (31.7%) | 28 (68.3%) |
| Enterprise Management | 0 (0.0%) | 0 (0.0%) |
| Administrative & Support | 0 (0.0%) | 0 (0.0%) |
| Educational Services | 8 (22.9%) | 27 (77.1%) |
| Health Care & Social Assistance | 14 (26.4%) | 39 (73.6%) |
| Arts, Entertainment & Recreation | 7 (58.3%) | 5 (41.7%) |
| Accommodation & Food Services | 12 (60.0%) | 8 (40.0%) |
| Public Administration | 0 (0.0%) | 0 (0.0%) |
| Total | 189 (55.3%) | 153 (44.7%) |
Education in Marrowstone
School Enrollment in Marrowstone
The most common levels of schooling among the 91 students in Marrowstone are middle school (39 | 42.9%), college / undergraduate (18 | 19.8%), and high school (16 | 17.6%).
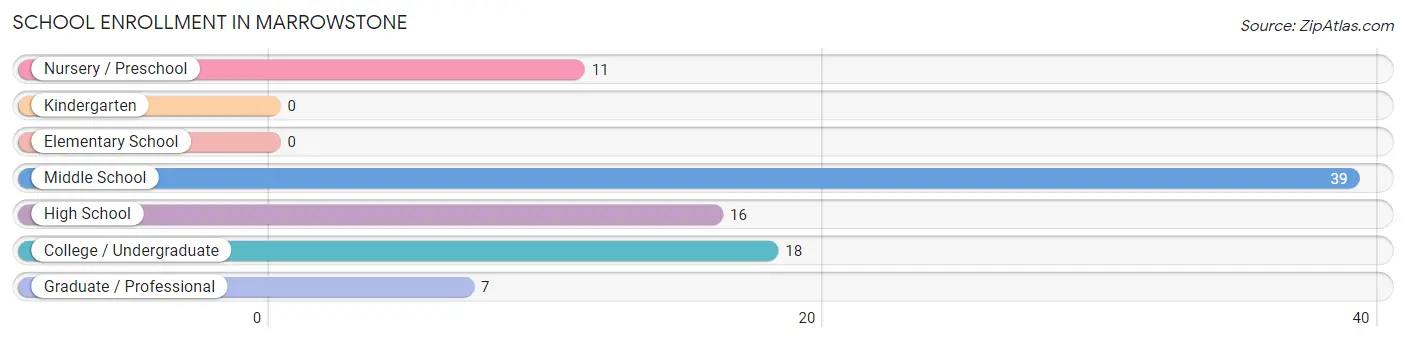
| School Level | # Students | % Students |
| Nursery / Preschool | 11 | 12.1% |
| Kindergarten | 0 | 0.0% |
| Elementary School | 0 | 0.0% |
| Middle School | 39 | 42.9% |
| High School | 16 | 17.6% |
| College / Undergraduate | 18 | 19.8% |
| Graduate / Professional | 7 | 7.7% |
| Total | 91 | 100.0% |
School Enrollment by Age by Funding Source in Marrowstone
Out of a total of 91 students who are enrolled in schools in Marrowstone, 22 (24.2%) attend a private institution, while the remaining 69 (75.8%) are enrolled in public schools. The age group of 5 to 9 year old has the highest likelihood of being enrolled in private schools, with 11 (100.0% in the age bracket) enrolled. Conversely, the age group of 10 to 14 year olds has the lowest likelihood of being enrolled in a private school, with 39 (100.0% in the age bracket) attending a public institution.
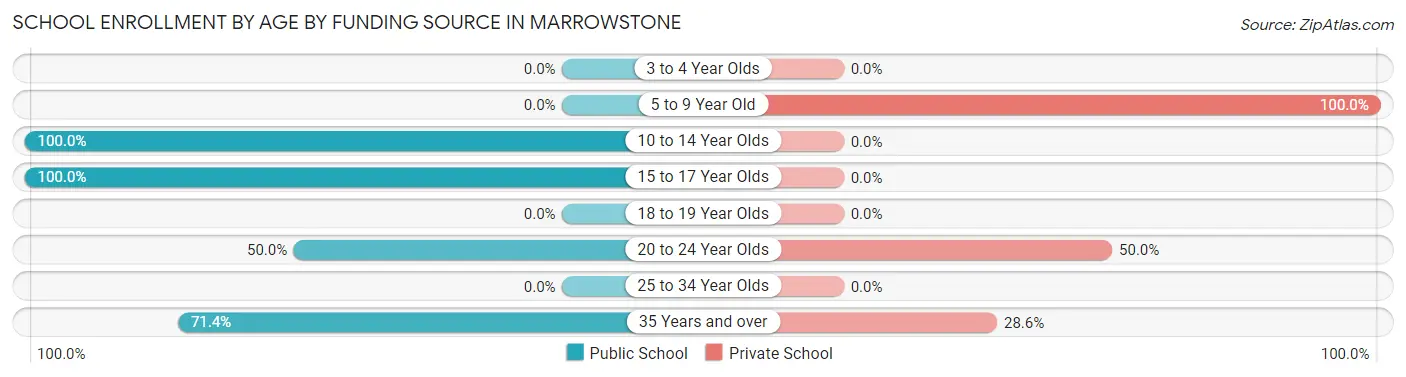
| Age Bracket | Public School | Private School |
| 3 to 4 Year Olds | 0 (0.0%) | 0 (0.0%) |
| 5 to 9 Year Old | 0 (0.0%) | 11 (100.0%) |
| 10 to 14 Year Olds | 39 (100.0%) | 0 (0.0%) |
| 15 to 17 Year Olds | 16 (100.0%) | 0 (0.0%) |
| 18 to 19 Year Olds | 0 (0.0%) | 0 (0.0%) |
| 20 to 24 Year Olds | 9 (50.0%) | 9 (50.0%) |
| 25 to 34 Year Olds | 0 (0.0%) | 0 (0.0%) |
| 35 Years and over | 5 (71.4%) | 2 (28.6%) |
| Total | 69 (75.8%) | 22 (24.2%) |
Educational Attainment by Field of Study in Marrowstone
Education (74 | 17.0%), bio, nature & agricultural (63 | 14.4%), business (58 | 13.3%), visual & performing arts (47 | 10.8%), and social sciences (43 | 9.9%) are the most common fields of study among 436 individuals in Marrowstone who have obtained a bachelor's degree or higher.
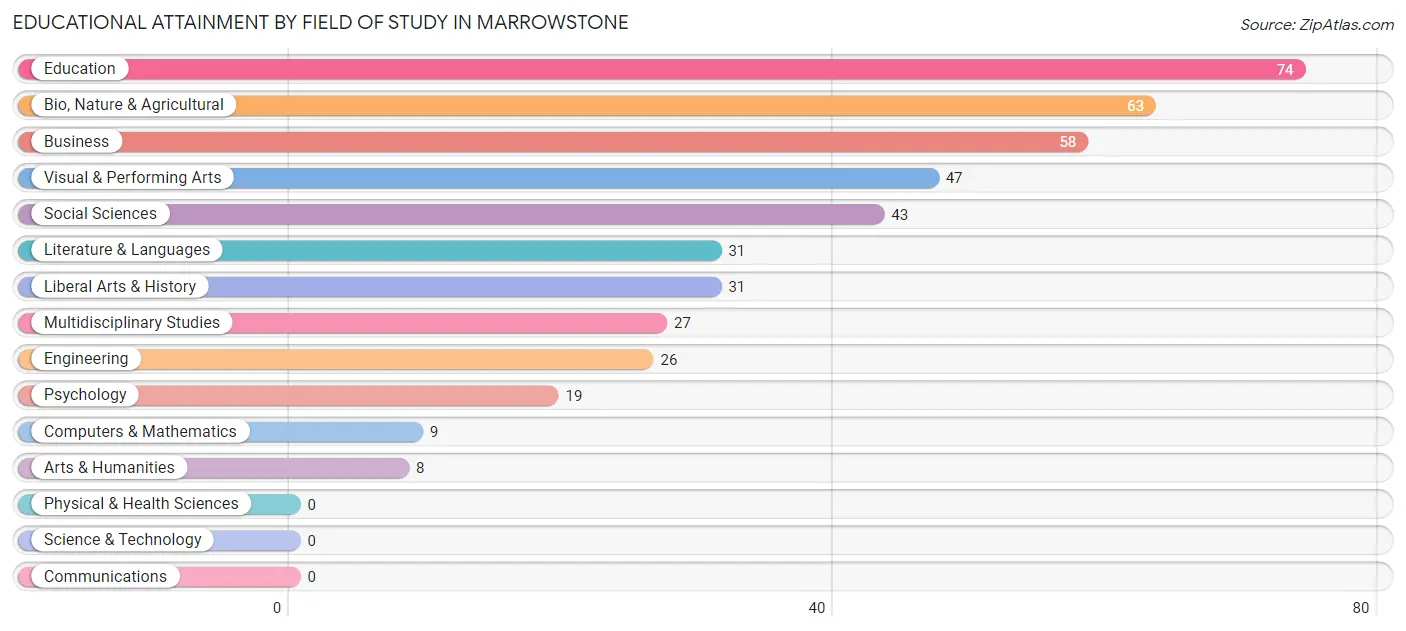
| Field of Study | # Graduates | % Graduates |
| Computers & Mathematics | 9 | 2.1% |
| Bio, Nature & Agricultural | 63 | 14.4% |
| Physical & Health Sciences | 0 | 0.0% |
| Psychology | 19 | 4.4% |
| Social Sciences | 43 | 9.9% |
| Engineering | 26 | 6.0% |
| Multidisciplinary Studies | 27 | 6.2% |
| Science & Technology | 0 | 0.0% |
| Business | 58 | 13.3% |
| Education | 74 | 17.0% |
| Literature & Languages | 31 | 7.1% |
| Liberal Arts & History | 31 | 7.1% |
| Visual & Performing Arts | 47 | 10.8% |
| Communications | 0 | 0.0% |
| Arts & Humanities | 8 | 1.8% |
| Total | 436 | 100.0% |
Transportation & Commute in Marrowstone
Vehicle Availability by Sex in Marrowstone
The most prevalent vehicle ownership categories in Marrowstone are males with 2 vehicles (72, accounting for 38.1%) and females with 2 vehicles (73, making up 47.1%).
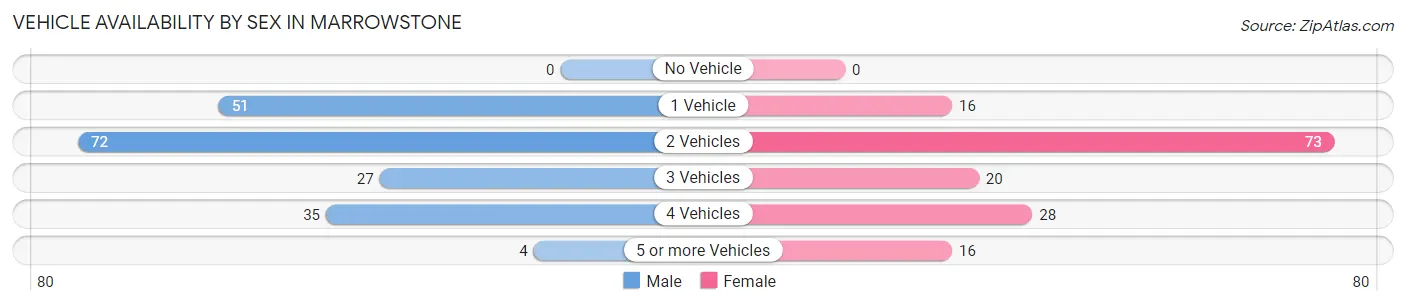
| Vehicles Available | Male | Female |
| No Vehicle | 0 (0.0%) | 0 (0.0%) |
| 1 Vehicle | 51 (27.0%) | 16 (10.5%) |
| 2 Vehicles | 72 (38.1%) | 73 (47.7%) |
| 3 Vehicles | 27 (14.3%) | 20 (13.1%) |
| 4 Vehicles | 35 (18.5%) | 28 (18.3%) |
| 5 or more Vehicles | 4 (2.1%) | 16 (10.5%) |
| Total | 189 (100.0%) | 153 (100.0%) |
Commute Time in Marrowstone
The most frequently occuring commute durations in Marrowstone are 30 to 34 minutes (68 commuters, 34.7%), 15 to 19 minutes (31 commuters, 15.8%), and 20 to 24 minutes (27 commuters, 13.8%).
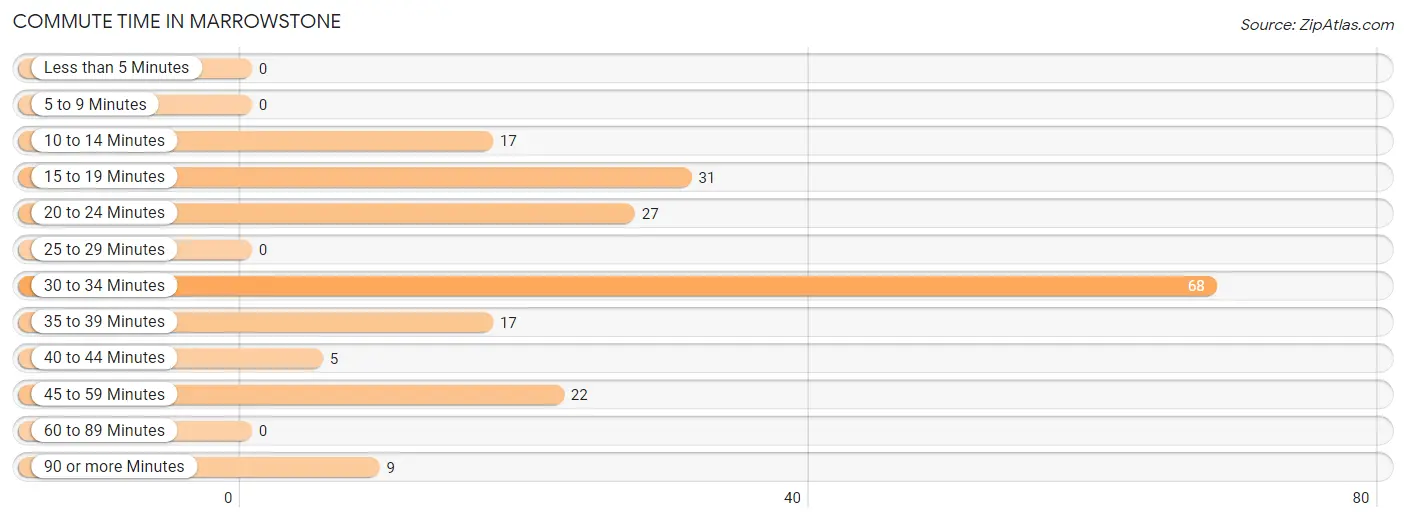
| Commute Time | # Commuters | % Commuters |
| Less than 5 Minutes | 0 | 0.0% |
| 5 to 9 Minutes | 0 | 0.0% |
| 10 to 14 Minutes | 17 | 8.7% |
| 15 to 19 Minutes | 31 | 15.8% |
| 20 to 24 Minutes | 27 | 13.8% |
| 25 to 29 Minutes | 0 | 0.0% |
| 30 to 34 Minutes | 68 | 34.7% |
| 35 to 39 Minutes | 17 | 8.7% |
| 40 to 44 Minutes | 5 | 2.5% |
| 45 to 59 Minutes | 22 | 11.2% |
| 60 to 89 Minutes | 0 | 0.0% |
| 90 or more Minutes | 9 | 4.6% |
Commute Time by Sex in Marrowstone
The most common commute times in Marrowstone are 30 to 34 minutes (33 commuters, 39.3%) for males and 30 to 34 minutes (35 commuters, 31.2%) for females.
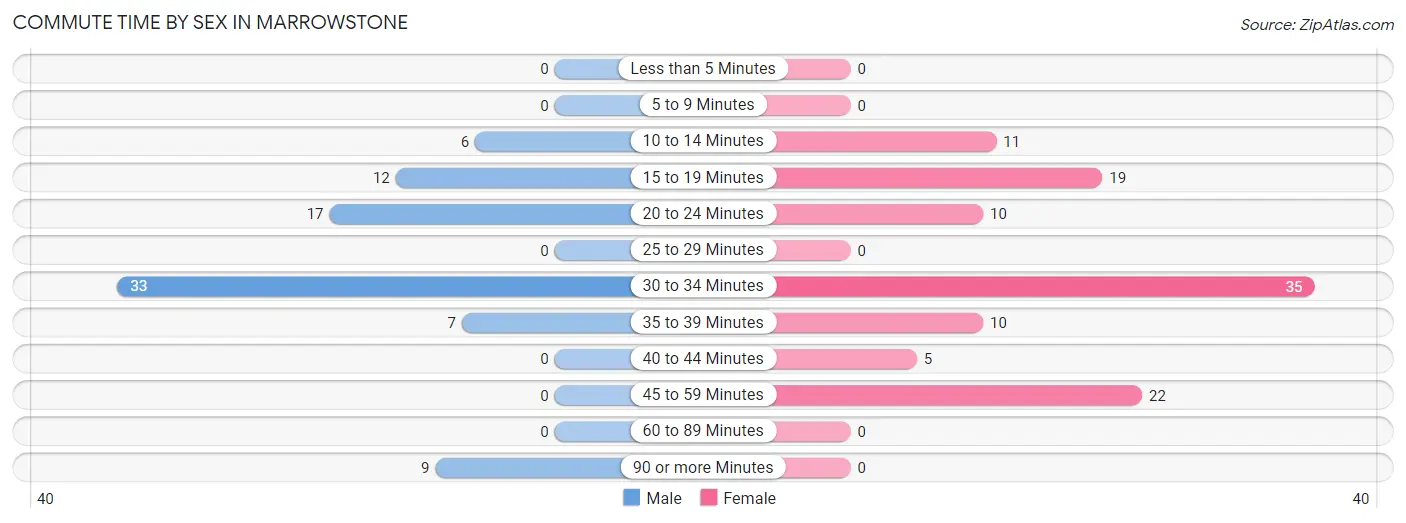
| Commute Time | Male | Female |
| Less than 5 Minutes | 0 (0.0%) | 0 (0.0%) |
| 5 to 9 Minutes | 0 (0.0%) | 0 (0.0%) |
| 10 to 14 Minutes | 6 (7.1%) | 11 (9.8%) |
| 15 to 19 Minutes | 12 (14.3%) | 19 (17.0%) |
| 20 to 24 Minutes | 17 (20.2%) | 10 (8.9%) |
| 25 to 29 Minutes | 0 (0.0%) | 0 (0.0%) |
| 30 to 34 Minutes | 33 (39.3%) | 35 (31.2%) |
| 35 to 39 Minutes | 7 (8.3%) | 10 (8.9%) |
| 40 to 44 Minutes | 0 (0.0%) | 5 (4.5%) |
| 45 to 59 Minutes | 0 (0.0%) | 22 (19.6%) |
| 60 to 89 Minutes | 0 (0.0%) | 0 (0.0%) |
| 90 or more Minutes | 9 (10.7%) | 0 (0.0%) |
Time of Departure to Work by Sex in Marrowstone
The most frequent times of departure to work in Marrowstone are 10:00 AM to 10:59 AM (21, 25.0%) for males and 8:00 AM to 8:29 AM (40, 35.7%) for females.
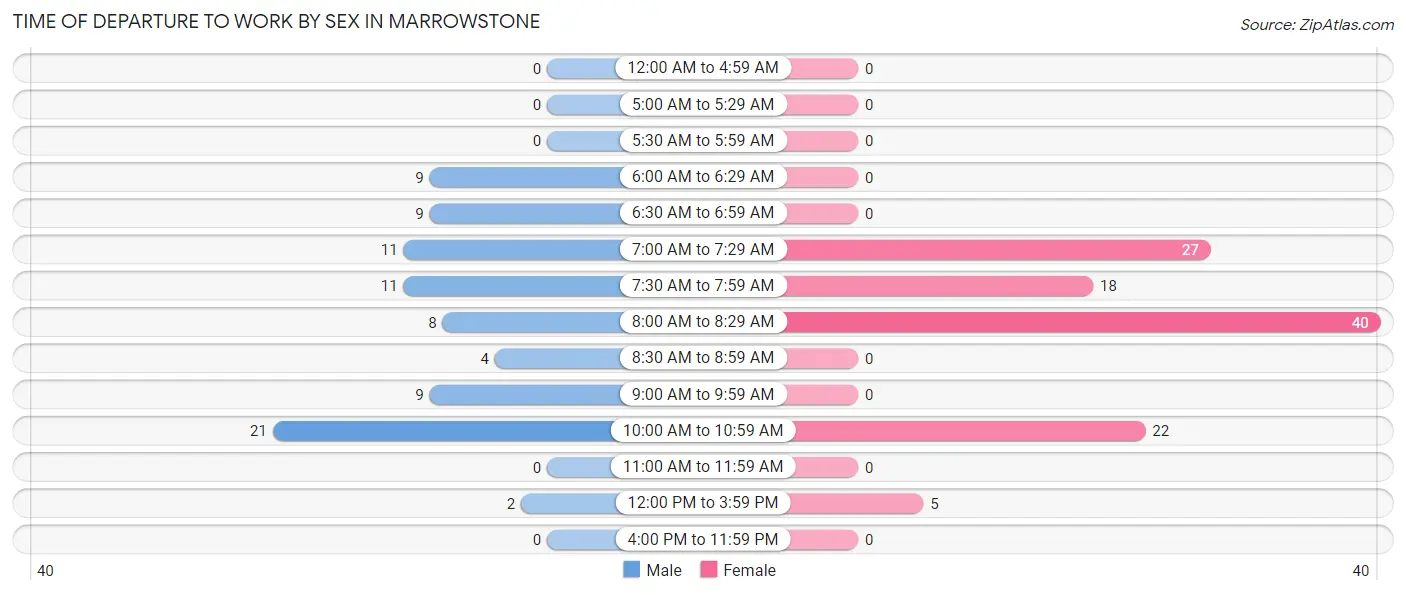
| Time of Departure | Male | Female |
| 12:00 AM to 4:59 AM | 0 (0.0%) | 0 (0.0%) |
| 5:00 AM to 5:29 AM | 0 (0.0%) | 0 (0.0%) |
| 5:30 AM to 5:59 AM | 0 (0.0%) | 0 (0.0%) |
| 6:00 AM to 6:29 AM | 9 (10.7%) | 0 (0.0%) |
| 6:30 AM to 6:59 AM | 9 (10.7%) | 0 (0.0%) |
| 7:00 AM to 7:29 AM | 11 (13.1%) | 27 (24.1%) |
| 7:30 AM to 7:59 AM | 11 (13.1%) | 18 (16.1%) |
| 8:00 AM to 8:29 AM | 8 (9.5%) | 40 (35.7%) |
| 8:30 AM to 8:59 AM | 4 (4.8%) | 0 (0.0%) |
| 9:00 AM to 9:59 AM | 9 (10.7%) | 0 (0.0%) |
| 10:00 AM to 10:59 AM | 21 (25.0%) | 22 (19.6%) |
| 11:00 AM to 11:59 AM | 0 (0.0%) | 0 (0.0%) |
| 12:00 PM to 3:59 PM | 2 (2.4%) | 5 (4.5%) |
| 4:00 PM to 11:59 PM | 0 (0.0%) | 0 (0.0%) |
| Total | 84 (100.0%) | 112 (100.0%) |
Housing Occupancy in Marrowstone
Occupancy by Ownership in Marrowstone
Of the total 444 dwellings in Marrowstone, owner-occupied units account for 332 (74.8%), while renter-occupied units make up 112 (25.2%).
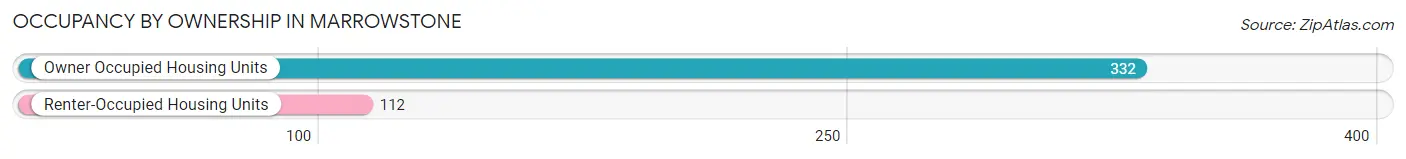
| Occupancy | # Housing Units | % Housing Units |
| Owner Occupied Housing Units | 332 | 74.8% |
| Renter-Occupied Housing Units | 112 | 25.2% |
| Total Occupied Housing Units | 444 | 100.0% |
Occupancy by Household Size in Marrowstone
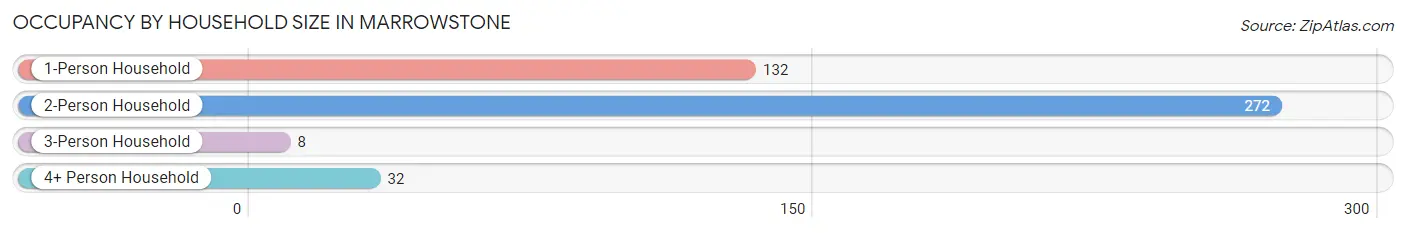
| Household Size | # Housing Units | % Housing Units |
| 1-Person Household | 132 | 29.7% |
| 2-Person Household | 272 | 61.3% |
| 3-Person Household | 8 | 1.8% |
| 4+ Person Household | 32 | 7.2% |
| Total Housing Units | 444 | 100.0% |
Occupancy by Ownership by Household Size in Marrowstone
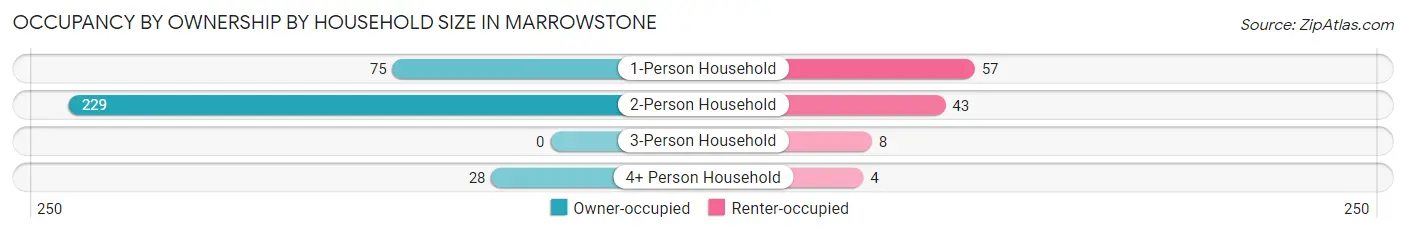
| Household Size | Owner-occupied | Renter-occupied |
| 1-Person Household | 75 (56.8%) | 57 (43.2%) |
| 2-Person Household | 229 (84.2%) | 43 (15.8%) |
| 3-Person Household | 0 (0.0%) | 8 (100.0%) |
| 4+ Person Household | 28 (87.5%) | 4 (12.5%) |
| Total Housing Units | 332 (74.8%) | 112 (25.2%) |
Occupancy by Educational Attainment in Marrowstone
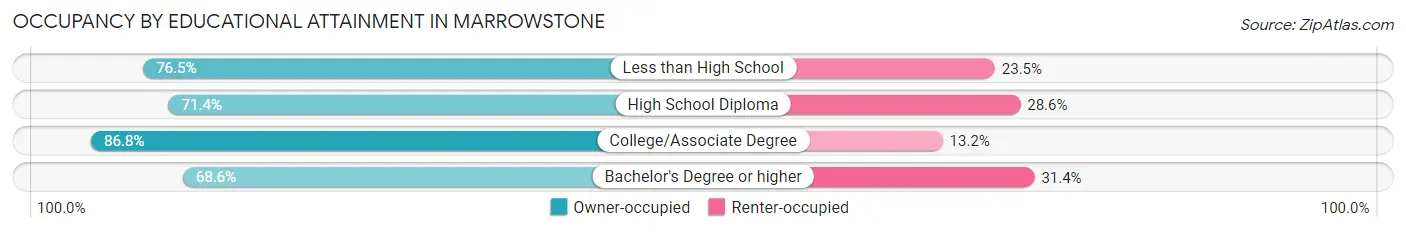
| Household Size | Owner-occupied | Renter-occupied |
| Less than High School | 26 (76.5%) | 8 (23.5%) |
| High School Diploma | 30 (71.4%) | 12 (28.6%) |
| College/Associate Degree | 112 (86.8%) | 17 (13.2%) |
| Bachelor's Degree or higher | 164 (68.6%) | 75 (31.4%) |
Occupancy by Age of Householder in Marrowstone
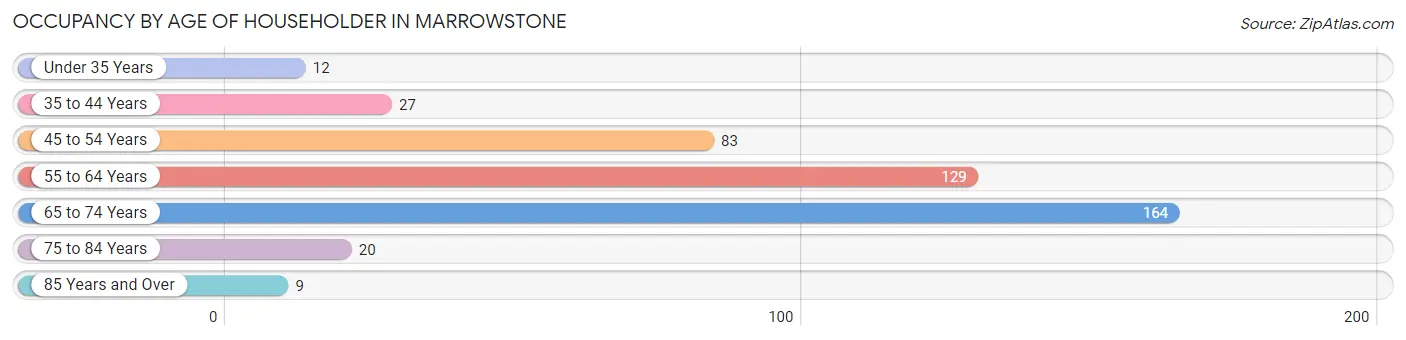
| Age Bracket | # Households | % Households |
| Under 35 Years | 12 | 2.7% |
| 35 to 44 Years | 27 | 6.1% |
| 45 to 54 Years | 83 | 18.7% |
| 55 to 64 Years | 129 | 29.0% |
| 65 to 74 Years | 164 | 36.9% |
| 75 to 84 Years | 20 | 4.5% |
| 85 Years and Over | 9 | 2.0% |
| Total | 444 | 100.0% |
Housing Finances in Marrowstone
Median Income by Occupancy in Marrowstone
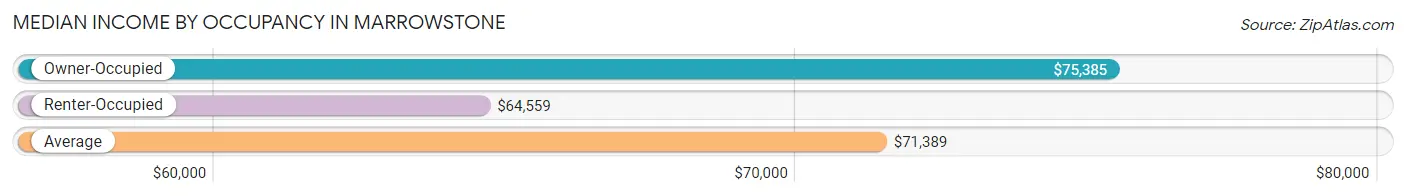
| Occupancy Type | # Households | Median Income |
| Owner-Occupied | 332 (74.8%) | $75,385 |
| Renter-Occupied | 112 (25.2%) | $64,559 |
| Average | 444 (100.0%) | $71,389 |
Occupancy by Householder Income Bracket in Marrowstone
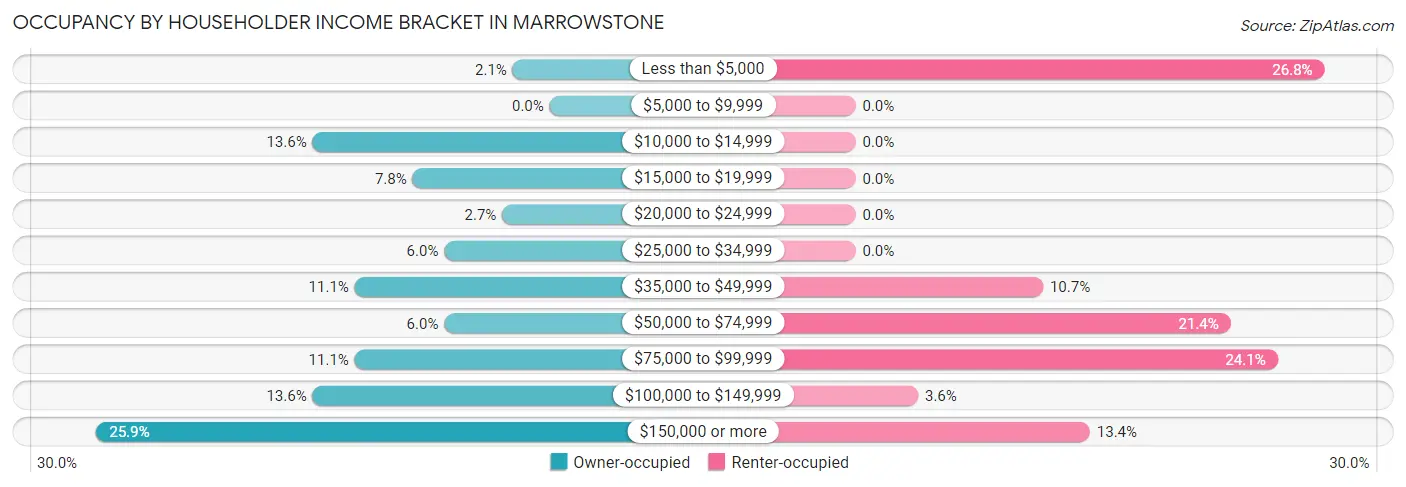
| Income Bracket | Owner-occupied | Renter-occupied |
| Less than $5,000 | 7 (2.1%) | 30 (26.8%) |
| $5,000 to $9,999 | 0 (0.0%) | 0 (0.0%) |
| $10,000 to $14,999 | 45 (13.6%) | 0 (0.0%) |
| $15,000 to $19,999 | 26 (7.8%) | 0 (0.0%) |
| $20,000 to $24,999 | 9 (2.7%) | 0 (0.0%) |
| $25,000 to $34,999 | 20 (6.0%) | 0 (0.0%) |
| $35,000 to $49,999 | 37 (11.1%) | 12 (10.7%) |
| $50,000 to $74,999 | 20 (6.0%) | 24 (21.4%) |
| $75,000 to $99,999 | 37 (11.1%) | 27 (24.1%) |
| $100,000 to $149,999 | 45 (13.6%) | 4 (3.6%) |
| $150,000 or more | 86 (25.9%) | 15 (13.4%) |
| Total | 332 (100.0%) | 112 (100.0%) |
Monthly Housing Cost Tiers in Marrowstone
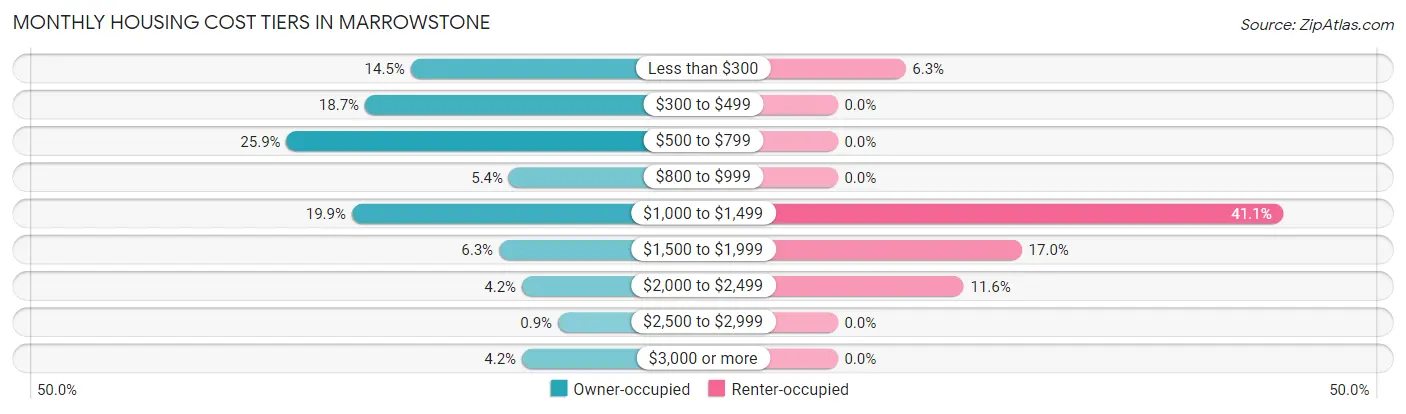
| Monthly Cost | Owner-occupied | Renter-occupied |
| Less than $300 | 48 (14.5%) | 7 (6.2%) |
| $300 to $499 | 62 (18.7%) | 0 (0.0%) |
| $500 to $799 | 86 (25.9%) | 0 (0.0%) |
| $800 to $999 | 18 (5.4%) | 0 (0.0%) |
| $1,000 to $1,499 | 66 (19.9%) | 46 (41.1%) |
| $1,500 to $1,999 | 21 (6.3%) | 19 (17.0%) |
| $2,000 to $2,499 | 14 (4.2%) | 13 (11.6%) |
| $2,500 to $2,999 | 3 (0.9%) | 0 (0.0%) |
| $3,000 or more | 14 (4.2%) | 0 (0.0%) |
| Total | 332 (100.0%) | 112 (100.0%) |
Physical Housing Characteristics in Marrowstone
Housing Structures in Marrowstone
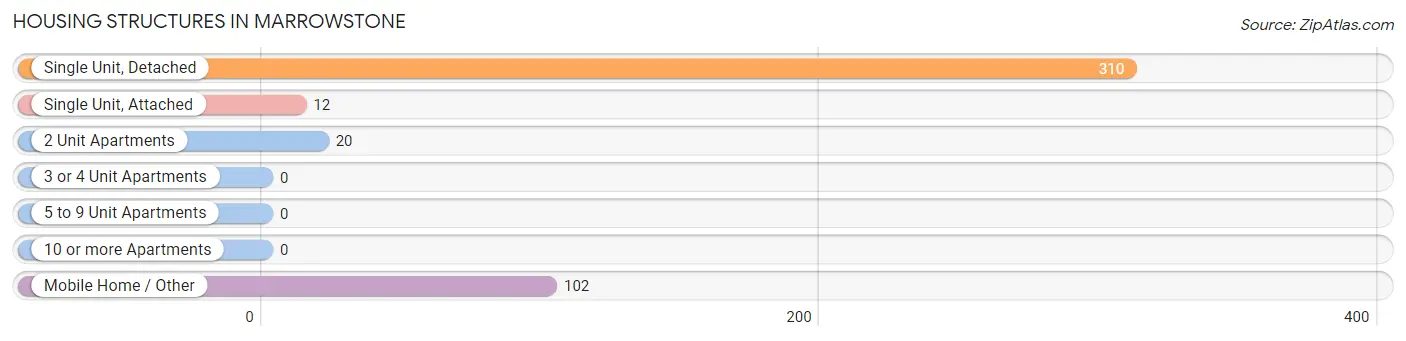
| Structure Type | # Housing Units | % Housing Units |
| Single Unit, Detached | 310 | 69.8% |
| Single Unit, Attached | 12 | 2.7% |
| 2 Unit Apartments | 20 | 4.5% |
| 3 or 4 Unit Apartments | 0 | 0.0% |
| 5 to 9 Unit Apartments | 0 | 0.0% |
| 10 or more Apartments | 0 | 0.0% |
| Mobile Home / Other | 102 | 23.0% |
| Total | 444 | 100.0% |
Housing Structures by Occupancy in Marrowstone
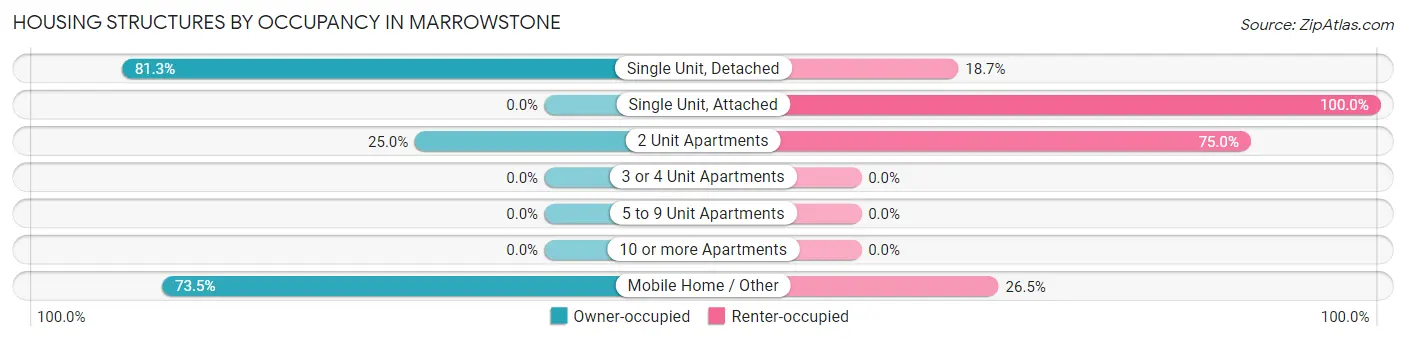
| Structure Type | Owner-occupied | Renter-occupied |
| Single Unit, Detached | 252 (81.3%) | 58 (18.7%) |
| Single Unit, Attached | 0 (0.0%) | 12 (100.0%) |
| 2 Unit Apartments | 5 (25.0%) | 15 (75.0%) |
| 3 or 4 Unit Apartments | 0 (0.0%) | 0 (0.0%) |
| 5 to 9 Unit Apartments | 0 (0.0%) | 0 (0.0%) |
| 10 or more Apartments | 0 (0.0%) | 0 (0.0%) |
| Mobile Home / Other | 75 (73.5%) | 27 (26.5%) |
| Total | 332 (74.8%) | 112 (25.2%) |
Housing Structures by Number of Rooms in Marrowstone
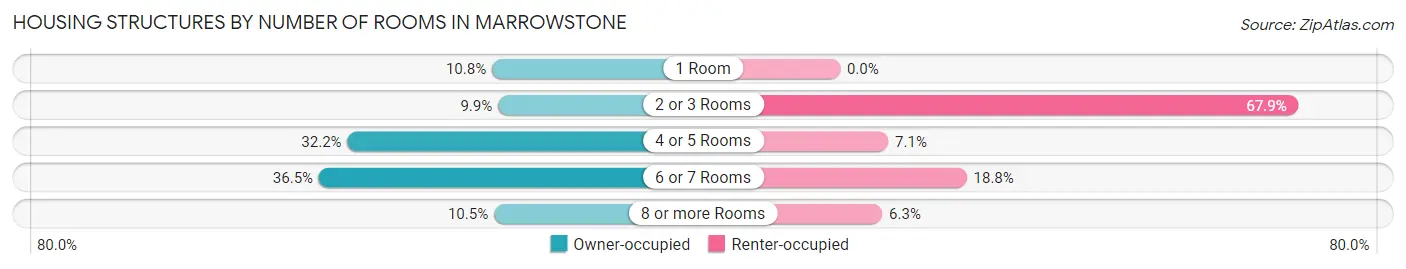
| Number of Rooms | Owner-occupied | Renter-occupied |
| 1 Room | 36 (10.8%) | 0 (0.0%) |
| 2 or 3 Rooms | 33 (9.9%) | 76 (67.9%) |
| 4 or 5 Rooms | 107 (32.2%) | 8 (7.1%) |
| 6 or 7 Rooms | 121 (36.4%) | 21 (18.8%) |
| 8 or more Rooms | 35 (10.5%) | 7 (6.2%) |
| Total | 332 (100.0%) | 112 (100.0%) |
Housing Structure by Heating Type in Marrowstone
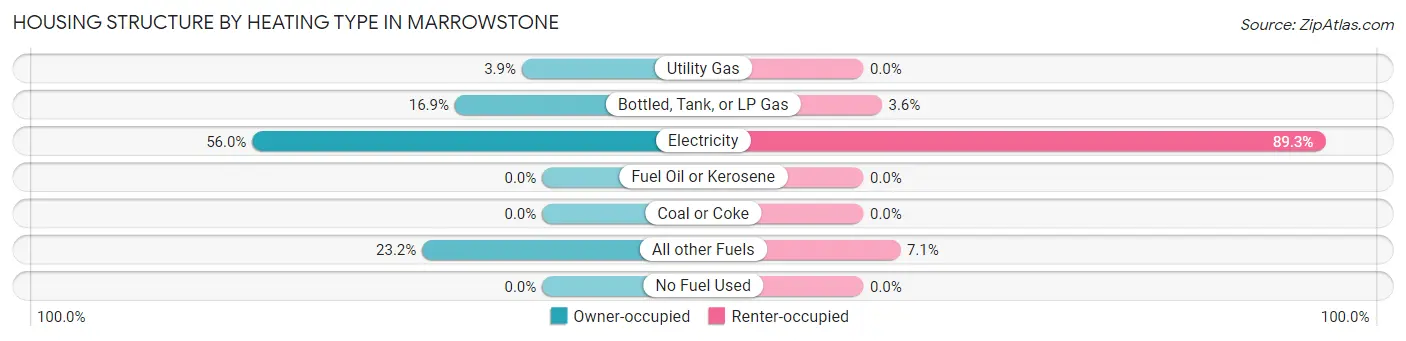
| Heating Type | Owner-occupied | Renter-occupied |
| Utility Gas | 13 (3.9%) | 0 (0.0%) |
| Bottled, Tank, or LP Gas | 56 (16.9%) | 4 (3.6%) |
| Electricity | 186 (56.0%) | 100 (89.3%) |
| Fuel Oil or Kerosene | 0 (0.0%) | 0 (0.0%) |
| Coal or Coke | 0 (0.0%) | 0 (0.0%) |
| All other Fuels | 77 (23.2%) | 8 (7.1%) |
| No Fuel Used | 0 (0.0%) | 0 (0.0%) |
| Total | 332 (100.0%) | 112 (100.0%) |
Household Vehicle Usage in Marrowstone
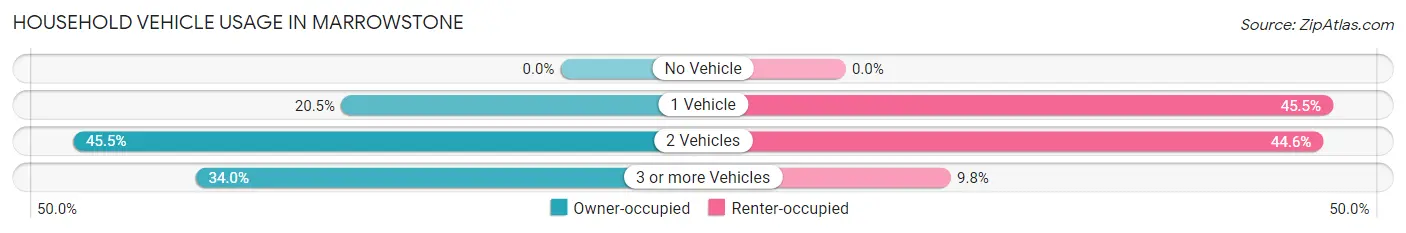
| Vehicles per Household | Owner-occupied | Renter-occupied |
| No Vehicle | 0 (0.0%) | 0 (0.0%) |
| 1 Vehicle | 68 (20.5%) | 51 (45.5%) |
| 2 Vehicles | 151 (45.5%) | 50 (44.6%) |
| 3 or more Vehicles | 113 (34.0%) | 11 (9.8%) |
| Total | 332 (100.0%) | 112 (100.0%) |
Real Estate & Mortgages in Marrowstone
Real Estate and Mortgage Overview in Marrowstone
| Characteristic | Without Mortgage | With Mortgage |
| Housing Units | 267 | 65 |
| Median Property Value | $434,700 | $579,500 |
| Median Household Income | - | - |
| Monthly Housing Costs | $569 | $14 |
| Real Estate Taxes | $4,089 | $0 |
Property Value by Mortgage Status in Marrowstone
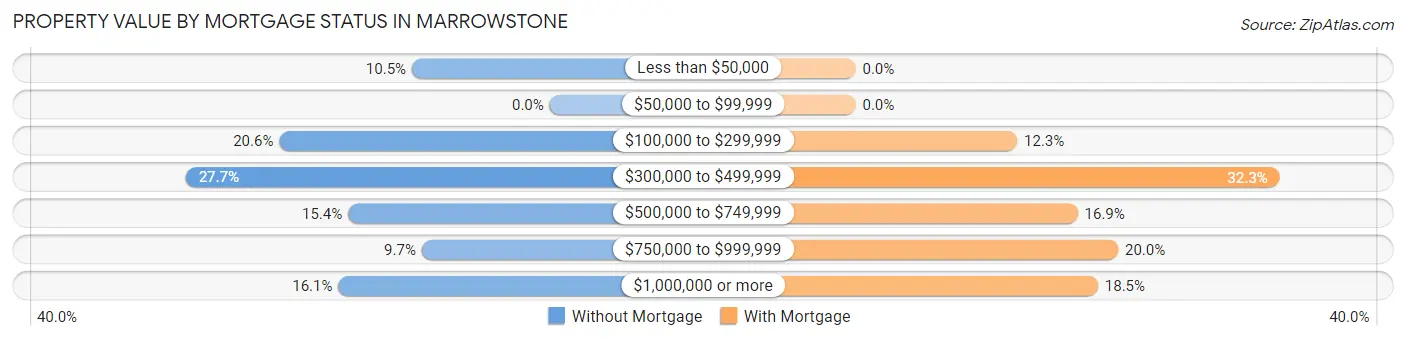
| Property Value | Without Mortgage | With Mortgage |
| Less than $50,000 | 28 (10.5%) | 0 (0.0%) |
| $50,000 to $99,999 | 0 (0.0%) | 0 (0.0%) |
| $100,000 to $299,999 | 55 (20.6%) | 8 (12.3%) |
| $300,000 to $499,999 | 74 (27.7%) | 21 (32.3%) |
| $500,000 to $749,999 | 41 (15.4%) | 11 (16.9%) |
| $750,000 to $999,999 | 26 (9.7%) | 13 (20.0%) |
| $1,000,000 or more | 43 (16.1%) | 12 (18.5%) |
| Total | 267 (100.0%) | 65 (100.0%) |
Household Income by Mortgage Status in Marrowstone
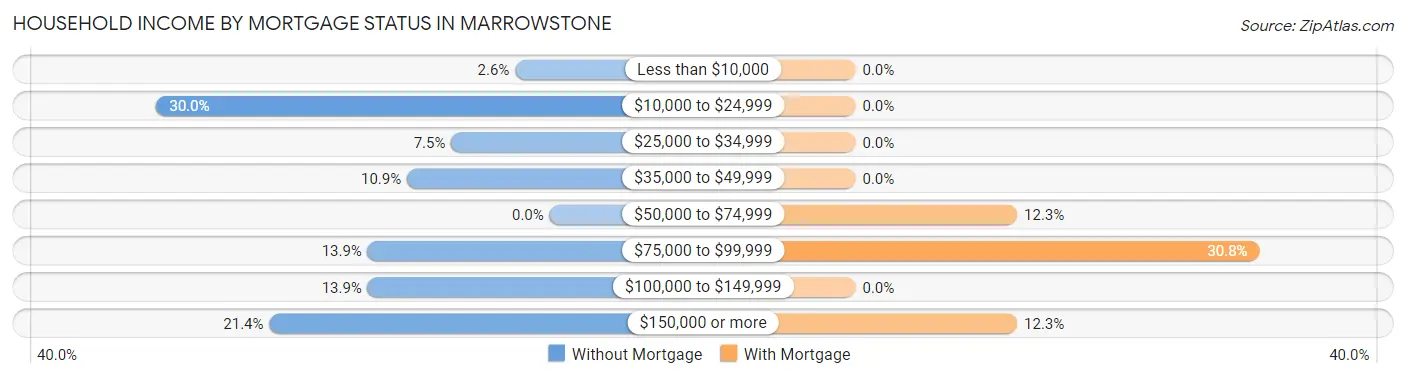
| Household Income | Without Mortgage | With Mortgage |
| Less than $10,000 | 7 (2.6%) | 0 (0.0%) |
| $10,000 to $24,999 | 80 (30.0%) | 0 (0.0%) |
| $25,000 to $34,999 | 20 (7.5%) | 0 (0.0%) |
| $35,000 to $49,999 | 29 (10.9%) | 0 (0.0%) |
| $50,000 to $74,999 | 0 (0.0%) | 8 (12.3%) |
| $75,000 to $99,999 | 37 (13.9%) | 20 (30.8%) |
| $100,000 to $149,999 | 37 (13.9%) | 0 (0.0%) |
| $150,000 or more | 57 (21.3%) | 8 (12.3%) |
| Total | 267 (100.0%) | 65 (100.0%) |
Property Value to Household Income Ratio in Marrowstone
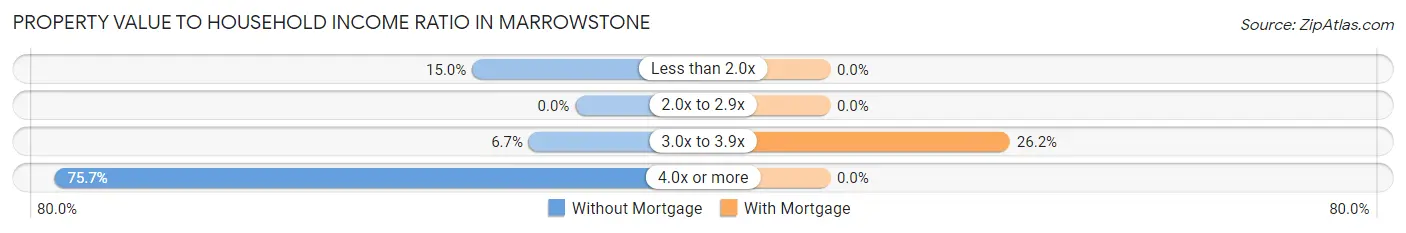
| Value-to-Income Ratio | Without Mortgage | With Mortgage |
| Less than 2.0x | 40 (15.0%) | 0 (0.0%) |
| 2.0x to 2.9x | 0 (0.0%) | 0 (0.0%) |
| 3.0x to 3.9x | 18 (6.7%) | 17 (26.2%) |
| 4.0x or more | 202 (75.7%) | 0 (0.0%) |
| Total | 267 (100.0%) | 65 (100.0%) |
Real Estate Taxes by Mortgage Status in Marrowstone
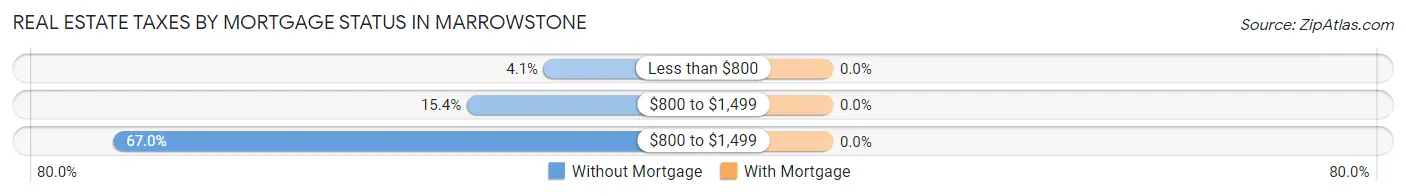
| Property Taxes | Without Mortgage | With Mortgage |
| Less than $800 | 11 (4.1%) | 0 (0.0%) |
| $800 to $1,499 | 41 (15.4%) | 0 (0.0%) |
| $800 to $1,499 | 179 (67.0%) | 0 (0.0%) |
| Total | 267 (100.0%) | 65 (100.0%) |
Health & Disability in Marrowstone
Health Insurance Coverage by Age in Marrowstone
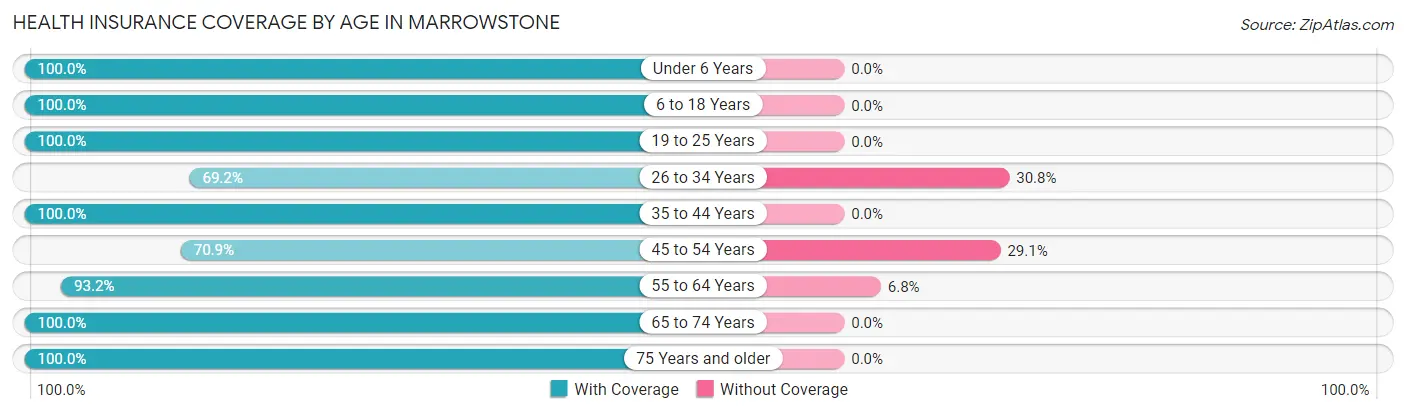
| Age Bracket | With Coverage | Without Coverage |
| Under 6 Years | 11 (100.0%) | 0 (0.0%) |
| 6 to 18 Years | 58 (100.0%) | 0 (0.0%) |
| 19 to 25 Years | 18 (100.0%) | 0 (0.0%) |
| 26 to 34 Years | 27 (69.2%) | 12 (30.8%) |
| 35 to 44 Years | 36 (100.0%) | 0 (0.0%) |
| 45 to 54 Years | 90 (70.9%) | 37 (29.1%) |
| 55 to 64 Years | 246 (93.2%) | 18 (6.8%) |
| 65 to 74 Years | 251 (100.0%) | 0 (0.0%) |
| 75 Years and older | 78 (100.0%) | 0 (0.0%) |
| Total | 815 (92.4%) | 67 (7.6%) |
Health Insurance Coverage by Citizenship Status in Marrowstone
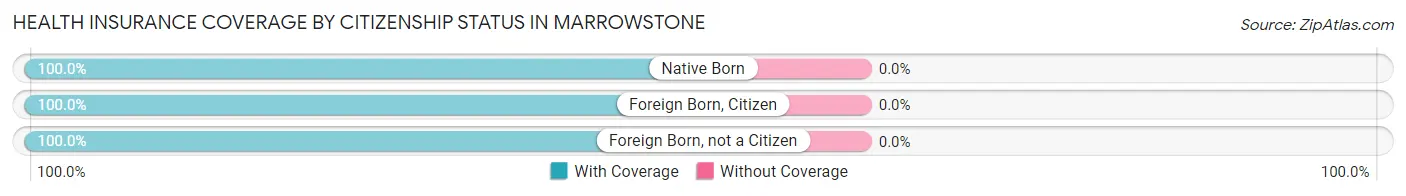
| Citizenship Status | With Coverage | Without Coverage |
| Native Born | 11 (100.0%) | 0 (0.0%) |
| Foreign Born, Citizen | 58 (100.0%) | 0 (0.0%) |
| Foreign Born, not a Citizen | 18 (100.0%) | 0 (0.0%) |
Health Insurance Coverage by Household Income in Marrowstone
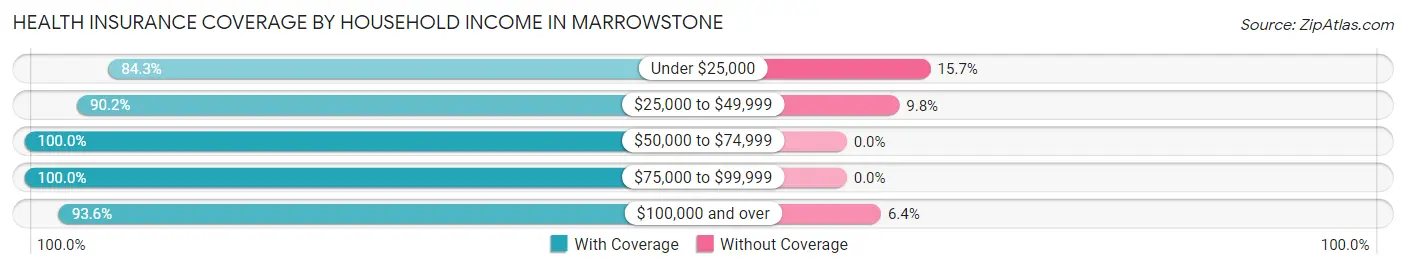
| Household Income | With Coverage | Without Coverage |
| Under $25,000 | 161 (84.3%) | 30 (15.7%) |
| $25,000 to $49,999 | 110 (90.2%) | 12 (9.8%) |
| $50,000 to $74,999 | 76 (100.0%) | 0 (0.0%) |
| $75,000 to $99,999 | 103 (100.0%) | 0 (0.0%) |
| $100,000 and over | 365 (93.6%) | 25 (6.4%) |
Public vs Private Health Insurance Coverage by Age in Marrowstone
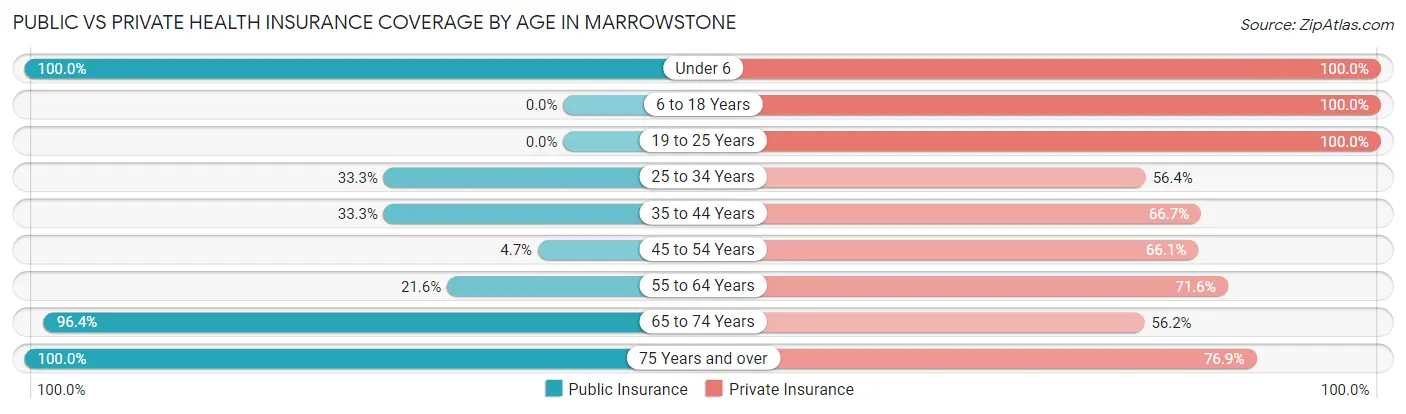
| Age Bracket | Public Insurance | Private Insurance |
| Under 6 | 11 (100.0%) | 11 (100.0%) |
| 6 to 18 Years | 0 (0.0%) | 58 (100.0%) |
| 19 to 25 Years | 0 (0.0%) | 18 (100.0%) |
| 25 to 34 Years | 13 (33.3%) | 22 (56.4%) |
| 35 to 44 Years | 12 (33.3%) | 24 (66.7%) |
| 45 to 54 Years | 6 (4.7%) | 84 (66.1%) |
| 55 to 64 Years | 57 (21.6%) | 189 (71.6%) |
| 65 to 74 Years | 242 (96.4%) | 141 (56.2%) |
| 75 Years and over | 78 (100.0%) | 60 (76.9%) |
| Total | 419 (47.5%) | 607 (68.8%) |
Disability Status by Sex by Age in Marrowstone
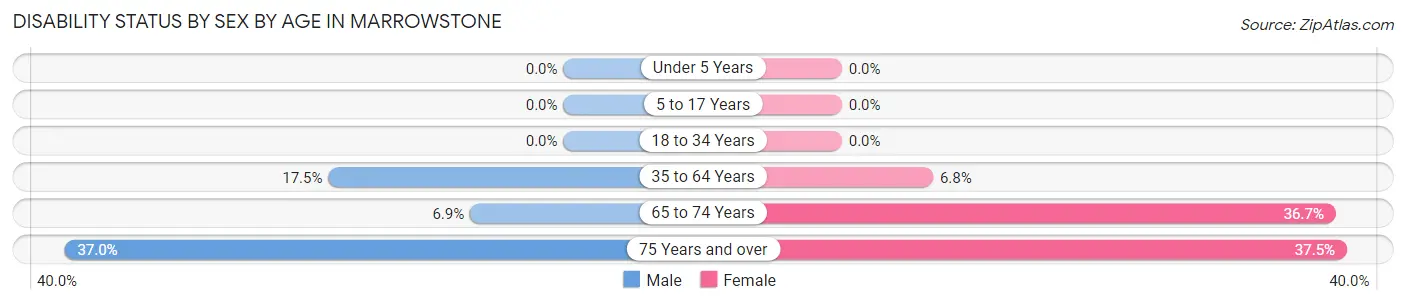
| Age Bracket | Male | Female |
| Under 5 Years | 0 (0.0%) | 0 (0.0%) |
| 5 to 17 Years | 0 (0.0%) | 0 (0.0%) |
| 18 to 34 Years | 0 (0.0%) | 0 (0.0%) |
| 35 to 64 Years | 41 (17.4%) | 13 (6.8%) |
| 65 to 74 Years | 7 (6.9%) | 55 (36.7%) |
| 75 Years and over | 20 (37.0%) | 9 (37.5%) |
Disability Class by Sex by Age in Marrowstone
Disability Class: Hearing Difficulty
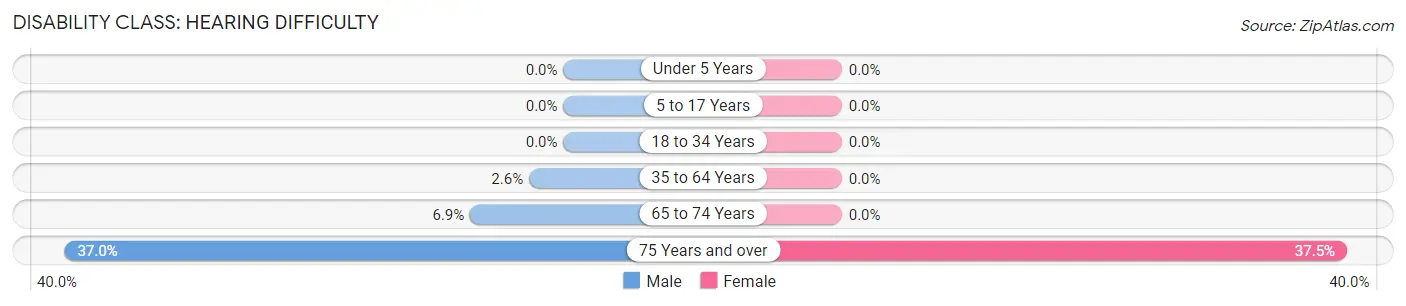
| Age Bracket | Male | Female |
| Under 5 Years | 0 (0.0%) | 0 (0.0%) |
| 5 to 17 Years | 0 (0.0%) | 0 (0.0%) |
| 18 to 34 Years | 0 (0.0%) | 0 (0.0%) |
| 35 to 64 Years | 6 (2.5%) | 0 (0.0%) |
| 65 to 74 Years | 7 (6.9%) | 0 (0.0%) |
| 75 Years and over | 20 (37.0%) | 9 (37.5%) |
Disability Class: Vision Difficulty
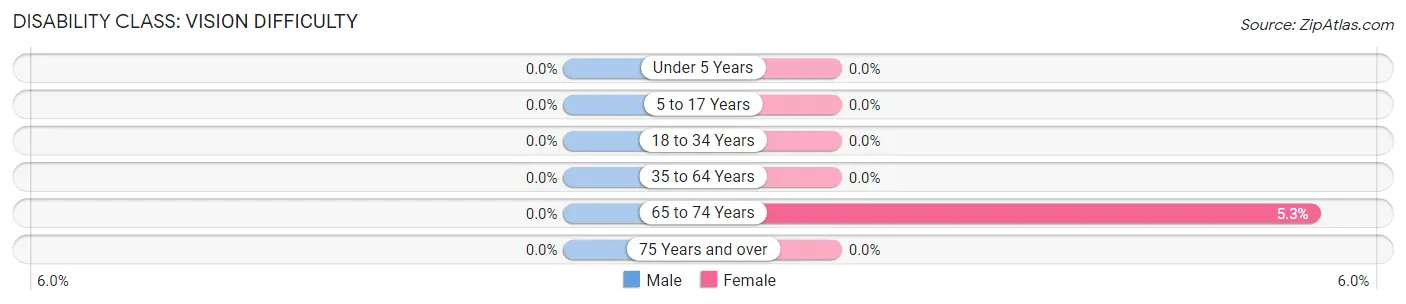
| Age Bracket | Male | Female |
| Under 5 Years | 0 (0.0%) | 0 (0.0%) |
| 5 to 17 Years | 0 (0.0%) | 0 (0.0%) |
| 18 to 34 Years | 0 (0.0%) | 0 (0.0%) |
| 35 to 64 Years | 0 (0.0%) | 0 (0.0%) |
| 65 to 74 Years | 0 (0.0%) | 8 (5.3%) |
| 75 Years and over | 0 (0.0%) | 0 (0.0%) |
Disability Class: Cognitive Difficulty
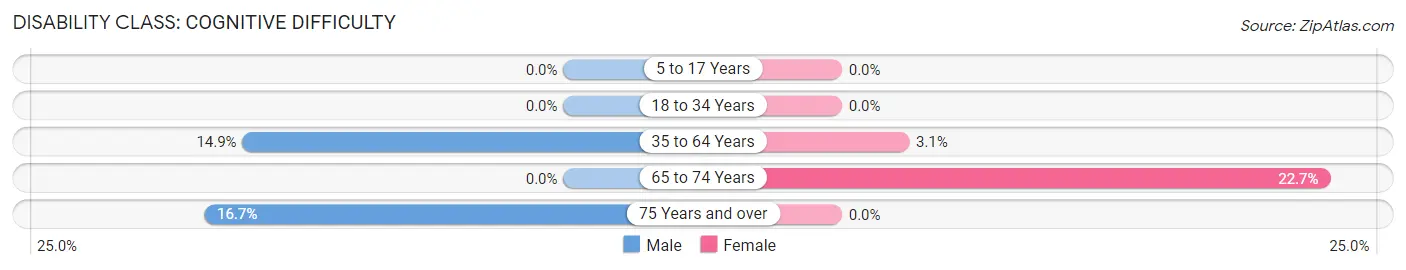
| Age Bracket | Male | Female |
| 5 to 17 Years | 0 (0.0%) | 0 (0.0%) |
| 18 to 34 Years | 0 (0.0%) | 0 (0.0%) |
| 35 to 64 Years | 35 (14.9%) | 6 (3.1%) |
| 65 to 74 Years | 0 (0.0%) | 34 (22.7%) |
| 75 Years and over | 9 (16.7%) | 0 (0.0%) |
Disability Class: Ambulatory Difficulty
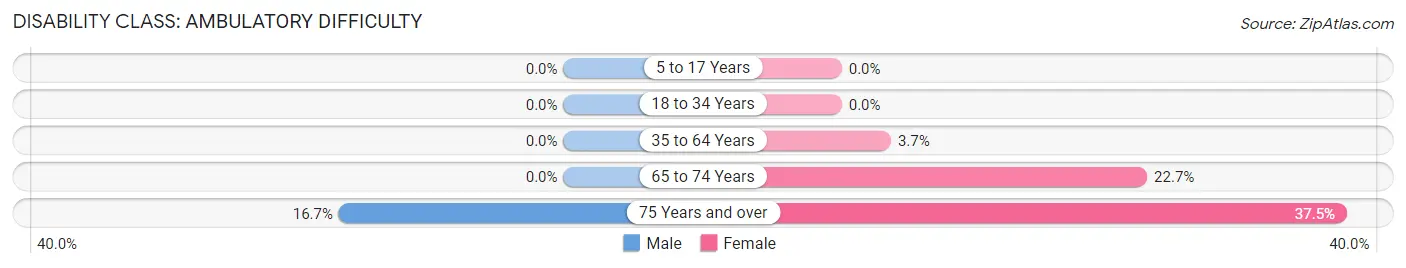
| Age Bracket | Male | Female |
| 5 to 17 Years | 0 (0.0%) | 0 (0.0%) |
| 18 to 34 Years | 0 (0.0%) | 0 (0.0%) |
| 35 to 64 Years | 0 (0.0%) | 7 (3.6%) |
| 65 to 74 Years | 0 (0.0%) | 34 (22.7%) |
| 75 Years and over | 9 (16.7%) | 9 (37.5%) |
Disability Class: Self-Care Difficulty
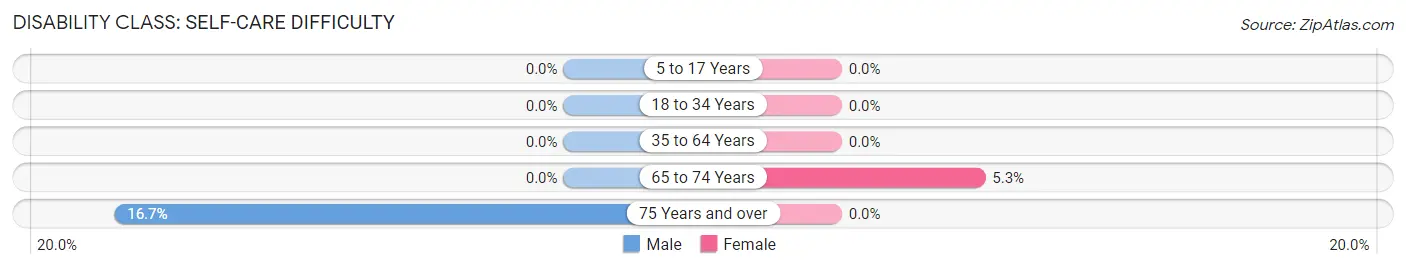
| Age Bracket | Male | Female |
| 5 to 17 Years | 0 (0.0%) | 0 (0.0%) |
| 18 to 34 Years | 0 (0.0%) | 0 (0.0%) |
| 35 to 64 Years | 0 (0.0%) | 0 (0.0%) |
| 65 to 74 Years | 0 (0.0%) | 8 (5.3%) |
| 75 Years and over | 9 (16.7%) | 0 (0.0%) |
Technology Access in Marrowstone
Computing Device Access in Marrowstone
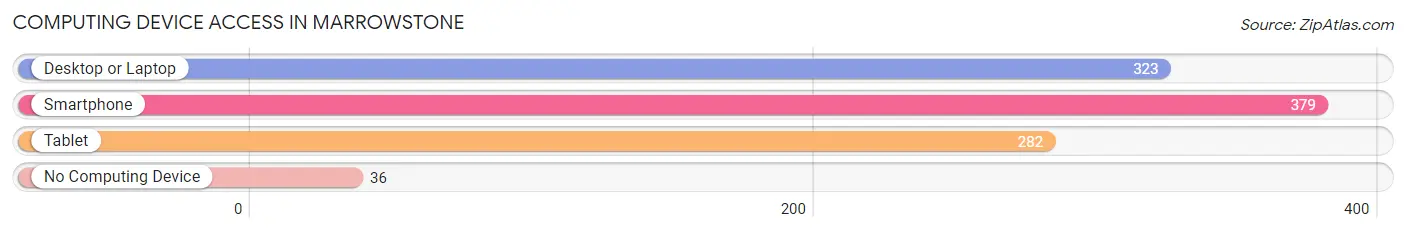
| Device Type | # Households | % Households |
| Desktop or Laptop | 323 | 72.8% |
| Smartphone | 379 | 85.4% |
| Tablet | 282 | 63.5% |
| No Computing Device | 36 | 8.1% |
| Total | 444 | 100.0% |
Internet Access in Marrowstone
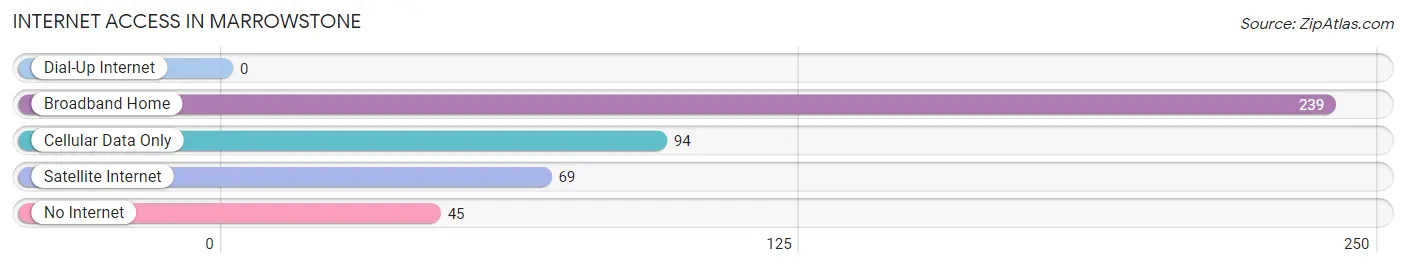
| Internet Type | # Households | % Households |
| Dial-Up Internet | 0 | 0.0% |
| Broadband Home | 239 | 53.8% |
| Cellular Data Only | 94 | 21.2% |
| Satellite Internet | 69 | 15.5% |
| No Internet | 45 | 10.1% |
| Total | 444 | 100.0% |
Marrowstone Summary
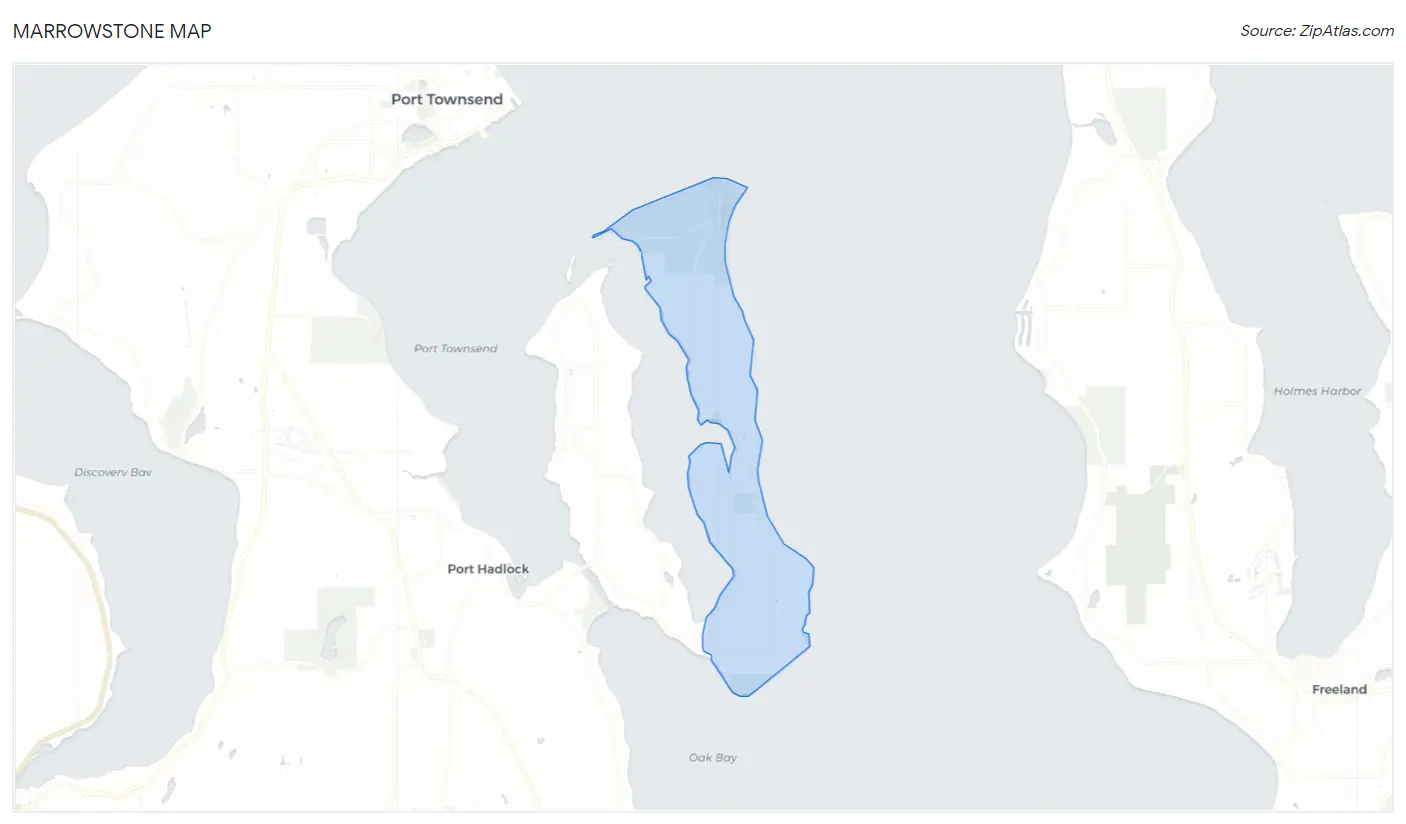
Marrowstone is a small island located in the Puget Sound of Washington State, USA. It is part of the Kitsap Peninsula and is located between Port Townsend and Port Ludlow. The island is approximately 4.5 miles long and 1.5 miles wide, with a total area of 5.3 square miles. It is home to approximately 1,000 people, making it one of the least populated islands in the Puget Sound.
History
Marrowstone was first inhabited by the S'Klallam tribe of Native Americans. The island was used as a fishing and hunting ground by the tribe, and they named it "Marrowstone" after the abundance of shellfish found in the area. In 1841, the island was claimed by the United States government and was used as a military reservation. In 1855, the island was opened to homesteaders and settlers, and the first permanent settlement was established in 1858.
In the late 19th century, the island was used for logging and farming. The island was also home to a number of resorts and summer homes, which attracted tourists from around the world. In the early 20th century, the island was used for military training and was home to a number of military installations.
Geography
Marrowstone is located in the Puget Sound of Washington State, USA. It is part of the Kitsap Peninsula and is located between Port Townsend and Port Ludlow. The island is approximately 4.5 miles long and 1.5 miles wide, with a total area of 5.3 square miles. The island is mostly flat, with a few hills and valleys. The highest point on the island is Mount Walker, which is 890 feet above sea level.
The island is surrounded by a number of smaller islands, including Indian Island, Marrowstone Point, and Mystery Bay. The island is connected to the mainland by a bridge, which was built in the 1950s.
Economy
Marrowstone's economy is largely based on tourism and fishing. The island is home to a number of resorts and summer homes, which attract tourists from around the world. The island is also home to a number of commercial fishing operations, which provide a significant source of income for the island's residents.
The island is also home to a number of small businesses, including restaurants, shops, and galleries. The island is also home to a number of artists, who sell their work to tourists and locals alike.
Demographics
As of the 2010 census, the population of Marrowstone was 1,000. The population is largely white (94.2%), with small percentages of African American (1.2%), Native American (1.2%), Asian (1.2%), and other races (2.4%). The median household income is $50,000, and the median age is 44.
Marrowstone is a small, close-knit community. The island is home to a number of churches, schools, and community organizations. The island is also home to a number of artists, who sell their work to tourists and locals alike.
Common Questions
What is Per Capita Income in Marrowstone?
Per Capita income in Marrowstone is $51,731.
What is the Median Family Income in Marrowstone?
Median Family Income in Marrowstone is $71,786.
What is the Median Household income in Marrowstone?
Median Household Income in Marrowstone is $71,389.
What is Family Income Deficit in Marrowstone?
Family Income Deficit in Marrowstone is $3,878.
Families that are below poverty line in Marrowstone earn $3,878 less on average than the poverty threshold level.
What is Inequality or Gini Index in Marrowstone?
Inequality or Gini Index in Marrowstone is 0.55.
What is the Total Population of Marrowstone?
Total Population of Marrowstone is 882.
What is the Total Male Population of Marrowstone?
Total Male Population of Marrowstone is 477.
What is the Total Female Population of Marrowstone?
Total Female Population of Marrowstone is 405.
What is the Ratio of Males per 100 Females in Marrowstone?
There are 117.78 Males per 100 Females in Marrowstone.
What is the Ratio of Females per 100 Males in Marrowstone?
There are 84.91 Females per 100 Males in Marrowstone.
What is the Median Population Age in Marrowstone?
Median Population Age in Marrowstone is 59.8 Years.
What is the Average Family Size in Marrowstone
Average Family Size in Marrowstone is 2.3 People.
What is the Average Household Size in Marrowstone
Average Household Size in Marrowstone is 2.0 People.
How Large is the Labor Force in Marrowstone?
There are 354 People in the Labor Forcein in Marrowstone.
What is the Percentage of People in the Labor Force in Marrowstone?
43.4% of People are in the Labor Force in Marrowstone.
What is the Unemployment Rate in Marrowstone?
Unemployment Rate in Marrowstone is 3.4%.