Redmond, WA Map & Demographics
Redmond Map
Redmond Overview
$82,565
PER CAPITA INCOME
$187,665
AVG FAMILY INCOME
$155,287
AVG HOUSEHOLD INCOME
47.4%
WAGE / INCOME GAP [ % ]
52.6¢/ $1
WAGE / INCOME GAP [ $ ]
0.44
INEQUALITY / GINI INDEX
73,728
TOTAL POPULATION
38,499
MALE POPULATION
35,229
FEMALE POPULATION
109.28
MALES / 100 FEMALES
91.51
FEMALES / 100 MALES
34.7
MEDIAN AGE
3.0
AVG FAMILY SIZE
2.4
AVG HOUSEHOLD SIZE
41,268
LABOR FORCE [ PEOPLE ]
70.4%
PERCENT IN LABOR FORCE
3.7%
UNEMPLOYMENT RATE
Income in Redmond
Income Overview in Redmond
Per Capita Income in Redmond is $82,565, while median incomes of families and households are $187,665 and $155,287 respectively.
| Characteristic | Number | Measure |
| Per Capita Income | 73,728 | $82,565 |
| Median Family Income | 18,964 | $187,665 |
| Mean Family Income | 18,964 | $235,635 |
| Median Household Income | 30,190 | $155,287 |
| Mean Household Income | 30,190 | $198,375 |
| Income Deficit | 18,964 | $0 |
| Wage / Income Gap (%) | 73,728 | 47.38% |
| Wage / Income Gap ($) | 73,728 | 52.62¢ per $1 |
| Gini / Inequality Index | 73,728 | 0.44 |
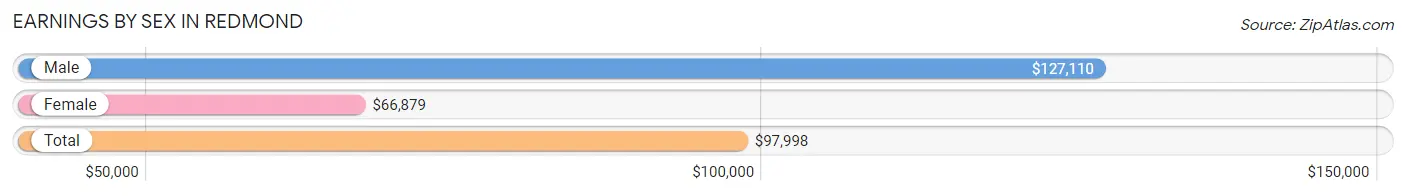
Earnings by Sex in Redmond
Average Earnings in Redmond are $97,998, $127,110 for men and $66,879 for women, a difference of 47.4%.
| Sex | Number | Average Earnings |
| Male | 25,823 (59.5%) | $127,110 |
| Female | 17,560 (40.5%) | $66,879 |
| Total | 43,383 (100.0%) | $97,998 |
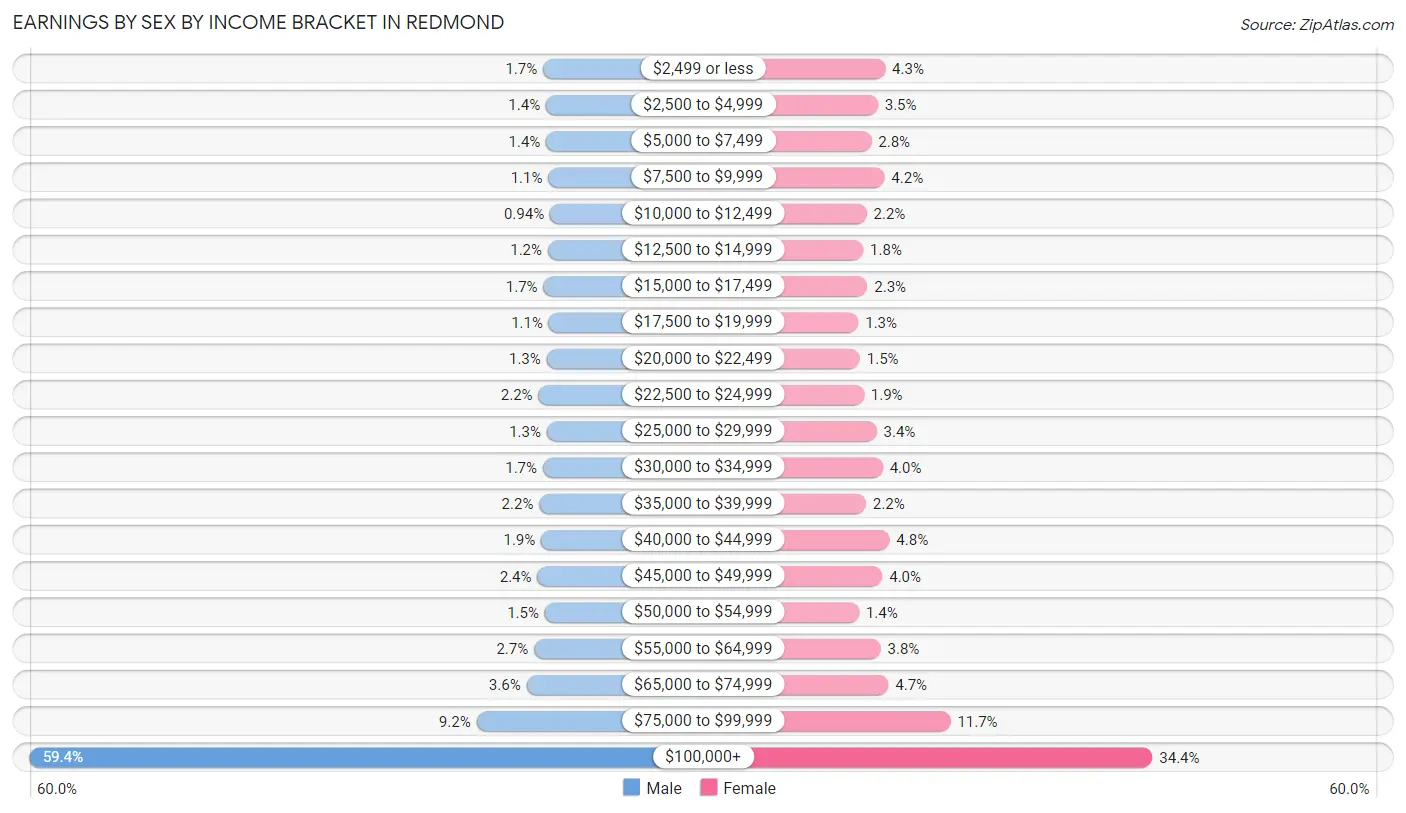
Earnings by Sex by Income Bracket in Redmond
The most common earnings brackets in Redmond are $100,000+ for men (15,344 | 59.4%) and $100,000+ for women (6,032 | 34.4%).
| Income | Male | Female |
| $2,499 or less | 444 (1.7%) | 756 (4.3%) |
| $2,500 to $4,999 | 360 (1.4%) | 611 (3.5%) |
| $5,000 to $7,499 | 355 (1.4%) | 485 (2.8%) |
| $7,500 to $9,999 | 293 (1.1%) | 743 (4.2%) |
| $10,000 to $12,499 | 242 (0.9%) | 391 (2.2%) |
| $12,500 to $14,999 | 304 (1.2%) | 323 (1.8%) |
| $15,000 to $17,499 | 434 (1.7%) | 406 (2.3%) |
| $17,500 to $19,999 | 277 (1.1%) | 227 (1.3%) |
| $20,000 to $22,499 | 342 (1.3%) | 259 (1.5%) |
| $22,500 to $24,999 | 579 (2.2%) | 337 (1.9%) |
| $25,000 to $29,999 | 336 (1.3%) | 589 (3.4%) |
| $30,000 to $34,999 | 449 (1.7%) | 709 (4.0%) |
| $35,000 to $39,999 | 556 (2.1%) | 377 (2.1%) |
| $40,000 to $44,999 | 501 (1.9%) | 841 (4.8%) |
| $45,000 to $49,999 | 610 (2.4%) | 701 (4.0%) |
| $50,000 to $54,999 | 393 (1.5%) | 240 (1.4%) |
| $55,000 to $64,999 | 704 (2.7%) | 667 (3.8%) |
| $65,000 to $74,999 | 925 (3.6%) | 820 (4.7%) |
| $75,000 to $99,999 | 2,375 (9.2%) | 2,046 (11.7%) |
| $100,000+ | 15,344 (59.4%) | 6,032 (34.4%) |
| Total | 25,823 (100.0%) | 17,560 (100.0%) |
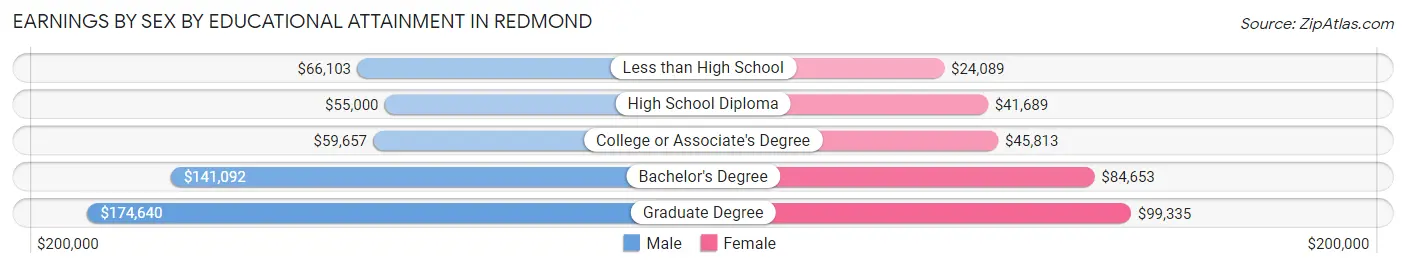
Earnings by Sex by Educational Attainment in Redmond
Average earnings in Redmond are $140,084 for men and $75,912 for women, a difference of 45.8%. Men with an educational attainment of graduate degree enjoy the highest average annual earnings of $174,640, while those with high school diploma education earn the least with $55,000. Women with an educational attainment of graduate degree earn the most with the average annual earnings of $99,335, while those with less than high school education have the smallest earnings of $24,089.
| Educational Attainment | Male Income | Female Income |
| Less than High School | $66,103 | $24,089 |
| High School Diploma | $55,000 | $41,689 |
| College or Associate's Degree | $59,657 | $45,813 |
| Bachelor's Degree | $141,092 | $84,653 |
| Graduate Degree | $174,640 | $99,335 |
| Total | $140,084 | $75,912 |
Family Income in Redmond
Family Income Brackets in Redmond
According to the Redmond family income data, there are 8,667 families falling into the $200,000+ income range, which is the most common income bracket and makes up 45.7% of all families. Conversely, the $10,000 to $14,999 income bracket is the least frequent group with only 171 families (0.9%) belonging to this category.
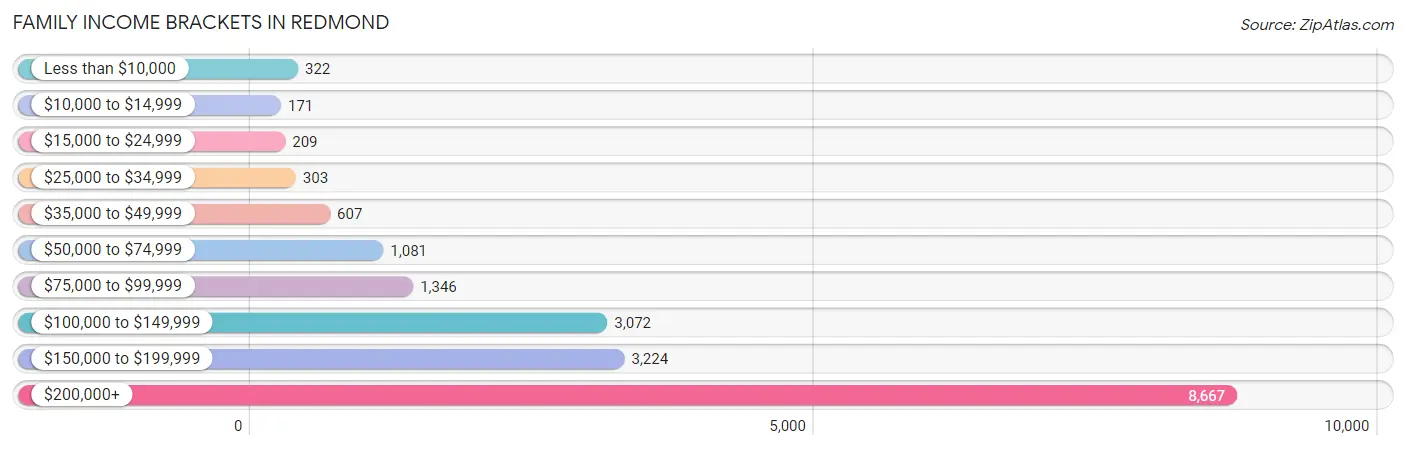
| Income Bracket | # Families | % Families |
| Less than $10,000 | 322 | 1.7% |
| $10,000 to $14,999 | 171 | 0.9% |
| $15,000 to $24,999 | 209 | 1.1% |
| $25,000 to $34,999 | 303 | 1.6% |
| $35,000 to $49,999 | 607 | 3.2% |
| $50,000 to $74,999 | 1,081 | 5.7% |
| $75,000 to $99,999 | 1,346 | 7.1% |
| $100,000 to $149,999 | 3,072 | 16.2% |
| $150,000 to $199,999 | 3,224 | 17.0% |
| $200,000+ | 8,667 | 45.7% |
Family Income by Famaliy Size in Redmond
6-person families (283 | 1.5%) account for the highest median family income in Redmond with $250,001 per family, while 2-person families (7,864 | 41.5%) have the highest median income of $72,488 per family member.
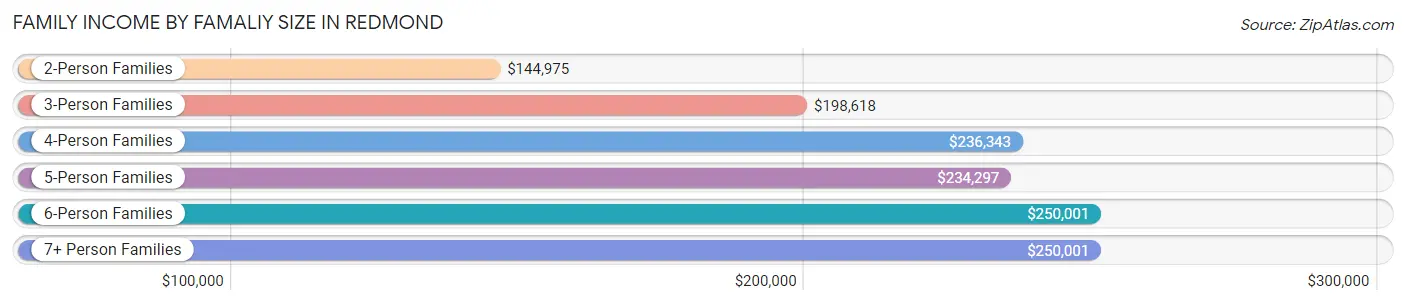
| Income Bracket | # Families | Median Income |
| 2-Person Families | 7,864 (41.5%) | $144,975 |
| 3-Person Families | 5,180 (27.3%) | $198,618 |
| 4-Person Families | 4,474 (23.6%) | $236,343 |
| 5-Person Families | 1,055 (5.6%) | $234,297 |
| 6-Person Families | 283 (1.5%) | $250,001 |
| 7+ Person Families | 108 (0.6%) | $250,001 |
| Total | 18,964 (100.0%) | $187,665 |
Family Income by Number of Earners in Redmond
The median family income in Redmond is $187,665, with families comprising 3+ earners (1,333) having the highest median family income of $250,001, while families with no earners (1,364) have the lowest median family income of $75,833, accounting for 7.0% and 7.2% of families, respectively.
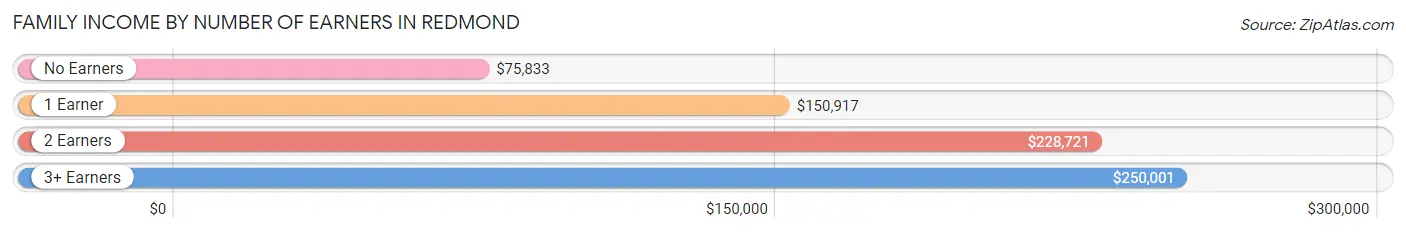
| Number of Earners | # Families | Median Income |
| No Earners | 1,364 (7.2%) | $75,833 |
| 1 Earner | 7,277 (38.4%) | $150,917 |
| 2 Earners | 8,990 (47.4%) | $228,721 |
| 3+ Earners | 1,333 (7.0%) | $250,001 |
| Total | 18,964 (100.0%) | $187,665 |
Household Income in Redmond
Household Income Brackets in Redmond
With 10,929 households falling in the category, the $200,000+ income range is the most frequent in Redmond, accounting for 36.2% of all households. In contrast, only 574 households (1.9%) fall into the $10,000 to $14,999 income bracket, making it the least populous group.

| Income Bracket | # Households | % Households |
| Less than $10,000 | 996 | 3.3% |
| $10,000 to $14,999 | 574 | 1.9% |
| $15,000 to $24,999 | 634 | 2.1% |
| $25,000 to $34,999 | 815 | 2.7% |
| $35,000 to $49,999 | 1,419 | 4.7% |
| $50,000 to $74,999 | 2,445 | 8.1% |
| $75,000 to $99,999 | 2,385 | 7.9% |
| $100,000 to $149,999 | 5,223 | 17.3% |
| $150,000 to $199,999 | 4,770 | 15.8% |
| $200,000+ | 10,929 | 36.2% |
Household Income by Householder Age in Redmond
The median household income in Redmond is $155,287, with the highest median household income of $190,955 found in the 45 to 64 years age bracket for the primary householder. A total of 8,486 households (28.1%) fall into this category. Meanwhile, the 65+ years age bracket for the primary householder has the lowest median household income of $63,750, with 4,788 households (15.9%) in this group.
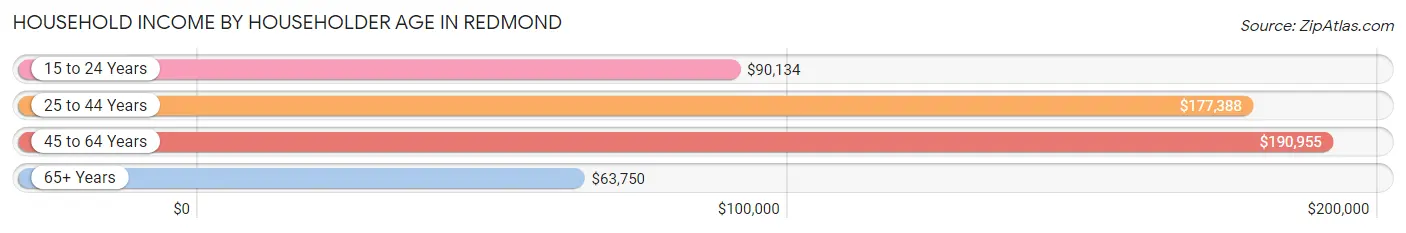
| Income Bracket | # Households | Median Income |
| 15 to 24 Years | 1,242 (4.1%) | $90,134 |
| 25 to 44 Years | 15,674 (51.9%) | $177,388 |
| 45 to 64 Years | 8,486 (28.1%) | $190,955 |
| 65+ Years | 4,788 (15.9%) | $63,750 |
| Total | 30,190 (100.0%) | $155,287 |
Poverty in Redmond
Income Below Poverty by Sex and Age in Redmond
With 4.9% poverty level for males and 6.9% for females among the residents of Redmond, 18 to 24 year old males and 18 to 24 year old females are the most vulnerable to poverty, with 439 males (14.5%) and 452 females (21.6%) in their respective age groups living below the poverty level.
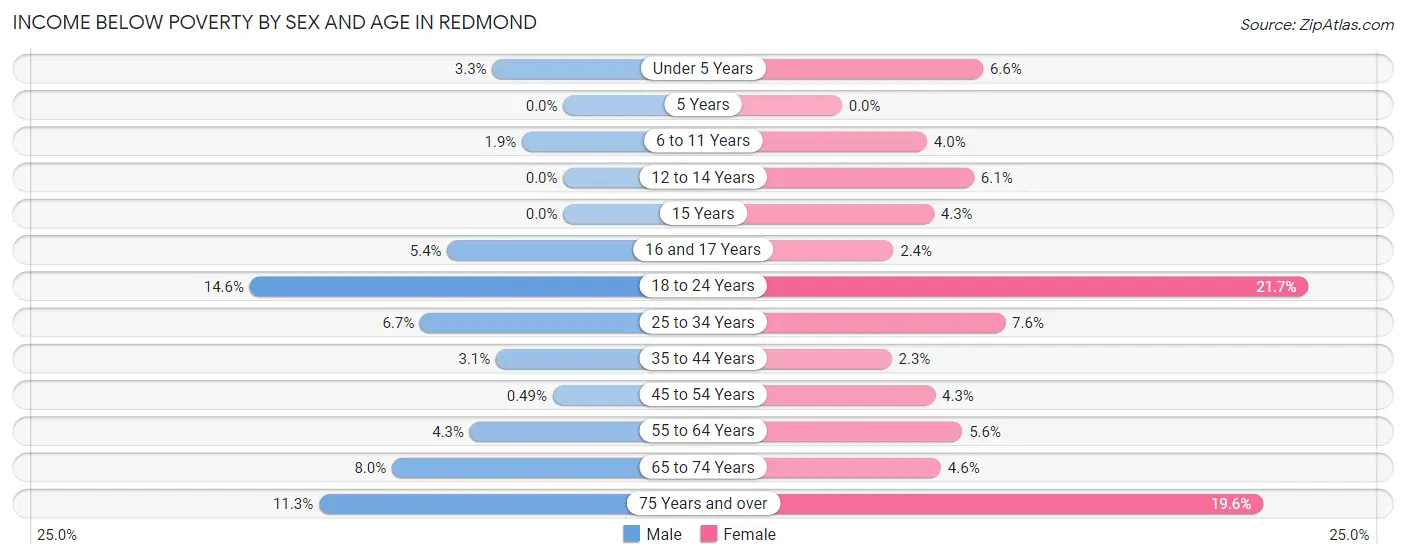
| Age Bracket | Male | Female |
| Under 5 Years | 91 (3.3%) | 152 (6.6%) |
| 5 Years | 0 (0.0%) | 0 (0.0%) |
| 6 to 11 Years | 61 (1.9%) | 107 (4.0%) |
| 12 to 14 Years | 0 (0.0%) | 73 (6.1%) |
| 15 Years | 0 (0.0%) | 22 (4.3%) |
| 16 and 17 Years | 31 (5.4%) | 19 (2.4%) |
| 18 to 24 Years | 439 (14.5%) | 452 (21.6%) |
| 25 to 34 Years | 560 (6.7%) | 558 (7.6%) |
| 35 to 44 Years | 227 (3.1%) | 139 (2.3%) |
| 45 to 54 Years | 21 (0.5%) | 173 (4.3%) |
| 55 to 64 Years | 149 (4.3%) | 181 (5.6%) |
| 65 to 74 Years | 161 (8.0%) | 110 (4.6%) |
| 75 Years and over | 141 (11.3%) | 433 (19.6%) |
| Total | 1,881 (4.9%) | 2,419 (6.9%) |
Income Above Poverty by Sex and Age in Redmond
According to the poverty statistics in Redmond, males aged 5 years and females aged 5 years are the age groups that are most secure financially, with 100.0% of males and 100.0% of females in these age groups living above the poverty line.
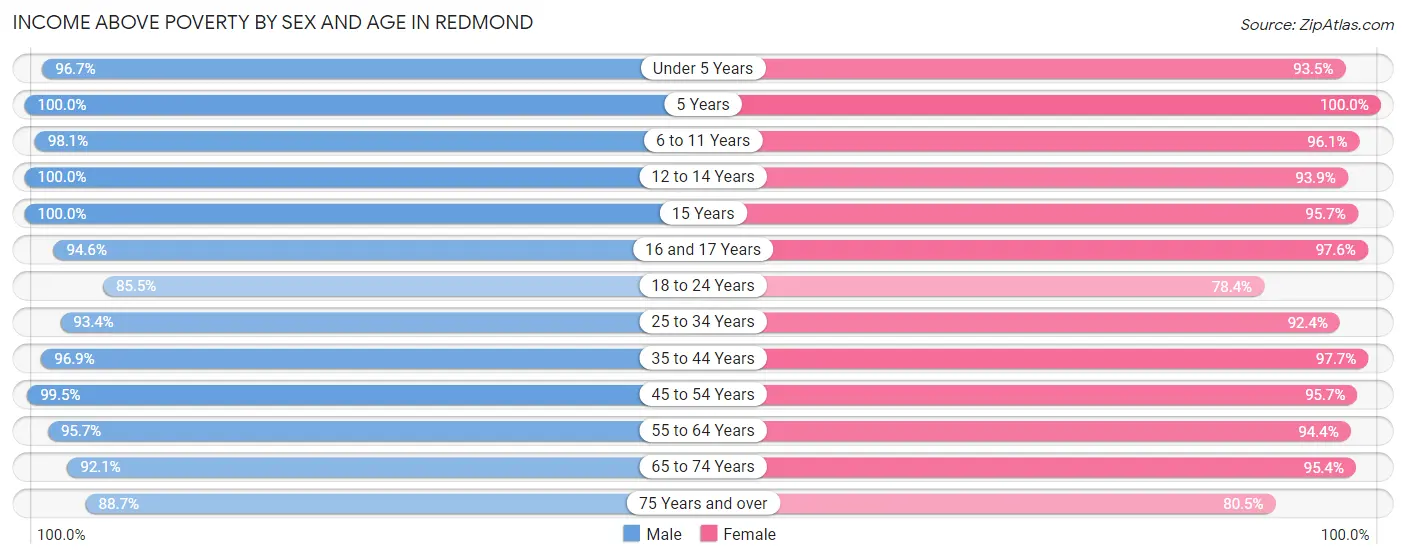
| Age Bracket | Male | Female |
| Under 5 Years | 2,675 (96.7%) | 2,169 (93.4%) |
| 5 Years | 507 (100.0%) | 258 (100.0%) |
| 6 to 11 Years | 3,138 (98.1%) | 2,599 (96.1%) |
| 12 to 14 Years | 1,111 (100.0%) | 1,117 (93.9%) |
| 15 Years | 471 (100.0%) | 493 (95.7%) |
| 16 and 17 Years | 545 (94.6%) | 777 (97.6%) |
| 18 to 24 Years | 2,578 (85.5%) | 1,636 (78.3%) |
| 25 to 34 Years | 7,865 (93.3%) | 6,800 (92.4%) |
| 35 to 44 Years | 7,040 (96.9%) | 5,883 (97.7%) |
| 45 to 54 Years | 4,286 (99.5%) | 3,818 (95.7%) |
| 55 to 64 Years | 3,285 (95.7%) | 3,055 (94.4%) |
| 65 to 74 Years | 1,864 (92.0%) | 2,283 (95.4%) |
| 75 Years and over | 1,102 (88.7%) | 1,782 (80.4%) |
| Total | 36,467 (95.1%) | 32,670 (93.1%) |
Income Below Poverty Among Married-Couple Families in Redmond
The poverty statistics for married-couple families in Redmond show that 2.4% or 385 of the total 16,401 families live below the poverty line. Families with no children have the highest poverty rate of 3.3%, comprising of 250 families. On the other hand, families with 5 or more children have the lowest poverty rate of 0.0%, which includes 0 families.
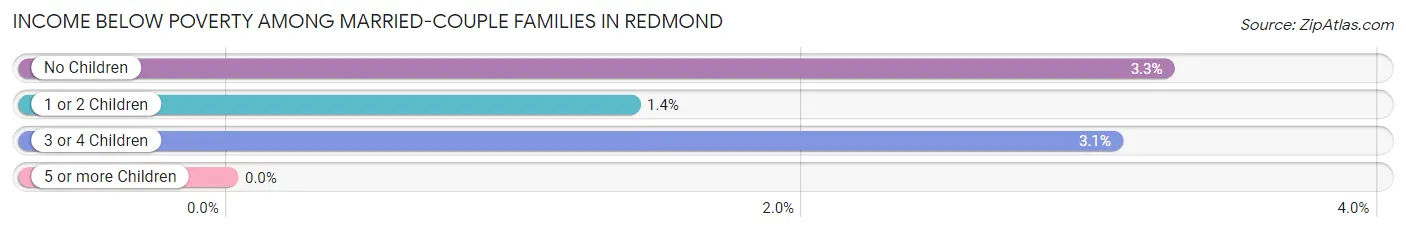
| Children | Above Poverty | Below Poverty |
| No Children | 7,407 (96.7%) | 250 (3.3%) |
| 1 or 2 Children | 7,821 (98.6%) | 111 (1.4%) |
| 3 or 4 Children | 754 (96.9%) | 24 (3.1%) |
| 5 or more Children | 34 (100.0%) | 0 (0.0%) |
| Total | 16,016 (97.7%) | 385 (2.4%) |
Income Below Poverty Among Single-Parent Households in Redmond
According to the poverty data in Redmond, 3.5% or 31 single-father households and 12.6% or 210 single-mother households are living below the poverty line. Among single-father households, those with no children have the highest poverty rate, with 31 households (5.9%) experiencing poverty. Likewise, among single-mother households, those with 3 or 4 children have the highest poverty rate, with 26 households (61.9%) falling below the poverty line.
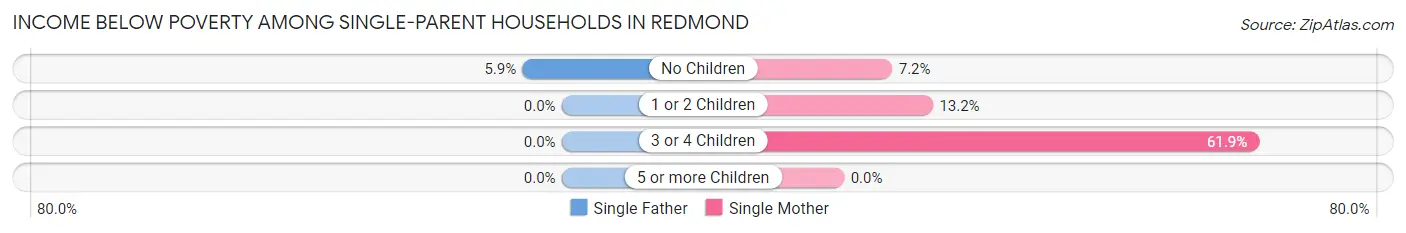
| Children | Single Father | Single Mother |
| No Children | 31 (5.9%) | 37 (7.2%) |
| 1 or 2 Children | 0 (0.0%) | 147 (13.2%) |
| 3 or 4 Children | 0 (0.0%) | 26 (61.9%) |
| 5 or more Children | 0 (0.0%) | 0 (0.0%) |
| Total | 31 (3.5%) | 210 (12.6%) |
Income Below Poverty Among Married-Couple vs Single-Parent Households in Redmond
The poverty data for Redmond shows that 385 of the married-couple family households (2.4%) and 241 of the single-parent households (9.4%) are living below the poverty level. Within the married-couple family households, those with no children have the highest poverty rate, with 250 households (3.3%) falling below the poverty line. Among the single-parent households, those with 3 or 4 children have the highest poverty rate, with 26 household (33.8%) living below poverty.
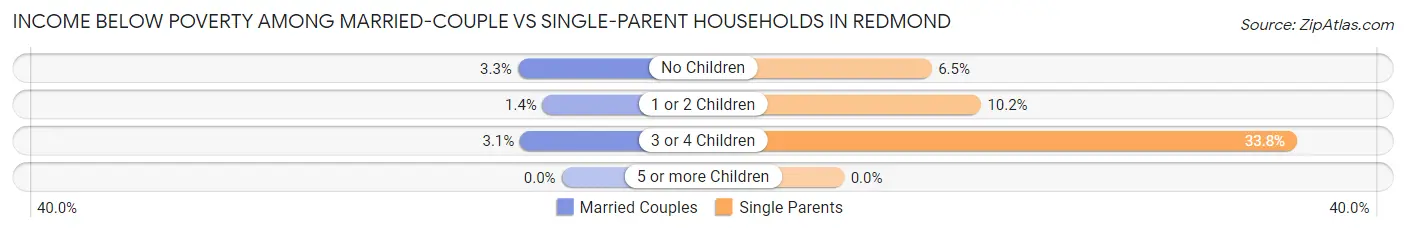
| Children | Married-Couple Families | Single-Parent Households |
| No Children | 250 (3.3%) | 68 (6.5%) |
| 1 or 2 Children | 111 (1.4%) | 147 (10.2%) |
| 3 or 4 Children | 24 (3.1%) | 26 (33.8%) |
| 5 or more Children | 0 (0.0%) | 0 (0.0%) |
| Total | 385 (2.4%) | 241 (9.4%) |
Race in Redmond
The most populous races in Redmond are White / Caucasian (37,337 | 50.6%), Asian (28,244 | 38.3%), and Hispanic or Latino (5,632 | 7.6%).

| Race | # Population | % Population |
| Asian | 28,244 | 38.3% |
| Black / African American | 1,620 | 2.2% |
| Hawaiian / Pacific | 39 | 0.1% |
| Hispanic or Latino | 5,632 | 7.6% |
| Native / Alaskan | 408 | 0.5% |
| White / Caucasian | 37,337 | 50.6% |
| Two or more Races | 4,411 | 6.0% |
| Some other Race | 1,669 | 2.3% |
| Total | 73,728 | 100.0% |
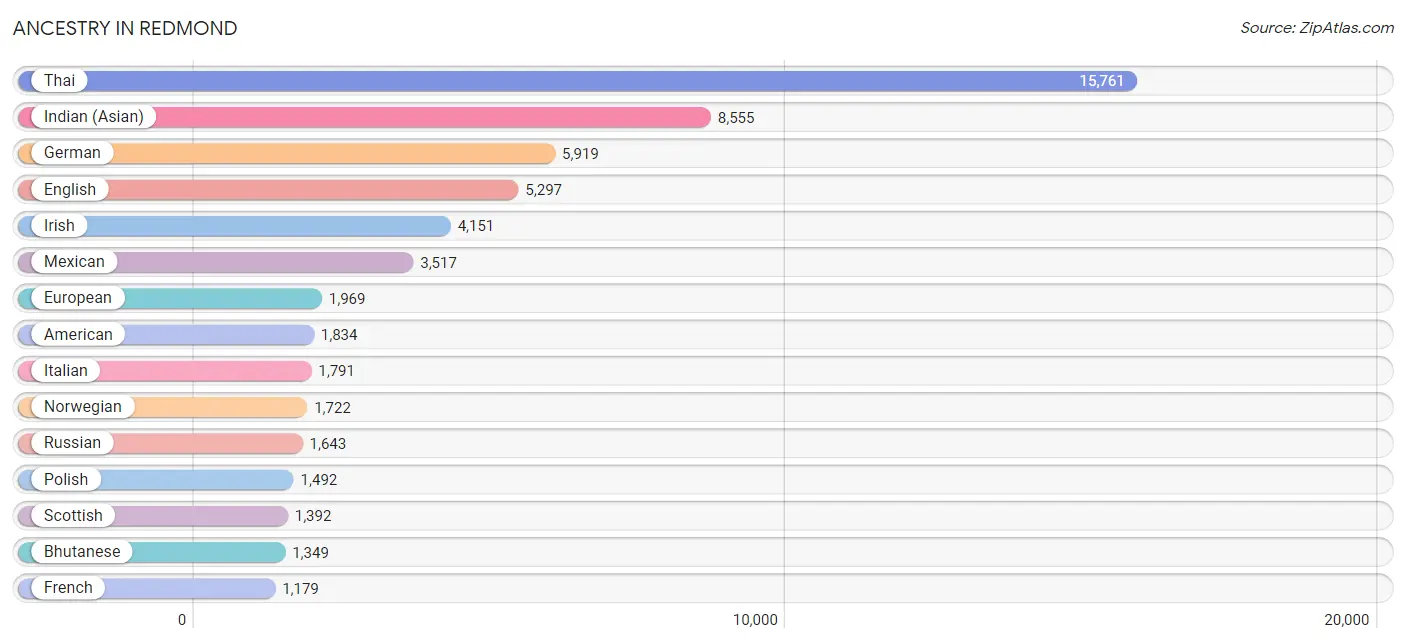
Ancestry in Redmond
The most populous ancestries reported in Redmond are Thai (15,761 | 21.4%), Indian (Asian) (8,555 | 11.6%), German (5,919 | 8.0%), English (5,297 | 7.2%), and Irish (4,151 | 5.6%), together accounting for 53.8% of all Redmond residents.
| Ancestry | # Population | % Population |
| African | 404 | 0.5% |
| Albanian | 2 | 0.0% |
| Aleut | 9 | 0.0% |
| American | 1,834 | 2.5% |
| Arab | 1,041 | 1.4% |
| Argentinean | 85 | 0.1% |
| Armenian | 298 | 0.4% |
| Australian | 17 | 0.0% |
| Austrian | 103 | 0.1% |
| Basque | 20 | 0.0% |
| Belgian | 128 | 0.2% |
| Bhutanese | 1,349 | 1.8% |
| Blackfeet | 56 | 0.1% |
| Brazilian | 241 | 0.3% |
| British | 493 | 0.7% |
| Bulgarian | 134 | 0.2% |
| Burmese | 1,059 | 1.4% |
| Cambodian | 71 | 0.1% |
| Canadian | 477 | 0.6% |
| Central American | 802 | 1.1% |
| Central American Indian | 34 | 0.1% |
| Cherokee | 114 | 0.2% |
| Chilean | 40 | 0.1% |
| Chippewa | 19 | 0.0% |
| Choctaw | 20 | 0.0% |
| Colombian | 491 | 0.7% |
| Colville | 80 | 0.1% |
| Cree | 13 | 0.0% |
| Croatian | 108 | 0.2% |
| Cuban | 72 | 0.1% |
| Czech | 301 | 0.4% |
| Czechoslovakian | 10 | 0.0% |
| Danish | 177 | 0.2% |
| Dominican | 44 | 0.1% |
| Dutch | 944 | 1.3% |
| Eastern European | 374 | 0.5% |
| Ecuadorian | 81 | 0.1% |
| Egyptian | 228 | 0.3% |
| English | 5,297 | 7.2% |
| Estonian | 35 | 0.1% |
| Ethiopian | 102 | 0.1% |
| European | 1,969 | 2.7% |
| Filipino | 802 | 1.1% |
| Finnish | 476 | 0.6% |
| French | 1,179 | 1.6% |
| French American Indian | 41 | 0.1% |
| French Canadian | 211 | 0.3% |
| German | 5,919 | 8.0% |
| Greek | 171 | 0.2% |
| Guamanian / Chamorro | 43 | 0.1% |
| Guatemalan | 51 | 0.1% |
| Honduran | 208 | 0.3% |
| Hungarian | 198 | 0.3% |
| Icelander | 69 | 0.1% |
| Indian (Asian) | 8,555 | 11.6% |
| Iranian | 405 | 0.5% |
| Iraqi | 133 | 0.2% |
| Irish | 4,151 | 5.6% |
| Iroquois | 13 | 0.0% |
| Israeli | 575 | 0.8% |
| Italian | 1,791 | 2.4% |
| Jamaican | 31 | 0.0% |
| Japanese | 58 | 0.1% |
| Jordanian | 16 | 0.0% |
| Kenyan | 110 | 0.2% |
| Korean | 1,094 | 1.5% |
| Laotian | 47 | 0.1% |
| Latvian | 27 | 0.0% |
| Lebanese | 83 | 0.1% |
| Lithuanian | 92 | 0.1% |
| Luxembourger | 13 | 0.0% |
| Malaysian | 14 | 0.0% |
| Maltese | 42 | 0.1% |
| Mexican | 3,517 | 4.8% |
| Mexican American Indian | 120 | 0.2% |
| Mongolian | 15 | 0.0% |
| Moroccan | 51 | 0.1% |
| Native Hawaiian | 242 | 0.3% |
| New Zealander | 27 | 0.0% |
| Nicaraguan | 58 | 0.1% |
| Nigerian | 20 | 0.0% |
| Northern European | 301 | 0.4% |
| Norwegian | 1,722 | 2.3% |
| Pakistani | 137 | 0.2% |
| Palestinian | 94 | 0.1% |
| Panamanian | 262 | 0.4% |
| Peruvian | 63 | 0.1% |
| Polish | 1,492 | 2.0% |
| Portuguese | 92 | 0.1% |
| Potawatomi | 10 | 0.0% |
| Puerto Rican | 105 | 0.1% |
| Romanian | 615 | 0.8% |
| Russian | 1,643 | 2.2% |
| Salvadoran | 223 | 0.3% |
| Samoan | 72 | 0.1% |
| Scandinavian | 190 | 0.3% |
| Scotch-Irish | 405 | 0.5% |
| Scottish | 1,392 | 1.9% |
| Slavic | 55 | 0.1% |
| Slovak | 89 | 0.1% |
| Slovene | 51 | 0.1% |
| South African | 77 | 0.1% |
| South American | 816 | 1.1% |
| Spaniard | 221 | 0.3% |
| Spanish | 52 | 0.1% |
| Sri Lankan | 522 | 0.7% |
| Subsaharan African | 888 | 1.2% |
| Sudanese | 112 | 0.2% |
| Swedish | 1,105 | 1.5% |
| Swiss | 125 | 0.2% |
| Syrian | 138 | 0.2% |
| Thai | 15,761 | 21.4% |
| Turkish | 691 | 0.9% |
| Ukrainian | 871 | 1.2% |
| Venezuelan | 56 | 0.1% |
| Welsh | 452 | 0.6% |
| Yakama | 29 | 0.0% | View All 117 Rows |
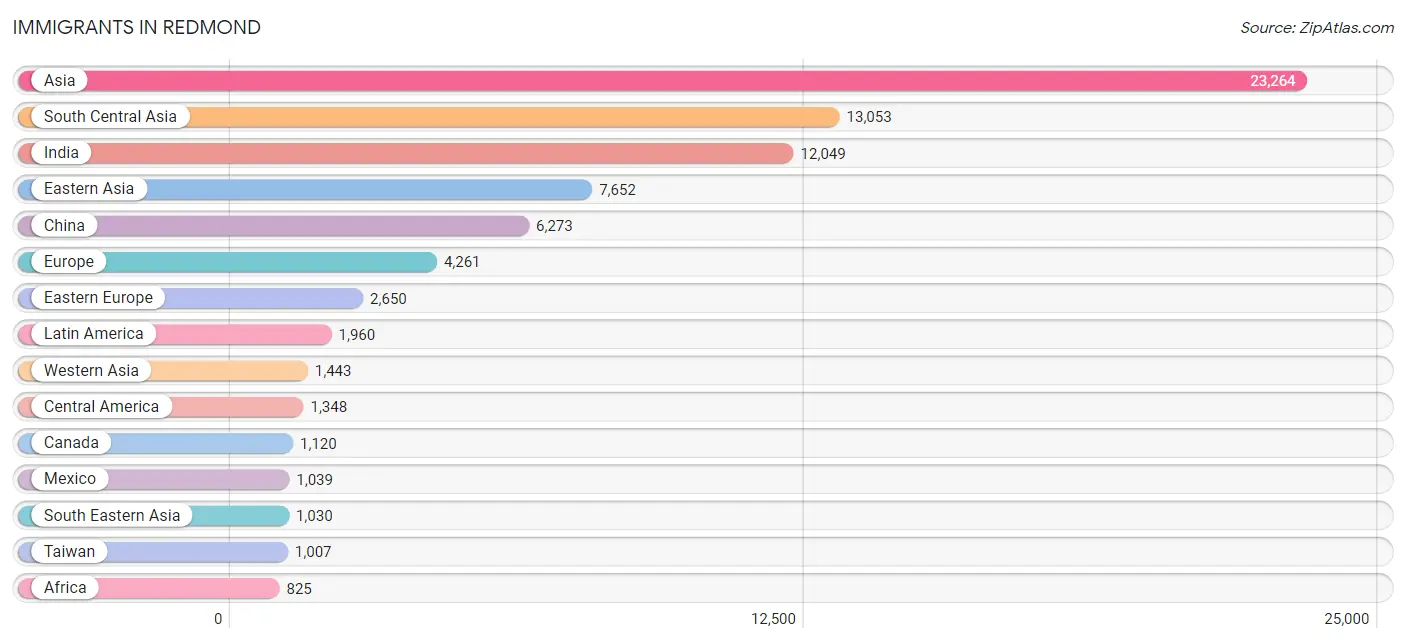
Immigrants in Redmond
The most numerous immigrant groups reported in Redmond came from Asia (23,264 | 31.6%), South Central Asia (13,053 | 17.7%), India (12,049 | 16.3%), Eastern Asia (7,652 | 10.4%), and China (6,273 | 8.5%), together accounting for 84.5% of all Redmond residents.
| Immigration Origin | # Population | % Population |
| Africa | 825 | 1.1% |
| Argentina | 101 | 0.1% |
| Armenia | 36 | 0.1% |
| Asia | 23,264 | 31.6% |
| Australia | 141 | 0.2% |
| Austria | 18 | 0.0% |
| Belarus | 175 | 0.2% |
| Belgium | 22 | 0.0% |
| Brazil | 225 | 0.3% |
| Bulgaria | 134 | 0.2% |
| Cambodia | 29 | 0.0% |
| Canada | 1,120 | 1.5% |
| Caribbean | 13 | 0.0% |
| Central America | 1,348 | 1.8% |
| Chile | 29 | 0.0% |
| China | 6,273 | 8.5% |
| Colombia | 119 | 0.2% |
| Czechoslovakia | 41 | 0.1% |
| Denmark | 11 | 0.0% |
| Eastern Africa | 305 | 0.4% |
| Eastern Asia | 7,652 | 10.4% |
| Eastern Europe | 2,650 | 3.6% |
| Ecuador | 36 | 0.1% |
| Egypt | 225 | 0.3% |
| El Salvador | 86 | 0.1% |
| England | 166 | 0.2% |
| Ethiopia | 104 | 0.1% |
| Europe | 4,261 | 5.8% |
| France | 140 | 0.2% |
| Germany | 200 | 0.3% |
| Greece | 5 | 0.0% |
| Guatemala | 15 | 0.0% |
| Honduras | 208 | 0.3% |
| Hong Kong | 361 | 0.5% |
| India | 12,049 | 16.3% |
| Indonesia | 17 | 0.0% |
| Iran | 339 | 0.5% |
| Iraq | 139 | 0.2% |
| Ireland | 231 | 0.3% |
| Israel | 567 | 0.8% |
| Italy | 80 | 0.1% |
| Jamaica | 13 | 0.0% |
| Japan | 649 | 0.9% |
| Kazakhstan | 61 | 0.1% |
| Kenya | 120 | 0.2% |
| Korea | 700 | 0.9% |
| Kuwait | 11 | 0.0% |
| Laos | 18 | 0.0% |
| Latin America | 1,960 | 2.7% |
| Latvia | 54 | 0.1% |
| Lebanon | 75 | 0.1% |
| Lithuania | 34 | 0.1% |
| Malaysia | 101 | 0.1% |
| Mexico | 1,039 | 1.4% |
| Moldova | 23 | 0.0% |
| Morocco | 51 | 0.1% |
| Nepal | 50 | 0.1% |
| Netherlands | 310 | 0.4% |
| Northern Africa | 363 | 0.5% |
| Northern Europe | 752 | 1.0% |
| Oceania | 176 | 0.2% |
| Pakistan | 353 | 0.5% |
| Peru | 68 | 0.1% |
| Philippines | 433 | 0.6% |
| Poland | 220 | 0.3% |
| Romania | 428 | 0.6% |
| Russia | 752 | 1.0% |
| Saudi Arabia | 27 | 0.0% |
| Scotland | 83 | 0.1% |
| Singapore | 103 | 0.1% |
| South Africa | 119 | 0.2% |
| South America | 599 | 0.8% |
| South Central Asia | 13,053 | 17.7% |
| South Eastern Asia | 1,030 | 1.4% |
| Southern Europe | 141 | 0.2% |
| Spain | 56 | 0.1% |
| Sri Lanka | 16 | 0.0% |
| Sudan | 39 | 0.1% |
| Sweden | 23 | 0.0% |
| Switzerland | 7 | 0.0% |
| Syria | 85 | 0.1% |
| Taiwan | 1,007 | 1.4% |
| Thailand | 34 | 0.1% |
| Turkey | 404 | 0.5% |
| Uganda | 11 | 0.0% |
| Ukraine | 629 | 0.9% |
| Uzbekistan | 130 | 0.2% |
| Venezuela | 21 | 0.0% |
| Vietnam | 295 | 0.4% |
| Western Africa | 20 | 0.0% |
| Western Asia | 1,443 | 2.0% |
| Western Europe | 718 | 1.0% |
| Zimbabwe | 28 | 0.0% | View All 93 Rows |
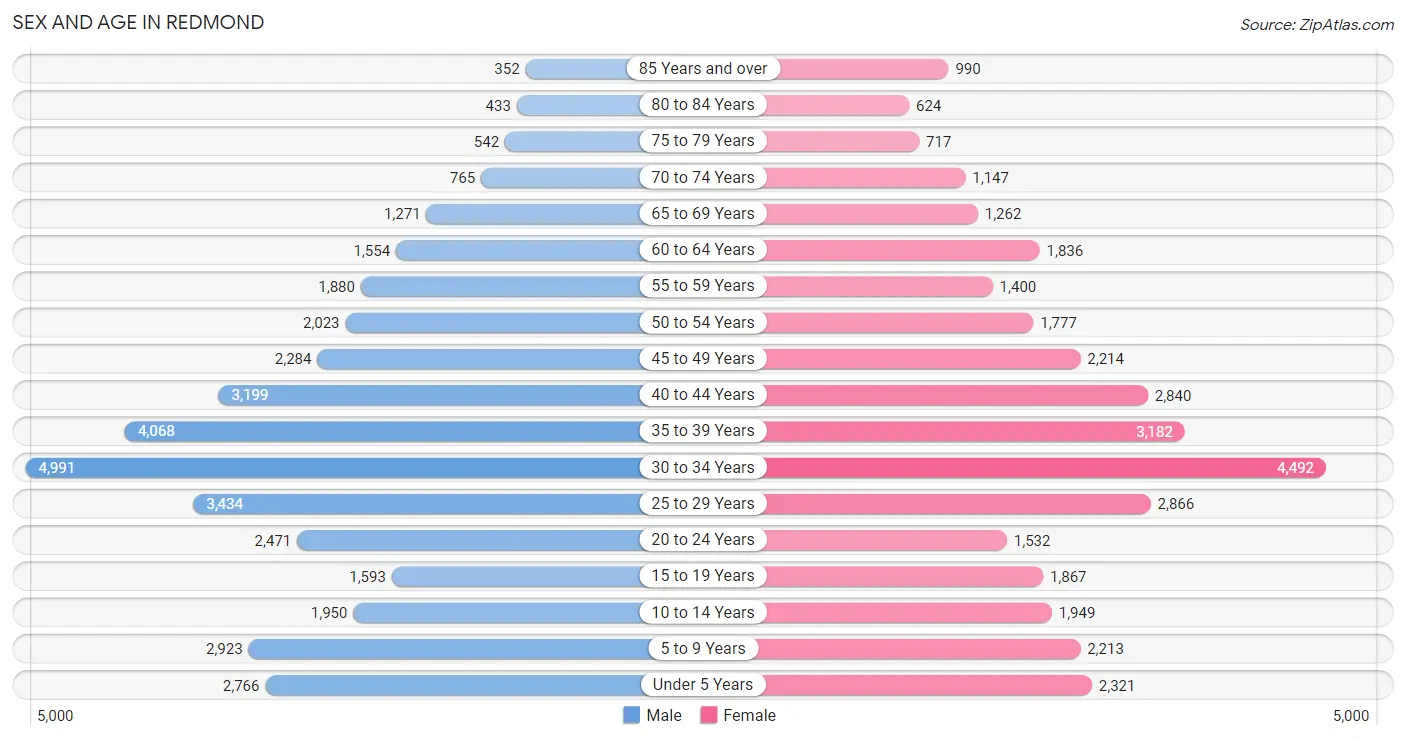
Sex and Age in Redmond
Sex and Age in Redmond
The most populous age groups in Redmond are 30 to 34 Years (4,991 | 13.0%) for men and 30 to 34 Years (4,492 | 12.8%) for women.
| Age Bracket | Male | Female |
| Under 5 Years | 2,766 (7.2%) | 2,321 (6.6%) |
| 5 to 9 Years | 2,923 (7.6%) | 2,213 (6.3%) |
| 10 to 14 Years | 1,950 (5.1%) | 1,949 (5.5%) |
| 15 to 19 Years | 1,593 (4.1%) | 1,867 (5.3%) |
| 20 to 24 Years | 2,471 (6.4%) | 1,532 (4.3%) |
| 25 to 29 Years | 3,434 (8.9%) | 2,866 (8.1%) |
| 30 to 34 Years | 4,991 (13.0%) | 4,492 (12.8%) |
| 35 to 39 Years | 4,068 (10.6%) | 3,182 (9.0%) |
| 40 to 44 Years | 3,199 (8.3%) | 2,840 (8.1%) |
| 45 to 49 Years | 2,284 (5.9%) | 2,214 (6.3%) |
| 50 to 54 Years | 2,023 (5.2%) | 1,777 (5.0%) |
| 55 to 59 Years | 1,880 (4.9%) | 1,400 (4.0%) |
| 60 to 64 Years | 1,554 (4.0%) | 1,836 (5.2%) |
| 65 to 69 Years | 1,271 (3.3%) | 1,262 (3.6%) |
| 70 to 74 Years | 765 (2.0%) | 1,147 (3.3%) |
| 75 to 79 Years | 542 (1.4%) | 717 (2.0%) |
| 80 to 84 Years | 433 (1.1%) | 624 (1.8%) |
| 85 Years and over | 352 (0.9%) | 990 (2.8%) |
| Total | 38,499 (100.0%) | 35,229 (100.0%) |
Families and Households in Redmond
Median Family Size in Redmond
The median family size in Redmond is 3.02 persons per family, with married-couple families (16,401 | 86.5%) accounting for the largest median family size of 3.08 persons per family. On the other hand, single male/father families (894 | 4.7%) represent the smallest median family size with 2.42 persons per family.
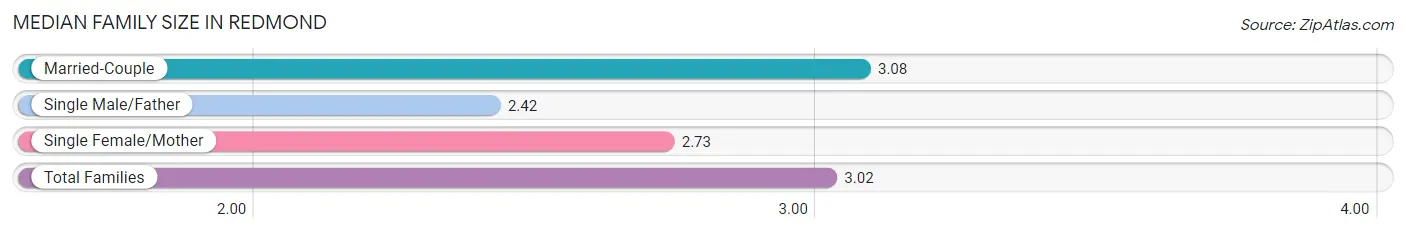
| Family Type | # Families | Family Size |
| Married-Couple | 16,401 (86.5%) | 3.08 |
| Single Male/Father | 894 (4.7%) | 2.42 |
| Single Female/Mother | 1,669 (8.8%) | 2.73 |
| Total Families | 18,964 (100.0%) | 3.02 |
Median Household Size in Redmond
The median household size in Redmond is 2.43 persons per household, with married-couple households (16,401 | 54.3%) accounting for the largest median household size of 3.09 persons per household. non-family households (11,226 | 37.2%) represent the smallest median household size with 1.36 persons per household.
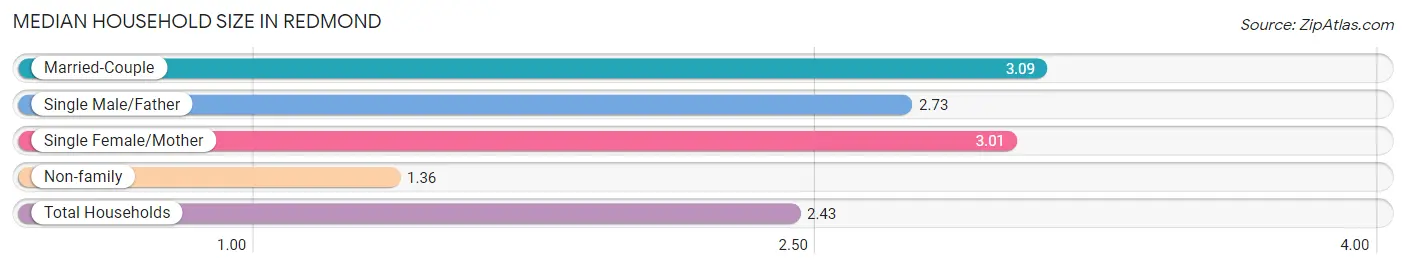
| Household Type | # Households | Household Size |
| Married-Couple | 16,401 (54.3%) | 3.09 |
| Single Male/Father | 894 (3.0%) | 2.73 |
| Single Female/Mother | 1,669 (5.5%) | 3.01 |
| Non-family | 11,226 (37.2%) | 1.36 |
| Total Households | 30,190 (100.0%) | 2.43 |
Household Size by Marriage Status in Redmond
Out of a total of 30,190 households in Redmond, 18,964 (62.8%) are family households, while 11,226 (37.2%) are nonfamily households. The most numerous type of family households are 2-person households, comprising 7,501, and the most common type of nonfamily households are 1-person households, comprising 8,201.
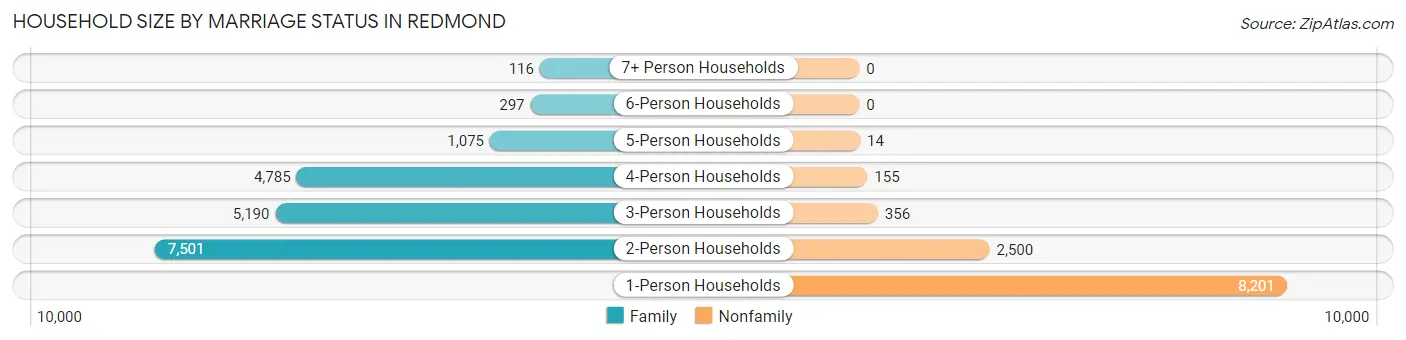
| Household Size | Family Households | Nonfamily Households |
| 1-Person Households | - | 8,201 (27.2%) |
| 2-Person Households | 7,501 (24.8%) | 2,500 (8.3%) |
| 3-Person Households | 5,190 (17.2%) | 356 (1.2%) |
| 4-Person Households | 4,785 (15.9%) | 155 (0.5%) |
| 5-Person Households | 1,075 (3.6%) | 14 (0.1%) |
| 6-Person Households | 297 (1.0%) | 0 (0.0%) |
| 7+ Person Households | 116 (0.4%) | 0 (0.0%) |
| Total | 18,964 (62.8%) | 11,226 (37.2%) |
Female Fertility in Redmond
Fertility by Age in Redmond
Average fertility rate in Redmond is 61.0 births per 1,000 women. Women in the age bracket of 20 to 34 years have the highest fertility rate with 98.0 births per 1,000 women. Women in the age bracket of 20 to 34 years acount for 74.0% of all women with births.
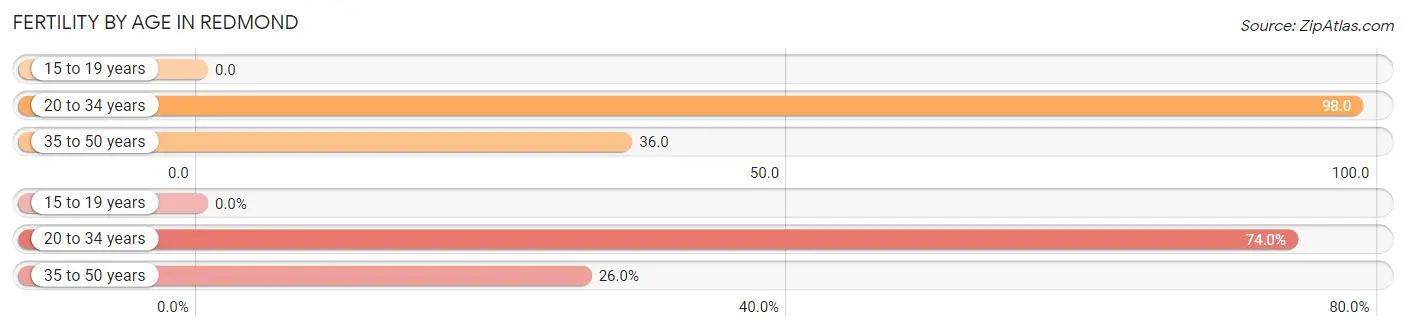
| Age Bracket | Women with Births | Births / 1,000 Women |
| 15 to 19 years | 0 (0.0%) | 0.0 |
| 20 to 34 years | 872 (74.0%) | 98.0 |
| 35 to 50 years | 307 (26.0%) | 36.0 |
| Total | 1,179 (100.0%) | 61.0 |
Fertility by Age by Marriage Status in Redmond
86.3% of women with births (1,179) in Redmond are married. The highest percentage of unmarried women with births falls into 35 to 50 years age bracket with 23.4% of them unmarried at the time of birth, while the lowest percentage of unmarried women with births belong to 20 to 34 years age bracket with 10.3% of them unmarried.
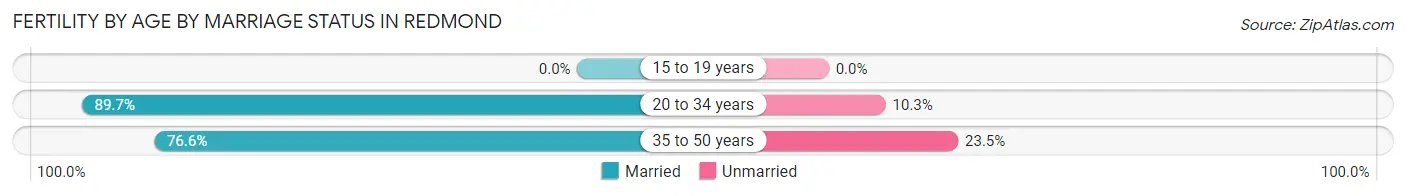
| Age Bracket | Married | Unmarried |
| 15 to 19 years | 0 (0.0%) | 0 (0.0%) |
| 20 to 34 years | 782 (89.7%) | 90 (10.3%) |
| 35 to 50 years | 235 (76.5%) | 72 (23.4%) |
| Total | 1,017 (86.3%) | 162 (13.7%) |
Fertility by Education in Redmond
Average fertility rate in Redmond is 61.0 births per 1,000 women. Women with the education attainment of bachelor's degree have the highest fertility rate of 79.0 births per 1,000 women, while women with the education attainment of high school diploma have the lowest fertility at 25.0 births per 1,000 women. Women with the education attainment of bachelor's degree represent 45.9% of all women with births.
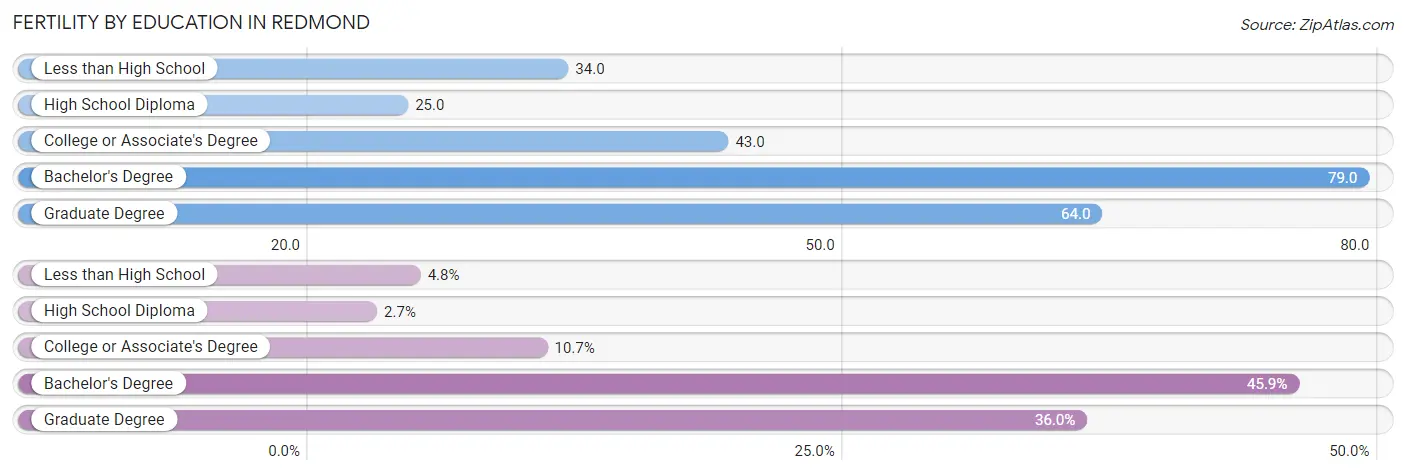
| Educational Attainment | Women with Births | Births / 1,000 Women |
| Less than High School | 56 (4.8%) | 34.0 |
| High School Diploma | 32 (2.7%) | 25.0 |
| College or Associate's Degree | 126 (10.7%) | 43.0 |
| Bachelor's Degree | 541 (45.9%) | 79.0 |
| Graduate Degree | 424 (36.0%) | 64.0 |
| Total | 1,179 (100.0%) | 61.0 |
Fertility by Education by Marriage Status in Redmond
13.7% of women with births in Redmond are unmarried. Women with the educational attainment of college or associate's degree are most likely to be married with 100.0% of them married at childbirth, while women with the educational attainment of less than high school are least likely to be married with 67.9% of them unmarried at childbirth.
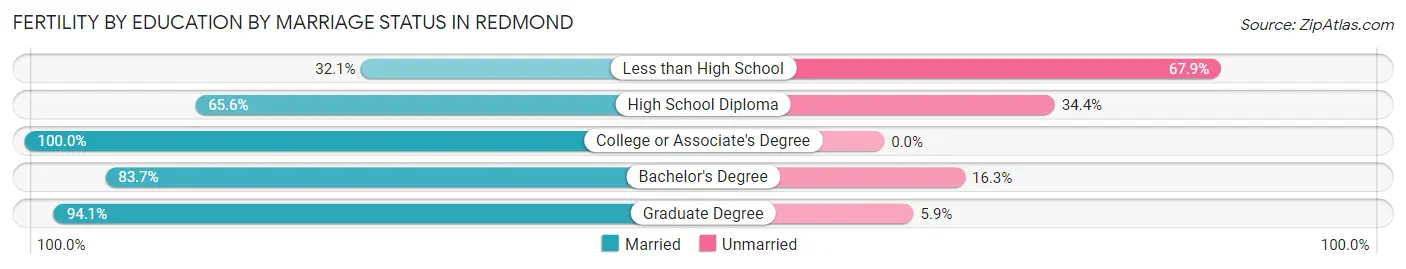
| Educational Attainment | Married | Unmarried |
| Less than High School | 18 (32.1%) | 38 (67.9%) |
| High School Diploma | 21 (65.6%) | 11 (34.4%) |
| College or Associate's Degree | 126 (100.0%) | 0 (0.0%) |
| Bachelor's Degree | 453 (83.7%) | 88 (16.3%) |
| Graduate Degree | 399 (94.1%) | 25 (5.9%) |
| Total | 1,017 (86.3%) | 162 (13.7%) |
Employment Characteristics in Redmond
Employment by Class of Employer in Redmond
Among the 38,785 employed individuals in Redmond, private company employees (32,417 | 83.6%), not-for-profit organizations (1,963 | 5.1%), and local government employees (1,214 | 3.1%) make up the most common classes of employment.
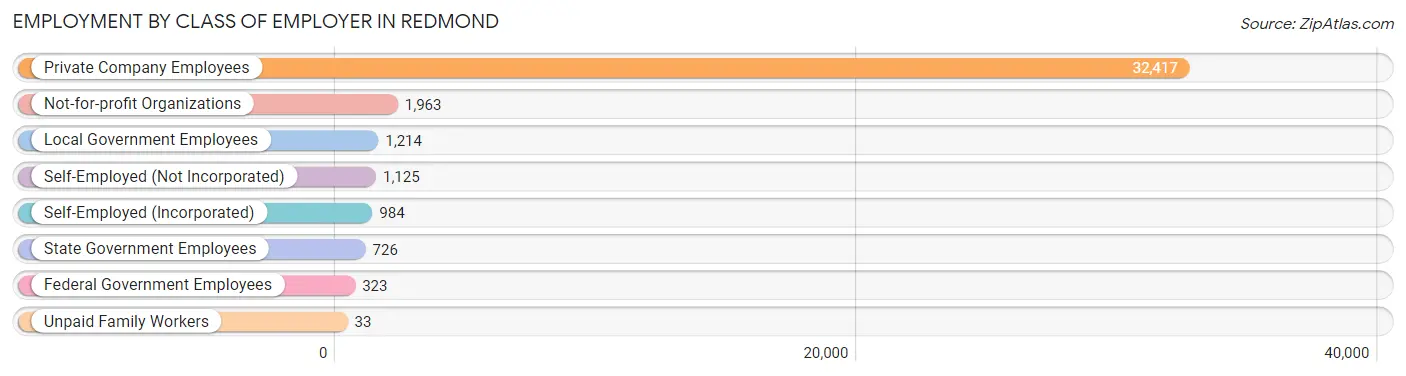
| Employer Class | # Employees | % Employees |
| Private Company Employees | 32,417 | 83.6% |
| Self-Employed (Incorporated) | 984 | 2.5% |
| Self-Employed (Not Incorporated) | 1,125 | 2.9% |
| Not-for-profit Organizations | 1,963 | 5.1% |
| Local Government Employees | 1,214 | 3.1% |
| State Government Employees | 726 | 1.9% |
| Federal Government Employees | 323 | 0.8% |
| Unpaid Family Workers | 33 | 0.1% |
| Total | 38,785 | 100.0% |
Employment Status by Age in Redmond
According to the labor force statistics for Redmond, out of the total population over 16 years of age (58,620), 70.4% or 41,268 individuals are in the labor force, with 3.7% or 1,527 of them unemployed. The age group with the highest labor force participation rate is 25 to 29 years, with 87.4% or 5,506 individuals in the labor force. Within the labor force, the 45 to 54 years age range has the highest percentage of unemployed individuals, with 6.7% or 467 of them being unemployed.
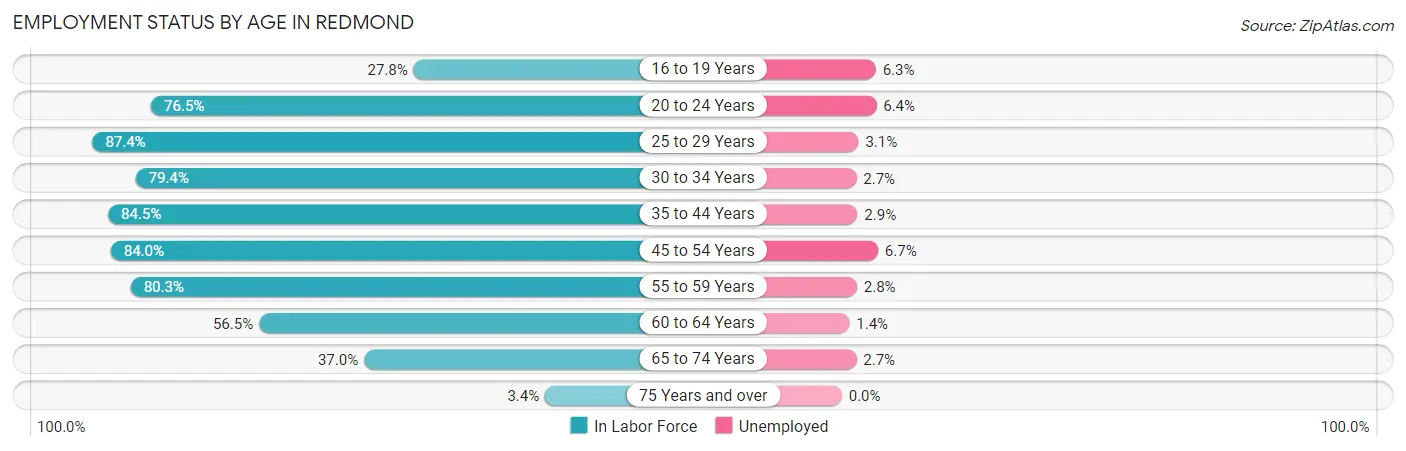
| Age Bracket | In Labor Force | Unemployed |
| 16 to 19 Years | 688 (27.8%) | 43 (6.3%) |
| 20 to 24 Years | 3,062 (76.5%) | 196 (6.4%) |
| 25 to 29 Years | 5,506 (87.4%) | 171 (3.1%) |
| 30 to 34 Years | 7,530 (79.4%) | 203 (2.7%) |
| 35 to 44 Years | 11,229 (84.5%) | 326 (2.9%) |
| 45 to 54 Years | 6,970 (84.0%) | 467 (6.7%) |
| 55 to 59 Years | 2,634 (80.3%) | 74 (2.8%) |
| 60 to 64 Years | 1,915 (56.5%) | 27 (1.4%) |
| 65 to 74 Years | 1,645 (37.0%) | 44 (2.7%) |
| 75 Years and over | 124 (3.4%) | 0 (0.0%) |
| Total | 41,268 (70.4%) | 1,527 (3.7%) |
Employment Status by Educational Attainment in Redmond
According to labor force statistics for Redmond, 81.2% of individuals (35,760) out of the total population between 25 and 64 years of age (44,040) are in the labor force, with 3.5% or 1,252 of them being unemployed. The group with the highest labor force participation rate are those with the educational attainment of bachelor's degree or higher, with 82.9% or 28,089 individuals in the labor force. Within the labor force, individuals with high school diploma education have the highest percentage of unemployment, with 12.8% or 220 of them being unemployed.
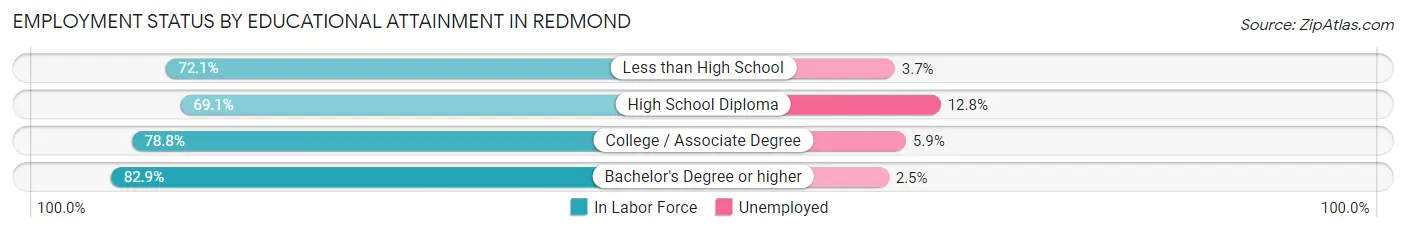
| Educational Attainment | In Labor Force | Unemployed |
| Less than High School | 642 (72.1%) | 33 (3.7%) |
| High School Diploma | 1,716 (69.1%) | 318 (12.8%) |
| College / Associate Degree | 5,345 (78.8%) | 400 (5.9%) |
| Bachelor's Degree or higher | 28,089 (82.9%) | 847 (2.5%) |
| Total | 35,760 (81.2%) | 1,541 (3.5%) |
Employment Occupations by Sex in Redmond
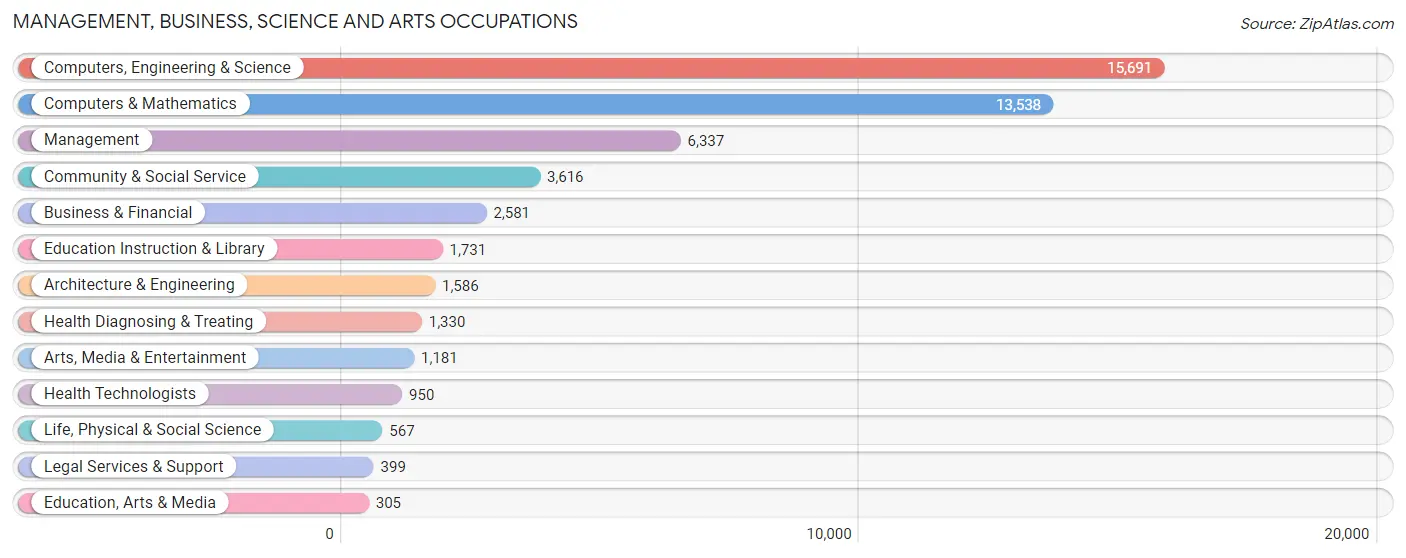
Management, Business, Science and Arts Occupations
The most common Management, Business, Science and Arts occupations in Redmond are Computers, Engineering & Science (15,691 | 39.6%), Computers & Mathematics (13,538 | 34.1%), Management (6,337 | 16.0%), Community & Social Service (3,616 | 9.1%), and Business & Financial (2,581 | 6.5%).
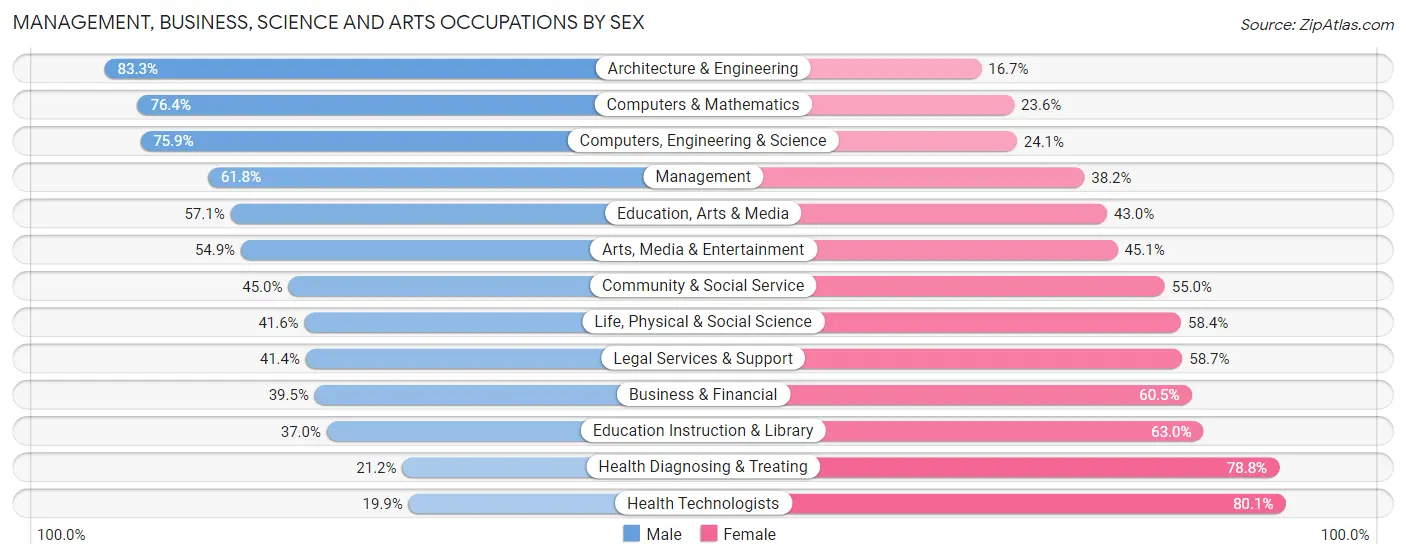
Management, Business, Science and Arts Occupations by Sex
Within the Management, Business, Science and Arts occupations in Redmond, the most male-oriented occupations are Architecture & Engineering (83.3%), Computers & Mathematics (76.4%), and Computers, Engineering & Science (75.9%), while the most female-oriented occupations are Health Technologists (80.1%), Health Diagnosing & Treating (78.8%), and Education Instruction & Library (63.0%).
| Occupation | Male | Female |
| Management | 3,915 (61.8%) | 2,422 (38.2%) |
| Business & Financial | 1,019 (39.5%) | 1,562 (60.5%) |
| Computers, Engineering & Science | 11,904 (75.9%) | 3,787 (24.1%) |
| Computers & Mathematics | 10,347 (76.4%) | 3,191 (23.6%) |
| Architecture & Engineering | 1,321 (83.3%) | 265 (16.7%) |
| Life, Physical & Social Science | 236 (41.6%) | 331 (58.4%) |
| Community & Social Service | 1,627 (45.0%) | 1,989 (55.0%) |
| Education, Arts & Media | 174 (57.1%) | 131 (42.9%) |
| Legal Services & Support | 165 (41.3%) | 234 (58.7%) |
| Education Instruction & Library | 640 (37.0%) | 1,091 (63.0%) |
| Arts, Media & Entertainment | 648 (54.9%) | 533 (45.1%) |
| Health Diagnosing & Treating | 282 (21.2%) | 1,048 (78.8%) |
| Health Technologists | 189 (19.9%) | 761 (80.1%) |
| Total (Category) | 18,747 (63.4%) | 10,808 (36.6%) |
| Total (Overall) | 24,439 (61.6%) | 15,237 (38.4%) |
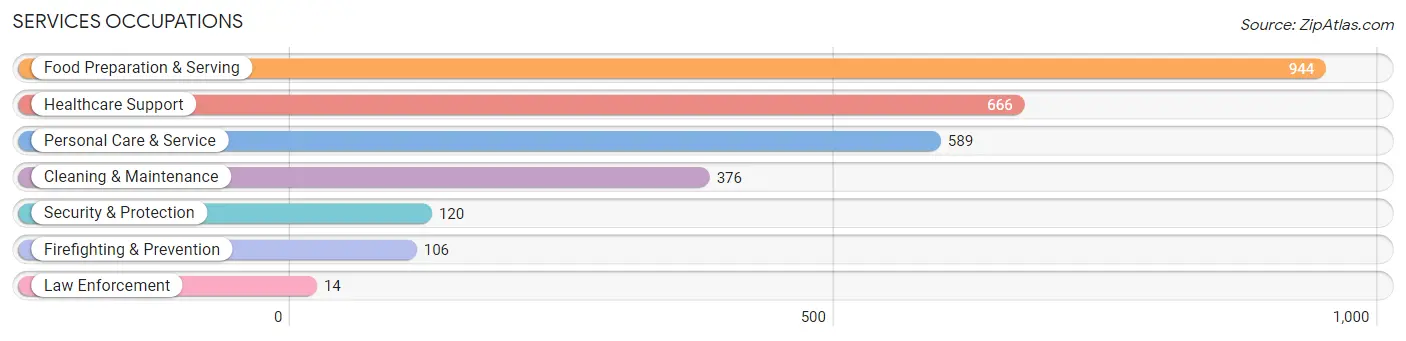
Services Occupations
The most common Services occupations in Redmond are Food Preparation & Serving (944 | 2.4%), Healthcare Support (666 | 1.7%), Personal Care & Service (589 | 1.5%), Cleaning & Maintenance (376 | 0.9%), and Security & Protection (120 | 0.3%).
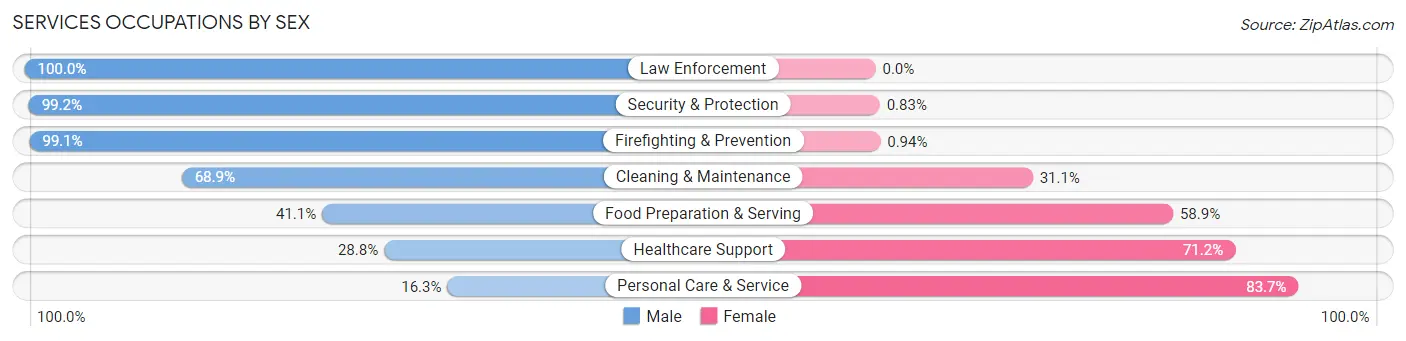
Services Occupations by Sex
Within the Services occupations in Redmond, the most male-oriented occupations are Law Enforcement (100.0%), Security & Protection (99.2%), and Firefighting & Prevention (99.1%), while the most female-oriented occupations are Personal Care & Service (83.7%), Healthcare Support (71.2%), and Food Preparation & Serving (58.9%).
| Occupation | Male | Female |
| Healthcare Support | 192 (28.8%) | 474 (71.2%) |
| Security & Protection | 119 (99.2%) | 1 (0.8%) |
| Firefighting & Prevention | 105 (99.1%) | 1 (0.9%) |
| Law Enforcement | 14 (100.0%) | 0 (0.0%) |
| Food Preparation & Serving | 388 (41.1%) | 556 (58.9%) |
| Cleaning & Maintenance | 259 (68.9%) | 117 (31.1%) |
| Personal Care & Service | 96 (16.3%) | 493 (83.7%) |
| Total (Category) | 1,054 (39.1%) | 1,641 (60.9%) |
| Total (Overall) | 24,439 (61.6%) | 15,237 (38.4%) |
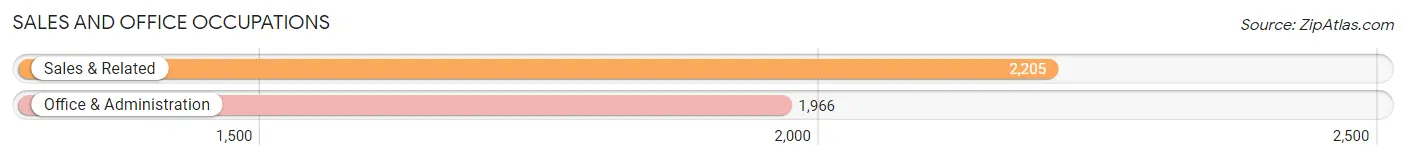
Sales and Office Occupations
The most common Sales and Office occupations in Redmond are Sales & Related (2,205 | 5.6%), and Office & Administration (1,966 | 5.0%).
Sales and Office Occupations by Sex
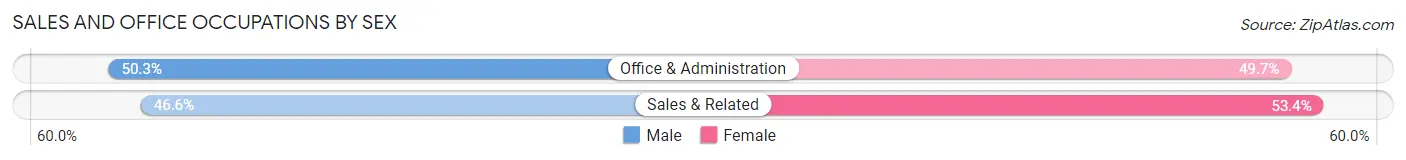
| Occupation | Male | Female |
| Sales & Related | 1,027 (46.6%) | 1,178 (53.4%) |
| Office & Administration | 989 (50.3%) | 977 (49.7%) |
| Total (Category) | 2,016 (48.3%) | 2,155 (51.7%) |
| Total (Overall) | 24,439 (61.6%) | 15,237 (38.4%) |
Natural Resources, Construction and Maintenance Occupations
The most common Natural Resources, Construction and Maintenance occupations in Redmond are Construction & Extraction (437 | 1.1%), Installation, Maintenance & Repair (413 | 1.0%), and Farming, Fishing & Forestry (10 | 0.0%).
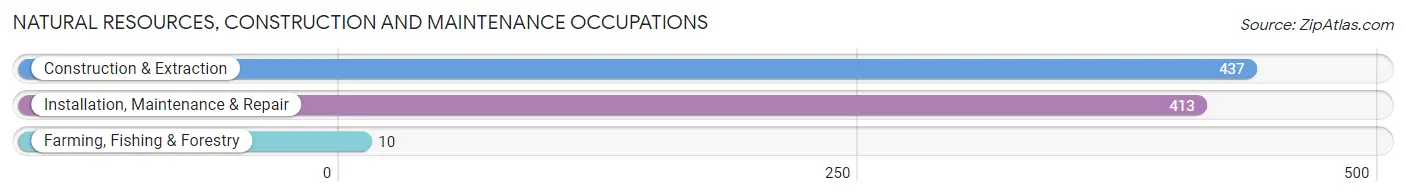
Natural Resources, Construction and Maintenance Occupations by Sex
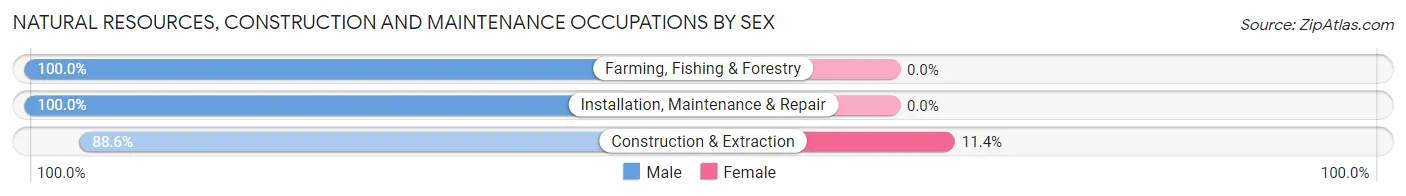
| Occupation | Male | Female |
| Farming, Fishing & Forestry | 10 (100.0%) | 0 (0.0%) |
| Construction & Extraction | 387 (88.6%) | 50 (11.4%) |
| Installation, Maintenance & Repair | 413 (100.0%) | 0 (0.0%) |
| Total (Category) | 810 (94.2%) | 50 (5.8%) |
| Total (Overall) | 24,439 (61.6%) | 15,237 (38.4%) |
Production, Transportation and Moving Occupations
The most common Production, Transportation and Moving occupations in Redmond are Material Moving (894 | 2.2%), Production (865 | 2.2%), and Transportation (636 | 1.6%).
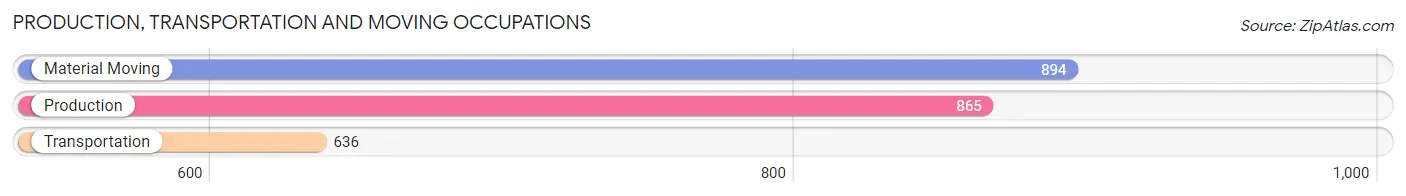
Production, Transportation and Moving Occupations by Sex
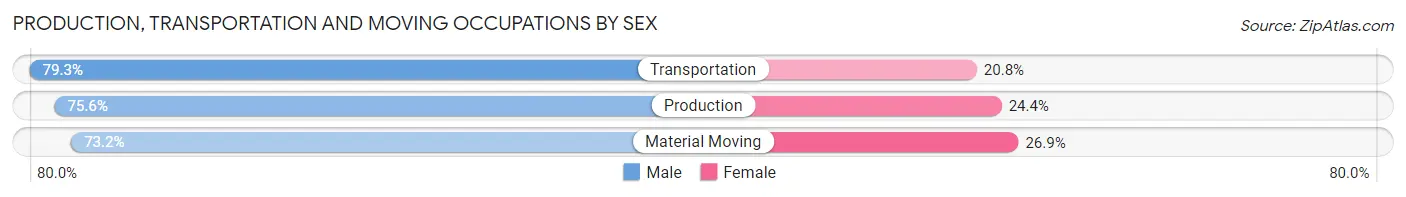
| Occupation | Male | Female |
| Production | 654 (75.6%) | 211 (24.4%) |
| Transportation | 504 (79.2%) | 132 (20.7%) |
| Material Moving | 654 (73.2%) | 240 (26.9%) |
| Total (Category) | 1,812 (75.7%) | 583 (24.3%) |
| Total (Overall) | 24,439 (61.6%) | 15,237 (38.4%) |
Employment Industries by Sex in Redmond
Employment Industries in Redmond
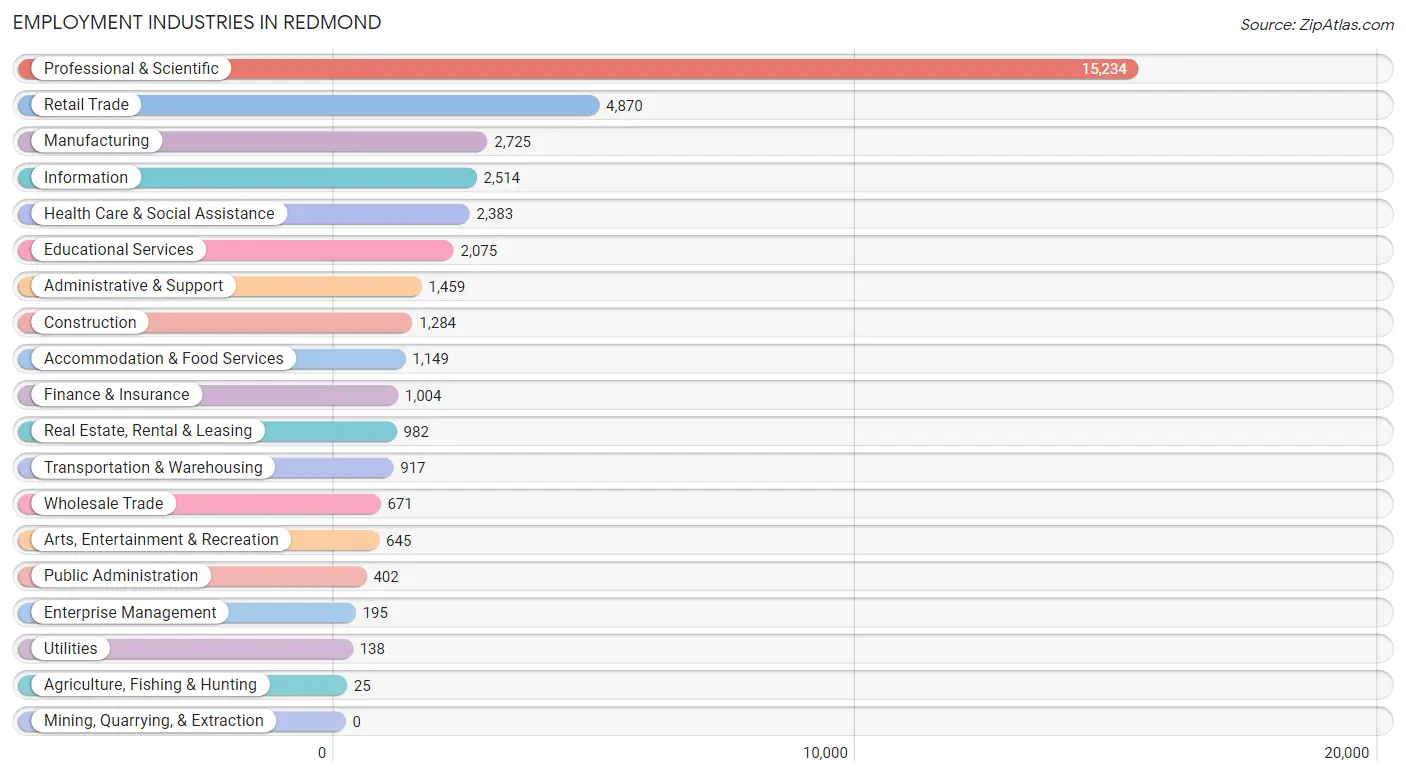
The major employment industries in Redmond include Professional & Scientific (15,234 | 38.4%), Retail Trade (4,870 | 12.3%), Manufacturing (2,725 | 6.9%), Information (2,514 | 6.3%), and Health Care & Social Assistance (2,383 | 6.0%).
Employment Industries by Sex in Redmond
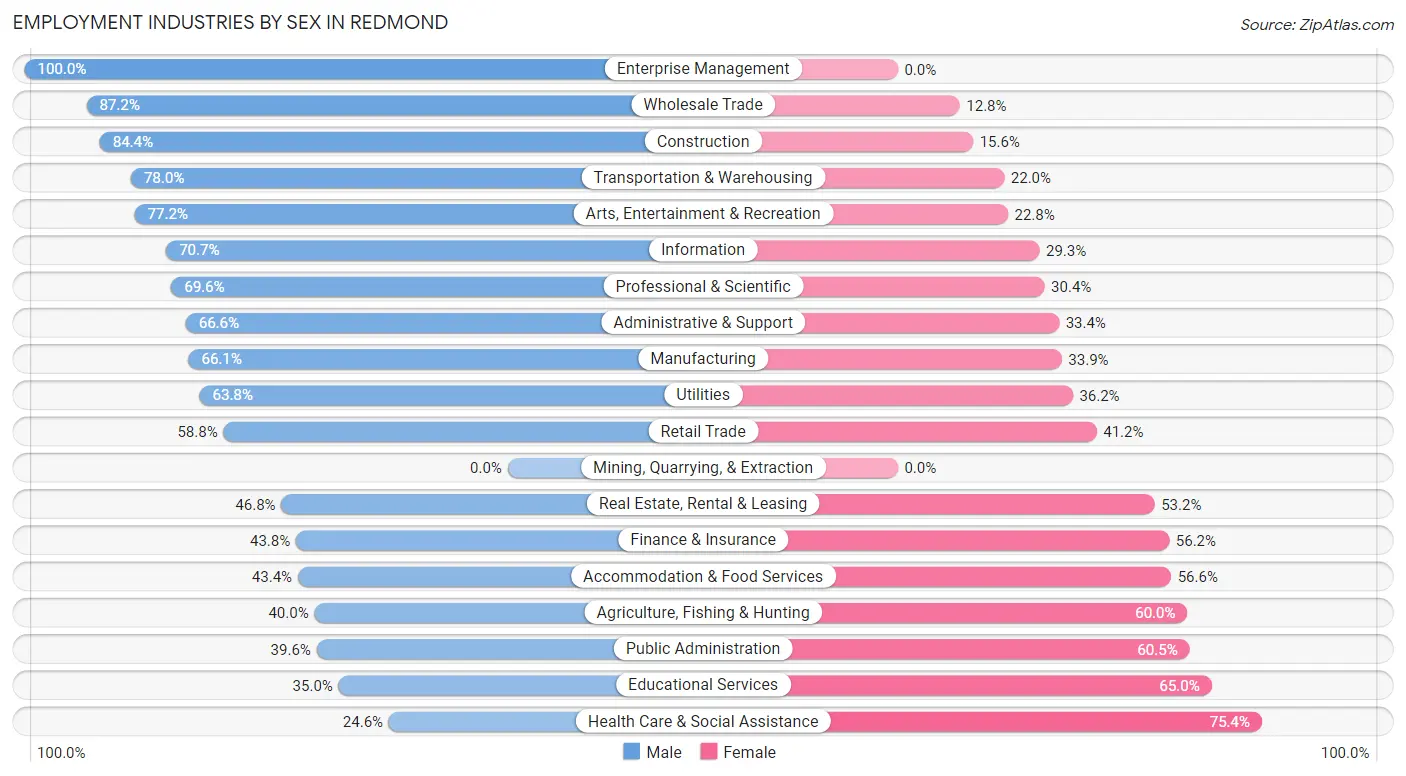
The Redmond industries that see more men than women are Enterprise Management (100.0%), Wholesale Trade (87.2%), and Construction (84.4%), whereas the industries that tend to have a higher number of women are Health Care & Social Assistance (75.4%), Educational Services (65.0%), and Public Administration (60.5%).
| Industry | Male | Female |
| Agriculture, Fishing & Hunting | 10 (40.0%) | 15 (60.0%) |
| Mining, Quarrying, & Extraction | 0 (0.0%) | 0 (0.0%) |
| Construction | 1,084 (84.4%) | 200 (15.6%) |
| Manufacturing | 1,800 (66.1%) | 925 (33.9%) |
| Wholesale Trade | 585 (87.2%) | 86 (12.8%) |
| Retail Trade | 2,865 (58.8%) | 2,005 (41.2%) |
| Transportation & Warehousing | 715 (78.0%) | 202 (22.0%) |
| Utilities | 88 (63.8%) | 50 (36.2%) |
| Information | 1,777 (70.7%) | 737 (29.3%) |
| Finance & Insurance | 440 (43.8%) | 564 (56.2%) |
| Real Estate, Rental & Leasing | 460 (46.8%) | 522 (53.2%) |
| Professional & Scientific | 10,608 (69.6%) | 4,626 (30.4%) |
| Enterprise Management | 195 (100.0%) | 0 (0.0%) |
| Administrative & Support | 972 (66.6%) | 487 (33.4%) |
| Educational Services | 726 (35.0%) | 1,349 (65.0%) |
| Health Care & Social Assistance | 586 (24.6%) | 1,797 (75.4%) |
| Arts, Entertainment & Recreation | 498 (77.2%) | 147 (22.8%) |
| Accommodation & Food Services | 499 (43.4%) | 650 (56.6%) |
| Public Administration | 159 (39.6%) | 243 (60.5%) |
| Total | 24,439 (61.6%) | 15,237 (38.4%) |
Education in Redmond
School Enrollment in Redmond
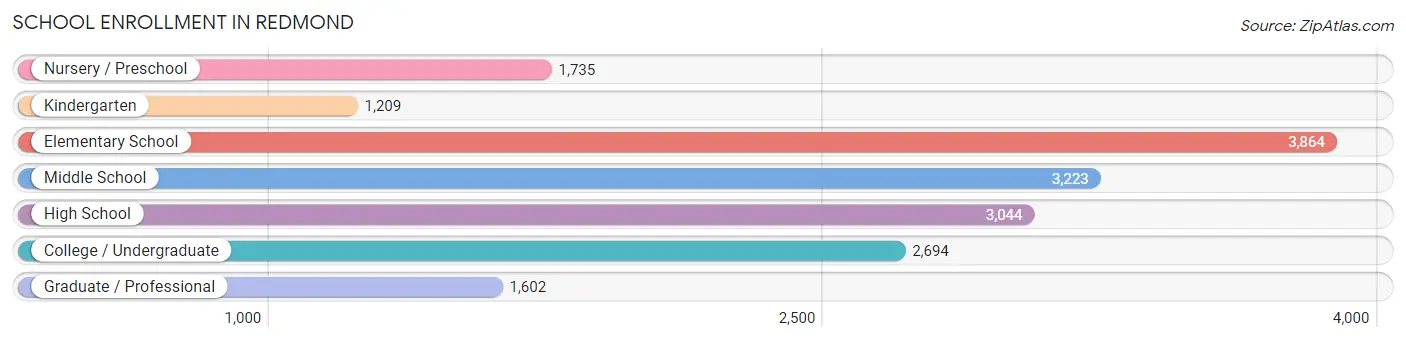
The most common levels of schooling among the 17,371 students in Redmond are elementary school (3,864 | 22.2%), middle school (3,223 | 18.5%), and high school (3,044 | 17.5%).
| School Level | # Students | % Students |
| Nursery / Preschool | 1,735 | 10.0% |
| Kindergarten | 1,209 | 7.0% |
| Elementary School | 3,864 | 22.2% |
| Middle School | 3,223 | 18.5% |
| High School | 3,044 | 17.5% |
| College / Undergraduate | 2,694 | 15.5% |
| Graduate / Professional | 1,602 | 9.2% |
| Total | 17,371 | 100.0% |
School Enrollment by Age by Funding Source in Redmond
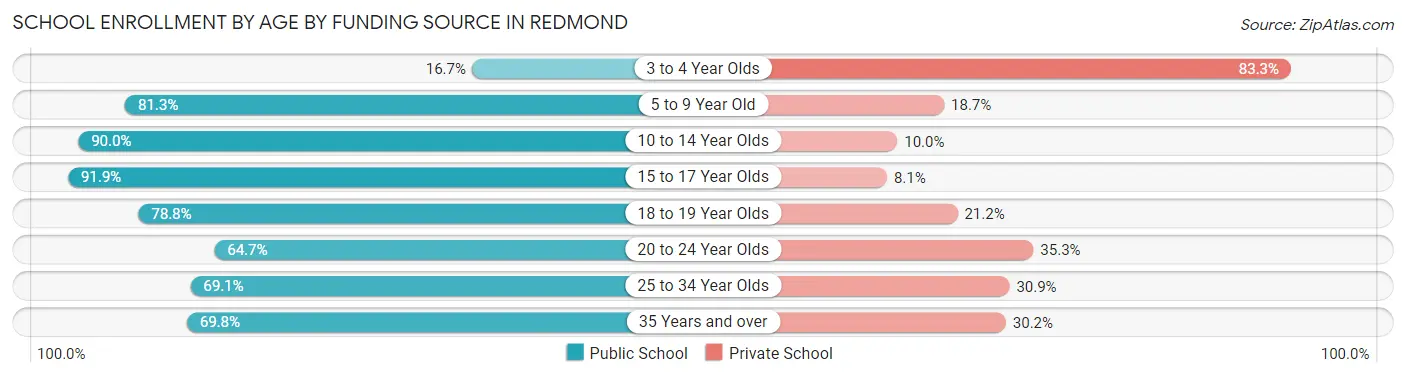
Out of a total of 17,371 students who are enrolled in schools in Redmond, 4,221 (24.3%) attend a private institution, while the remaining 13,150 (75.7%) are enrolled in public schools. The age group of 3 to 4 year olds has the highest likelihood of being enrolled in private schools, with 1,296 (83.3% in the age bracket) enrolled. Conversely, the age group of 15 to 17 year olds has the lowest likelihood of being enrolled in a private school, with 2,131 (91.9% in the age bracket) attending a public institution.
| Age Bracket | Public School | Private School |
| 3 to 4 Year Olds | 260 (16.7%) | 1,296 (83.3%) |
| 5 to 9 Year Old | 4,045 (81.3%) | 931 (18.7%) |
| 10 to 14 Year Olds | 3,433 (90.0%) | 381 (10.0%) |
| 15 to 17 Year Olds | 2,131 (91.9%) | 187 (8.1%) |
| 18 to 19 Year Olds | 799 (78.8%) | 215 (21.2%) |
| 20 to 24 Year Olds | 1,010 (64.7%) | 552 (35.3%) |
| 25 to 34 Year Olds | 750 (69.1%) | 335 (30.9%) |
| 35 Years and over | 730 (69.8%) | 316 (30.2%) |
| Total | 13,150 (75.7%) | 4,221 (24.3%) |
Educational Attainment by Field of Study in Redmond
Computers & mathematics (9,189 | 22.2%), engineering (8,787 | 21.2%), business (5,341 | 12.9%), social sciences (2,824 | 6.8%), and science & technology (2,327 | 5.6%) are the most common fields of study among 41,401 individuals in Redmond who have obtained a bachelor's degree or higher.
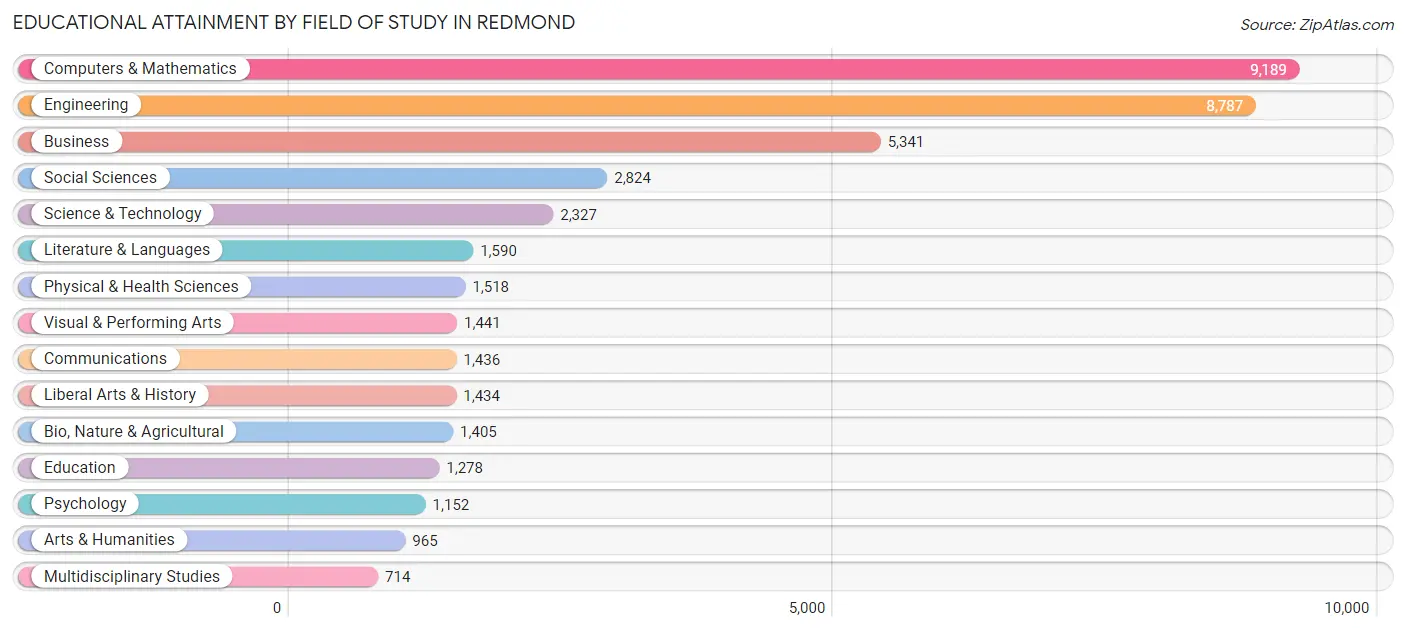
| Field of Study | # Graduates | % Graduates |
| Computers & Mathematics | 9,189 | 22.2% |
| Bio, Nature & Agricultural | 1,405 | 3.4% |
| Physical & Health Sciences | 1,518 | 3.7% |
| Psychology | 1,152 | 2.8% |
| Social Sciences | 2,824 | 6.8% |
| Engineering | 8,787 | 21.2% |
| Multidisciplinary Studies | 714 | 1.7% |
| Science & Technology | 2,327 | 5.6% |
| Business | 5,341 | 12.9% |
| Education | 1,278 | 3.1% |
| Literature & Languages | 1,590 | 3.8% |
| Liberal Arts & History | 1,434 | 3.5% |
| Visual & Performing Arts | 1,441 | 3.5% |
| Communications | 1,436 | 3.5% |
| Arts & Humanities | 965 | 2.3% |
| Total | 41,401 | 100.0% |
Transportation & Commute in Redmond
Vehicle Availability by Sex in Redmond
The most prevalent vehicle ownership categories in Redmond are males with 2 vehicles (9,396, accounting for 39.5%) and females with 2 vehicles (6,817, making up 62.7%).
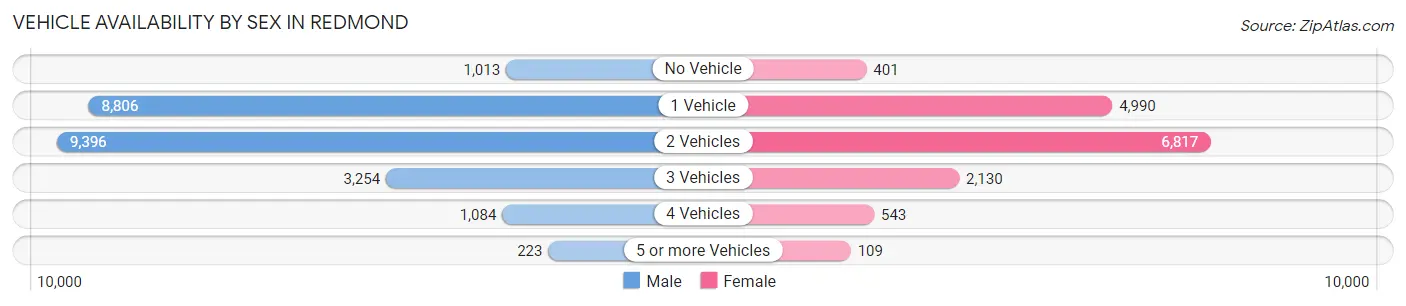
| Vehicles Available | Male | Female |
| No Vehicle | 1,013 (4.3%) | 401 (2.7%) |
| 1 Vehicle | 8,806 (37.0%) | 4,990 (33.3%) |
| 2 Vehicles | 9,396 (39.5%) | 6,817 (45.5%) |
| 3 Vehicles | 3,254 (13.7%) | 2,130 (14.2%) |
| 4 Vehicles | 1,084 (4.6%) | 543 (3.6%) |
| 5 or more Vehicles | 223 (0.9%) | 109 (0.7%) |
| Total | 23,776 (100.0%) | 14,990 (100.0%) |
Commute Time in Redmond
The most frequently occuring commute durations in Redmond are 15 to 19 minutes (5,590 commuters, 21.2%), 20 to 24 minutes (4,070 commuters, 15.4%), and 10 to 14 minutes (3,648 commuters, 13.8%).
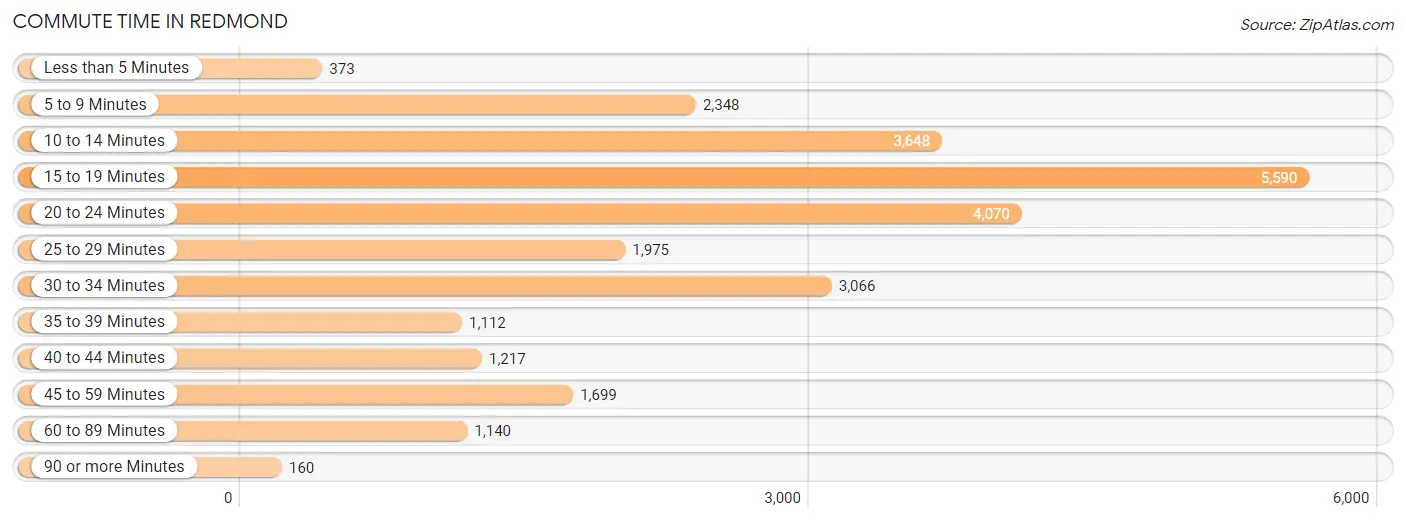
| Commute Time | # Commuters | % Commuters |
| Less than 5 Minutes | 373 | 1.4% |
| 5 to 9 Minutes | 2,348 | 8.9% |
| 10 to 14 Minutes | 3,648 | 13.8% |
| 15 to 19 Minutes | 5,590 | 21.2% |
| 20 to 24 Minutes | 4,070 | 15.4% |
| 25 to 29 Minutes | 1,975 | 7.5% |
| 30 to 34 Minutes | 3,066 | 11.6% |
| 35 to 39 Minutes | 1,112 | 4.2% |
| 40 to 44 Minutes | 1,217 | 4.6% |
| 45 to 59 Minutes | 1,699 | 6.4% |
| 60 to 89 Minutes | 1,140 | 4.3% |
| 90 or more Minutes | 160 | 0.6% |
Commute Time by Sex in Redmond
The most common commute times in Redmond are 15 to 19 minutes (3,229 commuters, 20.1%) for males and 15 to 19 minutes (2,361 commuters, 22.9%) for females.
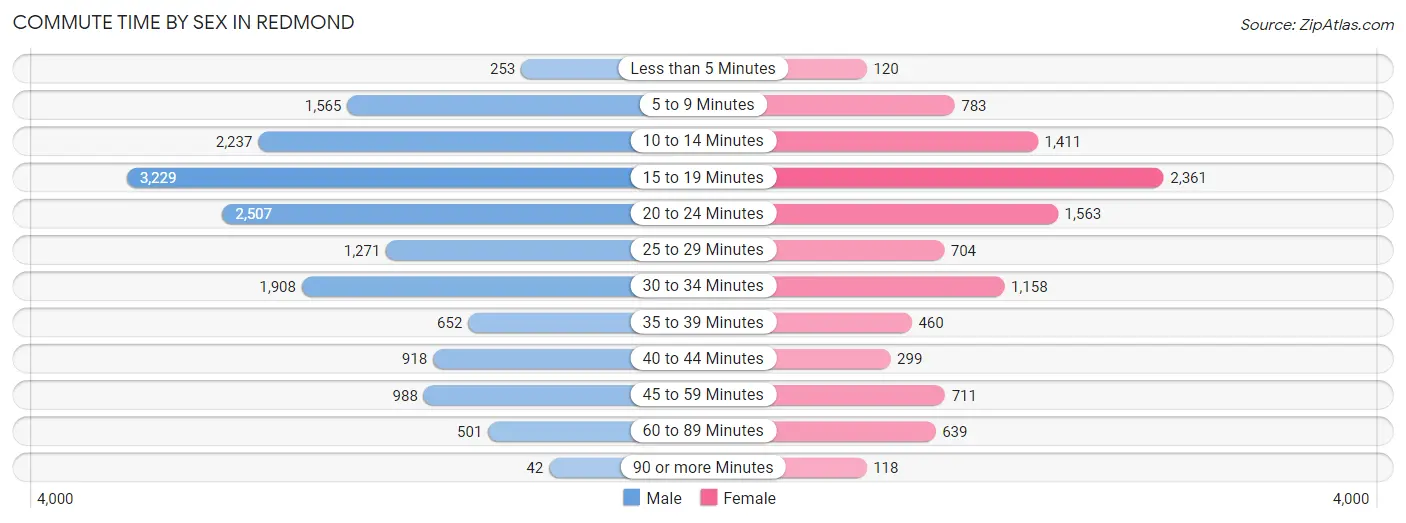
| Commute Time | Male | Female |
| Less than 5 Minutes | 253 (1.6%) | 120 (1.2%) |
| 5 to 9 Minutes | 1,565 (9.7%) | 783 (7.6%) |
| 10 to 14 Minutes | 2,237 (13.9%) | 1,411 (13.7%) |
| 15 to 19 Minutes | 3,229 (20.1%) | 2,361 (22.9%) |
| 20 to 24 Minutes | 2,507 (15.6%) | 1,563 (15.1%) |
| 25 to 29 Minutes | 1,271 (7.9%) | 704 (6.8%) |
| 30 to 34 Minutes | 1,908 (11.9%) | 1,158 (11.2%) |
| 35 to 39 Minutes | 652 (4.1%) | 460 (4.4%) |
| 40 to 44 Minutes | 918 (5.7%) | 299 (2.9%) |
| 45 to 59 Minutes | 988 (6.1%) | 711 (6.9%) |
| 60 to 89 Minutes | 501 (3.1%) | 639 (6.2%) |
| 90 or more Minutes | 42 (0.3%) | 118 (1.1%) |
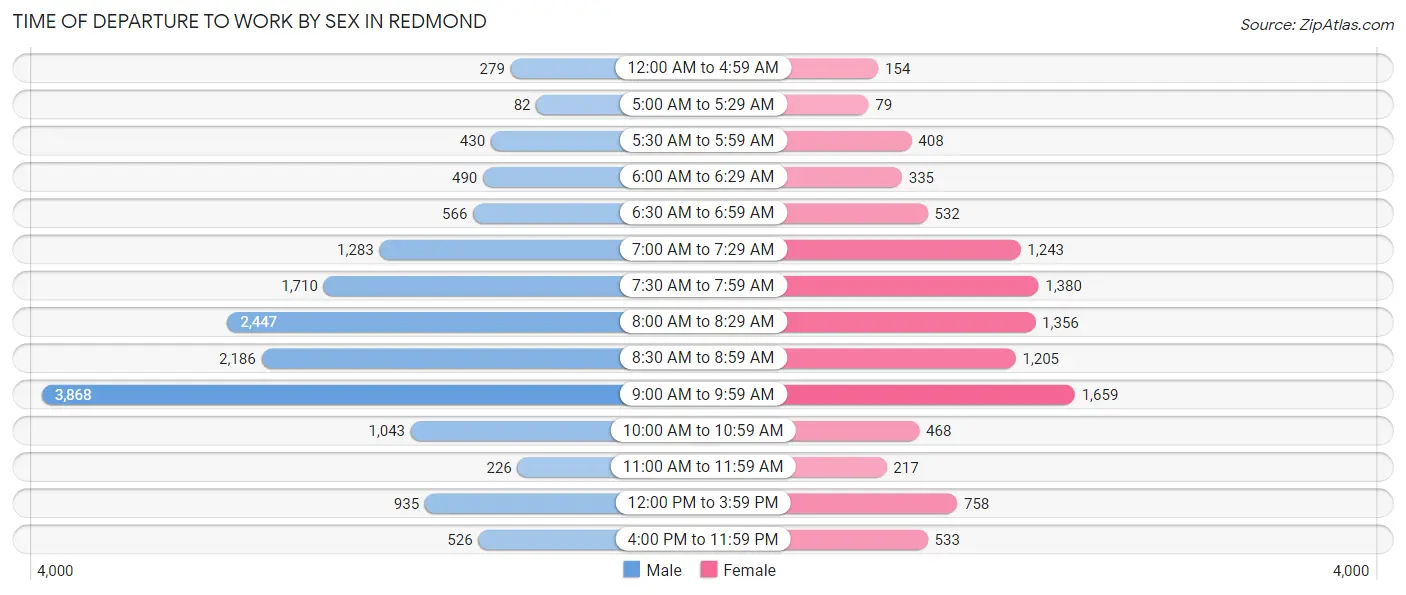
Time of Departure to Work by Sex in Redmond
The most frequent times of departure to work in Redmond are 9:00 AM to 9:59 AM (3,868, 24.1%) for males and 9:00 AM to 9:59 AM (1,659, 16.1%) for females.
| Time of Departure | Male | Female |
| 12:00 AM to 4:59 AM | 279 (1.7%) | 154 (1.5%) |
| 5:00 AM to 5:29 AM | 82 (0.5%) | 79 (0.8%) |
| 5:30 AM to 5:59 AM | 430 (2.7%) | 408 (4.0%) |
| 6:00 AM to 6:29 AM | 490 (3.0%) | 335 (3.2%) |
| 6:30 AM to 6:59 AM | 566 (3.5%) | 532 (5.1%) |
| 7:00 AM to 7:29 AM | 1,283 (8.0%) | 1,243 (12.0%) |
| 7:30 AM to 7:59 AM | 1,710 (10.6%) | 1,380 (13.4%) |
| 8:00 AM to 8:29 AM | 2,447 (15.2%) | 1,356 (13.1%) |
| 8:30 AM to 8:59 AM | 2,186 (13.6%) | 1,205 (11.7%) |
| 9:00 AM to 9:59 AM | 3,868 (24.1%) | 1,659 (16.1%) |
| 10:00 AM to 10:59 AM | 1,043 (6.5%) | 468 (4.5%) |
| 11:00 AM to 11:59 AM | 226 (1.4%) | 217 (2.1%) |
| 12:00 PM to 3:59 PM | 935 (5.8%) | 758 (7.3%) |
| 4:00 PM to 11:59 PM | 526 (3.3%) | 533 (5.2%) |
| Total | 16,071 (100.0%) | 10,327 (100.0%) |
Housing Occupancy in Redmond
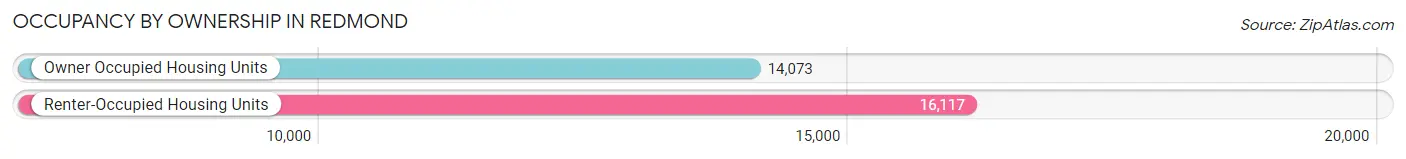
Occupancy by Ownership in Redmond
Of the total 30,190 dwellings in Redmond, owner-occupied units account for 14,073 (46.6%), while renter-occupied units make up 16,117 (53.4%).
| Occupancy | # Housing Units | % Housing Units |
| Owner Occupied Housing Units | 14,073 | 46.6% |
| Renter-Occupied Housing Units | 16,117 | 53.4% |
| Total Occupied Housing Units | 30,190 | 100.0% |
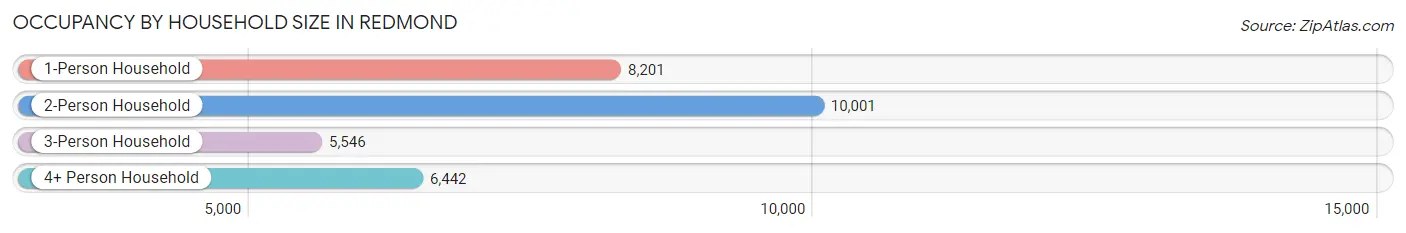
Occupancy by Household Size in Redmond
| Household Size | # Housing Units | % Housing Units |
| 1-Person Household | 8,201 | 27.2% |
| 2-Person Household | 10,001 | 33.1% |
| 3-Person Household | 5,546 | 18.4% |
| 4+ Person Household | 6,442 | 21.3% |
| Total Housing Units | 30,190 | 100.0% |
Occupancy by Ownership by Household Size in Redmond
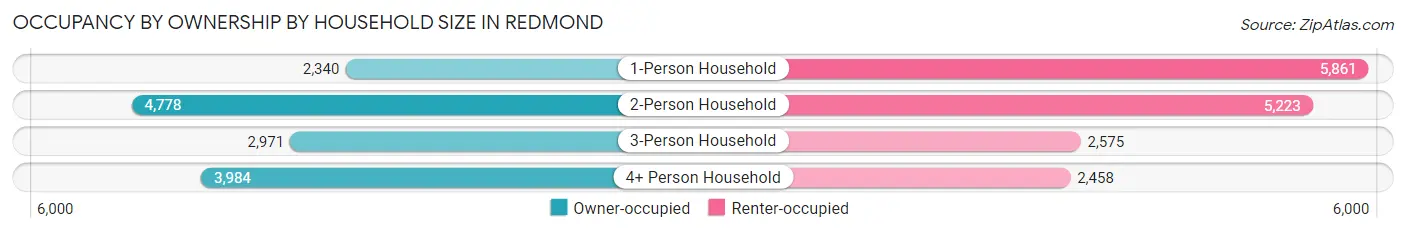
| Household Size | Owner-occupied | Renter-occupied |
| 1-Person Household | 2,340 (28.5%) | 5,861 (71.5%) |
| 2-Person Household | 4,778 (47.8%) | 5,223 (52.2%) |
| 3-Person Household | 2,971 (53.6%) | 2,575 (46.4%) |
| 4+ Person Household | 3,984 (61.8%) | 2,458 (38.2%) |
| Total Housing Units | 14,073 (46.6%) | 16,117 (53.4%) |
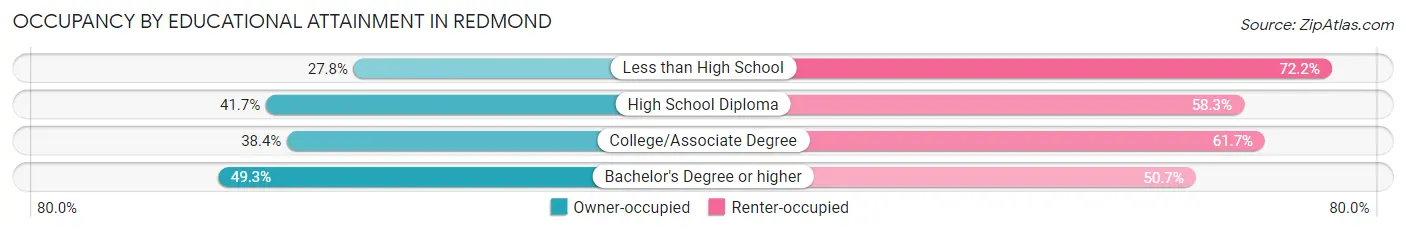
Occupancy by Educational Attainment in Redmond
| Household Size | Owner-occupied | Renter-occupied |
| Less than High School | 152 (27.8%) | 395 (72.2%) |
| High School Diploma | 707 (41.7%) | 988 (58.3%) |
| College/Associate Degree | 2,008 (38.4%) | 3,228 (61.7%) |
| Bachelor's Degree or higher | 11,206 (49.3%) | 11,506 (50.7%) |
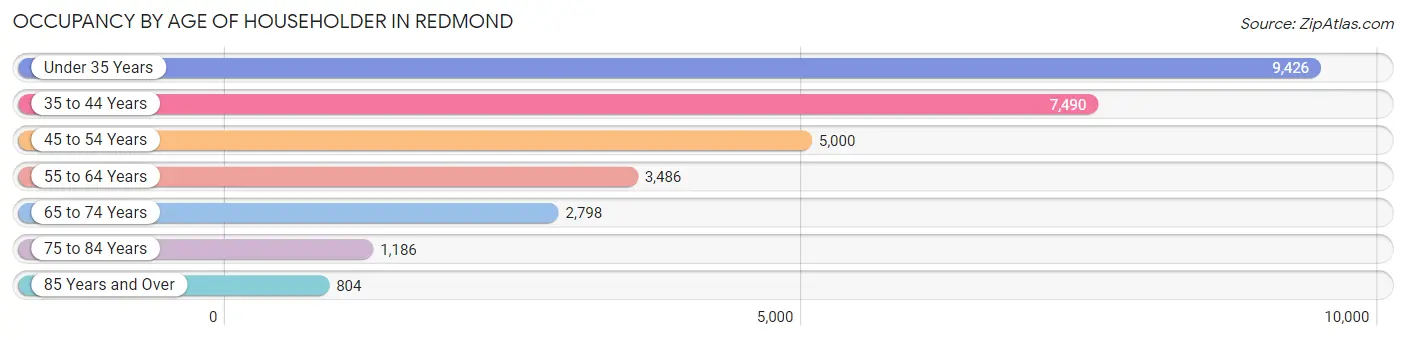
Occupancy by Age of Householder in Redmond
| Age Bracket | # Households | % Households |
| Under 35 Years | 9,426 | 31.2% |
| 35 to 44 Years | 7,490 | 24.8% |
| 45 to 54 Years | 5,000 | 16.6% |
| 55 to 64 Years | 3,486 | 11.6% |
| 65 to 74 Years | 2,798 | 9.3% |
| 75 to 84 Years | 1,186 | 3.9% |
| 85 Years and Over | 804 | 2.7% |
| Total | 30,190 | 100.0% |
Housing Finances in Redmond
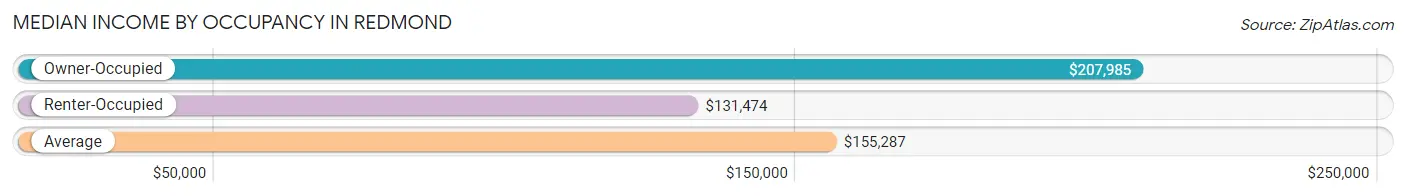
Median Income by Occupancy in Redmond
| Occupancy Type | # Households | Median Income |
| Owner-Occupied | 14,073 (46.6%) | $207,985 |
| Renter-Occupied | 16,117 (53.4%) | $131,474 |
| Average | 30,190 (100.0%) | $155,287 |
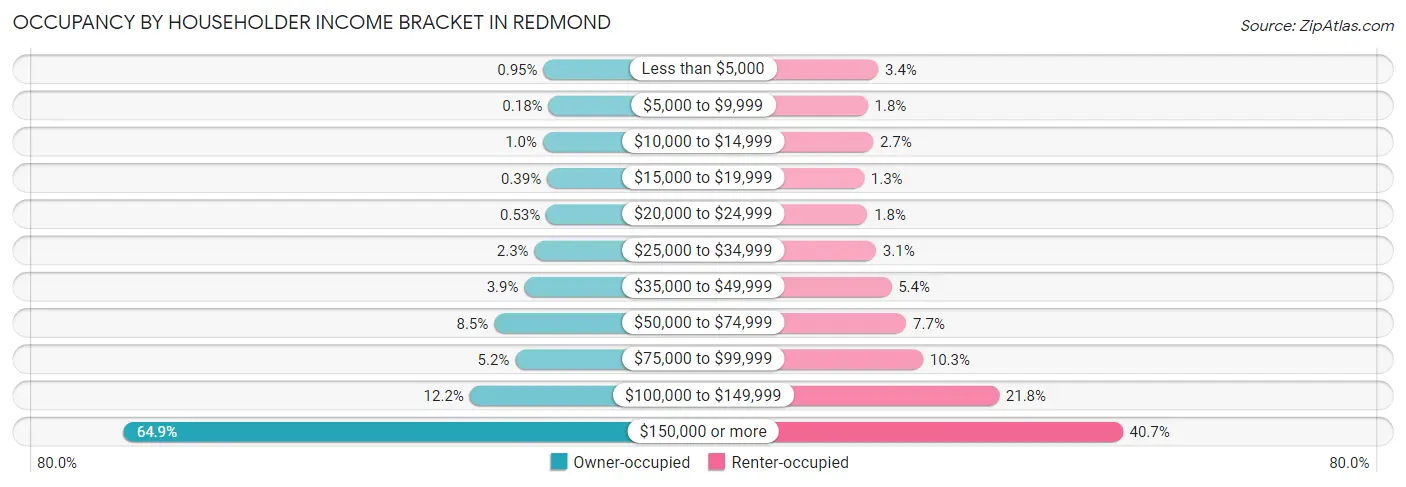
Occupancy by Householder Income Bracket in Redmond
| Income Bracket | Owner-occupied | Renter-occupied |
| Less than $5,000 | 133 (0.9%) | 555 (3.4%) |
| $5,000 to $9,999 | 26 (0.2%) | 296 (1.8%) |
| $10,000 to $14,999 | 145 (1.0%) | 428 (2.7%) |
| $15,000 to $19,999 | 55 (0.4%) | 205 (1.3%) |
| $20,000 to $24,999 | 75 (0.5%) | 287 (1.8%) |
| $25,000 to $34,999 | 325 (2.3%) | 499 (3.1%) |
| $35,000 to $49,999 | 543 (3.9%) | 875 (5.4%) |
| $50,000 to $74,999 | 1,189 (8.5%) | 1,243 (7.7%) |
| $75,000 to $99,999 | 737 (5.2%) | 1,652 (10.2%) |
| $100,000 to $149,999 | 1,714 (12.2%) | 3,520 (21.8%) |
| $150,000 or more | 9,131 (64.9%) | 6,557 (40.7%) |
| Total | 14,073 (100.0%) | 16,117 (100.0%) |
Monthly Housing Cost Tiers in Redmond
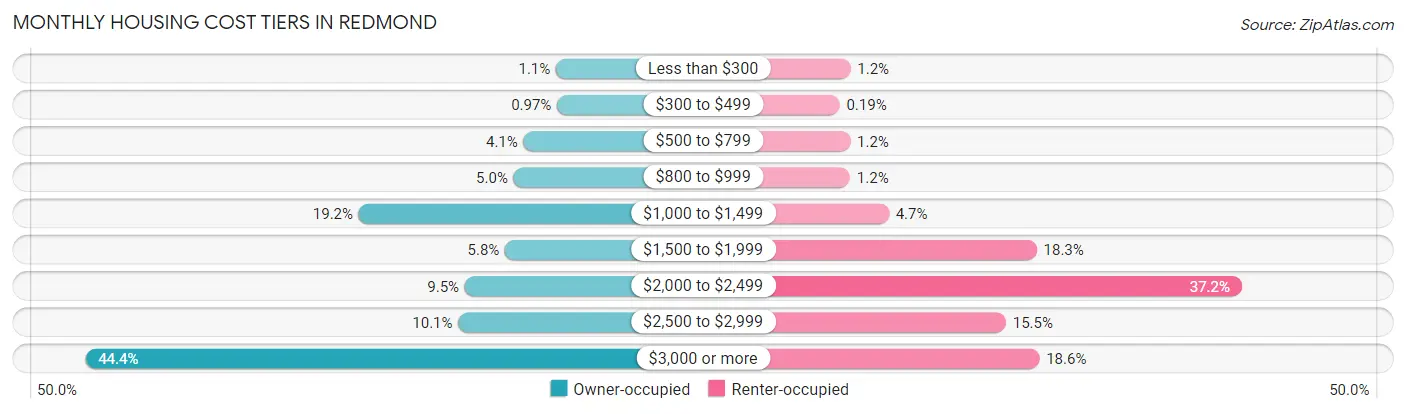
| Monthly Cost | Owner-occupied | Renter-occupied |
| Less than $300 | 151 (1.1%) | 191 (1.2%) |
| $300 to $499 | 137 (1.0%) | 31 (0.2%) |
| $500 to $799 | 571 (4.1%) | 188 (1.2%) |
| $800 to $999 | 699 (5.0%) | 186 (1.1%) |
| $1,000 to $1,499 | 2,706 (19.2%) | 761 (4.7%) |
| $1,500 to $1,999 | 810 (5.8%) | 2,956 (18.3%) |
| $2,000 to $2,499 | 1,331 (9.5%) | 5,999 (37.2%) |
| $2,500 to $2,999 | 1,417 (10.1%) | 2,498 (15.5%) |
| $3,000 or more | 6,251 (44.4%) | 2,995 (18.6%) |
| Total | 14,073 (100.0%) | 16,117 (100.0%) |
Physical Housing Characteristics in Redmond
Housing Structures in Redmond
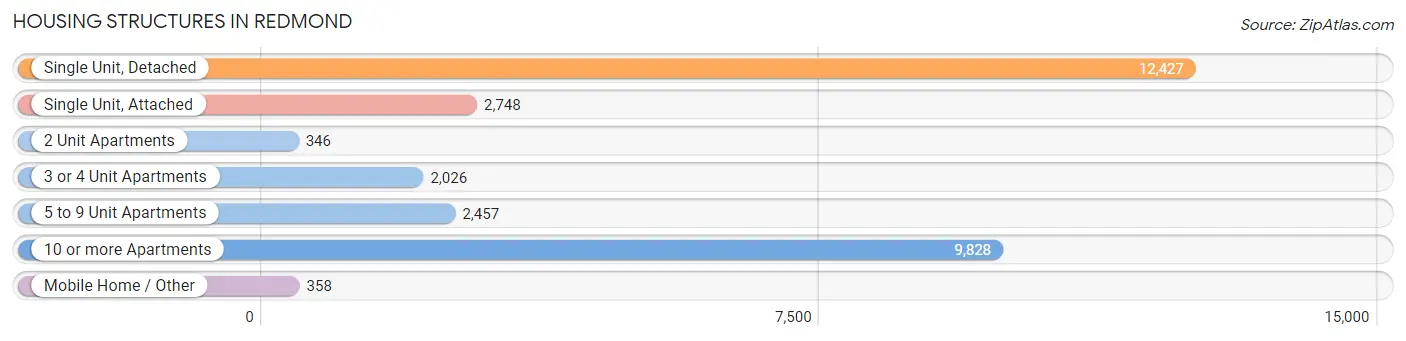
| Structure Type | # Housing Units | % Housing Units |
| Single Unit, Detached | 12,427 | 41.2% |
| Single Unit, Attached | 2,748 | 9.1% |
| 2 Unit Apartments | 346 | 1.1% |
| 3 or 4 Unit Apartments | 2,026 | 6.7% |
| 5 to 9 Unit Apartments | 2,457 | 8.1% |
| 10 or more Apartments | 9,828 | 32.6% |
| Mobile Home / Other | 358 | 1.2% |
| Total | 30,190 | 100.0% |
Housing Structures by Occupancy in Redmond
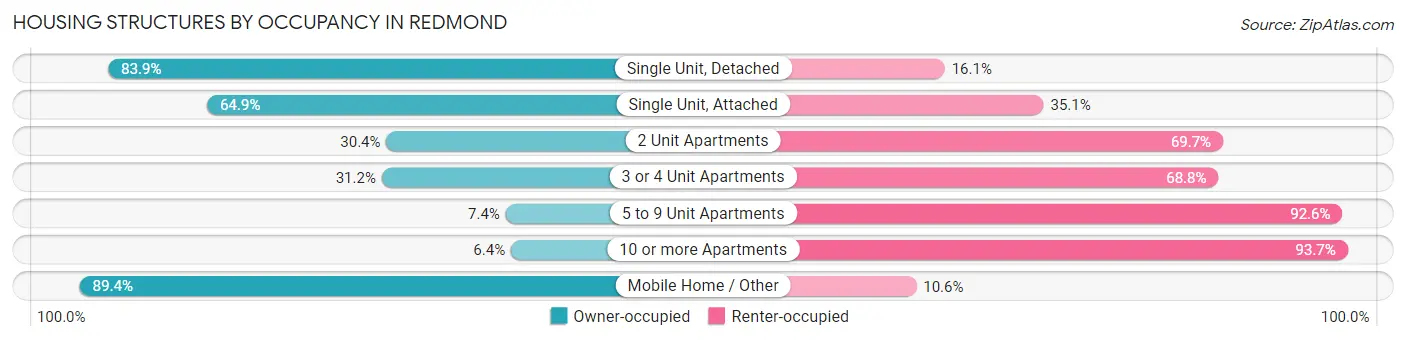
| Structure Type | Owner-occupied | Renter-occupied |
| Single Unit, Detached | 10,427 (83.9%) | 2,000 (16.1%) |
| Single Unit, Attached | 1,783 (64.9%) | 965 (35.1%) |
| 2 Unit Apartments | 105 (30.3%) | 241 (69.7%) |
| 3 or 4 Unit Apartments | 633 (31.2%) | 1,393 (68.8%) |
| 5 to 9 Unit Apartments | 181 (7.4%) | 2,276 (92.6%) |
| 10 or more Apartments | 624 (6.4%) | 9,204 (93.6%) |
| Mobile Home / Other | 320 (89.4%) | 38 (10.6%) |
| Total | 14,073 (46.6%) | 16,117 (53.4%) |
Housing Structures by Number of Rooms in Redmond
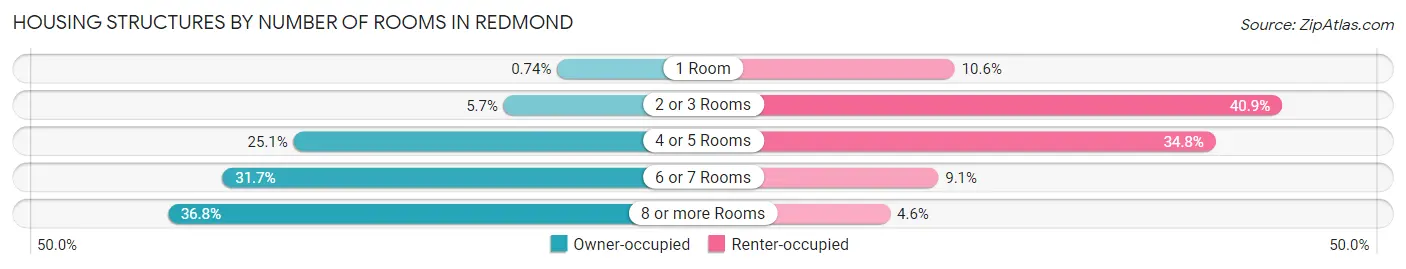
| Number of Rooms | Owner-occupied | Renter-occupied |
| 1 Room | 104 (0.7%) | 1,712 (10.6%) |
| 2 or 3 Rooms | 799 (5.7%) | 6,589 (40.9%) |
| 4 or 5 Rooms | 3,535 (25.1%) | 5,601 (34.7%) |
| 6 or 7 Rooms | 4,462 (31.7%) | 1,467 (9.1%) |
| 8 or more Rooms | 5,173 (36.8%) | 748 (4.6%) |
| Total | 14,073 (100.0%) | 16,117 (100.0%) |
Housing Structure by Heating Type in Redmond
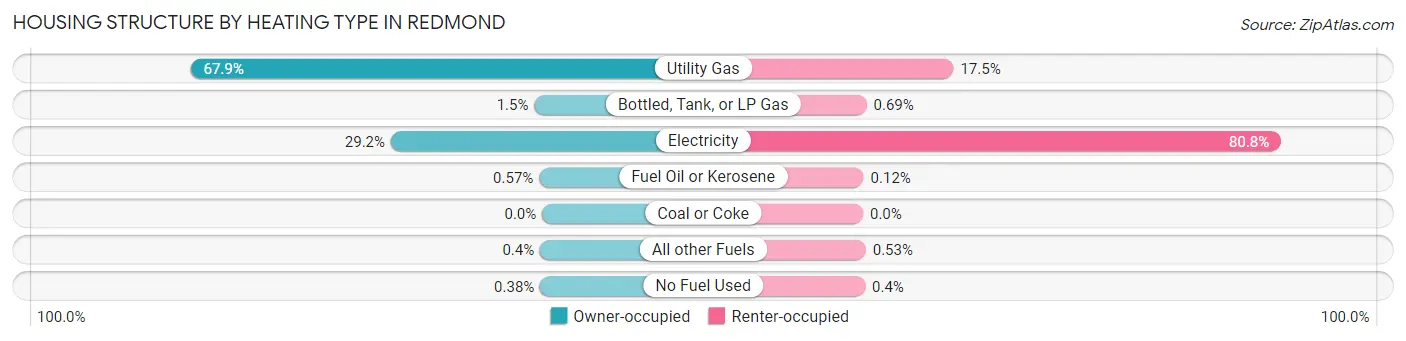
| Heating Type | Owner-occupied | Renter-occupied |
| Utility Gas | 9,559 (67.9%) | 2,818 (17.5%) |
| Bottled, Tank, or LP Gas | 212 (1.5%) | 111 (0.7%) |
| Electricity | 4,112 (29.2%) | 13,019 (80.8%) |
| Fuel Oil or Kerosene | 80 (0.6%) | 19 (0.1%) |
| Coal or Coke | 0 (0.0%) | 0 (0.0%) |
| All other Fuels | 56 (0.4%) | 86 (0.5%) |
| No Fuel Used | 54 (0.4%) | 64 (0.4%) |
| Total | 14,073 (100.0%) | 16,117 (100.0%) |
Household Vehicle Usage in Redmond
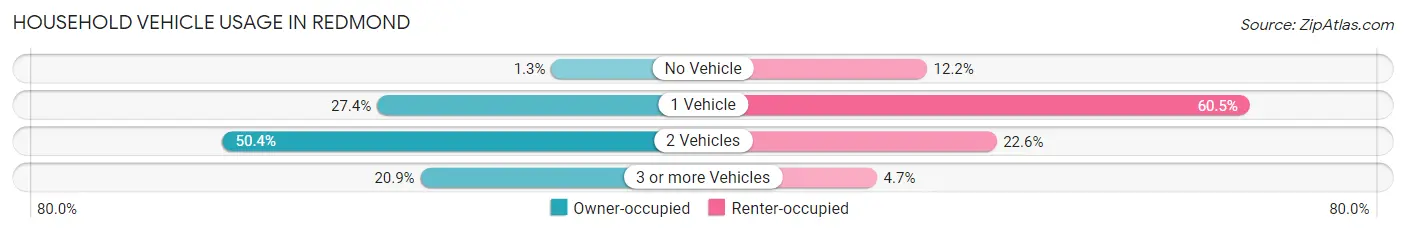
| Vehicles per Household | Owner-occupied | Renter-occupied |
| No Vehicle | 187 (1.3%) | 1,967 (12.2%) |
| 1 Vehicle | 3,851 (27.4%) | 9,743 (60.5%) |
| 2 Vehicles | 7,096 (50.4%) | 3,643 (22.6%) |
| 3 or more Vehicles | 2,939 (20.9%) | 764 (4.7%) |
| Total | 14,073 (100.0%) | 16,117 (100.0%) |
Real Estate & Mortgages in Redmond
Real Estate and Mortgage Overview in Redmond
| Characteristic | Without Mortgage | With Mortgage |
| Housing Units | 4,219 | 9,854 |
| Median Property Value | $1,003,600 | $1,036,900 |
| Median Household Income | $142,688 | $7,100 |
| Monthly Housing Costs | $1,136 | $6,162 |
| Real Estate Taxes | $8,094 | $100 |
Property Value by Mortgage Status in Redmond
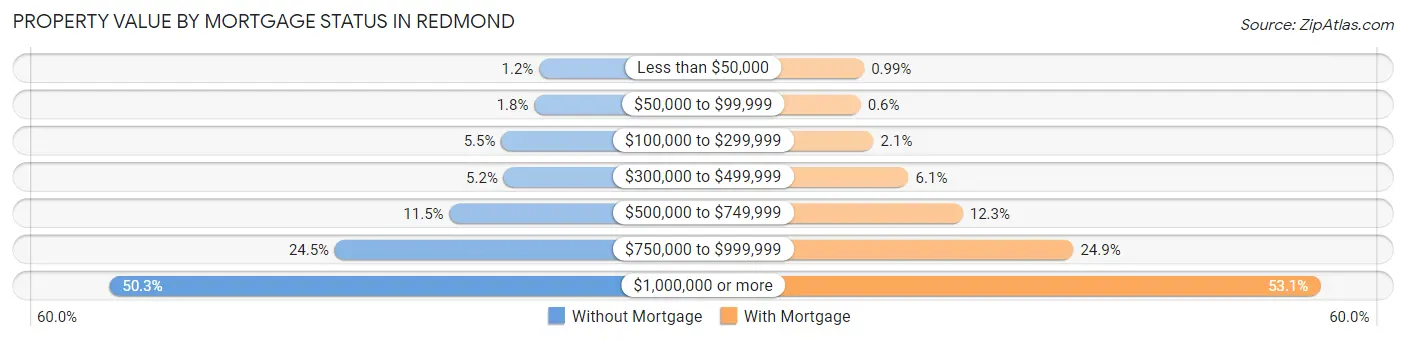
| Property Value | Without Mortgage | With Mortgage |
| Less than $50,000 | 50 (1.2%) | 98 (1.0%) |
| $50,000 to $99,999 | 74 (1.8%) | 59 (0.6%) |
| $100,000 to $299,999 | 233 (5.5%) | 204 (2.1%) |
| $300,000 to $499,999 | 221 (5.2%) | 598 (6.1%) |
| $500,000 to $749,999 | 483 (11.5%) | 1,208 (12.3%) |
| $750,000 to $999,999 | 1,035 (24.5%) | 2,455 (24.9%) |
| $1,000,000 or more | 2,123 (50.3%) | 5,232 (53.1%) |
| Total | 4,219 (100.0%) | 9,854 (100.0%) |
Household Income by Mortgage Status in Redmond
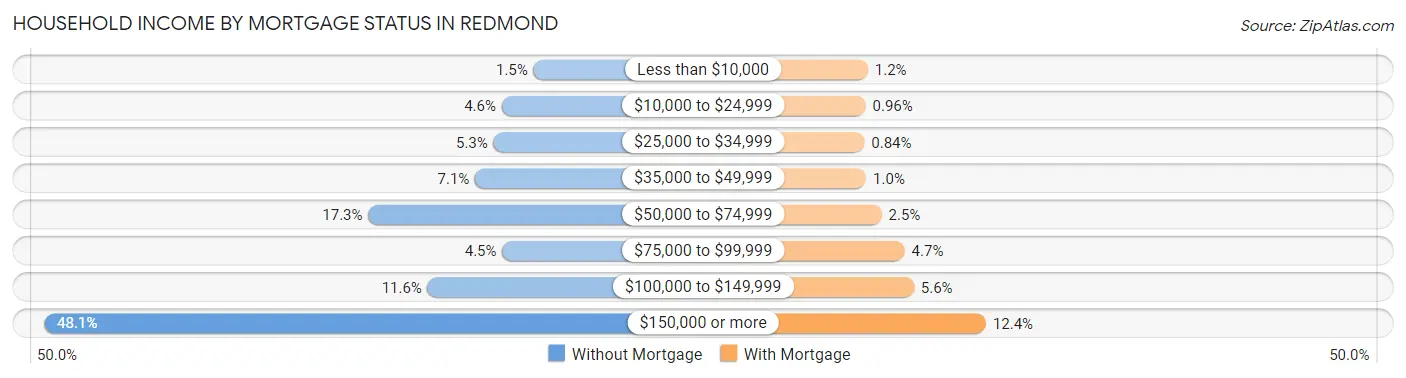
| Household Income | Without Mortgage | With Mortgage |
| Less than $10,000 | 64 (1.5%) | 115 (1.2%) |
| $10,000 to $24,999 | 192 (4.5%) | 95 (1.0%) |
| $25,000 to $34,999 | 225 (5.3%) | 83 (0.8%) |
| $35,000 to $49,999 | 299 (7.1%) | 100 (1.0%) |
| $50,000 to $74,999 | 728 (17.3%) | 244 (2.5%) |
| $75,000 to $99,999 | 190 (4.5%) | 461 (4.7%) |
| $100,000 to $149,999 | 490 (11.6%) | 547 (5.6%) |
| $150,000 or more | 2,031 (48.1%) | 1,224 (12.4%) |
| Total | 4,219 (100.0%) | 9,854 (100.0%) |
Property Value to Household Income Ratio in Redmond
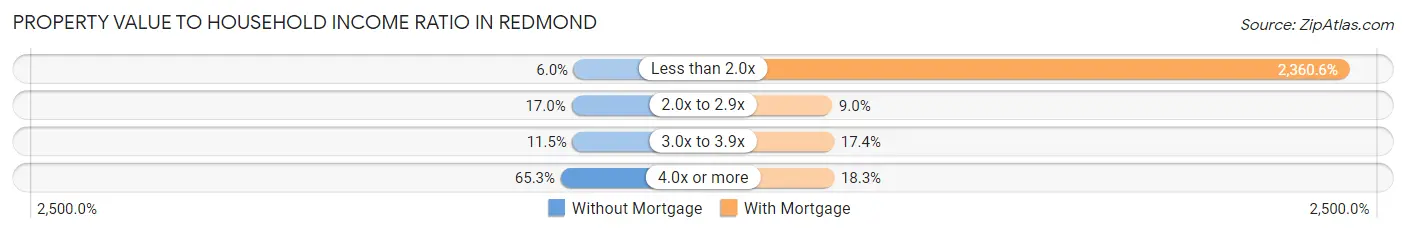
| Value-to-Income Ratio | Without Mortgage | With Mortgage |
| Less than 2.0x | 251 (5.9%) | 232,611 (2,360.6%) |
| 2.0x to 2.9x | 715 (17.0%) | 886 (9.0%) |
| 3.0x to 3.9x | 486 (11.5%) | 1,715 (17.4%) |
| 4.0x or more | 2,754 (65.3%) | 1,803 (18.3%) |
| Total | 4,219 (100.0%) | 9,854 (100.0%) |
Real Estate Taxes by Mortgage Status in Redmond
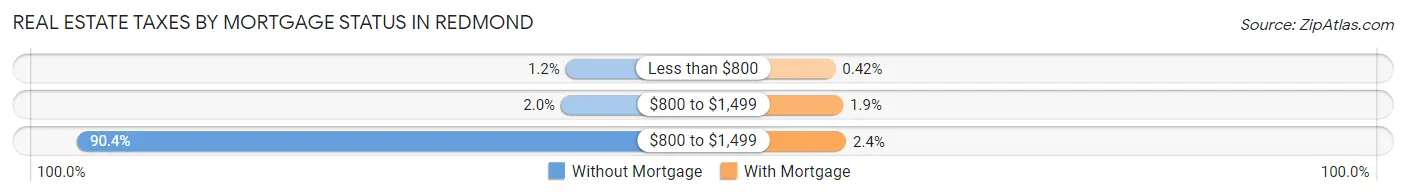
| Property Taxes | Without Mortgage | With Mortgage |
| Less than $800 | 50 (1.2%) | 41 (0.4%) |
| $800 to $1,499 | 86 (2.0%) | 182 (1.8%) |
| $800 to $1,499 | 3,815 (90.4%) | 236 (2.4%) |
| Total | 4,219 (100.0%) | 9,854 (100.0%) |
Health & Disability in Redmond
Health Insurance Coverage by Age in Redmond
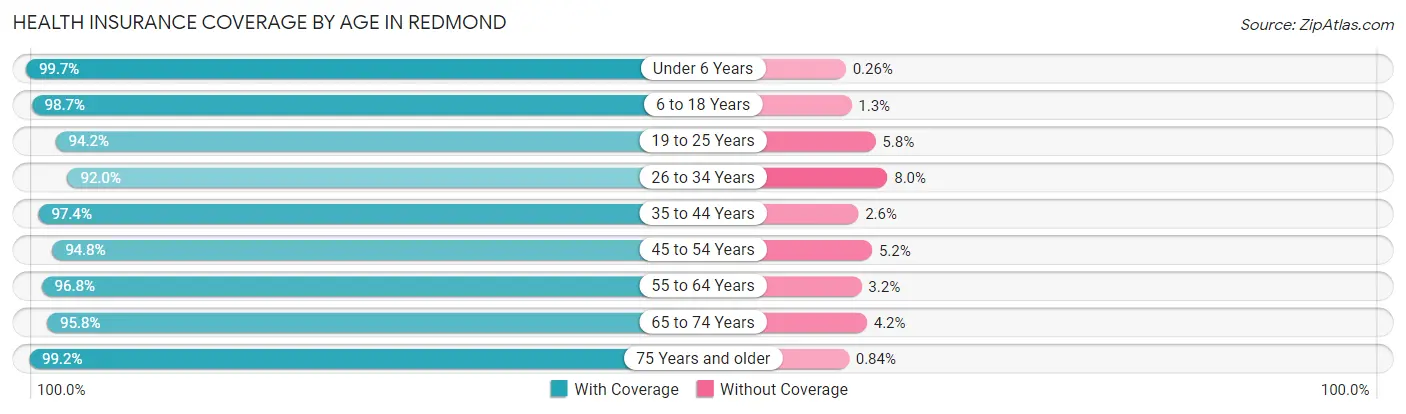
| Age Bracket | With Coverage | Without Coverage |
| Under 6 Years | 5,845 (99.7%) | 15 (0.3%) |
| 6 to 18 Years | 11,156 (98.7%) | 148 (1.3%) |
| 19 to 25 Years | 5,000 (94.2%) | 308 (5.8%) |
| 26 to 34 Years | 13,676 (92.0%) | 1,192 (8.0%) |
| 35 to 44 Years | 12,943 (97.4%) | 346 (2.6%) |
| 45 to 54 Years | 7,870 (94.8%) | 428 (5.2%) |
| 55 to 64 Years | 6,412 (96.8%) | 211 (3.2%) |
| 65 to 74 Years | 4,233 (95.8%) | 185 (4.2%) |
| 75 Years and older | 3,429 (99.2%) | 29 (0.8%) |
| Total | 70,564 (96.1%) | 2,862 (3.9%) |
Health Insurance Coverage by Citizenship Status in Redmond
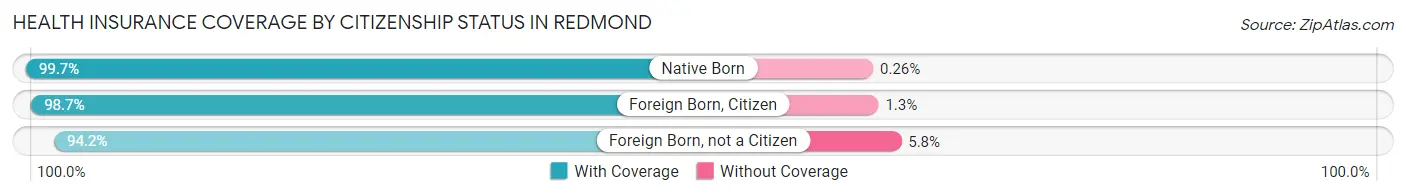
| Citizenship Status | With Coverage | Without Coverage |
| Native Born | 5,845 (99.7%) | 15 (0.3%) |
| Foreign Born, Citizen | 11,156 (98.7%) | 148 (1.3%) |
| Foreign Born, not a Citizen | 5,000 (94.2%) | 308 (5.8%) |
Health Insurance Coverage by Household Income in Redmond
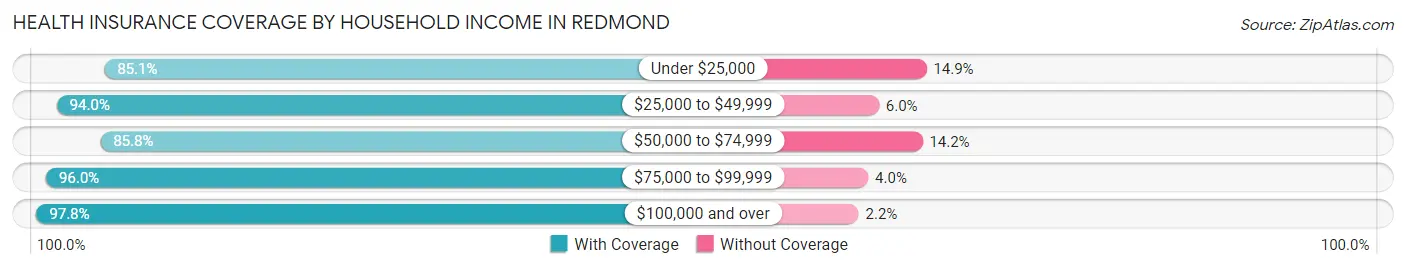
| Household Income | With Coverage | Without Coverage |
| Under $25,000 | 2,959 (85.1%) | 519 (14.9%) |
| $25,000 to $49,999 | 3,773 (94.0%) | 241 (6.0%) |
| $50,000 to $74,999 | 3,938 (85.8%) | 650 (14.2%) |
| $75,000 to $99,999 | 4,490 (96.0%) | 187 (4.0%) |
| $100,000 and over | 55,259 (97.8%) | 1,246 (2.2%) |
Public vs Private Health Insurance Coverage by Age in Redmond
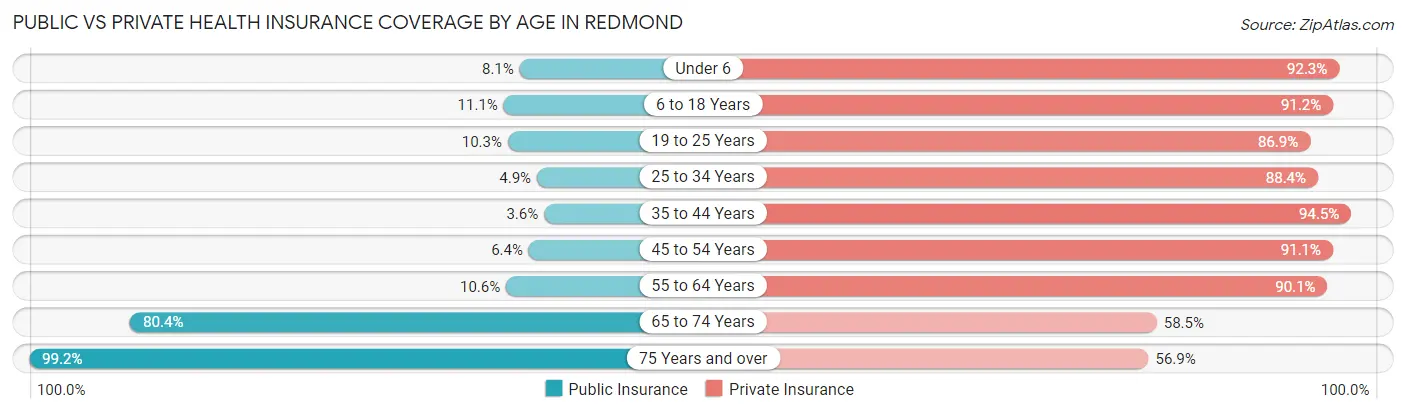
| Age Bracket | Public Insurance | Private Insurance |
| Under 6 | 476 (8.1%) | 5,409 (92.3%) |
| 6 to 18 Years | 1,253 (11.1%) | 10,308 (91.2%) |
| 19 to 25 Years | 547 (10.3%) | 4,613 (86.9%) |
| 25 to 34 Years | 728 (4.9%) | 13,137 (88.4%) |
| 35 to 44 Years | 476 (3.6%) | 12,564 (94.5%) |
| 45 to 54 Years | 533 (6.4%) | 7,563 (91.1%) |
| 55 to 64 Years | 704 (10.6%) | 5,969 (90.1%) |
| 65 to 74 Years | 3,552 (80.4%) | 2,583 (58.5%) |
| 75 Years and over | 3,429 (99.2%) | 1,969 (56.9%) |
| Total | 11,698 (15.9%) | 64,115 (87.3%) |
Disability Status by Sex by Age in Redmond
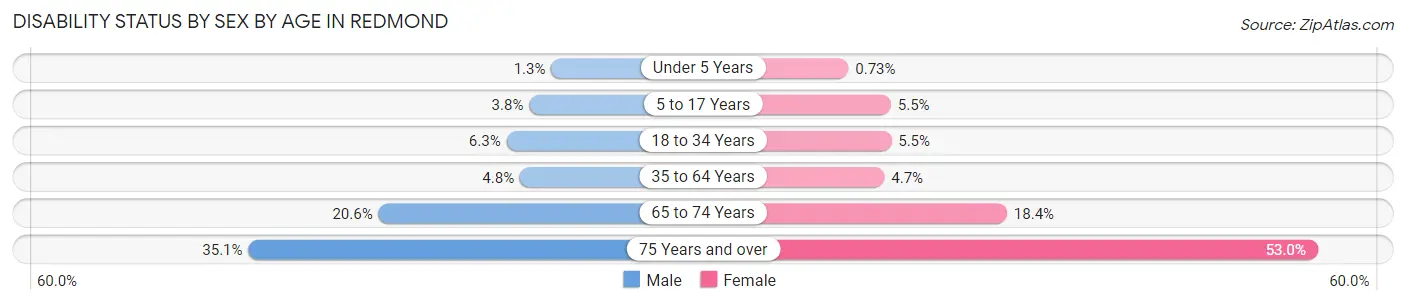
| Age Bracket | Male | Female |
| Under 5 Years | 37 (1.3%) | 17 (0.7%) |
| 5 to 17 Years | 225 (3.8%) | 299 (5.5%) |
| 18 to 34 Years | 724 (6.3%) | 519 (5.5%) |
| 35 to 64 Years | 722 (4.8%) | 628 (4.7%) |
| 65 to 74 Years | 417 (20.6%) | 440 (18.4%) |
| 75 Years and over | 436 (35.1%) | 1,174 (53.0%) |
Disability Class by Sex by Age in Redmond
Disability Class: Hearing Difficulty
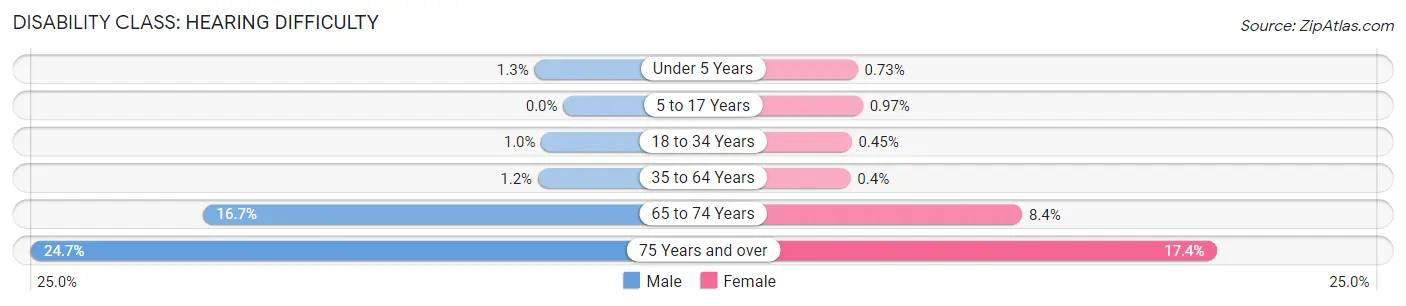
| Age Bracket | Male | Female |
| Under 5 Years | 37 (1.3%) | 17 (0.7%) |
| 5 to 17 Years | 0 (0.0%) | 53 (1.0%) |
| 18 to 34 Years | 117 (1.0%) | 42 (0.4%) |
| 35 to 64 Years | 177 (1.2%) | 53 (0.4%) |
| 65 to 74 Years | 338 (16.7%) | 200 (8.4%) |
| 75 Years and over | 307 (24.7%) | 385 (17.4%) |
Disability Class: Vision Difficulty
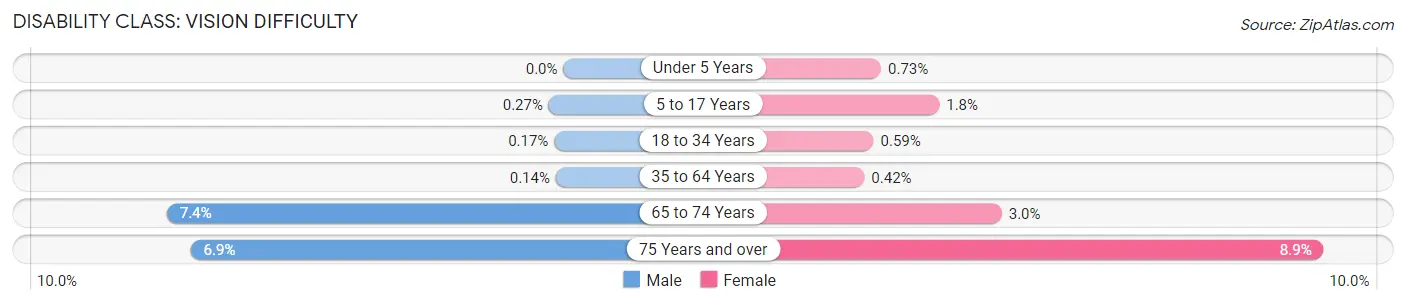
| Age Bracket | Male | Female |
| Under 5 Years | 0 (0.0%) | 17 (0.7%) |
| 5 to 17 Years | 16 (0.3%) | 99 (1.8%) |
| 18 to 34 Years | 19 (0.2%) | 56 (0.6%) |
| 35 to 64 Years | 21 (0.1%) | 56 (0.4%) |
| 65 to 74 Years | 149 (7.4%) | 71 (3.0%) |
| 75 Years and over | 86 (6.9%) | 198 (8.9%) |
Disability Class: Cognitive Difficulty
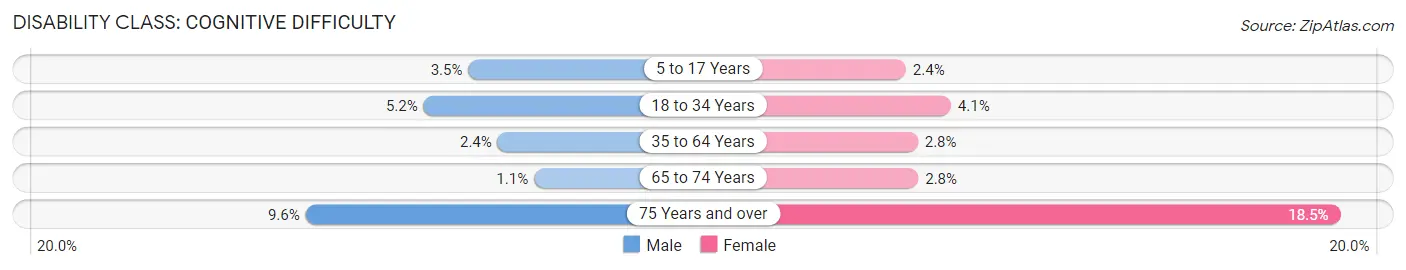
| Age Bracket | Male | Female |
| 5 to 17 Years | 209 (3.5%) | 130 (2.4%) |
| 18 to 34 Years | 594 (5.2%) | 381 (4.1%) |
| 35 to 64 Years | 365 (2.4%) | 373 (2.8%) |
| 65 to 74 Years | 22 (1.1%) | 68 (2.8%) |
| 75 Years and over | 119 (9.6%) | 410 (18.5%) |
Disability Class: Ambulatory Difficulty
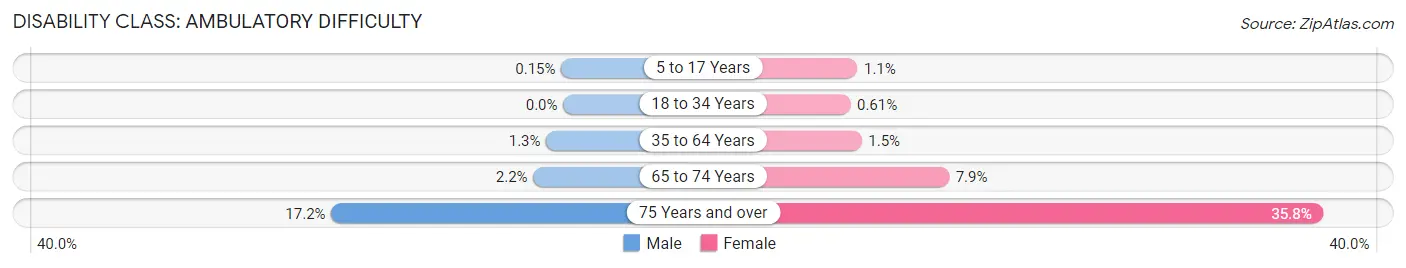
| Age Bracket | Male | Female |
| 5 to 17 Years | 9 (0.2%) | 62 (1.1%) |
| 18 to 34 Years | 0 (0.0%) | 57 (0.6%) |
| 35 to 64 Years | 189 (1.3%) | 192 (1.5%) |
| 65 to 74 Years | 45 (2.2%) | 190 (7.9%) |
| 75 Years and over | 214 (17.2%) | 792 (35.8%) |
Disability Class: Self-Care Difficulty
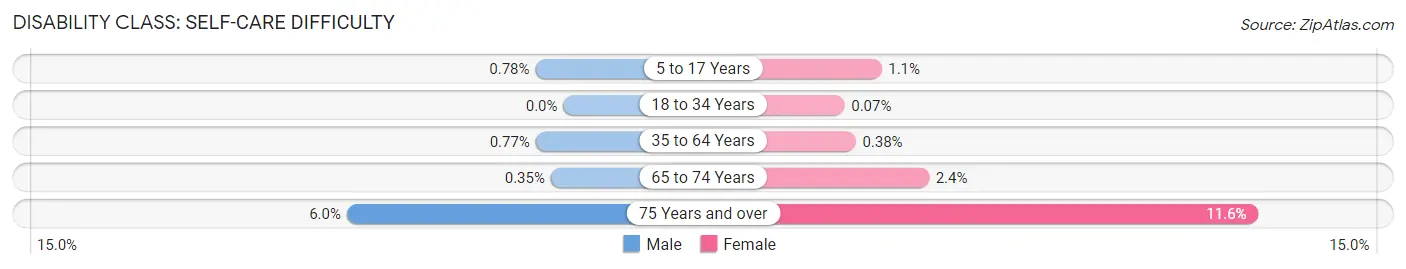
| Age Bracket | Male | Female |
| 5 to 17 Years | 46 (0.8%) | 60 (1.1%) |
| 18 to 34 Years | 0 (0.0%) | 7 (0.1%) |
| 35 to 64 Years | 115 (0.8%) | 50 (0.4%) |
| 65 to 74 Years | 7 (0.4%) | 58 (2.4%) |
| 75 Years and over | 75 (6.0%) | 257 (11.6%) |
Technology Access in Redmond
Computing Device Access in Redmond
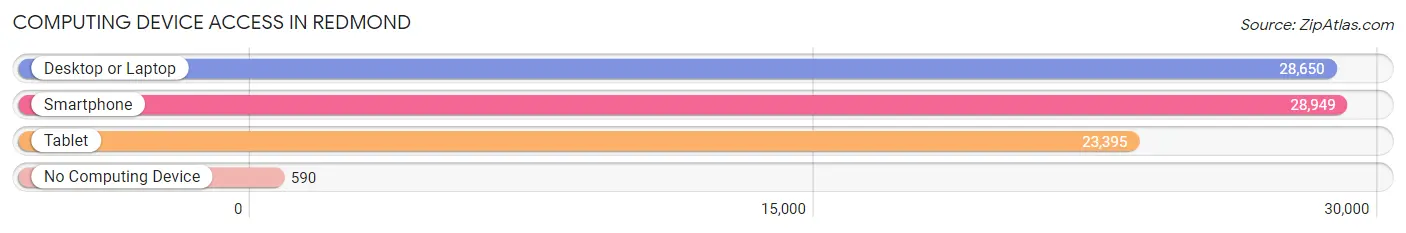
| Device Type | # Households | % Households |
| Desktop or Laptop | 28,650 | 94.9% |
| Smartphone | 28,949 | 95.9% |
| Tablet | 23,395 | 77.5% |
| No Computing Device | 590 | 1.9% |
| Total | 30,190 | 100.0% |
Internet Access in Redmond
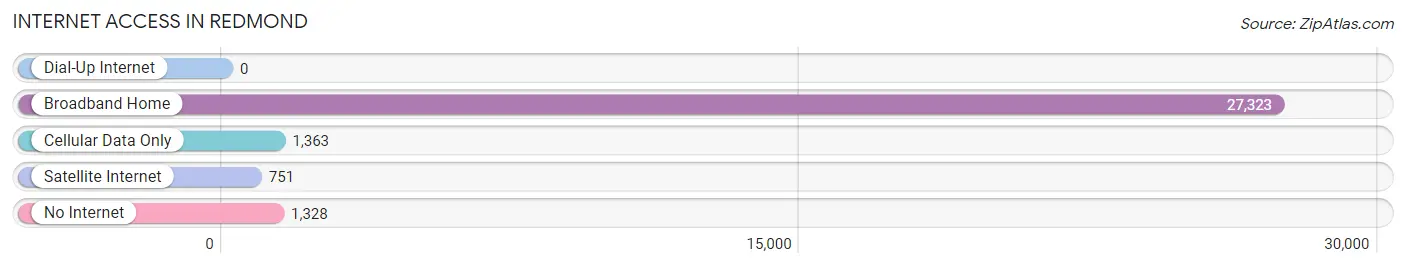
| Internet Type | # Households | % Households |
| Dial-Up Internet | 0 | 0.0% |
| Broadband Home | 27,323 | 90.5% |
| Cellular Data Only | 1,363 | 4.5% |
| Satellite Internet | 751 | 2.5% |
| No Internet | 1,328 | 4.4% |
| Total | 30,190 | 100.0% |
Redmond Summary
Redmond, Washington is a city located in King County, Washington, United States, and is part of the Seattle metropolitan area. The city is situated on the east side of Lake Sammamish, and is bordered by Bellevue to the west, Kirkland to the north, and Sammamish to the east. Redmond is home to Microsoft and Nintendo of America, and is the birthplace of the software giant.
History
The area that is now Redmond was originally inhabited by the Snoqualmie and Duwamish Native American tribes. The first European settlers arrived in the area in the late 1800s, and the city was officially incorporated in 1912. Redmond was initially a small farming community, but the arrival of the Great Northern Railway in the early 1900s spurred growth and development.
In the 1950s, the city began to experience a population boom, as the area became a popular destination for people looking to escape the hustle and bustle of Seattle. This growth was further accelerated by the arrival of Microsoft in 1979, which established its headquarters in Redmond.
Geography
Redmond is located in the heart of the Puget Sound region, and is situated on the east side of Lake Sammamish. The city is bordered by Bellevue to the west, Kirkland to the north, and Sammamish to the east. Redmond is located at an elevation of approximately 300 feet above sea level, and has a total area of 18.7 square miles.
The city is home to several parks and green spaces, including Marymoor Park, Redmond Watershed Preserve, and Redmond Town Center. Redmond is also home to several lakes, including Lake Sammamish, Lake Washington, and Lake Union.
Economy
Redmond is home to several major employers, including Microsoft, Nintendo of America, and AT&T. The city is also home to several smaller businesses, including software companies, medical device manufacturers, and biotech firms.
The city’s economy is largely driven by the technology sector, and Redmond is home to several research and development centers. The city is also home to several shopping centers, restaurants, and entertainment venues.
Demographics
As of the 2010 census, Redmond had a population of 54,144. The city’s population is largely white (77.2%), with smaller percentages of Asian (14.2%), African American (2.3%), and Hispanic or Latino (4.3%) residents.
The median household income in Redmond is $97,845, and the median home value is $619,400. The city’s unemployment rate is 3.2%, and the poverty rate is 5.2%.
Redmond is a diverse and vibrant city, and is home to a variety of cultures and lifestyles. The city is a popular destination for people looking to escape the hustle and bustle of Seattle, and is home to several major employers and attractions. Redmond is a great place to live, work, and play, and is sure to continue to grow and thrive in the years to come.
Common Questions
What is Per Capita Income in Redmond?
Per Capita income in Redmond is $82,565.
What is the Median Family Income in Redmond?
Median Family Income in Redmond is $187,665.
What is the Median Household income in Redmond?
Median Household Income in Redmond is $155,287.
What is Income or Wage Gap in Redmond?
Income or Wage Gap in Redmond is 47.4%.
Women in Redmond earn 52.6 cents for every dollar earned by a man.
What is Inequality or Gini Index in Redmond?
Inequality or Gini Index in Redmond is 0.44.
What is the Total Population of Redmond?
Total Population of Redmond is 73,728.
What is the Total Male Population of Redmond?
Total Male Population of Redmond is 38,499.
What is the Total Female Population of Redmond?
Total Female Population of Redmond is 35,229.
What is the Ratio of Males per 100 Females in Redmond?
There are 109.28 Males per 100 Females in Redmond.
What is the Ratio of Females per 100 Males in Redmond?
There are 91.51 Females per 100 Males in Redmond.
What is the Median Population Age in Redmond?
Median Population Age in Redmond is 34.7 Years.
What is the Average Family Size in Redmond
Average Family Size in Redmond is 3.0 People.
What is the Average Household Size in Redmond
Average Household Size in Redmond is 2.4 People.
How Large is the Labor Force in Redmond?
There are 41,268 People in the Labor Forcein in Redmond.
What is the Percentage of People in the Labor Force in Redmond?
70.4% of People are in the Labor Force in Redmond.
What is the Unemployment Rate in Redmond?
Unemployment Rate in Redmond is 3.7%.