Maltby, WA Map & Demographics
Maltby Map
Maltby Overview
$64,910
PER CAPITA INCOME
$173,622
AVG FAMILY INCOME
$167,928
AVG HOUSEHOLD INCOME
37.5%
WAGE / INCOME GAP [ % ]
62.5¢/ $1
WAGE / INCOME GAP [ $ ]
0.35
INEQUALITY / GINI INDEX
11,347
TOTAL POPULATION
5,869
MALE POPULATION
5,478
FEMALE POPULATION
107.14
MALES / 100 FEMALES
93.34
FEMALES / 100 MALES
46.0
MEDIAN AGE
3.1
AVG FAMILY SIZE
2.9
AVG HOUSEHOLD SIZE
6,370
LABOR FORCE [ PEOPLE ]
67.2%
PERCENT IN LABOR FORCE
3.1%
UNEMPLOYMENT RATE
Income in Maltby
Income Overview in Maltby
Per Capita Income in Maltby is $64,910, while median incomes of families and households are $173,622 and $167,928 respectively.
| Characteristic | Number | Measure |
| Per Capita Income | 11,347 | $64,910 |
| Median Family Income | 3,324 | $173,622 |
| Mean Family Income | 3,324 | $194,718 |
| Median Household Income | 3,887 | $167,928 |
| Mean Household Income | 3,887 | $185,626 |
| Income Deficit | 3,324 | $0 |
| Wage / Income Gap (%) | 11,347 | 37.52% |
| Wage / Income Gap ($) | 11,347 | 62.48¢ per $1 |
| Gini / Inequality Index | 11,347 | 0.35 |
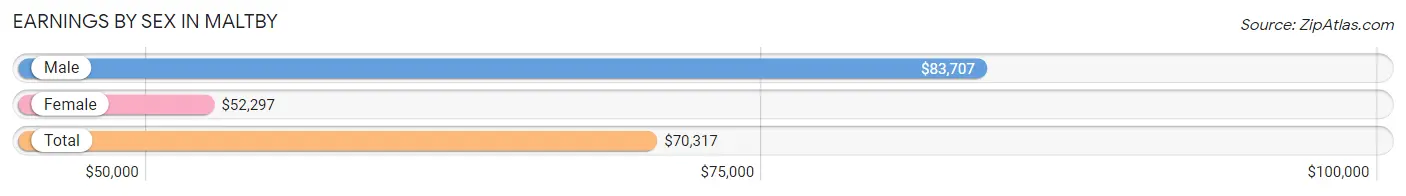
Earnings by Sex in Maltby
Average Earnings in Maltby are $70,317, $83,707 for men and $52,297 for women, a difference of 37.5%.
| Sex | Number | Average Earnings |
| Male | 3,672 (55.0%) | $83,707 |
| Female | 3,005 (45.0%) | $52,297 |
| Total | 6,677 (100.0%) | $70,317 |
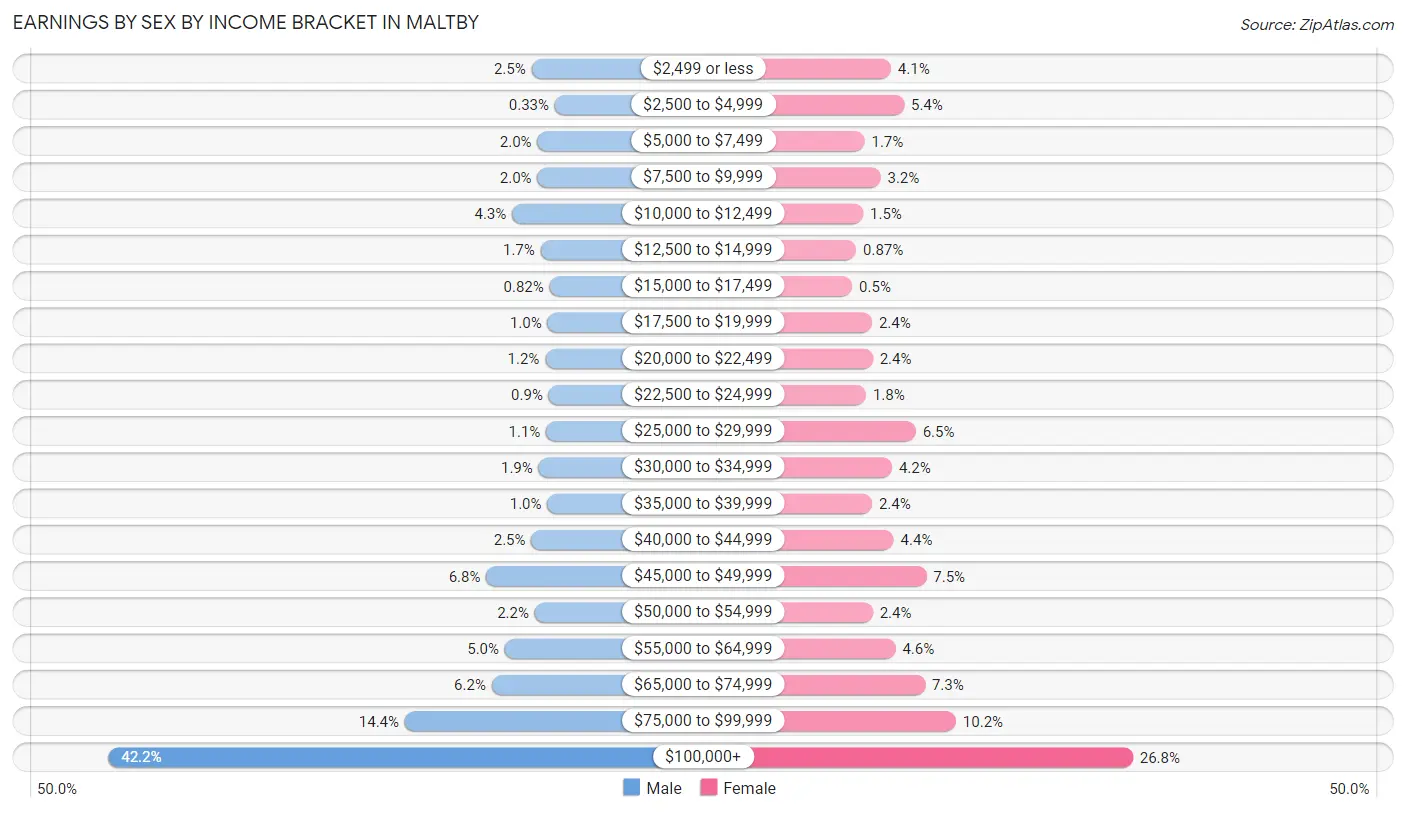
Earnings by Sex by Income Bracket in Maltby
The most common earnings brackets in Maltby are $100,000+ for men (1,548 | 42.2%) and $100,000+ for women (805 | 26.8%).
| Income | Male | Female |
| $2,499 or less | 92 (2.5%) | 124 (4.1%) |
| $2,500 to $4,999 | 12 (0.3%) | 161 (5.4%) |
| $5,000 to $7,499 | 72 (2.0%) | 50 (1.7%) |
| $7,500 to $9,999 | 72 (2.0%) | 95 (3.2%) |
| $10,000 to $12,499 | 159 (4.3%) | 46 (1.5%) |
| $12,500 to $14,999 | 61 (1.7%) | 26 (0.9%) |
| $15,000 to $17,499 | 30 (0.8%) | 15 (0.5%) |
| $17,500 to $19,999 | 37 (1.0%) | 71 (2.4%) |
| $20,000 to $22,499 | 45 (1.2%) | 73 (2.4%) |
| $22,500 to $24,999 | 33 (0.9%) | 54 (1.8%) |
| $25,000 to $29,999 | 42 (1.1%) | 194 (6.5%) |
| $30,000 to $34,999 | 68 (1.8%) | 127 (4.2%) |
| $35,000 to $39,999 | 38 (1.0%) | 71 (2.4%) |
| $40,000 to $44,999 | 93 (2.5%) | 132 (4.4%) |
| $45,000 to $49,999 | 248 (6.8%) | 224 (7.4%) |
| $50,000 to $54,999 | 81 (2.2%) | 73 (2.4%) |
| $55,000 to $64,999 | 184 (5.0%) | 137 (4.6%) |
| $65,000 to $74,999 | 229 (6.2%) | 220 (7.3%) |
| $75,000 to $99,999 | 528 (14.4%) | 307 (10.2%) |
| $100,000+ | 1,548 (42.2%) | 805 (26.8%) |
| Total | 3,672 (100.0%) | 3,005 (100.0%) |
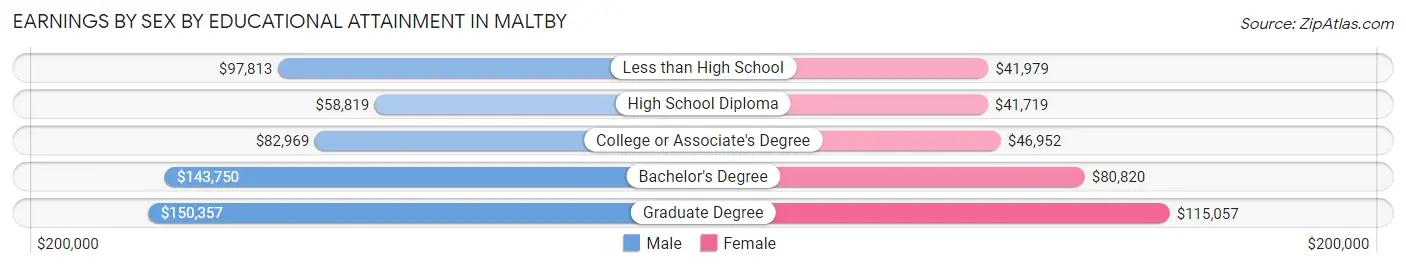
Earnings by Sex by Educational Attainment in Maltby
Average earnings in Maltby are $94,968 for men and $57,188 for women, a difference of 39.8%. Men with an educational attainment of graduate degree enjoy the highest average annual earnings of $150,357, while those with high school diploma education earn the least with $58,819. Women with an educational attainment of graduate degree earn the most with the average annual earnings of $115,057, while those with high school diploma education have the smallest earnings of $41,719.
| Educational Attainment | Male Income | Female Income |
| Less than High School | $97,813 | $41,979 |
| High School Diploma | $58,819 | $41,719 |
| College or Associate's Degree | $82,969 | $46,952 |
| Bachelor's Degree | $143,750 | $80,820 |
| Graduate Degree | $150,357 | $115,057 |
| Total | $94,968 | $57,188 |
Family Income in Maltby
Family Income Brackets in Maltby
According to the Maltby family income data, there are 1,283 families falling into the $200,000+ income range, which is the most common income bracket and makes up 38.6% of all families.
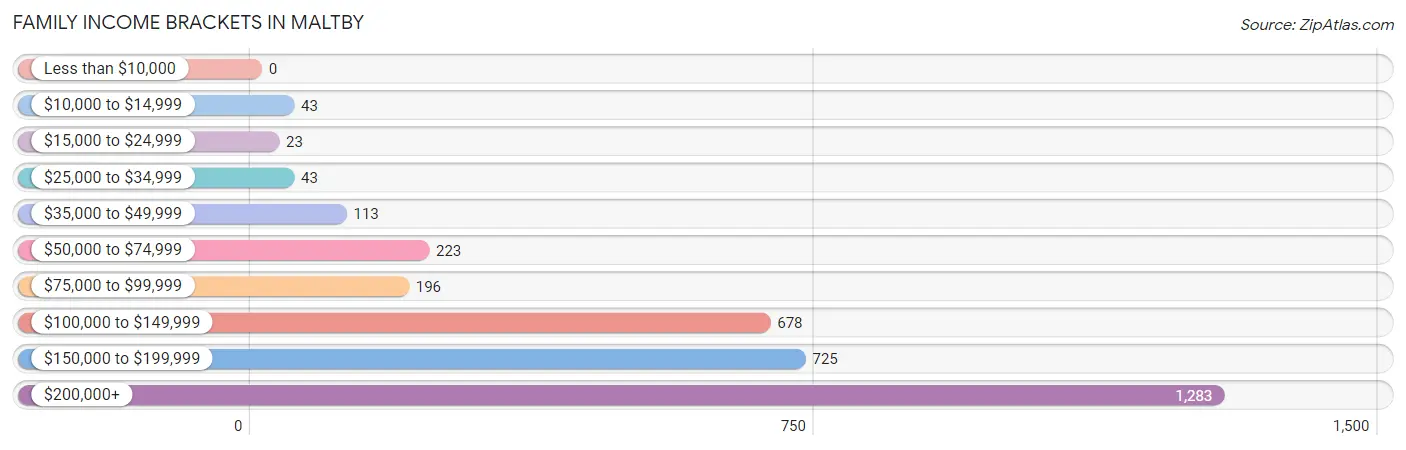
| Income Bracket | # Families | % Families |
| Less than $10,000 | 0 | 0.0% |
| $10,000 to $14,999 | 43 | 1.3% |
| $15,000 to $24,999 | 23 | 0.7% |
| $25,000 to $34,999 | 43 | 1.3% |
| $35,000 to $49,999 | 113 | 3.4% |
| $50,000 to $74,999 | 223 | 6.7% |
| $75,000 to $99,999 | 196 | 5.9% |
| $100,000 to $149,999 | 678 | 20.4% |
| $150,000 to $199,999 | 725 | 21.8% |
| $200,000+ | 1,283 | 38.6% |
Family Income by Famaliy Size in Maltby
4-person families (719 | 21.6%) account for the highest median family income in Maltby with $204,858 per family, while 2-person families (1,491 | 44.9%) have the highest median income of $70,438 per family member.
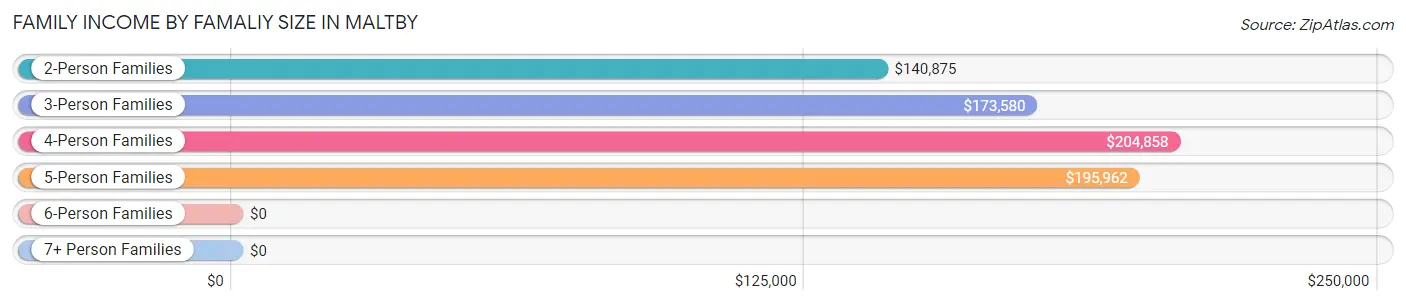
| Income Bracket | # Families | Median Income |
| 2-Person Families | 1,491 (44.9%) | $140,875 |
| 3-Person Families | 800 (24.1%) | $173,580 |
| 4-Person Families | 719 (21.6%) | $204,858 |
| 5-Person Families | 162 (4.9%) | $195,962 |
| 6-Person Families | 89 (2.7%) | $0 |
| 7+ Person Families | 63 (1.9%) | $0 |
| Total | 3,324 (100.0%) | $173,622 |
Family Income by Number of Earners in Maltby
The median family income in Maltby is $173,622, with families comprising 2 earners (1,599) having the highest median family income of $197,656, while families with no earners (337) have the lowest median family income of $76,750, accounting for 48.1% and 10.1% of families, respectively.
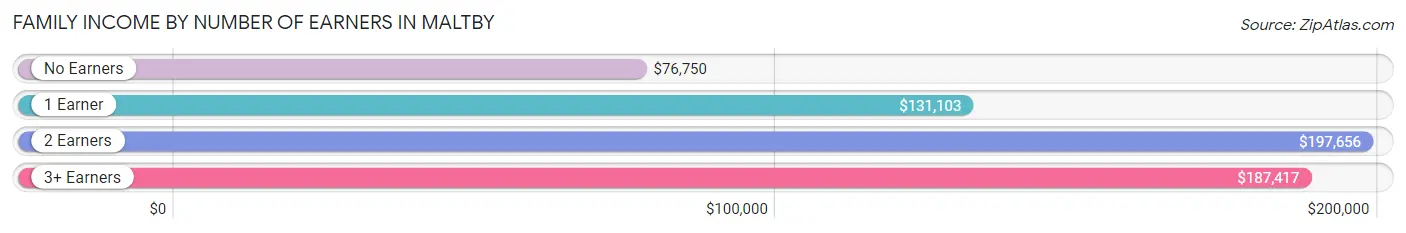
| Number of Earners | # Families | Median Income |
| No Earners | 337 (10.1%) | $76,750 |
| 1 Earner | 854 (25.7%) | $131,103 |
| 2 Earners | 1,599 (48.1%) | $197,656 |
| 3+ Earners | 534 (16.1%) | $187,417 |
| Total | 3,324 (100.0%) | $173,622 |
Household Income in Maltby
Household Income Brackets in Maltby
With 1,446 households falling in the category, the $200,000+ income range is the most frequent in Maltby, accounting for 37.2% of all households. In contrast, only 16 households (0.4%) fall into the less than $10,000 income bracket, making it the least populous group.
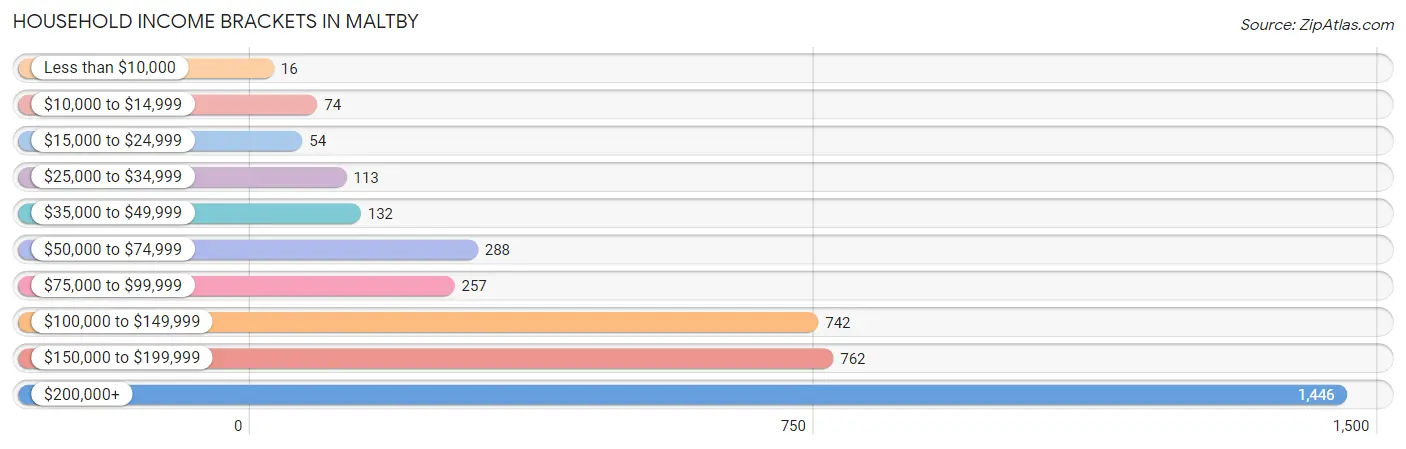
| Income Bracket | # Households | % Households |
| Less than $10,000 | 16 | 0.4% |
| $10,000 to $14,999 | 74 | 1.9% |
| $15,000 to $24,999 | 54 | 1.4% |
| $25,000 to $34,999 | 113 | 2.9% |
| $35,000 to $49,999 | 132 | 3.4% |
| $50,000 to $74,999 | 288 | 7.4% |
| $75,000 to $99,999 | 257 | 6.6% |
| $100,000 to $149,999 | 742 | 19.1% |
| $150,000 to $199,999 | 762 | 19.6% |
| $200,000+ | 1,446 | 37.2% |
Household Income by Householder Age in Maltby
The median household income in Maltby is $167,928, with the highest median household income of $206,989 found in the 15 to 24 years age bracket for the primary householder. A total of 81 households (2.1%) fall into this category. Meanwhile, the 65+ years age bracket for the primary householder has the lowest median household income of $116,118, with 1,009 households (26.0%) in this group.
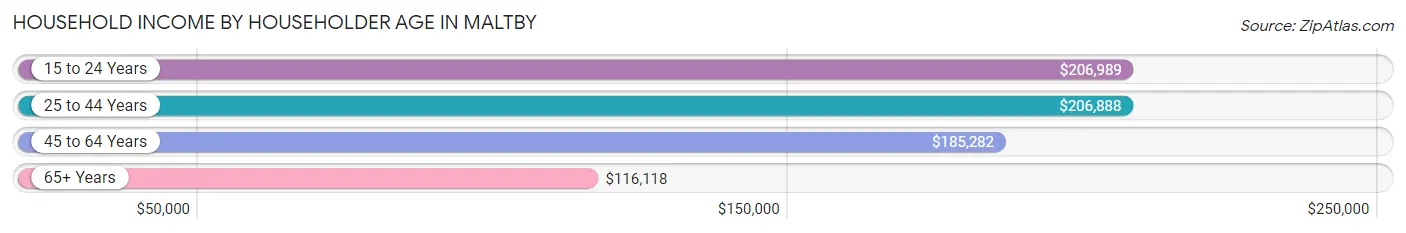
| Income Bracket | # Households | Median Income |
| 15 to 24 Years | 81 (2.1%) | $206,989 |
| 25 to 44 Years | 839 (21.6%) | $206,888 |
| 45 to 64 Years | 1,958 (50.4%) | $185,282 |
| 65+ Years | 1,009 (26.0%) | $116,118 |
| Total | 3,887 (100.0%) | $167,928 |
Poverty in Maltby
Income Below Poverty by Sex and Age in Maltby
With 2.7% poverty level for males and 3.5% for females among the residents of Maltby, 15 year old males and under 5 year old females are the most vulnerable to poverty, with 9 males (23.7%) and 17 females (8.7%) in their respective age groups living below the poverty level.
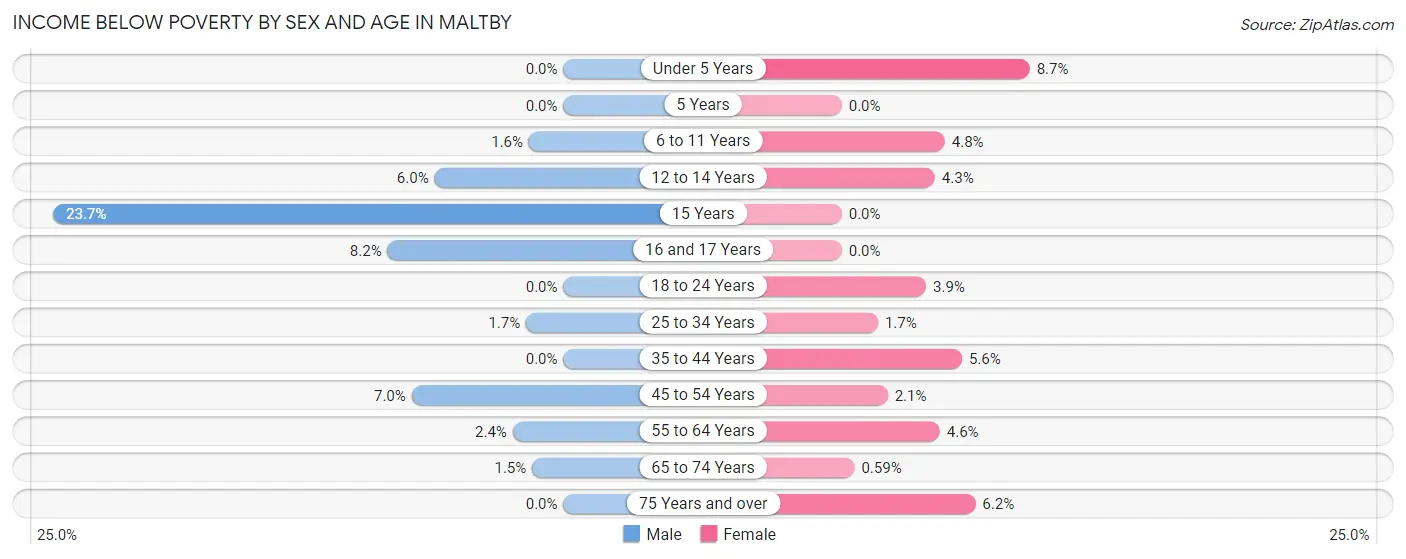
| Age Bracket | Male | Female |
| Under 5 Years | 0 (0.0%) | 17 (8.7%) |
| 5 Years | 0 (0.0%) | 0 (0.0%) |
| 6 to 11 Years | 7 (1.6%) | 16 (4.8%) |
| 12 to 14 Years | 11 (6.0%) | 8 (4.3%) |
| 15 Years | 9 (23.7%) | 0 (0.0%) |
| 16 and 17 Years | 20 (8.2%) | 0 (0.0%) |
| 18 to 24 Years | 0 (0.0%) | 12 (3.9%) |
| 25 to 34 Years | 9 (1.7%) | 10 (1.7%) |
| 35 to 44 Years | 0 (0.0%) | 39 (5.6%) |
| 45 to 54 Years | 64 (7.0%) | 19 (2.1%) |
| 55 to 64 Years | 26 (2.4%) | 48 (4.5%) |
| 65 to 74 Years | 10 (1.5%) | 4 (0.6%) |
| 75 Years and over | 0 (0.0%) | 17 (6.2%) |
| Total | 156 (2.7%) | 190 (3.5%) |
Income Above Poverty by Sex and Age in Maltby
According to the poverty statistics in Maltby, males aged under 5 years and females aged 5 years are the age groups that are most secure financially, with 100.0% of males and 100.0% of females in these age groups living above the poverty line.
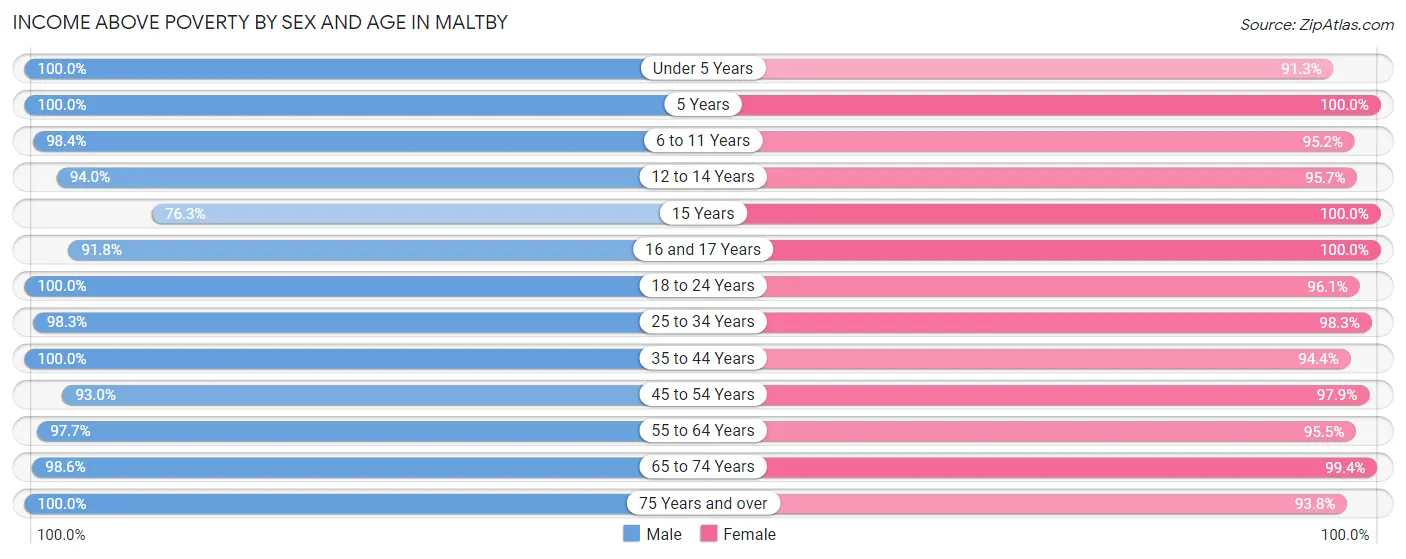
| Age Bracket | Male | Female |
| Under 5 Years | 305 (100.0%) | 178 (91.3%) |
| 5 Years | 16 (100.0%) | 58 (100.0%) |
| 6 to 11 Years | 431 (98.4%) | 319 (95.2%) |
| 12 to 14 Years | 173 (94.0%) | 177 (95.7%) |
| 15 Years | 29 (76.3%) | 97 (100.0%) |
| 16 and 17 Years | 225 (91.8%) | 81 (100.0%) |
| 18 to 24 Years | 448 (100.0%) | 295 (96.1%) |
| 25 to 34 Years | 512 (98.3%) | 587 (98.3%) |
| 35 to 44 Years | 691 (100.0%) | 660 (94.4%) |
| 45 to 54 Years | 845 (93.0%) | 874 (97.9%) |
| 55 to 64 Years | 1,081 (97.7%) | 1,007 (95.5%) |
| 65 to 74 Years | 678 (98.6%) | 675 (99.4%) |
| 75 Years and over | 267 (100.0%) | 257 (93.8%) |
| Total | 5,701 (97.3%) | 5,265 (96.5%) |
Income Below Poverty Among Married-Couple Families in Maltby
The poverty statistics for married-couple families in Maltby show that 1.7% or 52 of the total 3,003 families live below the poverty line. Families with 3 or 4 children have the highest poverty rate of 10.3%, comprising of 8 families. On the other hand, families with 5 or more children have the lowest poverty rate of 0.0%, which includes 0 families.
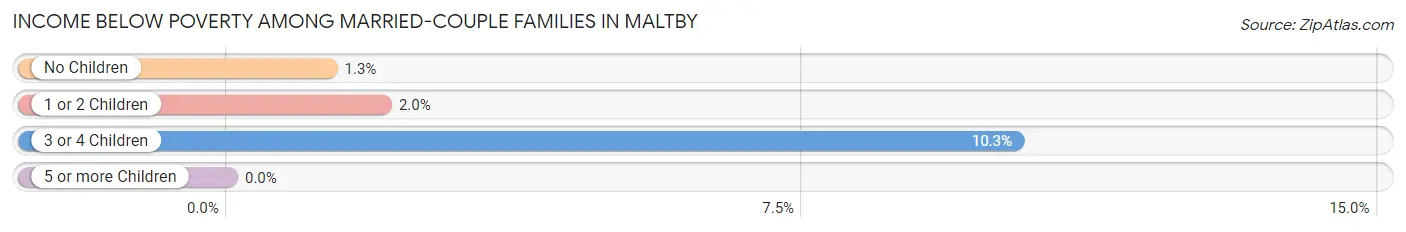
| Children | Above Poverty | Below Poverty |
| No Children | 1,894 (98.7%) | 25 (1.3%) |
| 1 or 2 Children | 924 (98.0%) | 19 (2.0%) |
| 3 or 4 Children | 70 (89.7%) | 8 (10.3%) |
| 5 or more Children | 63 (100.0%) | 0 (0.0%) |
| Total | 2,951 (98.3%) | 52 (1.7%) |
Income Below Poverty Among Single-Parent Households in Maltby
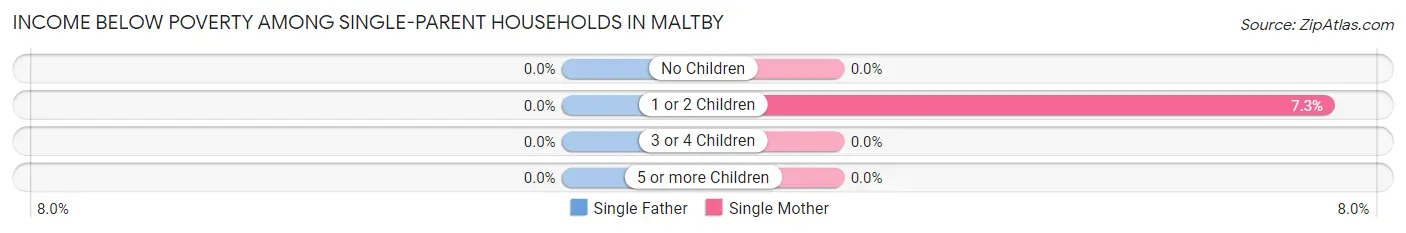
| Children | Single Father | Single Mother |
| No Children | 0 (0.0%) | 0 (0.0%) |
| 1 or 2 Children | 0 (0.0%) | 9 (7.3%) |
| 3 or 4 Children | 0 (0.0%) | 0 (0.0%) |
| 5 or more Children | 0 (0.0%) | 0 (0.0%) |
| Total | 0 (0.0%) | 9 (4.3%) |
Income Below Poverty Among Married-Couple vs Single-Parent Households in Maltby
The poverty data for Maltby shows that 52 of the married-couple family households (1.7%) and 9 of the single-parent households (2.8%) are living below the poverty level. Within the married-couple family households, those with 3 or 4 children have the highest poverty rate, with 8 households (10.3%) falling below the poverty line. Among the single-parent households, those with 1 or 2 children have the highest poverty rate, with 9 household (6.6%) living below poverty.
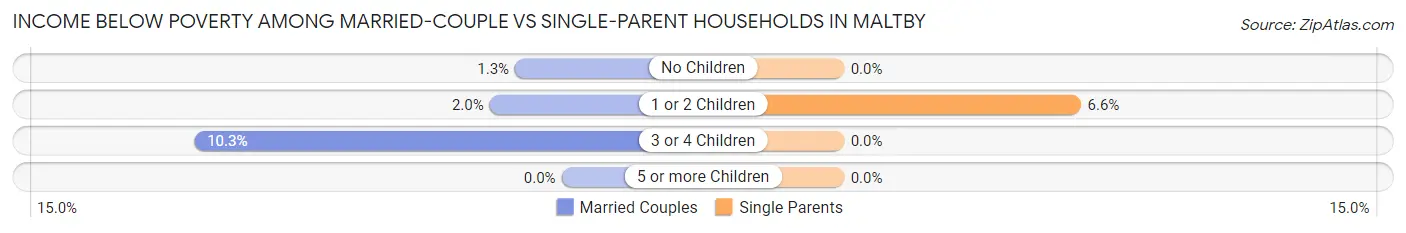
| Children | Married-Couple Families | Single-Parent Households |
| No Children | 25 (1.3%) | 0 (0.0%) |
| 1 or 2 Children | 19 (2.0%) | 9 (6.6%) |
| 3 or 4 Children | 8 (10.3%) | 0 (0.0%) |
| 5 or more Children | 0 (0.0%) | 0 (0.0%) |
| Total | 52 (1.7%) | 9 (2.8%) |
Race in Maltby
The most populous races in Maltby are White / Caucasian (9,649 | 85.0%), Two or more Races (973 | 8.6%), and Hispanic or Latino (536 | 4.7%).
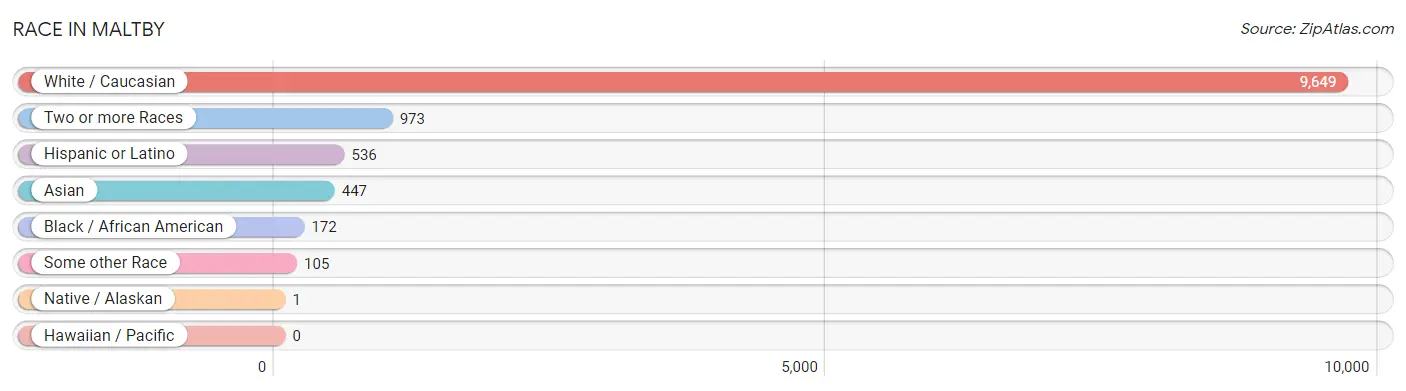
| Race | # Population | % Population |
| Asian | 447 | 3.9% |
| Black / African American | 172 | 1.5% |
| Hawaiian / Pacific | 0 | 0.0% |
| Hispanic or Latino | 536 | 4.7% |
| Native / Alaskan | 1 | 0.0% |
| White / Caucasian | 9,649 | 85.0% |
| Two or more Races | 973 | 8.6% |
| Some other Race | 105 | 0.9% |
| Total | 11,347 | 100.0% |
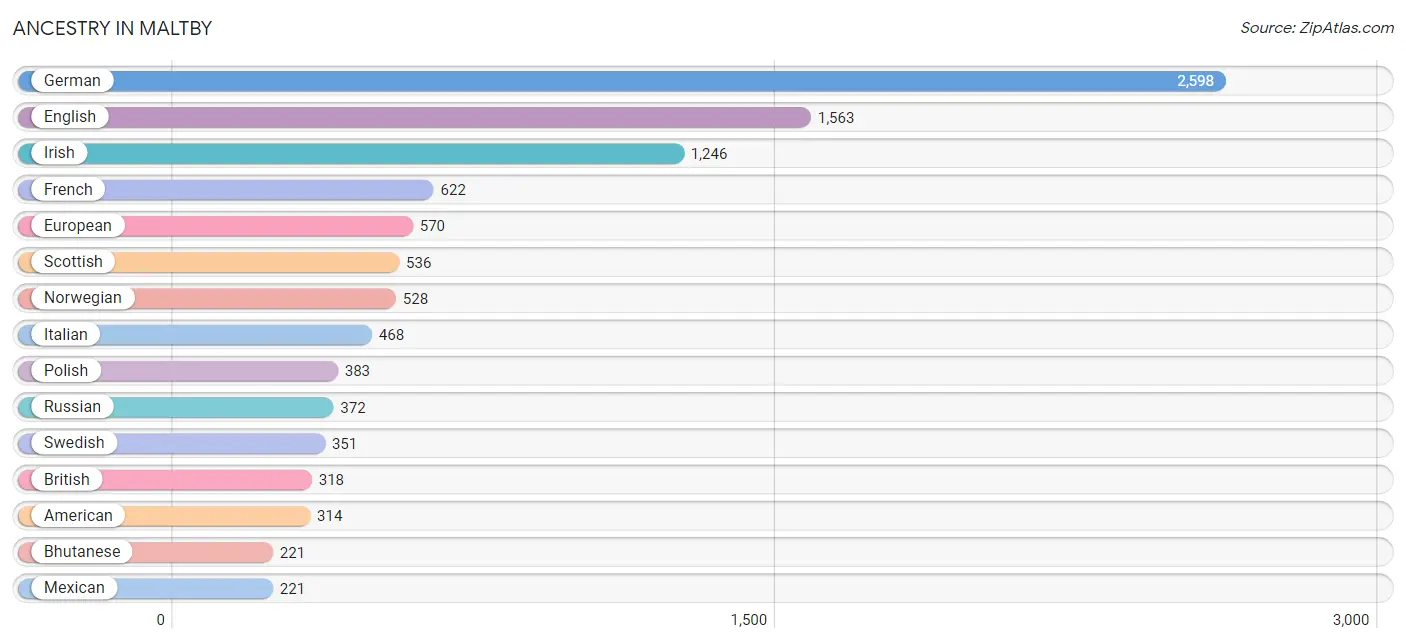
Ancestry in Maltby
The most populous ancestries reported in Maltby are German (2,598 | 22.9%), English (1,563 | 13.8%), Irish (1,246 | 11.0%), French (622 | 5.5%), and European (570 | 5.0%), together accounting for 58.2% of all Maltby residents.
| Ancestry | # Population | % Population |
| African | 10 | 0.1% |
| American | 314 | 2.8% |
| Arab | 36 | 0.3% |
| Argentinean | 49 | 0.4% |
| Australian | 5 | 0.0% |
| Austrian | 59 | 0.5% |
| Belgian | 13 | 0.1% |
| Bhutanese | 221 | 1.9% |
| Blackfeet | 18 | 0.2% |
| British | 318 | 2.8% |
| Burmese | 99 | 0.9% |
| Canadian | 53 | 0.5% |
| Central American | 10 | 0.1% |
| Cherokee | 14 | 0.1% |
| Chickasaw | 6 | 0.1% |
| Chilean | 77 | 0.7% |
| Choctaw | 45 | 0.4% |
| Colombian | 15 | 0.1% |
| Colville | 1 | 0.0% |
| Creek | 25 | 0.2% |
| Croatian | 25 | 0.2% |
| Cuban | 8 | 0.1% |
| Czech | 38 | 0.3% |
| Czechoslovakian | 7 | 0.1% |
| Danish | 88 | 0.8% |
| Dutch | 134 | 1.2% |
| Eastern European | 7 | 0.1% |
| English | 1,563 | 13.8% |
| Ethiopian | 28 | 0.3% |
| European | 570 | 5.0% |
| Filipino | 8 | 0.1% |
| Finnish | 97 | 0.9% |
| French | 622 | 5.5% |
| French Canadian | 24 | 0.2% |
| German | 2,598 | 22.9% |
| Greek | 18 | 0.2% |
| Hungarian | 28 | 0.3% |
| Icelander | 30 | 0.3% |
| Indian (Asian) | 131 | 1.1% |
| Iranian | 107 | 0.9% |
| Irish | 1,246 | 11.0% |
| Italian | 468 | 4.1% |
| Jamaican | 9 | 0.1% |
| Japanese | 19 | 0.2% |
| Korean | 60 | 0.5% |
| Lebanese | 31 | 0.3% |
| Macedonian | 6 | 0.1% |
| Mexican | 221 | 1.9% |
| Native Hawaiian | 23 | 0.2% |
| Nicaraguan | 10 | 0.1% |
| Northern European | 166 | 1.5% |
| Norwegian | 528 | 4.6% |
| Pakistani | 24 | 0.2% |
| Peruvian | 13 | 0.1% |
| Polish | 383 | 3.4% |
| Portuguese | 19 | 0.2% |
| Puerto Rican | 78 | 0.7% |
| Romanian | 155 | 1.4% |
| Russian | 372 | 3.3% |
| Scandinavian | 217 | 1.9% |
| Scotch-Irish | 93 | 0.8% |
| Scottish | 536 | 4.7% |
| Slavic | 6 | 0.1% |
| Slovak | 52 | 0.5% |
| South African | 18 | 0.2% |
| South American | 154 | 1.4% |
| Spaniard | 31 | 0.3% |
| Spanish | 34 | 0.3% |
| Sri Lankan | 113 | 1.0% |
| Subsaharan African | 56 | 0.5% |
| Swedish | 351 | 3.1% |
| Swiss | 41 | 0.4% |
| Syrian | 15 | 0.1% |
| Thai | 84 | 0.7% |
| Ukrainian | 97 | 0.9% |
| Welsh | 160 | 1.4% |
| Yakama | 99 | 0.9% |
| Yugoslavian | 35 | 0.3% | View All 78 Rows |
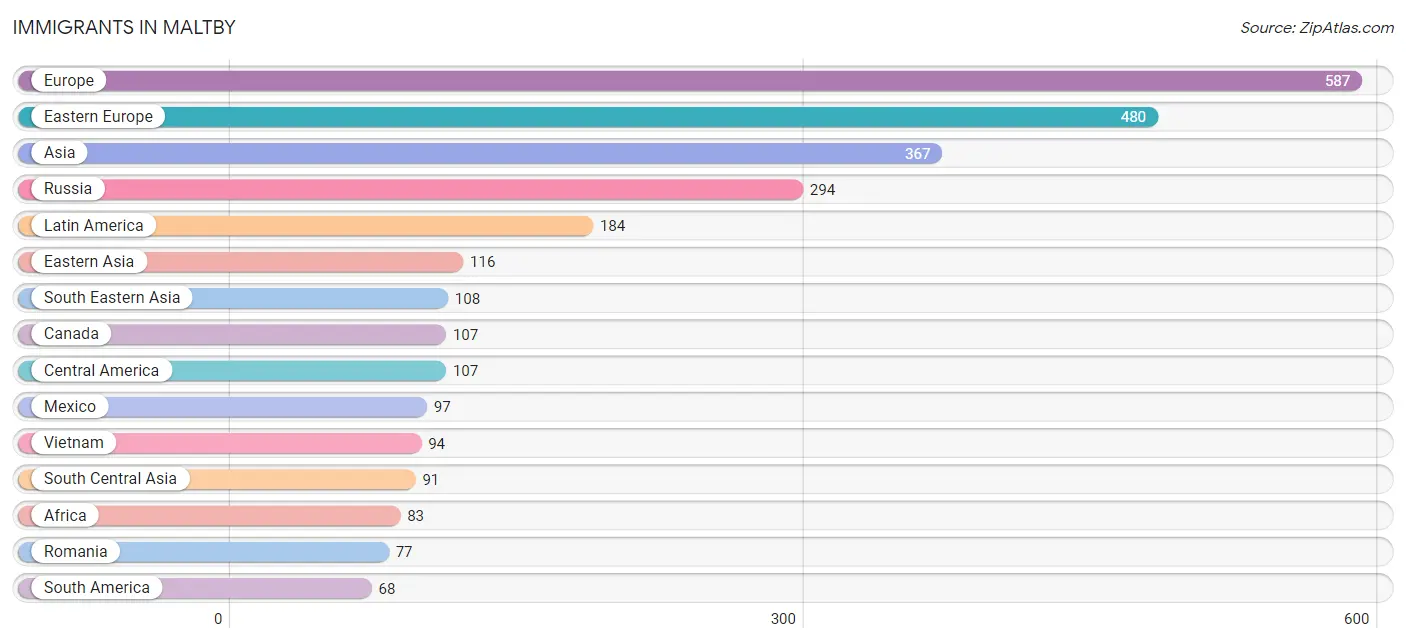
Immigrants in Maltby
The most numerous immigrant groups reported in Maltby came from Europe (587 | 5.2%), Eastern Europe (480 | 4.2%), Asia (367 | 3.2%), Russia (294 | 2.6%), and Latin America (184 | 1.6%), together accounting for 16.8% of all Maltby residents.
| Immigration Origin | # Population | % Population |
| Africa | 83 | 0.7% |
| Argentina | 22 | 0.2% |
| Asia | 367 | 3.2% |
| Australia | 5 | 0.0% |
| Bosnia and Herzegovina | 6 | 0.1% |
| Brazil | 6 | 0.1% |
| Cambodia | 5 | 0.0% |
| Canada | 107 | 0.9% |
| Caribbean | 9 | 0.1% |
| Central America | 107 | 0.9% |
| Chile | 25 | 0.2% |
| China | 43 | 0.4% |
| Colombia | 15 | 0.1% |
| Czechoslovakia | 20 | 0.2% |
| Denmark | 1 | 0.0% |
| Eastern Africa | 28 | 0.3% |
| Eastern Asia | 116 | 1.0% |
| Eastern Europe | 480 | 4.2% |
| England | 7 | 0.1% |
| Ethiopia | 28 | 0.3% |
| Europe | 587 | 5.2% |
| Germany | 50 | 0.4% |
| India | 56 | 0.5% |
| Iran | 21 | 0.2% |
| Israel | 19 | 0.2% |
| Jamaica | 9 | 0.1% |
| Japan | 58 | 0.5% |
| Korea | 15 | 0.1% |
| Latin America | 184 | 1.6% |
| Lebanon | 9 | 0.1% |
| Mexico | 97 | 0.9% |
| Nicaragua | 10 | 0.1% |
| North Macedonia | 6 | 0.1% |
| Northern Europe | 57 | 0.5% |
| Oceania | 11 | 0.1% |
| Pakistan | 9 | 0.1% |
| Philippines | 9 | 0.1% |
| Poland | 28 | 0.3% |
| Romania | 77 | 0.7% |
| Russia | 294 | 2.6% |
| Scotland | 6 | 0.1% |
| South Africa | 45 | 0.4% |
| South America | 68 | 0.6% |
| South Central Asia | 91 | 0.8% |
| South Eastern Asia | 108 | 0.9% |
| Sweden | 4 | 0.0% |
| Syria | 5 | 0.0% |
| Ukraine | 43 | 0.4% |
| Uzbekistan | 5 | 0.0% |
| Vietnam | 94 | 0.8% |
| Western Africa | 10 | 0.1% |
| Western Asia | 33 | 0.3% |
| Western Europe | 50 | 0.4% | View All 53 Rows |
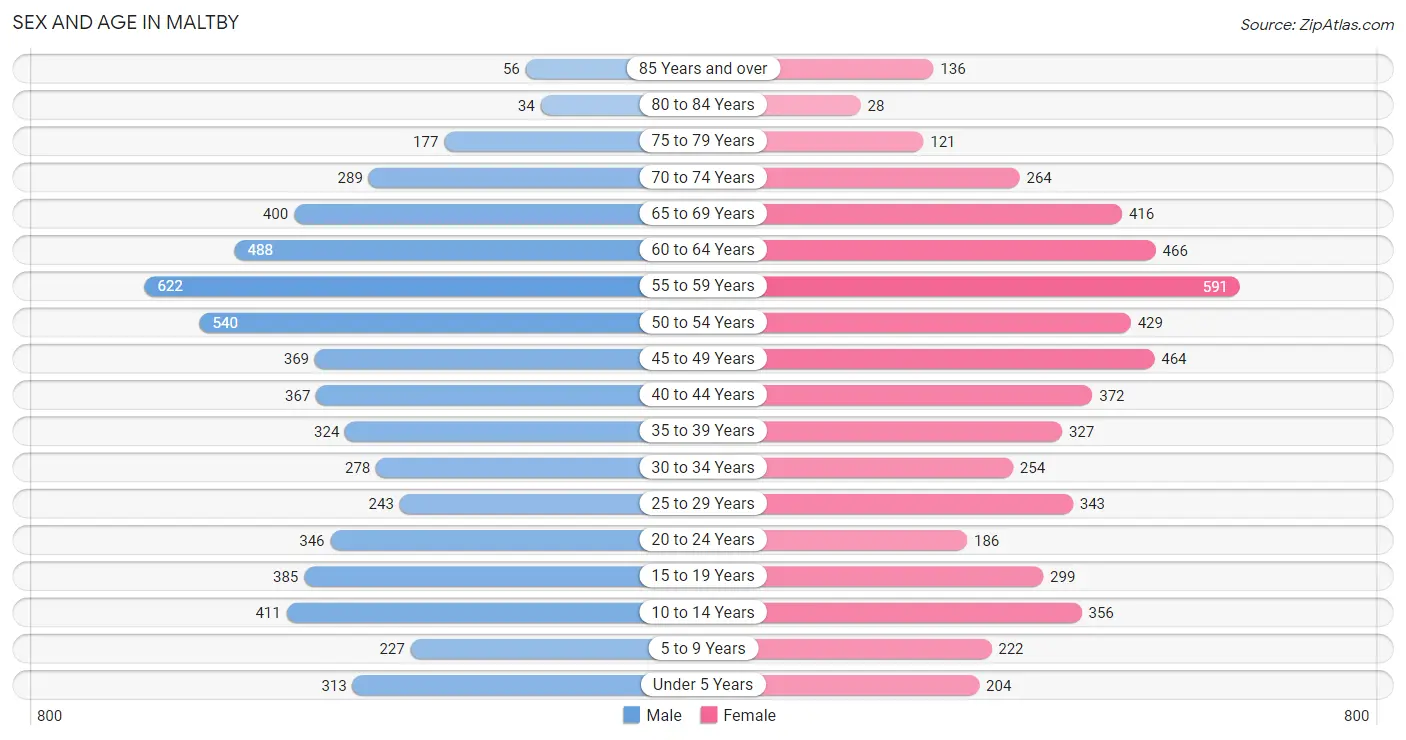
Sex and Age in Maltby
Sex and Age in Maltby
The most populous age groups in Maltby are 55 to 59 Years (622 | 10.6%) for men and 55 to 59 Years (591 | 10.8%) for women.
| Age Bracket | Male | Female |
| Under 5 Years | 313 (5.3%) | 204 (3.7%) |
| 5 to 9 Years | 227 (3.9%) | 222 (4.1%) |
| 10 to 14 Years | 411 (7.0%) | 356 (6.5%) |
| 15 to 19 Years | 385 (6.6%) | 299 (5.5%) |
| 20 to 24 Years | 346 (5.9%) | 186 (3.4%) |
| 25 to 29 Years | 243 (4.1%) | 343 (6.3%) |
| 30 to 34 Years | 278 (4.7%) | 254 (4.6%) |
| 35 to 39 Years | 324 (5.5%) | 327 (6.0%) |
| 40 to 44 Years | 367 (6.2%) | 372 (6.8%) |
| 45 to 49 Years | 369 (6.3%) | 464 (8.5%) |
| 50 to 54 Years | 540 (9.2%) | 429 (7.8%) |
| 55 to 59 Years | 622 (10.6%) | 591 (10.8%) |
| 60 to 64 Years | 488 (8.3%) | 466 (8.5%) |
| 65 to 69 Years | 400 (6.8%) | 416 (7.6%) |
| 70 to 74 Years | 289 (4.9%) | 264 (4.8%) |
| 75 to 79 Years | 177 (3.0%) | 121 (2.2%) |
| 80 to 84 Years | 34 (0.6%) | 28 (0.5%) |
| 85 Years and over | 56 (0.9%) | 136 (2.5%) |
| Total | 5,869 (100.0%) | 5,478 (100.0%) |
Families and Households in Maltby
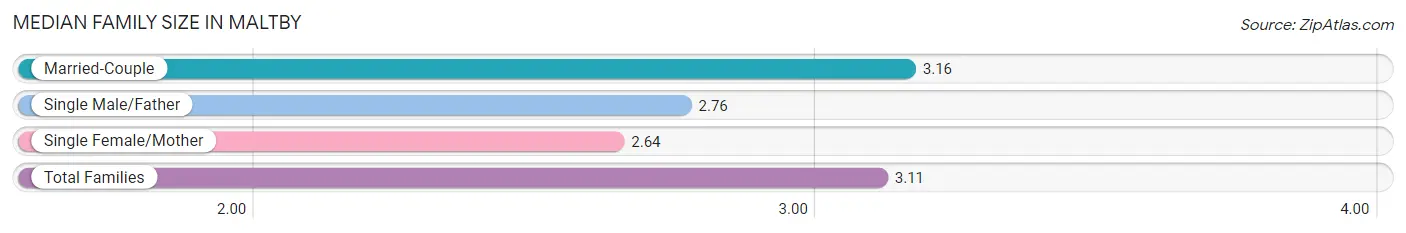
Median Family Size in Maltby
The median family size in Maltby is 3.11 persons per family, with married-couple families (3,003 | 90.3%) accounting for the largest median family size of 3.16 persons per family. On the other hand, single female/mother families (208 | 6.3%) represent the smallest median family size with 2.64 persons per family.
| Family Type | # Families | Family Size |
| Married-Couple | 3,003 (90.3%) | 3.16 |
| Single Male/Father | 113 (3.4%) | 2.76 |
| Single Female/Mother | 208 (6.3%) | 2.64 |
| Total Families | 3,324 (100.0%) | 3.11 |
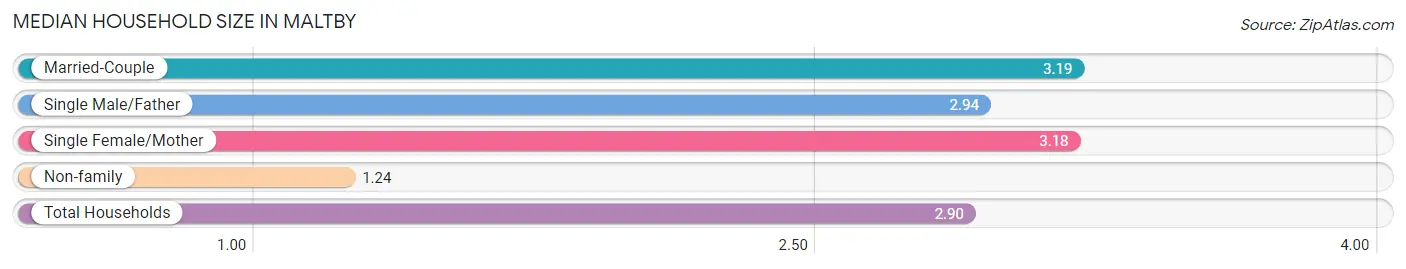
Median Household Size in Maltby
The median household size in Maltby is 2.90 persons per household, with married-couple households (3,003 | 77.3%) accounting for the largest median household size of 3.19 persons per household. non-family households (563 | 14.5%) represent the smallest median household size with 1.24 persons per household.
| Household Type | # Households | Household Size |
| Married-Couple | 3,003 (77.3%) | 3.19 |
| Single Male/Father | 113 (2.9%) | 2.94 |
| Single Female/Mother | 208 (5.3%) | 3.18 |
| Non-family | 563 (14.5%) | 1.24 |
| Total Households | 3,887 (100.0%) | 2.90 |
Household Size by Marriage Status in Maltby
Out of a total of 3,887 households in Maltby, 3,324 (85.5%) are family households, while 563 (14.5%) are nonfamily households. The most numerous type of family households are 2-person households, comprising 1,429, and the most common type of nonfamily households are 1-person households, comprising 441.
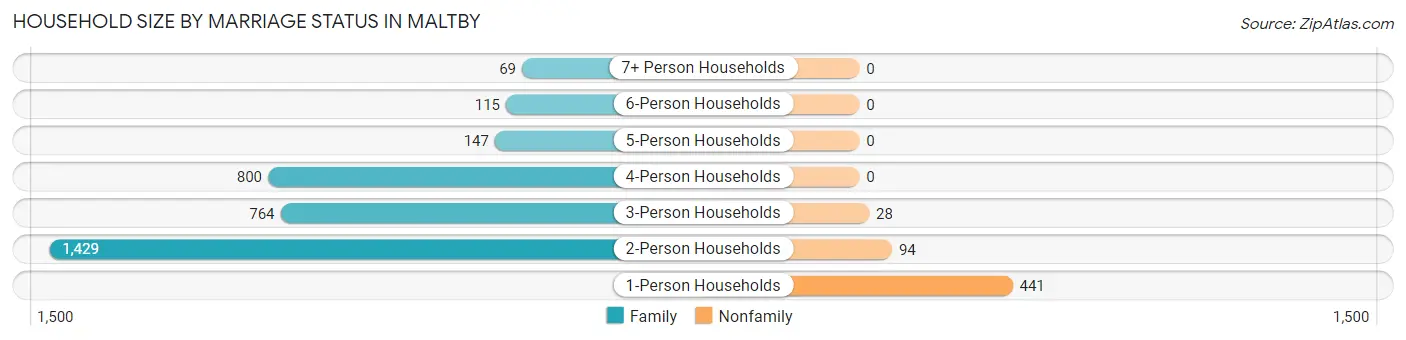
| Household Size | Family Households | Nonfamily Households |
| 1-Person Households | - | 441 (11.4%) |
| 2-Person Households | 1,429 (36.8%) | 94 (2.4%) |
| 3-Person Households | 764 (19.7%) | 28 (0.7%) |
| 4-Person Households | 800 (20.6%) | 0 (0.0%) |
| 5-Person Households | 147 (3.8%) | 0 (0.0%) |
| 6-Person Households | 115 (3.0%) | 0 (0.0%) |
| 7+ Person Households | 69 (1.8%) | 0 (0.0%) |
| Total | 3,324 (85.5%) | 563 (14.5%) |
Female Fertility in Maltby
Fertility by Age in Maltby
Average fertility rate in Maltby is 53.0 births per 1,000 women. Women in the age bracket of 20 to 34 years have the highest fertility rate with 125.0 births per 1,000 women. Women in the age bracket of 20 to 34 years acount for 80.3% of all women with births.
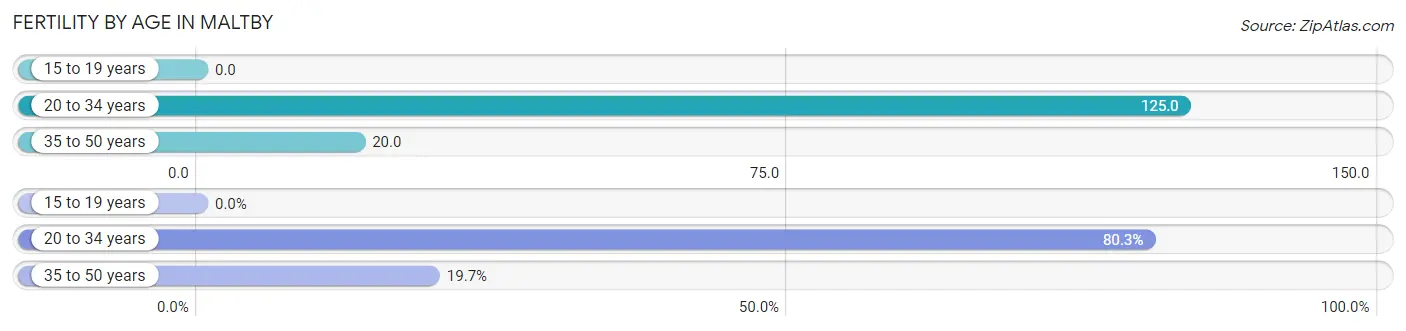
| Age Bracket | Women with Births | Births / 1,000 Women |
| 15 to 19 years | 0 (0.0%) | 0.0 |
| 20 to 34 years | 98 (80.3%) | 125.0 |
| 35 to 50 years | 24 (19.7%) | 20.0 |
| Total | 122 (100.0%) | 53.0 |
Fertility by Age by Marriage Status in Maltby
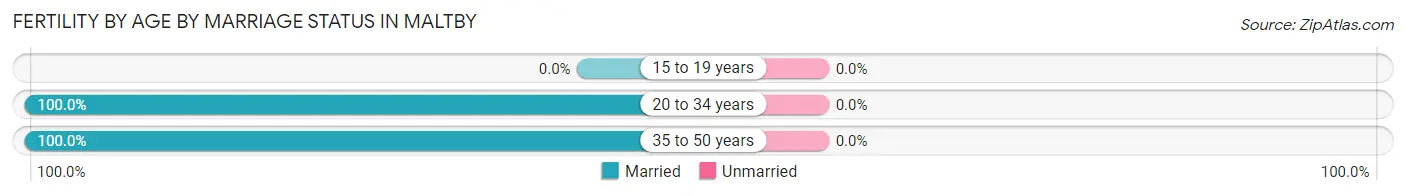
| Age Bracket | Married | Unmarried |
| 15 to 19 years | 0 (0.0%) | 0 (0.0%) |
| 20 to 34 years | 98 (100.0%) | 0 (0.0%) |
| 35 to 50 years | 24 (100.0%) | 0 (0.0%) |
| Total | 122 (100.0%) | 0 (0.0%) |
Fertility by Education in Maltby
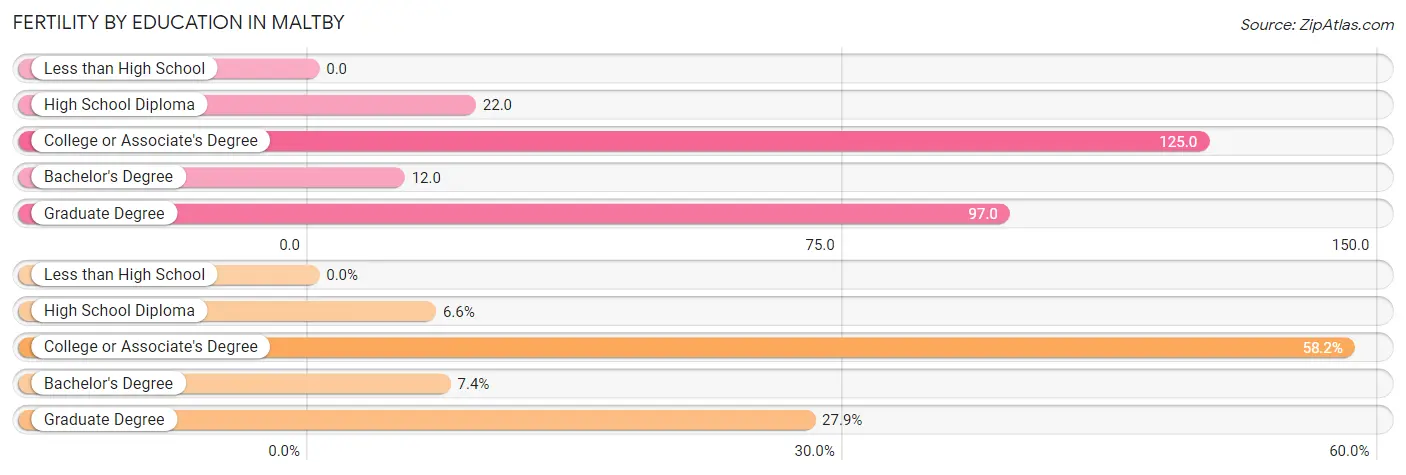
| Educational Attainment | Women with Births | Births / 1,000 Women |
| Less than High School | 0 (0.0%) | 0.0 |
| High School Diploma | 8 (6.6%) | 22.0 |
| College or Associate's Degree | 71 (58.2%) | 125.0 |
| Bachelor's Degree | 9 (7.4%) | 12.0 |
| Graduate Degree | 34 (27.9%) | 97.0 |
| Total | 122 (100.0%) | 53.0 |
Fertility by Education by Marriage Status in Maltby
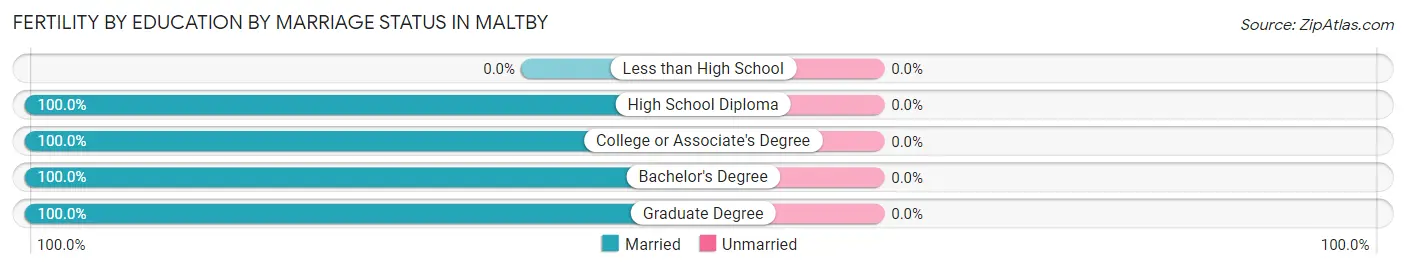
| Educational Attainment | Married | Unmarried |
| Less than High School | 0 (0.0%) | 0 (0.0%) |
| High School Diploma | 8 (100.0%) | 0 (0.0%) |
| College or Associate's Degree | 71 (100.0%) | 0 (0.0%) |
| Bachelor's Degree | 9 (100.0%) | 0 (0.0%) |
| Graduate Degree | 34 (100.0%) | 0 (0.0%) |
| Total | 122 (100.0%) | 0 (0.0%) |
Employment Characteristics in Maltby
Employment by Class of Employer in Maltby
Among the 6,048 employed individuals in Maltby, private company employees (4,225 | 69.9%), not-for-profit organizations (514 | 8.5%), and self-employed (not incorporated) (454 | 7.5%) make up the most common classes of employment.
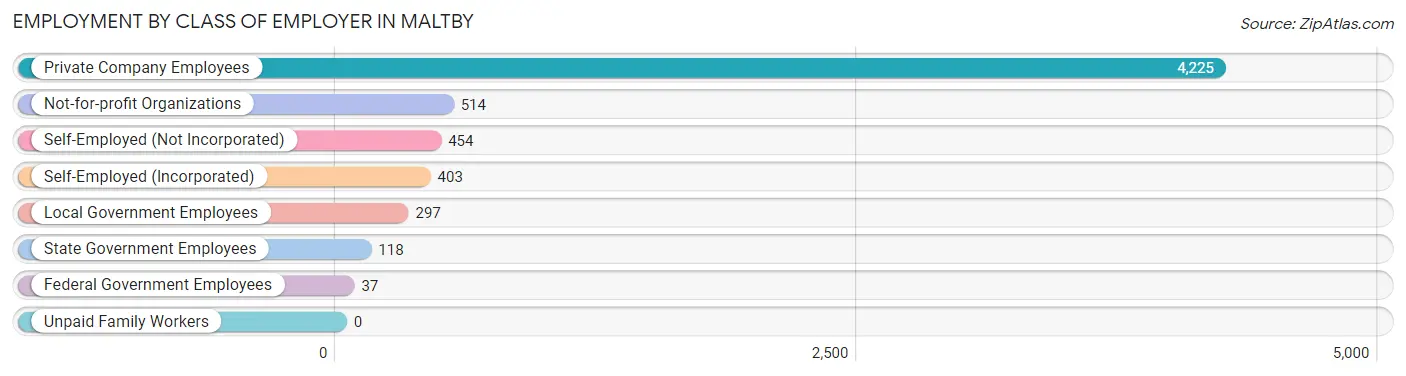
| Employer Class | # Employees | % Employees |
| Private Company Employees | 4,225 | 69.9% |
| Self-Employed (Incorporated) | 403 | 6.7% |
| Self-Employed (Not Incorporated) | 454 | 7.5% |
| Not-for-profit Organizations | 514 | 8.5% |
| Local Government Employees | 297 | 4.9% |
| State Government Employees | 118 | 1.9% |
| Federal Government Employees | 37 | 0.6% |
| Unpaid Family Workers | 0 | 0.0% |
| Total | 6,048 | 100.0% |
Employment Status by Age in Maltby
According to the labor force statistics for Maltby, out of the total population over 16 years of age (9,479), 67.2% or 6,370 individuals are in the labor force, with 3.1% or 197 of them unemployed. The age group with the highest labor force participation rate is 30 to 34 years, with 91.5% or 487 individuals in the labor force. Within the labor force, the 16 to 19 years age range has the highest percentage of unemployed individuals, with 10.1% or 15 of them being unemployed.
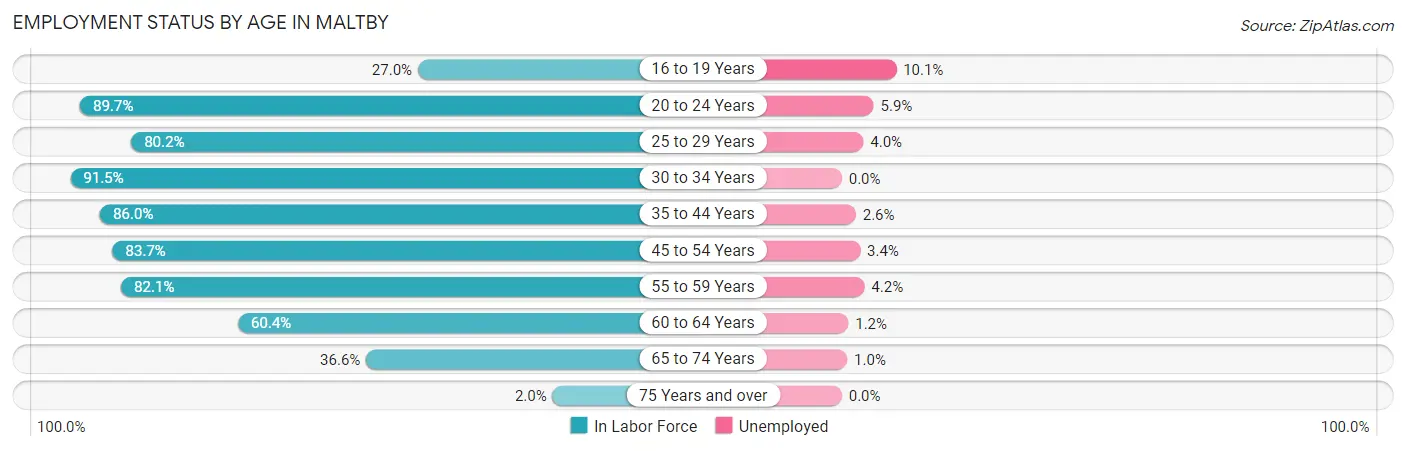
| Age Bracket | In Labor Force | Unemployed |
| 16 to 19 Years | 148 (27.0%) | 15 (10.1%) |
| 20 to 24 Years | 477 (89.7%) | 28 (5.9%) |
| 25 to 29 Years | 470 (80.2%) | 19 (4.0%) |
| 30 to 34 Years | 487 (91.5%) | 0 (0.0%) |
| 35 to 44 Years | 1,195 (86.0%) | 31 (2.6%) |
| 45 to 54 Years | 1,508 (83.7%) | 51 (3.4%) |
| 55 to 59 Years | 996 (82.1%) | 42 (4.2%) |
| 60 to 64 Years | 576 (60.4%) | 7 (1.2%) |
| 65 to 74 Years | 501 (36.6%) | 5 (1.0%) |
| 75 Years and over | 11 (2.0%) | 0 (0.0%) |
| Total | 6,370 (67.2%) | 197 (3.1%) |
Employment Status by Educational Attainment in Maltby
According to labor force statistics for Maltby, 80.8% of individuals (5,233) out of the total population between 25 and 64 years of age (6,477) are in the labor force, with 2.9% or 152 of them being unemployed. The group with the highest labor force participation rate are those with the educational attainment of bachelor's degree or higher, with 86.4% or 2,455 individuals in the labor force. Within the labor force, individuals with less than high school education have the highest percentage of unemployment, with 10.7% or 8 of them being unemployed.
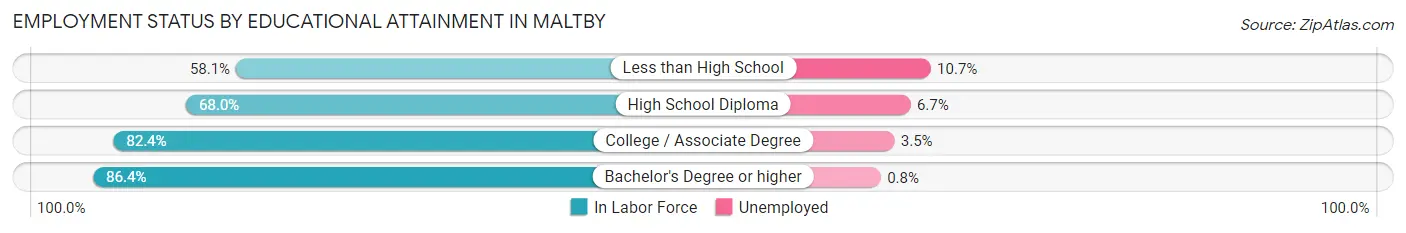
| Educational Attainment | In Labor Force | Unemployed |
| Less than High School | 75 (58.1%) | 14 (10.7%) |
| High School Diploma | 883 (68.0%) | 87 (6.7%) |
| College / Associate Degree | 1,819 (82.4%) | 77 (3.5%) |
| Bachelor's Degree or higher | 2,455 (86.4%) | 23 (0.8%) |
| Total | 5,233 (80.8%) | 188 (2.9%) |
Employment Occupations by Sex in Maltby
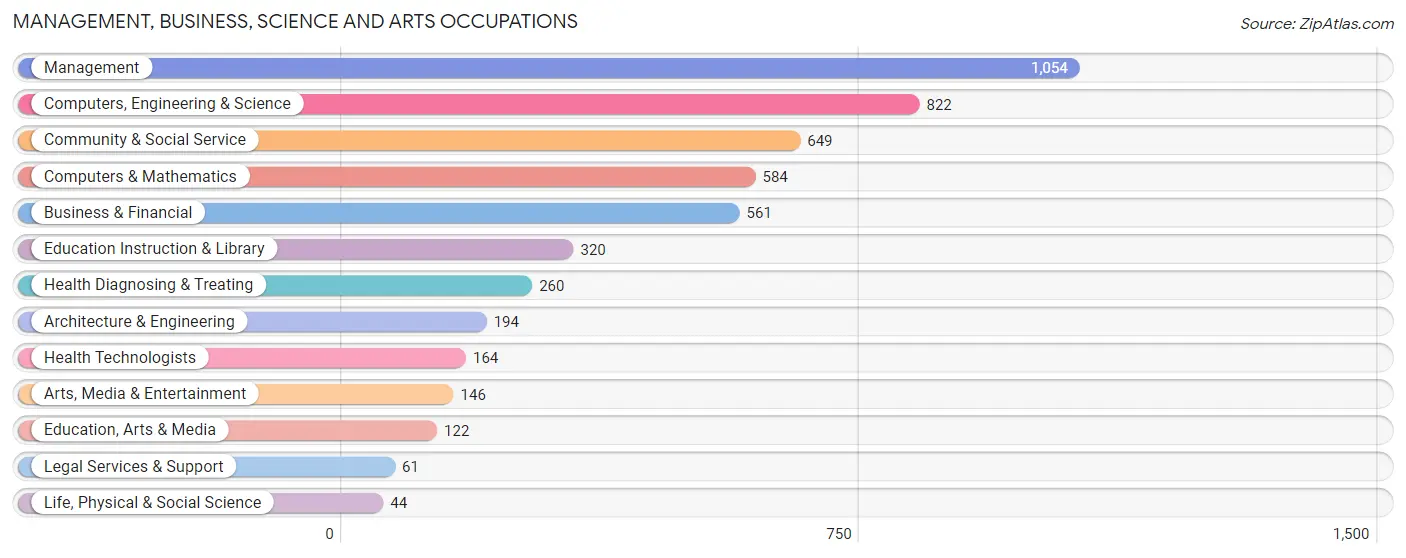
Management, Business, Science and Arts Occupations
The most common Management, Business, Science and Arts occupations in Maltby are Management (1,054 | 17.1%), Computers, Engineering & Science (822 | 13.4%), Community & Social Service (649 | 10.5%), Computers & Mathematics (584 | 9.5%), and Business & Financial (561 | 9.1%).
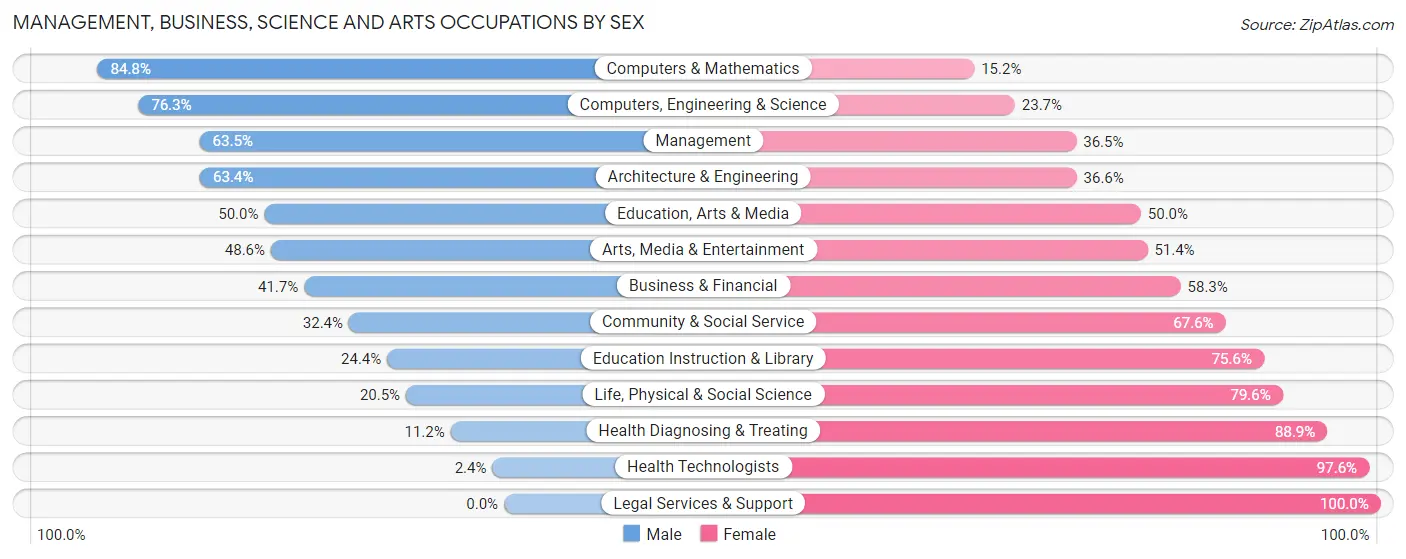
Management, Business, Science and Arts Occupations by Sex
Within the Management, Business, Science and Arts occupations in Maltby, the most male-oriented occupations are Computers & Mathematics (84.8%), Computers, Engineering & Science (76.3%), and Management (63.5%), while the most female-oriented occupations are Legal Services & Support (100.0%), Health Technologists (97.6%), and Health Diagnosing & Treating (88.8%).
| Occupation | Male | Female |
| Management | 669 (63.5%) | 385 (36.5%) |
| Business & Financial | 234 (41.7%) | 327 (58.3%) |
| Computers, Engineering & Science | 627 (76.3%) | 195 (23.7%) |
| Computers & Mathematics | 495 (84.8%) | 89 (15.2%) |
| Architecture & Engineering | 123 (63.4%) | 71 (36.6%) |
| Life, Physical & Social Science | 9 (20.4%) | 35 (79.5%) |
| Community & Social Service | 210 (32.4%) | 439 (67.6%) |
| Education, Arts & Media | 61 (50.0%) | 61 (50.0%) |
| Legal Services & Support | 0 (0.0%) | 61 (100.0%) |
| Education Instruction & Library | 78 (24.4%) | 242 (75.6%) |
| Arts, Media & Entertainment | 71 (48.6%) | 75 (51.4%) |
| Health Diagnosing & Treating | 29 (11.2%) | 231 (88.8%) |
| Health Technologists | 4 (2.4%) | 160 (97.6%) |
| Total (Category) | 1,769 (52.9%) | 1,577 (47.1%) |
| Total (Overall) | 3,401 (55.2%) | 2,755 (44.8%) |
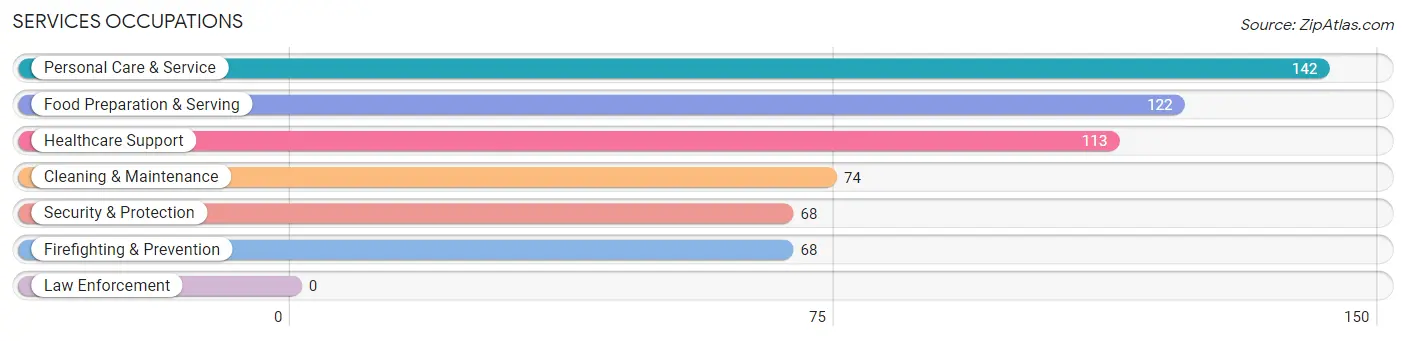
Services Occupations
The most common Services occupations in Maltby are Personal Care & Service (142 | 2.3%), Food Preparation & Serving (122 | 2.0%), Healthcare Support (113 | 1.8%), Cleaning & Maintenance (74 | 1.2%), and Security & Protection (68 | 1.1%).
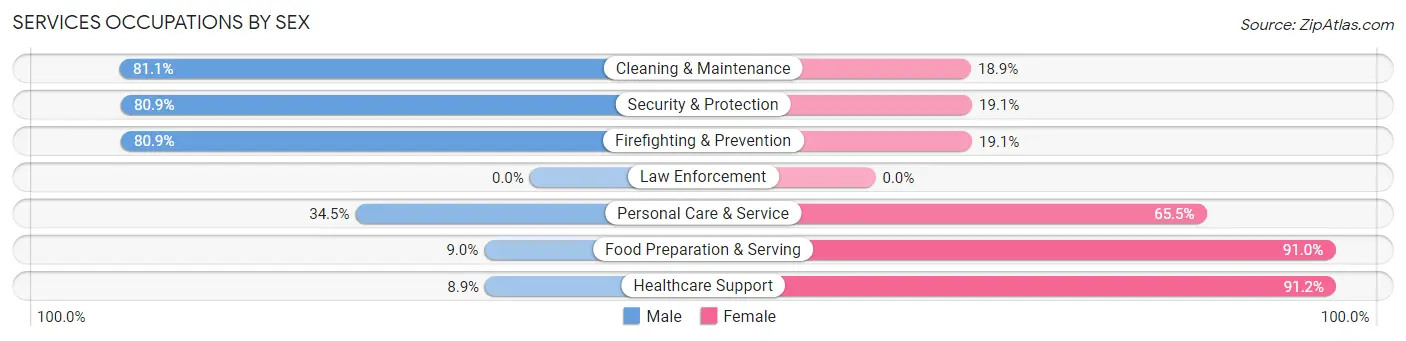
Services Occupations by Sex
Within the Services occupations in Maltby, the most male-oriented occupations are Cleaning & Maintenance (81.1%), Security & Protection (80.9%), and Firefighting & Prevention (80.9%), while the most female-oriented occupations are Healthcare Support (91.1%), Food Preparation & Serving (91.0%), and Personal Care & Service (65.5%).
| Occupation | Male | Female |
| Healthcare Support | 10 (8.8%) | 103 (91.1%) |
| Security & Protection | 55 (80.9%) | 13 (19.1%) |
| Firefighting & Prevention | 55 (80.9%) | 13 (19.1%) |
| Law Enforcement | 0 (0.0%) | 0 (0.0%) |
| Food Preparation & Serving | 11 (9.0%) | 111 (91.0%) |
| Cleaning & Maintenance | 60 (81.1%) | 14 (18.9%) |
| Personal Care & Service | 49 (34.5%) | 93 (65.5%) |
| Total (Category) | 185 (35.6%) | 334 (64.3%) |
| Total (Overall) | 3,401 (55.2%) | 2,755 (44.8%) |
Sales and Office Occupations
The most common Sales and Office occupations in Maltby are Sales & Related (670 | 10.9%), and Office & Administration (588 | 9.6%).
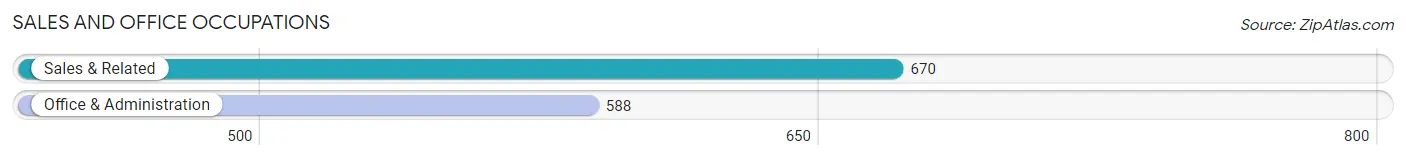
Sales and Office Occupations by Sex
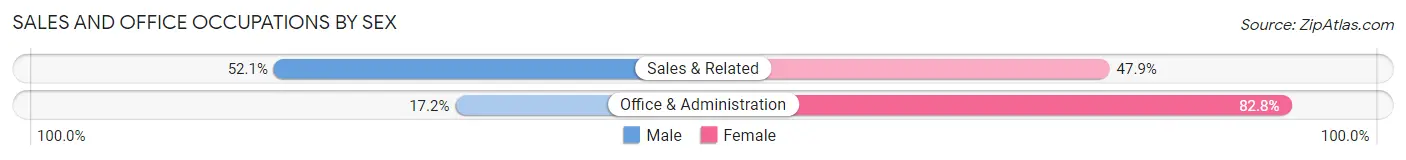
| Occupation | Male | Female |
| Sales & Related | 349 (52.1%) | 321 (47.9%) |
| Office & Administration | 101 (17.2%) | 487 (82.8%) |
| Total (Category) | 450 (35.8%) | 808 (64.2%) |
| Total (Overall) | 3,401 (55.2%) | 2,755 (44.8%) |
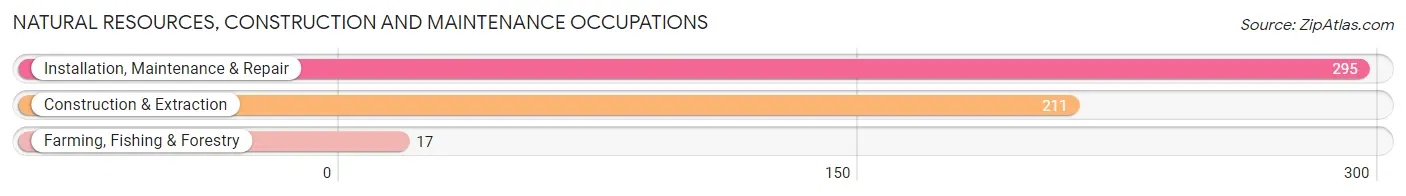
Natural Resources, Construction and Maintenance Occupations
The most common Natural Resources, Construction and Maintenance occupations in Maltby are Installation, Maintenance & Repair (295 | 4.8%), Construction & Extraction (211 | 3.4%), and Farming, Fishing & Forestry (17 | 0.3%).
Natural Resources, Construction and Maintenance Occupations by Sex
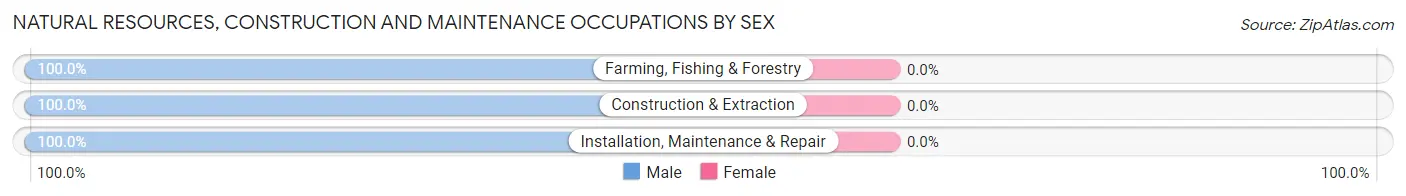
| Occupation | Male | Female |
| Farming, Fishing & Forestry | 17 (100.0%) | 0 (0.0%) |
| Construction & Extraction | 211 (100.0%) | 0 (0.0%) |
| Installation, Maintenance & Repair | 295 (100.0%) | 0 (0.0%) |
| Total (Category) | 523 (100.0%) | 0 (0.0%) |
| Total (Overall) | 3,401 (55.2%) | 2,755 (44.8%) |
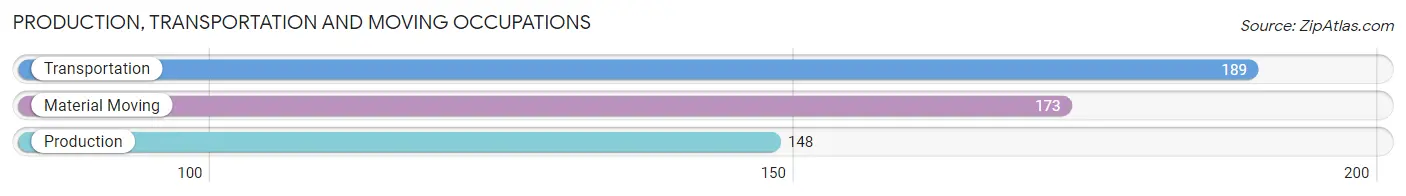
Production, Transportation and Moving Occupations
The most common Production, Transportation and Moving occupations in Maltby are Transportation (189 | 3.1%), Material Moving (173 | 2.8%), and Production (148 | 2.4%).
Production, Transportation and Moving Occupations by Sex
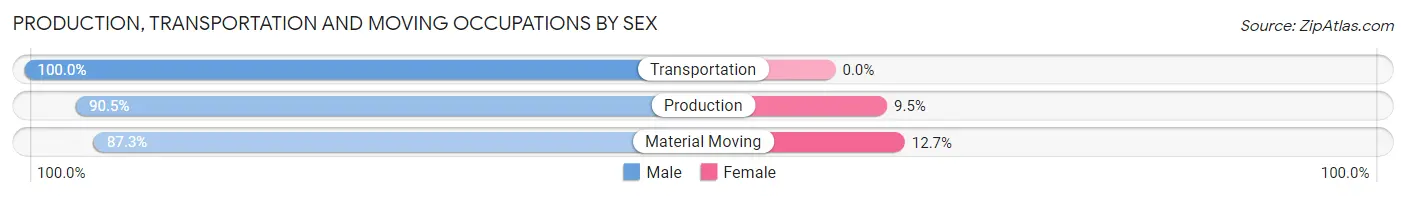
| Occupation | Male | Female |
| Production | 134 (90.5%) | 14 (9.5%) |
| Transportation | 189 (100.0%) | 0 (0.0%) |
| Material Moving | 151 (87.3%) | 22 (12.7%) |
| Total (Category) | 474 (92.9%) | 36 (7.1%) |
| Total (Overall) | 3,401 (55.2%) | 2,755 (44.8%) |
Employment Industries by Sex in Maltby
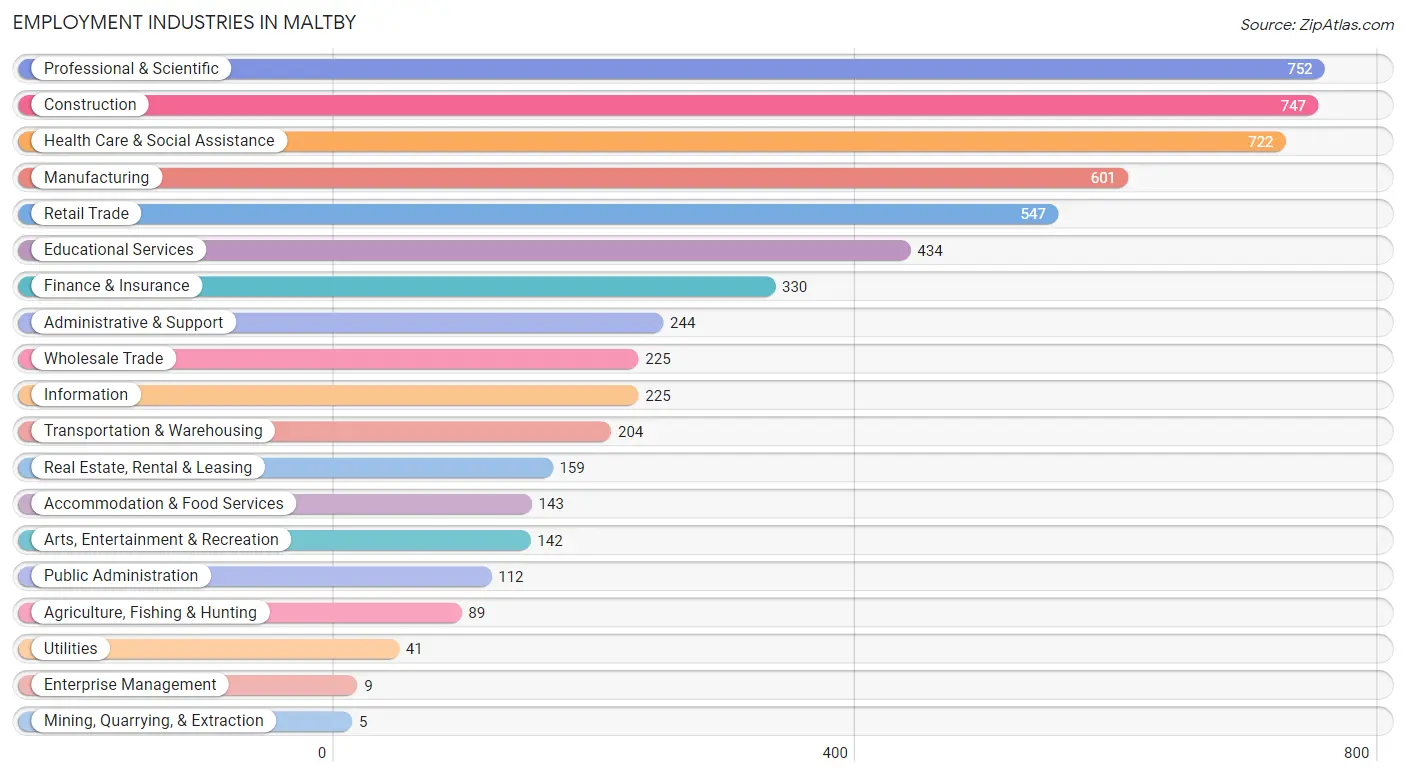
Employment Industries in Maltby
The major employment industries in Maltby include Professional & Scientific (752 | 12.2%), Construction (747 | 12.1%), Health Care & Social Assistance (722 | 11.7%), Manufacturing (601 | 9.8%), and Retail Trade (547 | 8.9%).
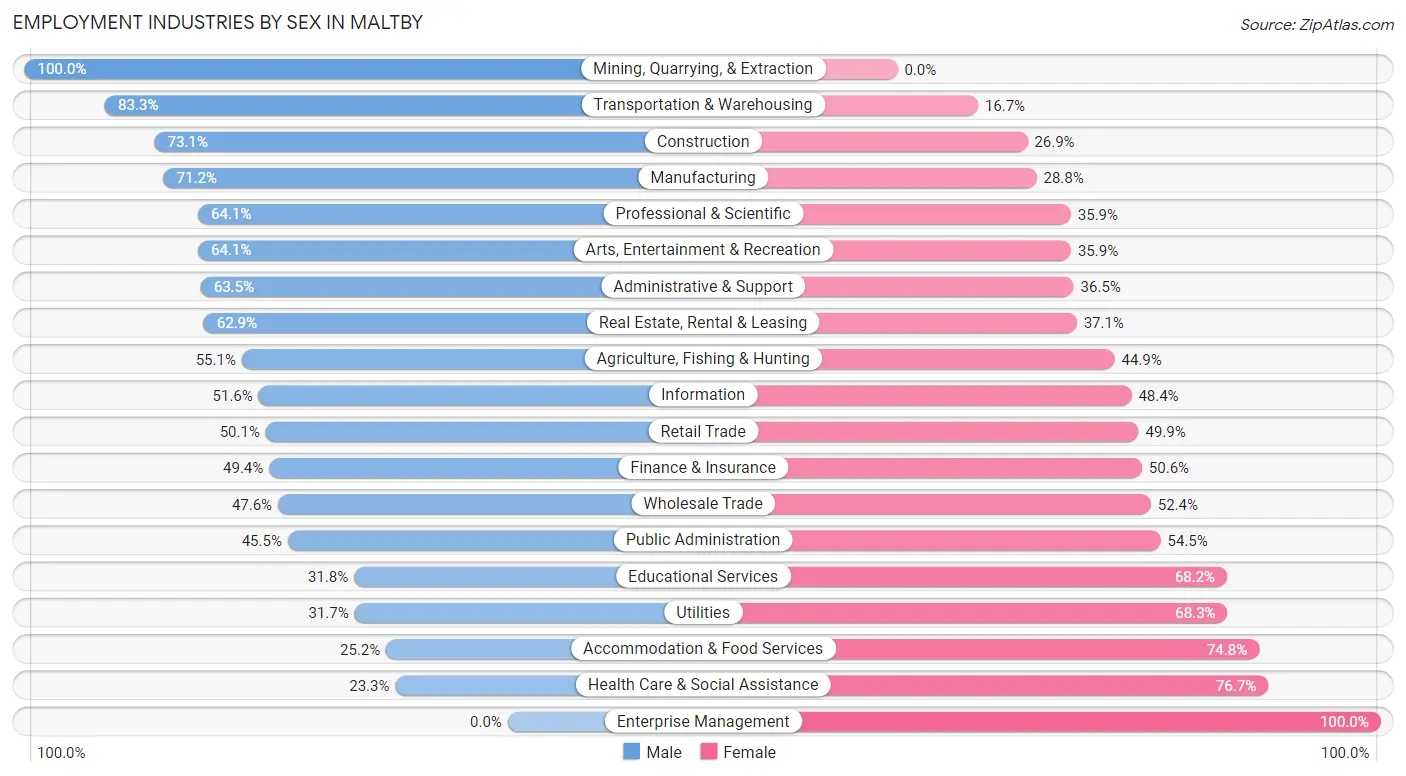
Employment Industries by Sex in Maltby
The Maltby industries that see more men than women are Mining, Quarrying, & Extraction (100.0%), Transportation & Warehousing (83.3%), and Construction (73.1%), whereas the industries that tend to have a higher number of women are Enterprise Management (100.0%), Health Care & Social Assistance (76.7%), and Accommodation & Food Services (74.8%).
| Industry | Male | Female |
| Agriculture, Fishing & Hunting | 49 (55.1%) | 40 (44.9%) |
| Mining, Quarrying, & Extraction | 5 (100.0%) | 0 (0.0%) |
| Construction | 546 (73.1%) | 201 (26.9%) |
| Manufacturing | 428 (71.2%) | 173 (28.8%) |
| Wholesale Trade | 107 (47.6%) | 118 (52.4%) |
| Retail Trade | 274 (50.1%) | 273 (49.9%) |
| Transportation & Warehousing | 170 (83.3%) | 34 (16.7%) |
| Utilities | 13 (31.7%) | 28 (68.3%) |
| Information | 116 (51.6%) | 109 (48.4%) |
| Finance & Insurance | 163 (49.4%) | 167 (50.6%) |
| Real Estate, Rental & Leasing | 100 (62.9%) | 59 (37.1%) |
| Professional & Scientific | 482 (64.1%) | 270 (35.9%) |
| Enterprise Management | 0 (0.0%) | 9 (100.0%) |
| Administrative & Support | 155 (63.5%) | 89 (36.5%) |
| Educational Services | 138 (31.8%) | 296 (68.2%) |
| Health Care & Social Assistance | 168 (23.3%) | 554 (76.7%) |
| Arts, Entertainment & Recreation | 91 (64.1%) | 51 (35.9%) |
| Accommodation & Food Services | 36 (25.2%) | 107 (74.8%) |
| Public Administration | 51 (45.5%) | 61 (54.5%) |
| Total | 3,401 (55.2%) | 2,755 (44.8%) |
Education in Maltby
School Enrollment in Maltby
The most common levels of schooling among the 2,258 students in Maltby are high school (706 | 31.3%), middle school (559 | 24.8%), and elementary school (500 | 22.1%).
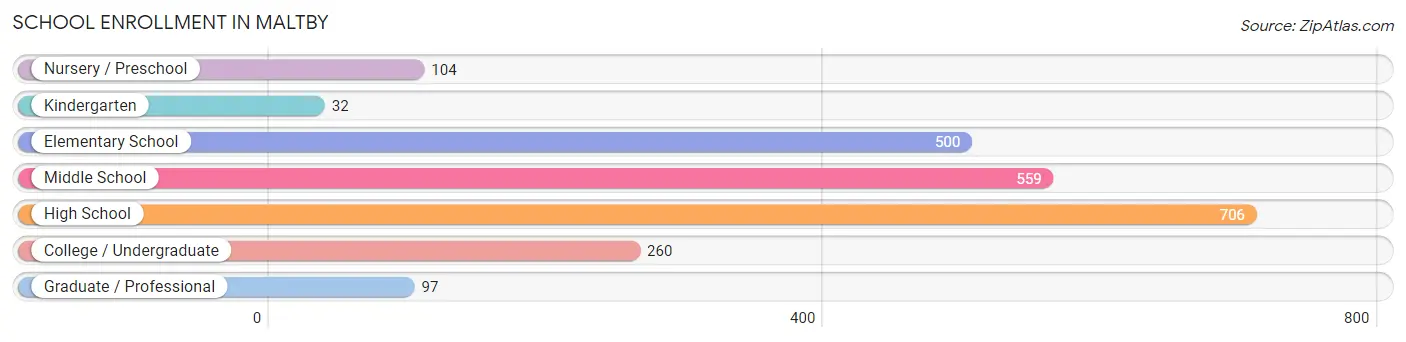
| School Level | # Students | % Students |
| Nursery / Preschool | 104 | 4.6% |
| Kindergarten | 32 | 1.4% |
| Elementary School | 500 | 22.1% |
| Middle School | 559 | 24.8% |
| High School | 706 | 31.3% |
| College / Undergraduate | 260 | 11.5% |
| Graduate / Professional | 97 | 4.3% |
| Total | 2,258 | 100.0% |
School Enrollment by Age by Funding Source in Maltby
Out of a total of 2,258 students who are enrolled in schools in Maltby, 770 (34.1%) attend a private institution, while the remaining 1,488 (65.9%) are enrolled in public schools. The age group of 3 to 4 year olds has the highest likelihood of being enrolled in private schools, with 57 (60.6% in the age bracket) enrolled. Conversely, the age group of 20 to 24 year olds has the lowest likelihood of being enrolled in a private school, with 120 (85.7% in the age bracket) attending a public institution.
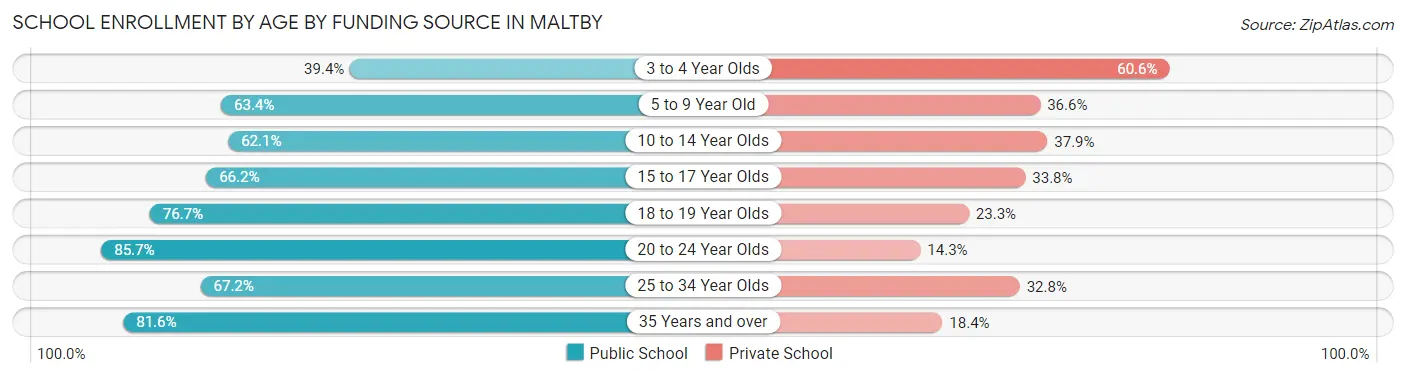
| Age Bracket | Public School | Private School |
| 3 to 4 Year Olds | 37 (39.4%) | 57 (60.6%) |
| 5 to 9 Year Old | 258 (63.4%) | 149 (36.6%) |
| 10 to 14 Year Olds | 476 (62.1%) | 291 (37.9%) |
| 15 to 17 Year Olds | 305 (66.2%) | 156 (33.8%) |
| 18 to 19 Year Olds | 138 (76.7%) | 42 (23.3%) |
| 20 to 24 Year Olds | 120 (85.7%) | 20 (14.3%) |
| 25 to 34 Year Olds | 82 (67.2%) | 40 (32.8%) |
| 35 Years and over | 71 (81.6%) | 16 (18.4%) |
| Total | 1,488 (65.9%) | 770 (34.1%) |
Educational Attainment by Field of Study in Maltby
Business (664 | 17.1%), engineering (424 | 10.9%), social sciences (403 | 10.4%), education (323 | 8.3%), and computers & mathematics (311 | 8.0%) are the most common fields of study among 3,890 individuals in Maltby who have obtained a bachelor's degree or higher.
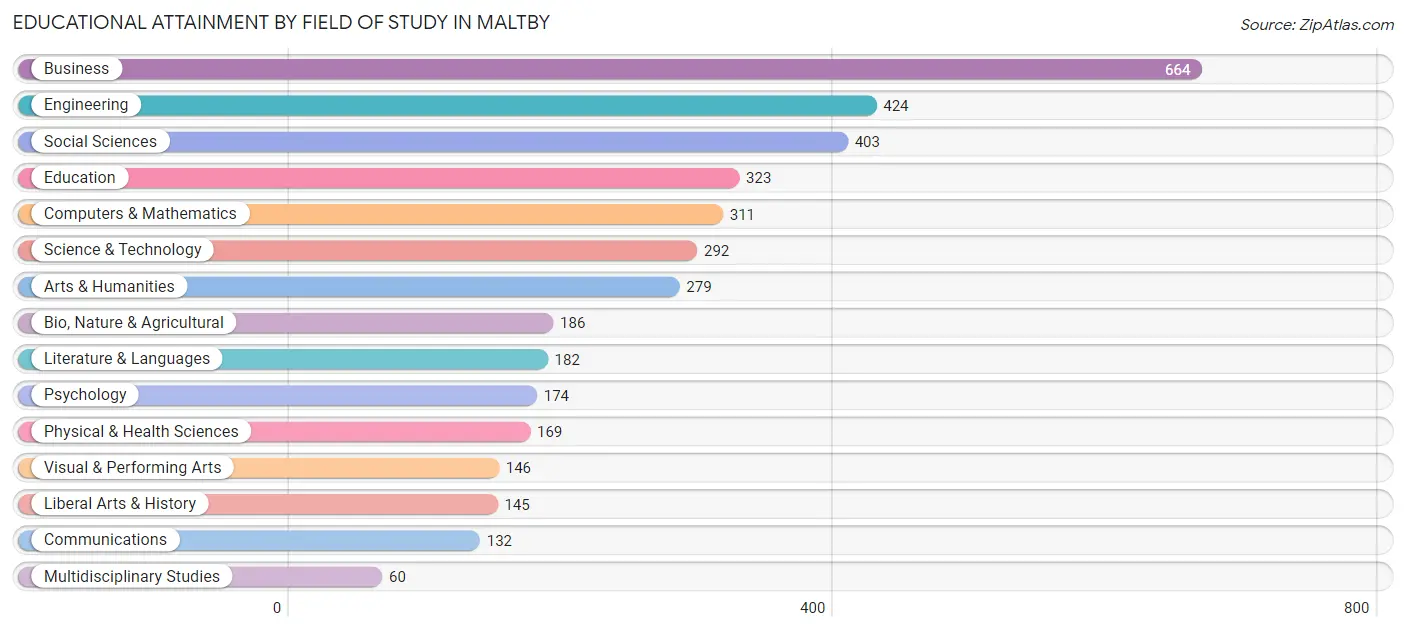
| Field of Study | # Graduates | % Graduates |
| Computers & Mathematics | 311 | 8.0% |
| Bio, Nature & Agricultural | 186 | 4.8% |
| Physical & Health Sciences | 169 | 4.3% |
| Psychology | 174 | 4.5% |
| Social Sciences | 403 | 10.4% |
| Engineering | 424 | 10.9% |
| Multidisciplinary Studies | 60 | 1.5% |
| Science & Technology | 292 | 7.5% |
| Business | 664 | 17.1% |
| Education | 323 | 8.3% |
| Literature & Languages | 182 | 4.7% |
| Liberal Arts & History | 145 | 3.7% |
| Visual & Performing Arts | 146 | 3.7% |
| Communications | 132 | 3.4% |
| Arts & Humanities | 279 | 7.2% |
| Total | 3,890 | 100.0% |
Transportation & Commute in Maltby
Vehicle Availability by Sex in Maltby
The most prevalent vehicle ownership categories in Maltby are males with 2 vehicles (1,169, accounting for 34.7%) and females with 2 vehicles (807, making up 43.6%).
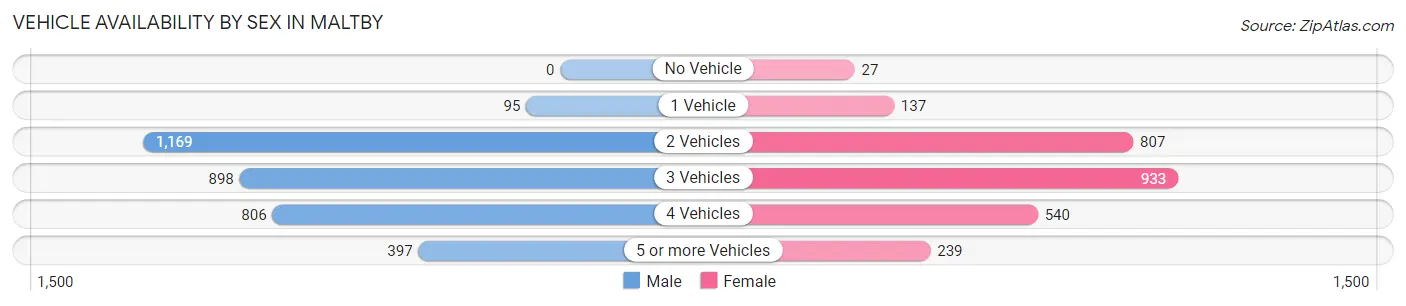
| Vehicles Available | Male | Female |
| No Vehicle | 0 (0.0%) | 27 (1.0%) |
| 1 Vehicle | 95 (2.8%) | 137 (5.1%) |
| 2 Vehicles | 1,169 (34.7%) | 807 (30.1%) |
| 3 Vehicles | 898 (26.7%) | 933 (34.8%) |
| 4 Vehicles | 806 (23.9%) | 540 (20.1%) |
| 5 or more Vehicles | 397 (11.8%) | 239 (8.9%) |
| Total | 3,365 (100.0%) | 2,683 (100.0%) |
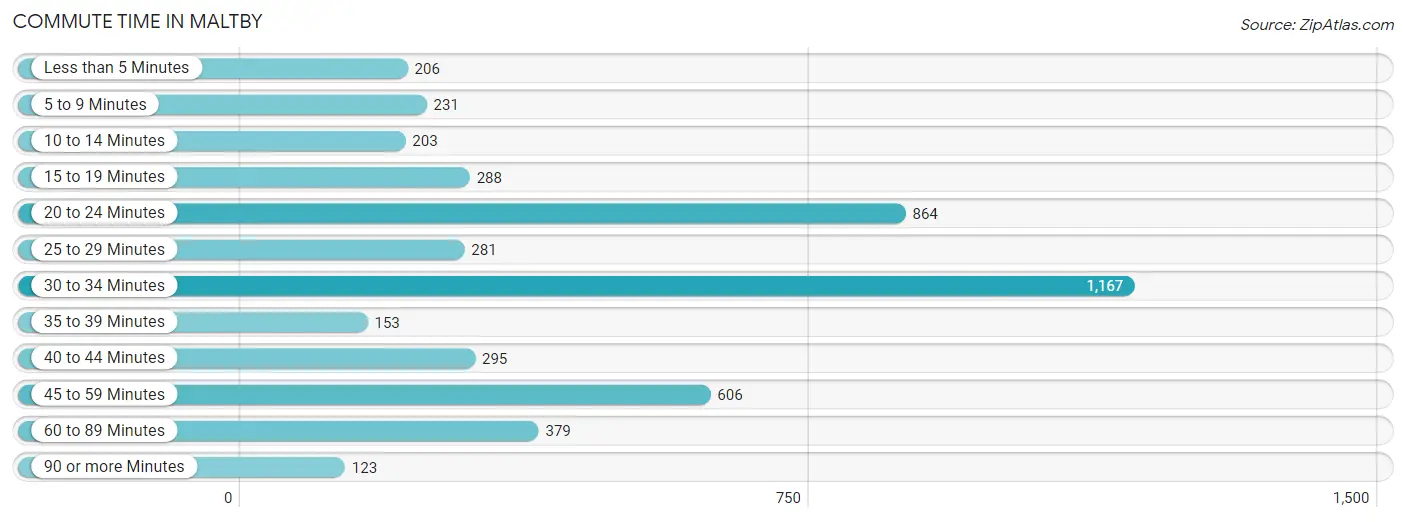
Commute Time in Maltby
The most frequently occuring commute durations in Maltby are 30 to 34 minutes (1,167 commuters, 24.3%), 20 to 24 minutes (864 commuters, 18.0%), and 45 to 59 minutes (606 commuters, 12.6%).
| Commute Time | # Commuters | % Commuters |
| Less than 5 Minutes | 206 | 4.3% |
| 5 to 9 Minutes | 231 | 4.8% |
| 10 to 14 Minutes | 203 | 4.2% |
| 15 to 19 Minutes | 288 | 6.0% |
| 20 to 24 Minutes | 864 | 18.0% |
| 25 to 29 Minutes | 281 | 5.9% |
| 30 to 34 Minutes | 1,167 | 24.3% |
| 35 to 39 Minutes | 153 | 3.2% |
| 40 to 44 Minutes | 295 | 6.1% |
| 45 to 59 Minutes | 606 | 12.6% |
| 60 to 89 Minutes | 379 | 7.9% |
| 90 or more Minutes | 123 | 2.6% |
Commute Time by Sex in Maltby
The most common commute times in Maltby are 30 to 34 minutes (614 commuters, 22.4%) for males and 30 to 34 minutes (553 commuters, 27.0%) for females.
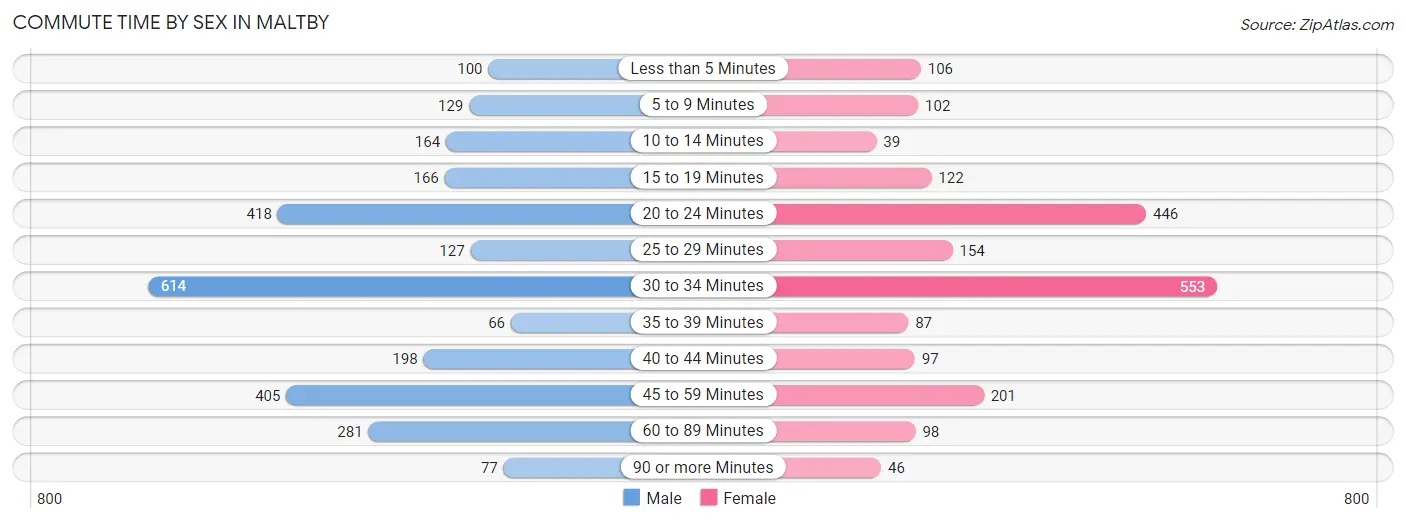
| Commute Time | Male | Female |
| Less than 5 Minutes | 100 (3.6%) | 106 (5.2%) |
| 5 to 9 Minutes | 129 (4.7%) | 102 (5.0%) |
| 10 to 14 Minutes | 164 (6.0%) | 39 (1.9%) |
| 15 to 19 Minutes | 166 (6.0%) | 122 (5.9%) |
| 20 to 24 Minutes | 418 (15.2%) | 446 (21.7%) |
| 25 to 29 Minutes | 127 (4.6%) | 154 (7.5%) |
| 30 to 34 Minutes | 614 (22.4%) | 553 (27.0%) |
| 35 to 39 Minutes | 66 (2.4%) | 87 (4.2%) |
| 40 to 44 Minutes | 198 (7.2%) | 97 (4.7%) |
| 45 to 59 Minutes | 405 (14.7%) | 201 (9.8%) |
| 60 to 89 Minutes | 281 (10.2%) | 98 (4.8%) |
| 90 or more Minutes | 77 (2.8%) | 46 (2.2%) |
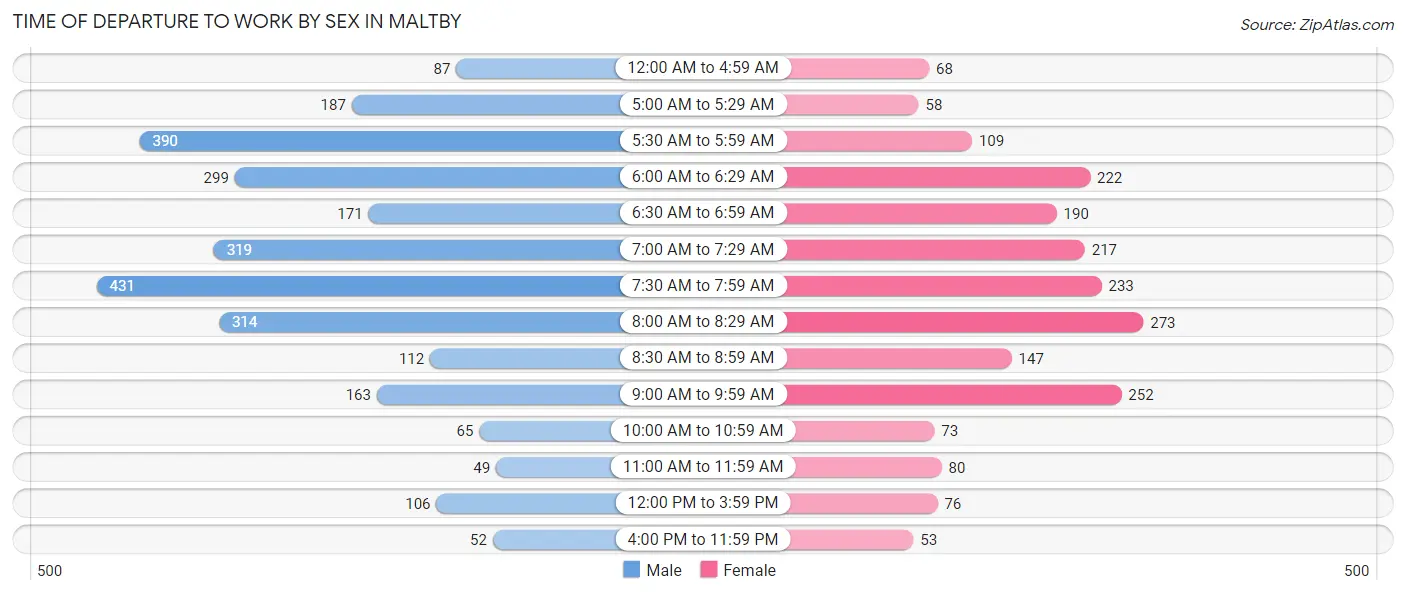
Time of Departure to Work by Sex in Maltby
The most frequent times of departure to work in Maltby are 7:30 AM to 7:59 AM (431, 15.7%) for males and 8:00 AM to 8:29 AM (273, 13.3%) for females.
| Time of Departure | Male | Female |
| 12:00 AM to 4:59 AM | 87 (3.2%) | 68 (3.3%) |
| 5:00 AM to 5:29 AM | 187 (6.8%) | 58 (2.8%) |
| 5:30 AM to 5:59 AM | 390 (14.2%) | 109 (5.3%) |
| 6:00 AM to 6:29 AM | 299 (10.9%) | 222 (10.8%) |
| 6:30 AM to 6:59 AM | 171 (6.2%) | 190 (9.3%) |
| 7:00 AM to 7:29 AM | 319 (11.6%) | 217 (10.6%) |
| 7:30 AM to 7:59 AM | 431 (15.7%) | 233 (11.4%) |
| 8:00 AM to 8:29 AM | 314 (11.4%) | 273 (13.3%) |
| 8:30 AM to 8:59 AM | 112 (4.1%) | 147 (7.2%) |
| 9:00 AM to 9:59 AM | 163 (5.9%) | 252 (12.3%) |
| 10:00 AM to 10:59 AM | 65 (2.4%) | 73 (3.6%) |
| 11:00 AM to 11:59 AM | 49 (1.8%) | 80 (3.9%) |
| 12:00 PM to 3:59 PM | 106 (3.9%) | 76 (3.7%) |
| 4:00 PM to 11:59 PM | 52 (1.9%) | 53 (2.6%) |
| Total | 2,745 (100.0%) | 2,051 (100.0%) |
Housing Occupancy in Maltby
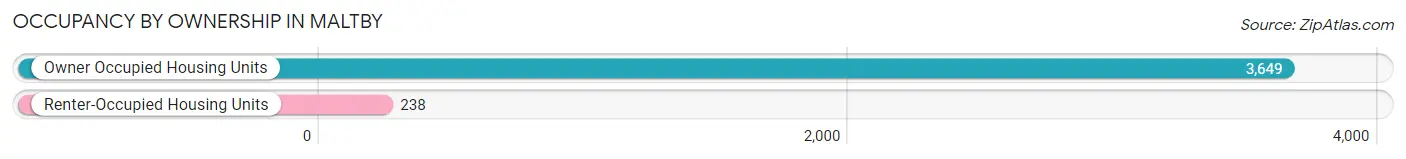
Occupancy by Ownership in Maltby
Of the total 3,887 dwellings in Maltby, owner-occupied units account for 3,649 (93.9%), while renter-occupied units make up 238 (6.1%).
| Occupancy | # Housing Units | % Housing Units |
| Owner Occupied Housing Units | 3,649 | 93.9% |
| Renter-Occupied Housing Units | 238 | 6.1% |
| Total Occupied Housing Units | 3,887 | 100.0% |
Occupancy by Household Size in Maltby
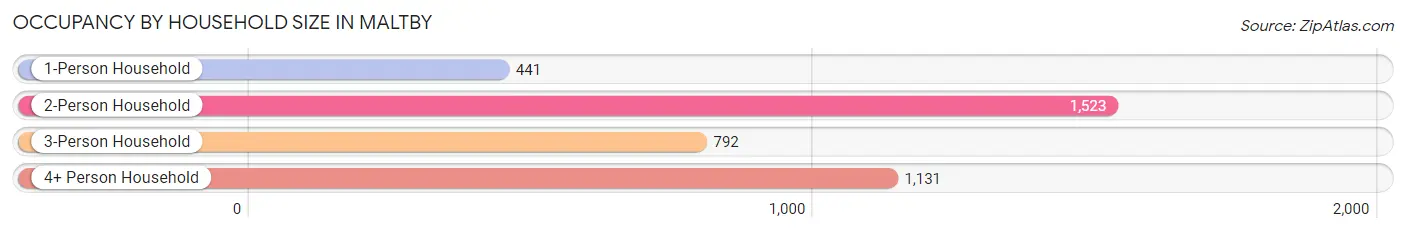
| Household Size | # Housing Units | % Housing Units |
| 1-Person Household | 441 | 11.4% |
| 2-Person Household | 1,523 | 39.2% |
| 3-Person Household | 792 | 20.4% |
| 4+ Person Household | 1,131 | 29.1% |
| Total Housing Units | 3,887 | 100.0% |
Occupancy by Ownership by Household Size in Maltby
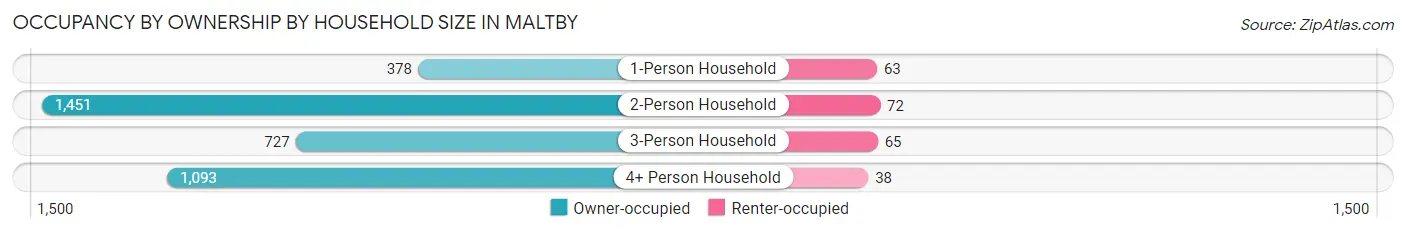
| Household Size | Owner-occupied | Renter-occupied |
| 1-Person Household | 378 (85.7%) | 63 (14.3%) |
| 2-Person Household | 1,451 (95.3%) | 72 (4.7%) |
| 3-Person Household | 727 (91.8%) | 65 (8.2%) |
| 4+ Person Household | 1,093 (96.6%) | 38 (3.4%) |
| Total Housing Units | 3,649 (93.9%) | 238 (6.1%) |
Occupancy by Educational Attainment in Maltby
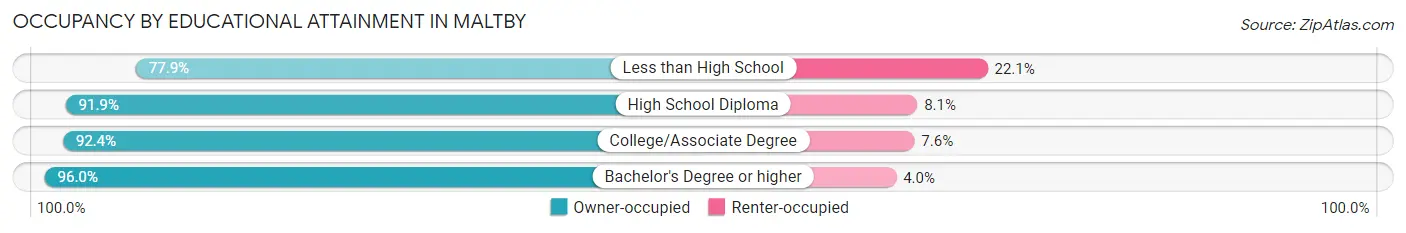
| Household Size | Owner-occupied | Renter-occupied |
| Less than High School | 60 (77.9%) | 17 (22.1%) |
| High School Diploma | 587 (91.9%) | 52 (8.1%) |
| College/Associate Degree | 1,098 (92.4%) | 90 (7.6%) |
| Bachelor's Degree or higher | 1,904 (96.0%) | 79 (4.0%) |
Occupancy by Age of Householder in Maltby
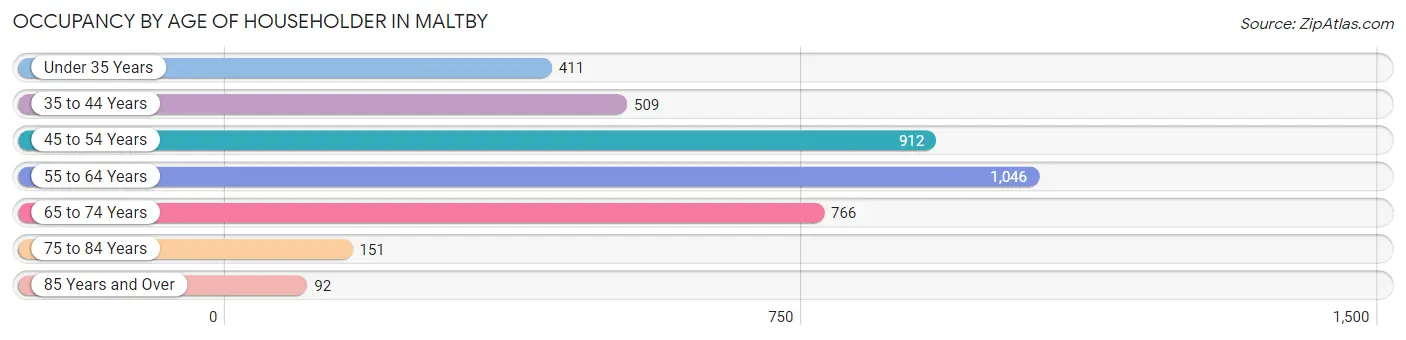
| Age Bracket | # Households | % Households |
| Under 35 Years | 411 | 10.6% |
| 35 to 44 Years | 509 | 13.1% |
| 45 to 54 Years | 912 | 23.5% |
| 55 to 64 Years | 1,046 | 26.9% |
| 65 to 74 Years | 766 | 19.7% |
| 75 to 84 Years | 151 | 3.9% |
| 85 Years and Over | 92 | 2.4% |
| Total | 3,887 | 100.0% |
Housing Finances in Maltby
Median Income by Occupancy in Maltby
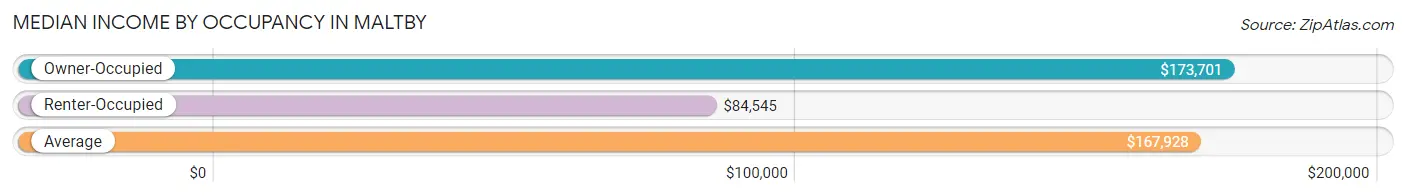
| Occupancy Type | # Households | Median Income |
| Owner-Occupied | 3,649 (93.9%) | $173,701 |
| Renter-Occupied | 238 (6.1%) | $84,545 |
| Average | 3,887 (100.0%) | $167,928 |
Occupancy by Householder Income Bracket in Maltby
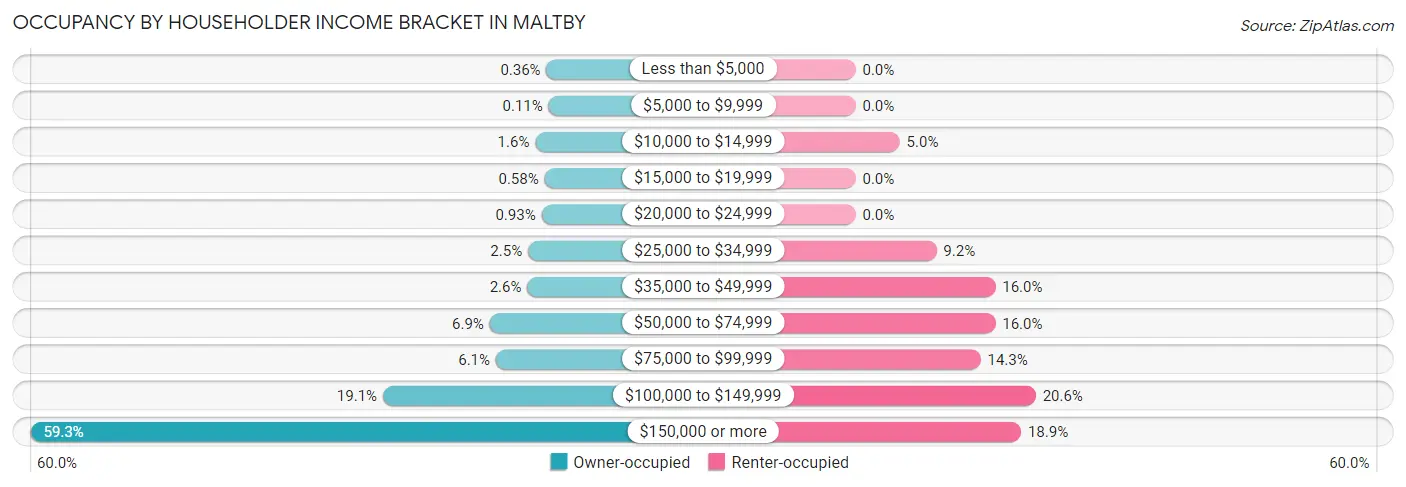
| Income Bracket | Owner-occupied | Renter-occupied |
| Less than $5,000 | 13 (0.4%) | 0 (0.0%) |
| $5,000 to $9,999 | 4 (0.1%) | 0 (0.0%) |
| $10,000 to $14,999 | 60 (1.6%) | 12 (5.0%) |
| $15,000 to $19,999 | 21 (0.6%) | 0 (0.0%) |
| $20,000 to $24,999 | 34 (0.9%) | 0 (0.0%) |
| $25,000 to $34,999 | 90 (2.5%) | 22 (9.2%) |
| $35,000 to $49,999 | 93 (2.5%) | 38 (16.0%) |
| $50,000 to $74,999 | 250 (6.9%) | 38 (16.0%) |
| $75,000 to $99,999 | 224 (6.1%) | 34 (14.3%) |
| $100,000 to $149,999 | 695 (19.1%) | 49 (20.6%) |
| $150,000 or more | 2,165 (59.3%) | 45 (18.9%) |
| Total | 3,649 (100.0%) | 238 (100.0%) |
Monthly Housing Cost Tiers in Maltby
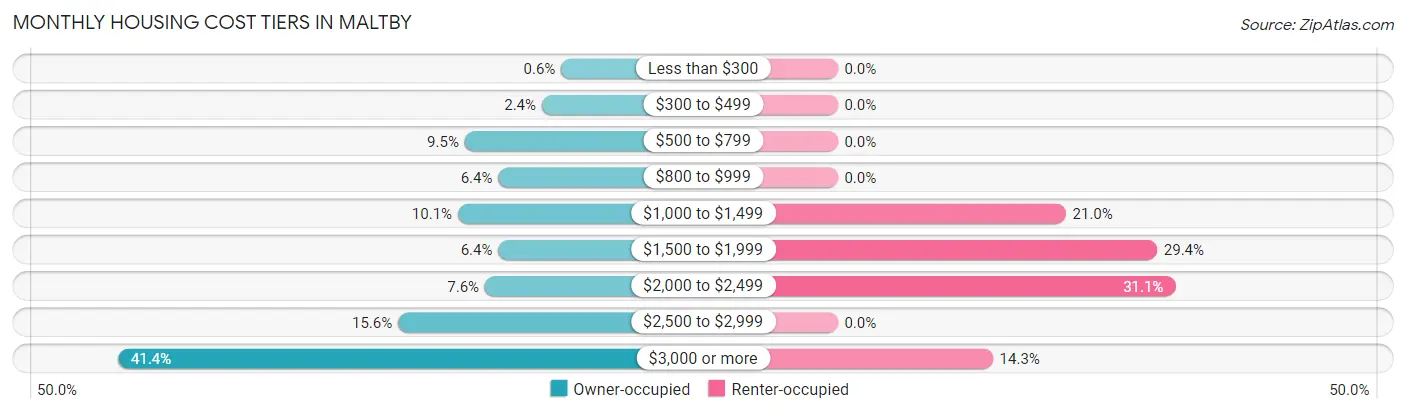
| Monthly Cost | Owner-occupied | Renter-occupied |
| Less than $300 | 22 (0.6%) | 0 (0.0%) |
| $300 to $499 | 87 (2.4%) | 0 (0.0%) |
| $500 to $799 | 346 (9.5%) | 0 (0.0%) |
| $800 to $999 | 233 (6.4%) | 0 (0.0%) |
| $1,000 to $1,499 | 369 (10.1%) | 50 (21.0%) |
| $1,500 to $1,999 | 233 (6.4%) | 70 (29.4%) |
| $2,000 to $2,499 | 278 (7.6%) | 74 (31.1%) |
| $2,500 to $2,999 | 570 (15.6%) | 0 (0.0%) |
| $3,000 or more | 1,511 (41.4%) | 34 (14.3%) |
| Total | 3,649 (100.0%) | 238 (100.0%) |
Physical Housing Characteristics in Maltby
Housing Structures in Maltby
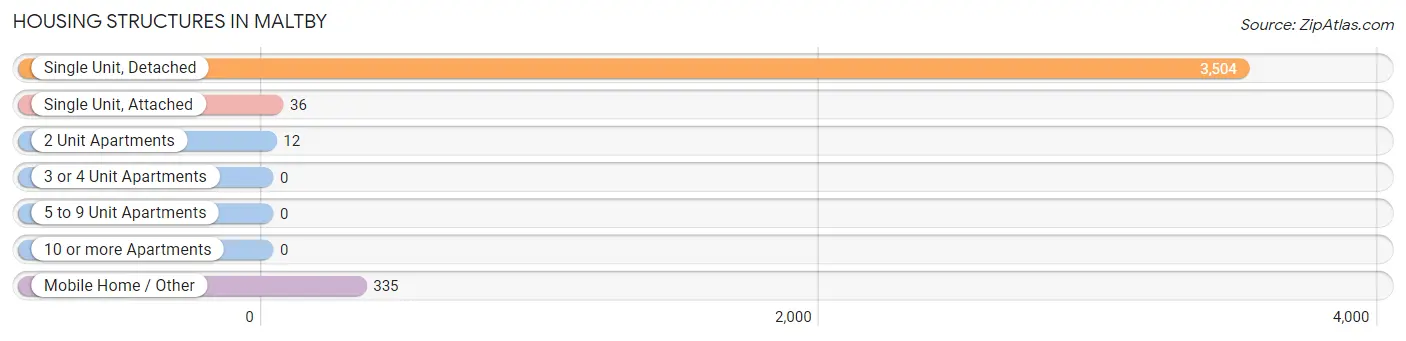
| Structure Type | # Housing Units | % Housing Units |
| Single Unit, Detached | 3,504 | 90.1% |
| Single Unit, Attached | 36 | 0.9% |
| 2 Unit Apartments | 12 | 0.3% |
| 3 or 4 Unit Apartments | 0 | 0.0% |
| 5 to 9 Unit Apartments | 0 | 0.0% |
| 10 or more Apartments | 0 | 0.0% |
| Mobile Home / Other | 335 | 8.6% |
| Total | 3,887 | 100.0% |
Housing Structures by Occupancy in Maltby
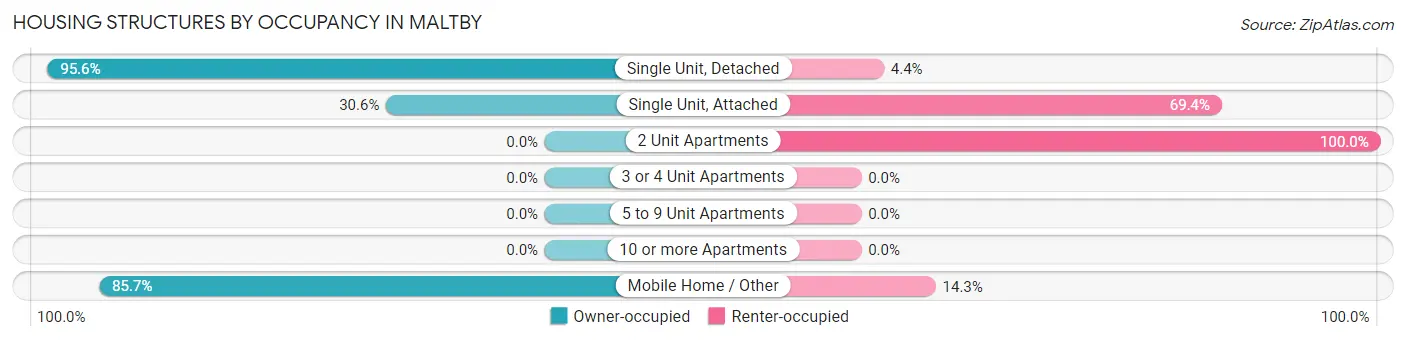
| Structure Type | Owner-occupied | Renter-occupied |
| Single Unit, Detached | 3,351 (95.6%) | 153 (4.4%) |
| Single Unit, Attached | 11 (30.6%) | 25 (69.4%) |
| 2 Unit Apartments | 0 (0.0%) | 12 (100.0%) |
| 3 or 4 Unit Apartments | 0 (0.0%) | 0 (0.0%) |
| 5 to 9 Unit Apartments | 0 (0.0%) | 0 (0.0%) |
| 10 or more Apartments | 0 (0.0%) | 0 (0.0%) |
| Mobile Home / Other | 287 (85.7%) | 48 (14.3%) |
| Total | 3,649 (93.9%) | 238 (6.1%) |
Housing Structures by Number of Rooms in Maltby
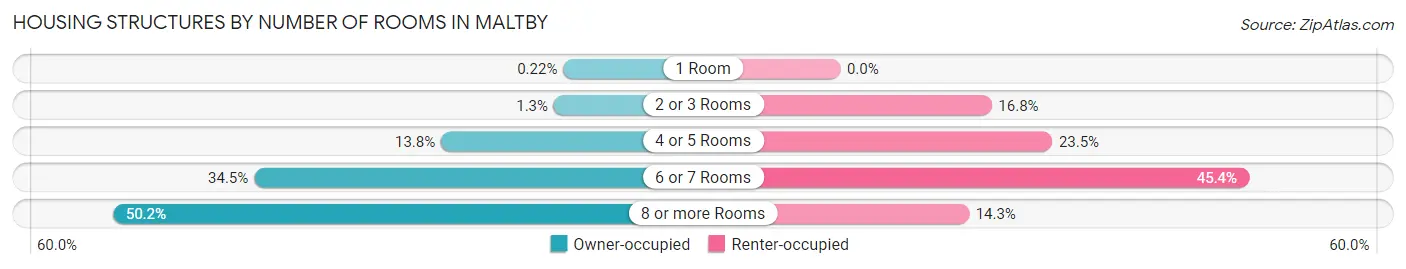
| Number of Rooms | Owner-occupied | Renter-occupied |
| 1 Room | 8 (0.2%) | 0 (0.0%) |
| 2 or 3 Rooms | 46 (1.3%) | 40 (16.8%) |
| 4 or 5 Rooms | 503 (13.8%) | 56 (23.5%) |
| 6 or 7 Rooms | 1,260 (34.5%) | 108 (45.4%) |
| 8 or more Rooms | 1,832 (50.2%) | 34 (14.3%) |
| Total | 3,649 (100.0%) | 238 (100.0%) |
Housing Structure by Heating Type in Maltby
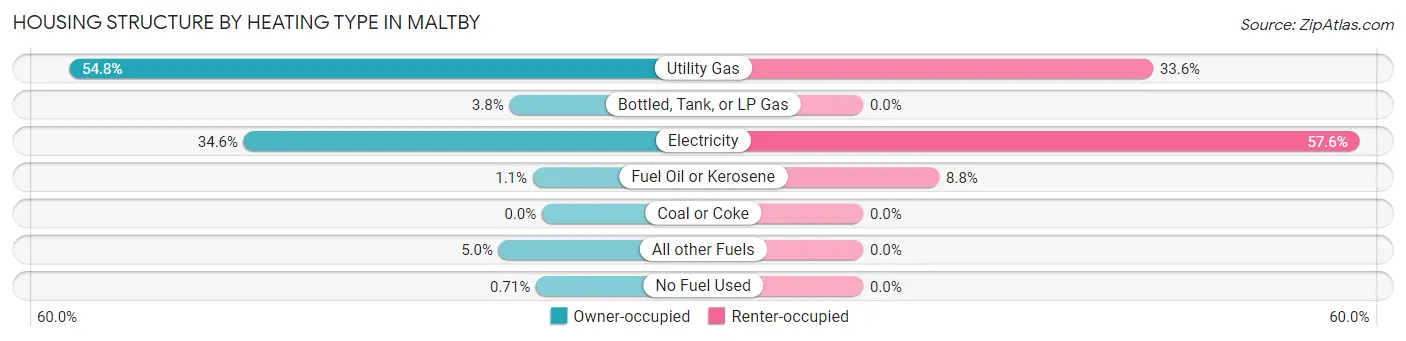
| Heating Type | Owner-occupied | Renter-occupied |
| Utility Gas | 2,001 (54.8%) | 80 (33.6%) |
| Bottled, Tank, or LP Gas | 138 (3.8%) | 0 (0.0%) |
| Electricity | 1,262 (34.6%) | 137 (57.6%) |
| Fuel Oil or Kerosene | 39 (1.1%) | 21 (8.8%) |
| Coal or Coke | 0 (0.0%) | 0 (0.0%) |
| All other Fuels | 183 (5.0%) | 0 (0.0%) |
| No Fuel Used | 26 (0.7%) | 0 (0.0%) |
| Total | 3,649 (100.0%) | 238 (100.0%) |
Household Vehicle Usage in Maltby
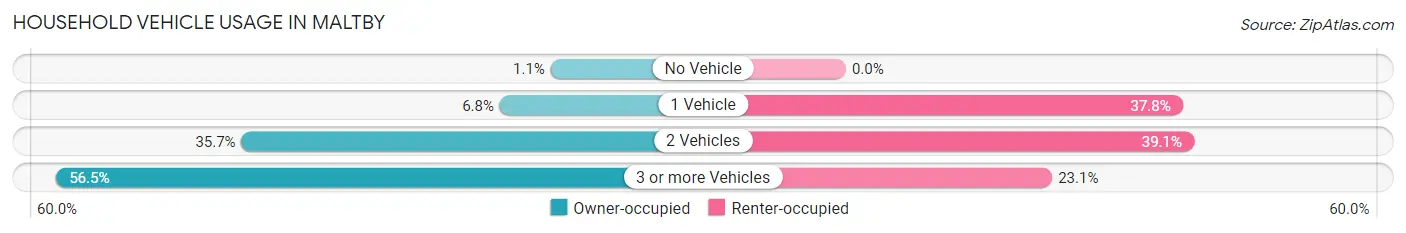
| Vehicles per Household | Owner-occupied | Renter-occupied |
| No Vehicle | 39 (1.1%) | 0 (0.0%) |
| 1 Vehicle | 247 (6.8%) | 90 (37.8%) |
| 2 Vehicles | 1,303 (35.7%) | 93 (39.1%) |
| 3 or more Vehicles | 2,060 (56.5%) | 55 (23.1%) |
| Total | 3,649 (100.0%) | 238 (100.0%) |
Real Estate & Mortgages in Maltby
Real Estate and Mortgage Overview in Maltby
| Characteristic | Without Mortgage | With Mortgage |
| Housing Units | 1,029 | 2,620 |
| Median Property Value | $704,700 | $839,300 |
| Median Household Income | $122,431 | $1,791 |
| Monthly Housing Costs | $910 | $1,497 |
| Real Estate Taxes | $6,598 | $0 |
Property Value by Mortgage Status in Maltby
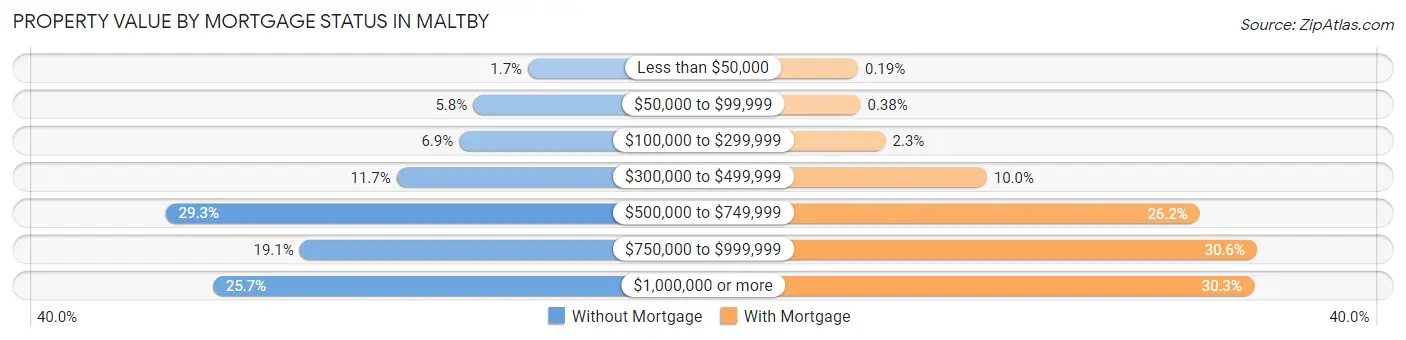
| Property Value | Without Mortgage | With Mortgage |
| Less than $50,000 | 17 (1.7%) | 5 (0.2%) |
| $50,000 to $99,999 | 60 (5.8%) | 10 (0.4%) |
| $100,000 to $299,999 | 71 (6.9%) | 60 (2.3%) |
| $300,000 to $499,999 | 120 (11.7%) | 262 (10.0%) |
| $500,000 to $749,999 | 301 (29.2%) | 687 (26.2%) |
| $750,000 to $999,999 | 196 (19.1%) | 801 (30.6%) |
| $1,000,000 or more | 264 (25.7%) | 795 (30.3%) |
| Total | 1,029 (100.0%) | 2,620 (100.0%) |
Household Income by Mortgage Status in Maltby
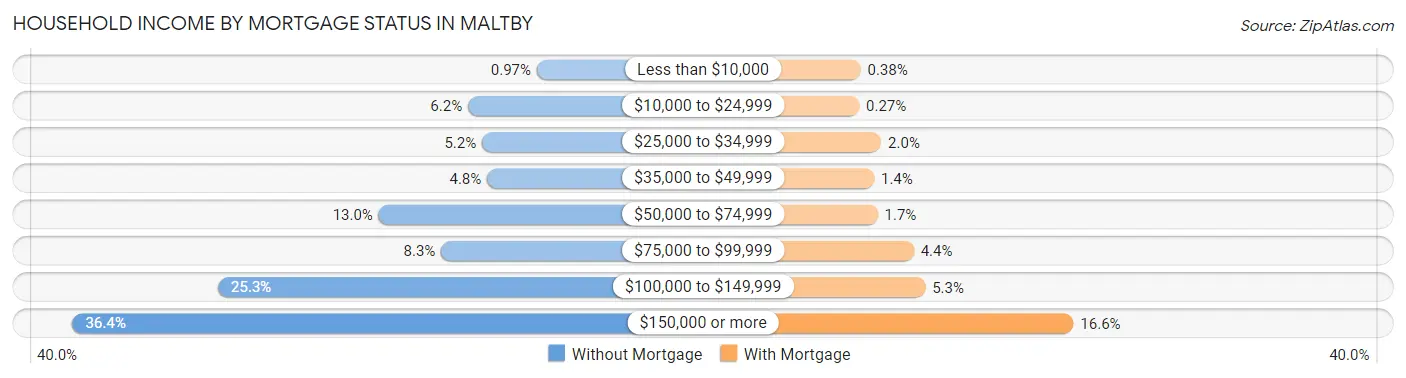
| Household Income | Without Mortgage | With Mortgage |
| Less than $10,000 | 10 (1.0%) | 10 (0.4%) |
| $10,000 to $24,999 | 64 (6.2%) | 7 (0.3%) |
| $25,000 to $34,999 | 53 (5.1%) | 51 (1.9%) |
| $35,000 to $49,999 | 49 (4.8%) | 37 (1.4%) |
| $50,000 to $74,999 | 134 (13.0%) | 44 (1.7%) |
| $75,000 to $99,999 | 85 (8.3%) | 116 (4.4%) |
| $100,000 to $149,999 | 260 (25.3%) | 139 (5.3%) |
| $150,000 or more | 374 (36.3%) | 435 (16.6%) |
| Total | 1,029 (100.0%) | 2,620 (100.0%) |
Property Value to Household Income Ratio in Maltby
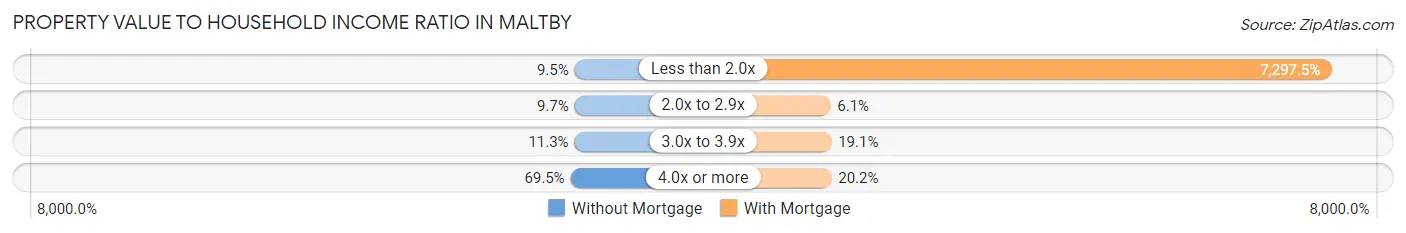
| Value-to-Income Ratio | Without Mortgage | With Mortgage |
| Less than 2.0x | 98 (9.5%) | 191,194 (7,297.5%) |
| 2.0x to 2.9x | 100 (9.7%) | 160 (6.1%) |
| 3.0x to 3.9x | 116 (11.3%) | 501 (19.1%) |
| 4.0x or more | 715 (69.5%) | 530 (20.2%) |
| Total | 1,029 (100.0%) | 2,620 (100.0%) |
Real Estate Taxes by Mortgage Status in Maltby
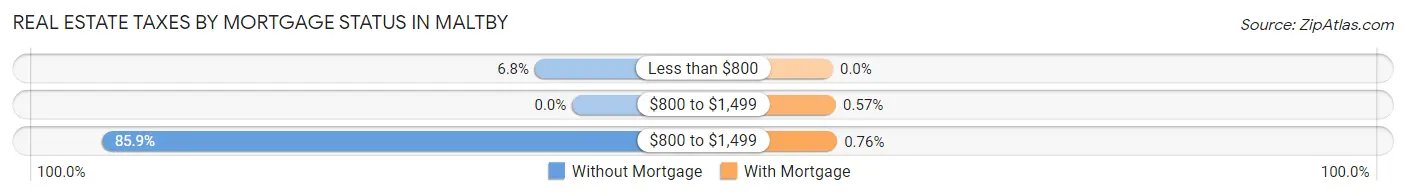
| Property Taxes | Without Mortgage | With Mortgage |
| Less than $800 | 70 (6.8%) | 0 (0.0%) |
| $800 to $1,499 | 0 (0.0%) | 15 (0.6%) |
| $800 to $1,499 | 884 (85.9%) | 20 (0.8%) |
| Total | 1,029 (100.0%) | 2,620 (100.0%) |
Health & Disability in Maltby
Health Insurance Coverage by Age in Maltby
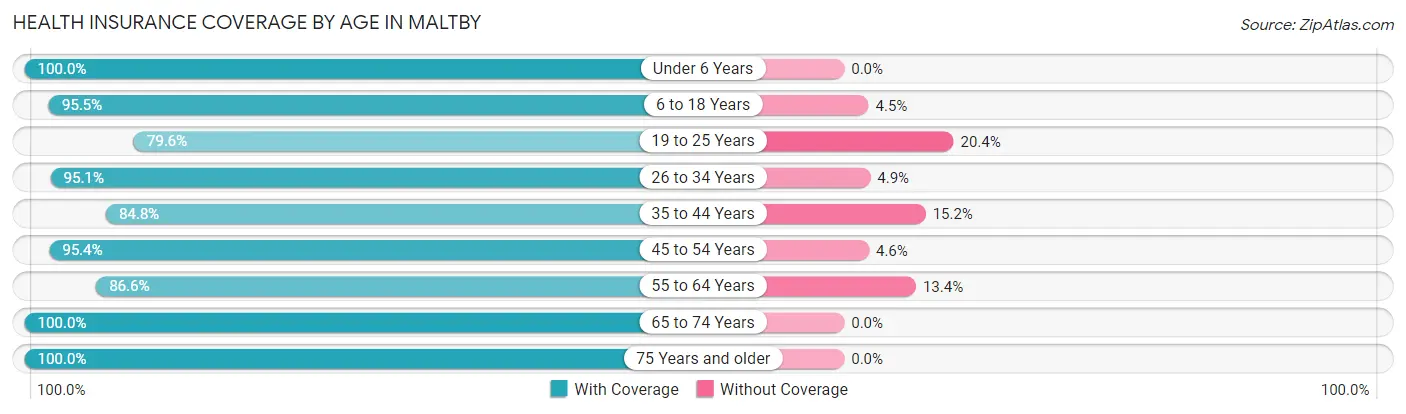
| Age Bracket | With Coverage | Without Coverage |
| Under 6 Years | 591 (100.0%) | 0 (0.0%) |
| 6 to 18 Years | 1,664 (95.5%) | 79 (4.5%) |
| 19 to 25 Years | 582 (79.6%) | 149 (20.4%) |
| 26 to 34 Years | 939 (95.1%) | 48 (4.9%) |
| 35 to 44 Years | 1,179 (84.8%) | 211 (15.2%) |
| 45 to 54 Years | 1,719 (95.4%) | 83 (4.6%) |
| 55 to 64 Years | 1,873 (86.6%) | 289 (13.4%) |
| 65 to 74 Years | 1,367 (100.0%) | 0 (0.0%) |
| 75 Years and older | 541 (100.0%) | 0 (0.0%) |
| Total | 10,455 (92.4%) | 859 (7.6%) |
Health Insurance Coverage by Citizenship Status in Maltby
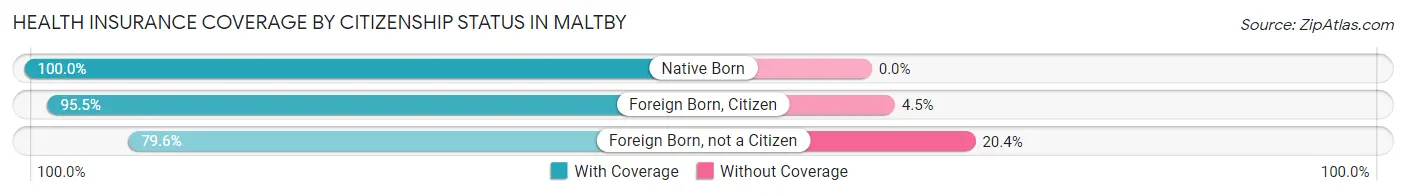
| Citizenship Status | With Coverage | Without Coverage |
| Native Born | 591 (100.0%) | 0 (0.0%) |
| Foreign Born, Citizen | 1,664 (95.5%) | 79 (4.5%) |
| Foreign Born, not a Citizen | 582 (79.6%) | 149 (20.4%) |
Health Insurance Coverage by Household Income in Maltby
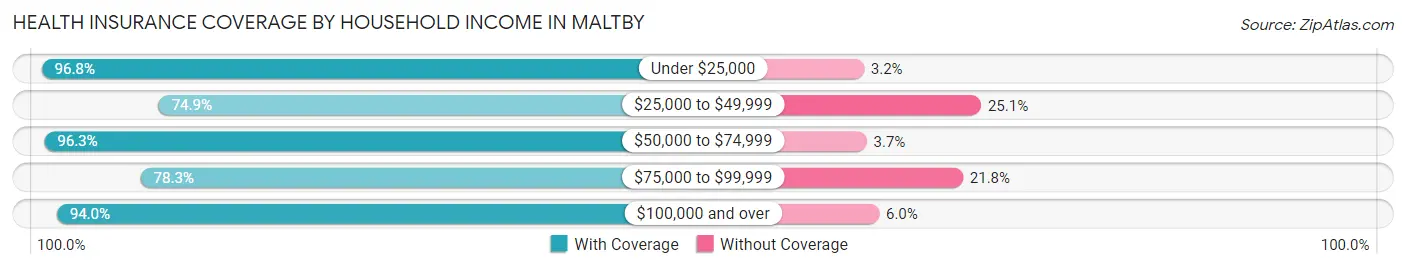
| Household Income | With Coverage | Without Coverage |
| Under $25,000 | 303 (96.8%) | 10 (3.2%) |
| $25,000 to $49,999 | 405 (74.9%) | 136 (25.1%) |
| $50,000 to $74,999 | 545 (96.3%) | 21 (3.7%) |
| $75,000 to $99,999 | 482 (78.2%) | 134 (21.7%) |
| $100,000 and over | 8,675 (94.0%) | 558 (6.0%) |
Public vs Private Health Insurance Coverage by Age in Maltby
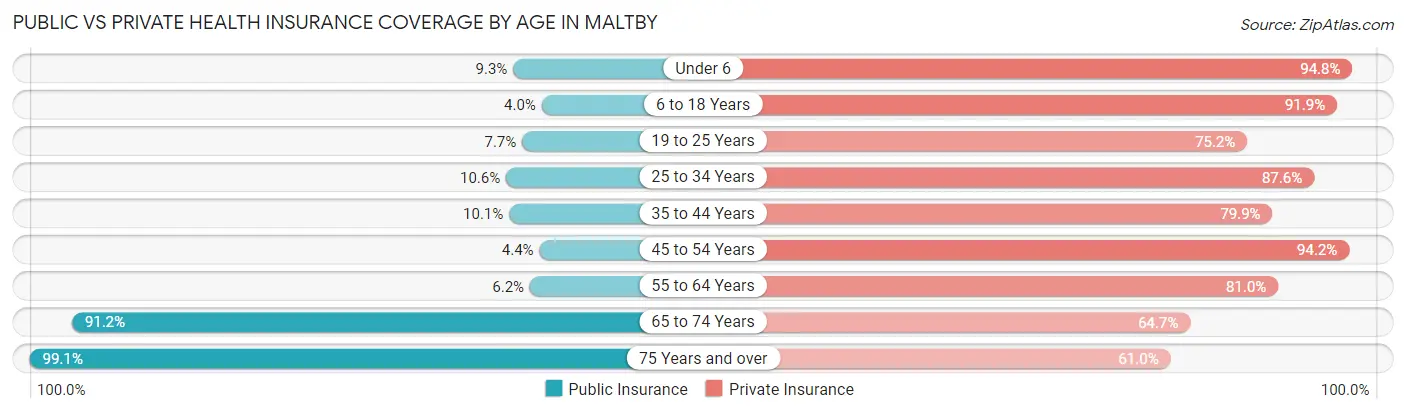
| Age Bracket | Public Insurance | Private Insurance |
| Under 6 | 55 (9.3%) | 560 (94.8%) |
| 6 to 18 Years | 70 (4.0%) | 1,602 (91.9%) |
| 19 to 25 Years | 56 (7.7%) | 550 (75.2%) |
| 25 to 34 Years | 105 (10.6%) | 865 (87.6%) |
| 35 to 44 Years | 140 (10.1%) | 1,111 (79.9%) |
| 45 to 54 Years | 80 (4.4%) | 1,697 (94.2%) |
| 55 to 64 Years | 134 (6.2%) | 1,751 (81.0%) |
| 65 to 74 Years | 1,247 (91.2%) | 884 (64.7%) |
| 75 Years and over | 536 (99.1%) | 330 (61.0%) |
| Total | 2,423 (21.4%) | 9,350 (82.6%) |
Disability Status by Sex by Age in Maltby
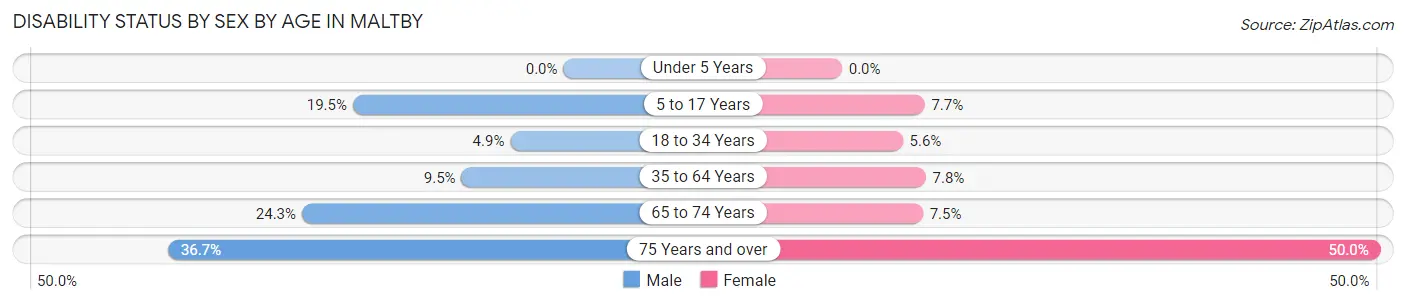
| Age Bracket | Male | Female |
| Under 5 Years | 0 (0.0%) | 0 (0.0%) |
| 5 to 17 Years | 180 (19.5%) | 58 (7.7%) |
| 18 to 34 Years | 47 (4.9%) | 51 (5.6%) |
| 35 to 64 Years | 256 (9.5%) | 206 (7.8%) |
| 65 to 74 Years | 167 (24.3%) | 51 (7.5%) |
| 75 Years and over | 98 (36.7%) | 137 (50.0%) |
Disability Class by Sex by Age in Maltby
Disability Class: Hearing Difficulty
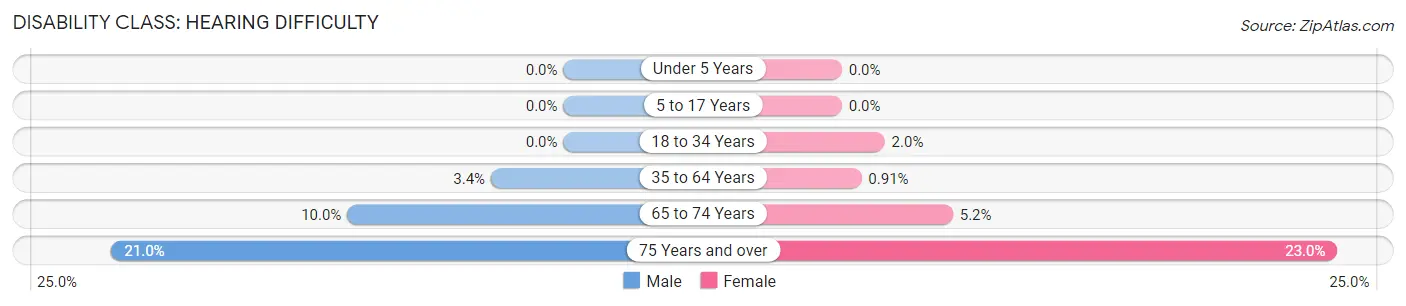
| Age Bracket | Male | Female |
| Under 5 Years | 0 (0.0%) | 0 (0.0%) |
| 5 to 17 Years | 0 (0.0%) | 0 (0.0%) |
| 18 to 34 Years | 0 (0.0%) | 18 (2.0%) |
| 35 to 64 Years | 91 (3.4%) | 24 (0.9%) |
| 65 to 74 Years | 69 (10.0%) | 35 (5.1%) |
| 75 Years and over | 56 (21.0%) | 63 (23.0%) |
Disability Class: Vision Difficulty
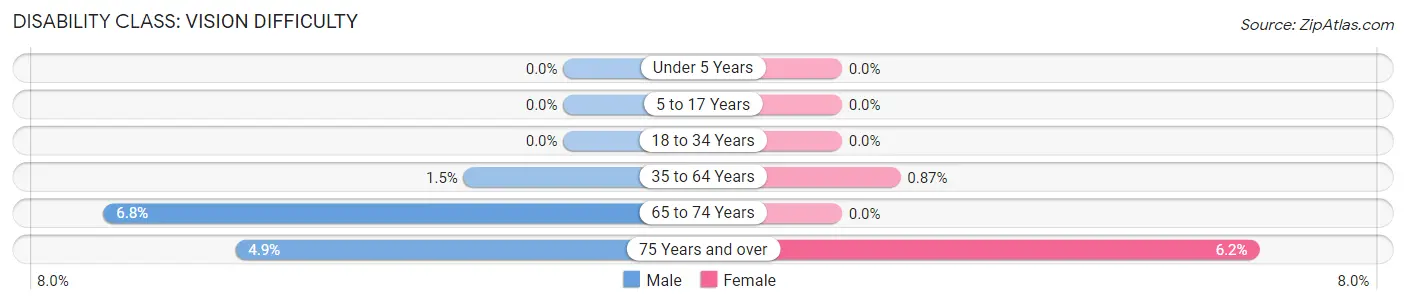
| Age Bracket | Male | Female |
| Under 5 Years | 0 (0.0%) | 0 (0.0%) |
| 5 to 17 Years | 0 (0.0%) | 0 (0.0%) |
| 18 to 34 Years | 0 (0.0%) | 0 (0.0%) |
| 35 to 64 Years | 40 (1.5%) | 23 (0.9%) |
| 65 to 74 Years | 47 (6.8%) | 0 (0.0%) |
| 75 Years and over | 13 (4.9%) | 17 (6.2%) |
Disability Class: Cognitive Difficulty
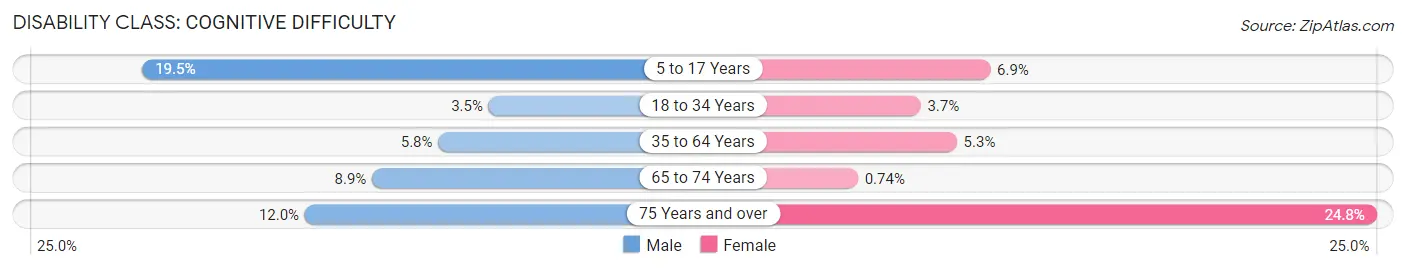
| Age Bracket | Male | Female |
| 5 to 17 Years | 180 (19.5%) | 52 (6.9%) |
| 18 to 34 Years | 33 (3.5%) | 33 (3.6%) |
| 35 to 64 Years | 157 (5.8%) | 141 (5.3%) |
| 65 to 74 Years | 61 (8.9%) | 5 (0.7%) |
| 75 Years and over | 32 (12.0%) | 68 (24.8%) |
Disability Class: Ambulatory Difficulty
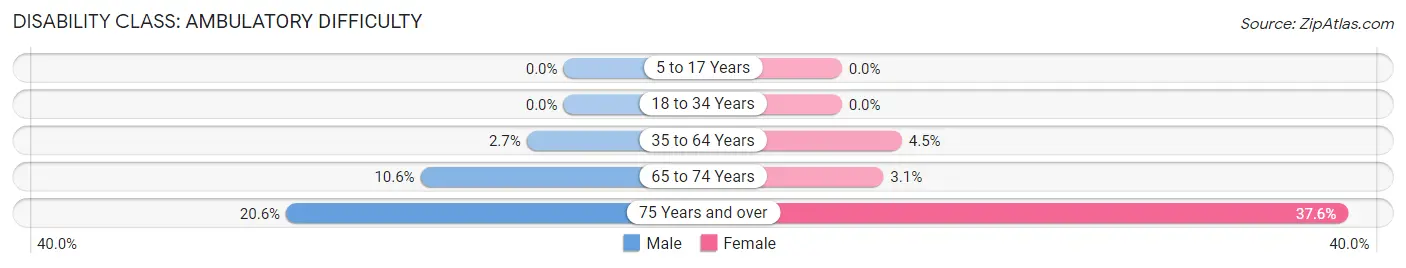
| Age Bracket | Male | Female |
| 5 to 17 Years | 0 (0.0%) | 0 (0.0%) |
| 18 to 34 Years | 0 (0.0%) | 0 (0.0%) |
| 35 to 64 Years | 74 (2.7%) | 118 (4.5%) |
| 65 to 74 Years | 73 (10.6%) | 21 (3.1%) |
| 75 Years and over | 55 (20.6%) | 103 (37.6%) |
Disability Class: Self-Care Difficulty
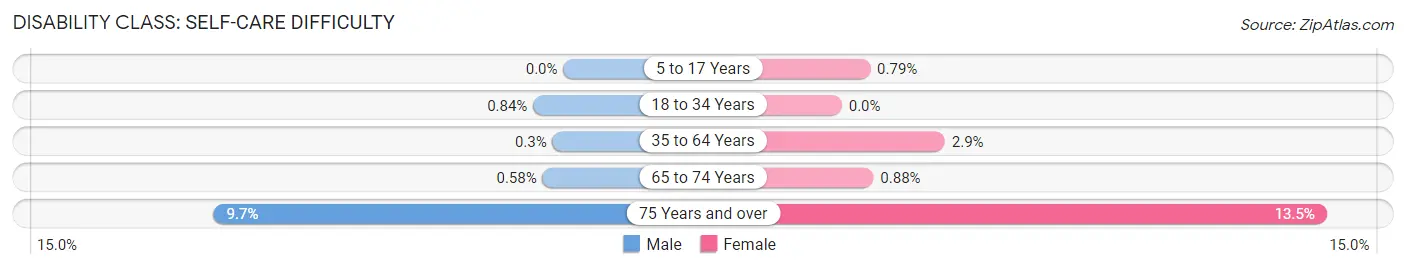
| Age Bracket | Male | Female |
| 5 to 17 Years | 0 (0.0%) | 6 (0.8%) |
| 18 to 34 Years | 8 (0.8%) | 0 (0.0%) |
| 35 to 64 Years | 8 (0.3%) | 76 (2.9%) |
| 65 to 74 Years | 4 (0.6%) | 6 (0.9%) |
| 75 Years and over | 26 (9.7%) | 37 (13.5%) |
Technology Access in Maltby
Computing Device Access in Maltby
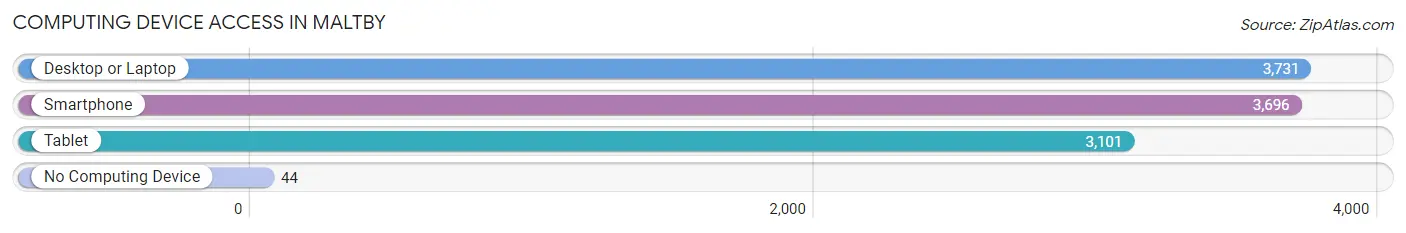
| Device Type | # Households | % Households |
| Desktop or Laptop | 3,731 | 96.0% |
| Smartphone | 3,696 | 95.1% |
| Tablet | 3,101 | 79.8% |
| No Computing Device | 44 | 1.1% |
| Total | 3,887 | 100.0% |
Internet Access in Maltby
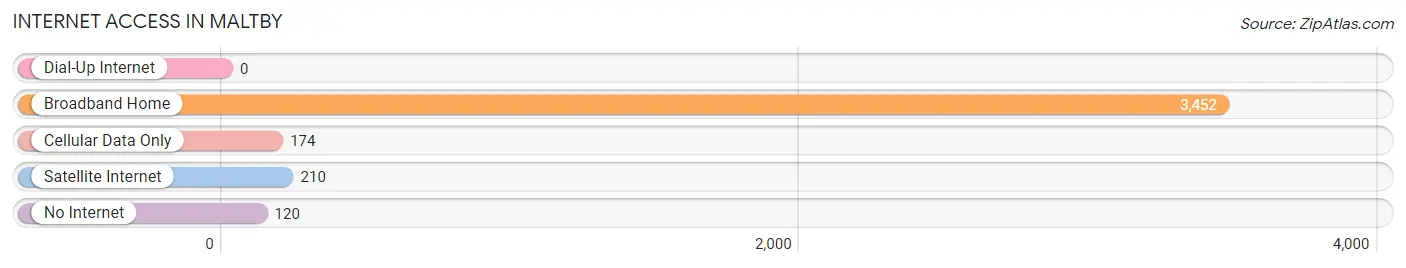
| Internet Type | # Households | % Households |
| Dial-Up Internet | 0 | 0.0% |
| Broadband Home | 3,452 | 88.8% |
| Cellular Data Only | 174 | 4.5% |
| Satellite Internet | 210 | 5.4% |
| No Internet | 120 | 3.1% |
| Total | 3,887 | 100.0% |
Maltby Summary
Maltby is a small unincorporated community located in Snohomish County, Washington, United States. It is situated in the Cascade foothills, approximately 25 miles northeast of Seattle. The population of Maltby was estimated to be 4,845 in 2019.
History
Maltby was first settled in the late 1800s by a group of Swedish immigrants. The community was named after a local farmer, John Maltby, who owned a large tract of land in the area. The first post office was established in 1891.
In the early 1900s, the area was primarily agricultural, with dairy farms and orchards being the main sources of income. The area was also home to a number of sawmills and logging operations.
In the 1950s, the area began to experience rapid growth as Seattle’s population expanded. This growth was fueled by the construction of Interstate 5, which connected Seattle to the rest of the state.
Geography
Maltby is located in the Cascade foothills, approximately 25 miles northeast of Seattle. The area is characterized by rolling hills and dense forests. The nearby Cascade Mountains provide a dramatic backdrop to the community.
The climate in Maltby is mild and temperate, with warm summers and cool winters. The average annual temperature is around 50 degrees Fahrenheit.
Economy
Maltby’s economy is primarily based on agriculture and forestry. The area is home to a number of dairy farms, orchards, and nurseries. Logging and sawmills are also important sources of income.
In recent years, Maltby has become a popular destination for outdoor recreation. The area is home to a number of parks and trails, as well as several lakes and rivers.
Demographics
Maltby’s population was estimated to be 4,845 in 2019. The population is primarily white (90.3%), with a small percentage of African Americans (2.2%), Asians (2.1%), and Native Americans (0.7%). The median household income is $76,845, and the median age is 39.7 years.
Conclusion
Maltby is a small unincorporated community located in Snohomish County, Washington. It is situated in the Cascade foothills, approximately 25 miles northeast of Seattle. The population of Maltby was estimated to be 4,845 in 2019. The economy is primarily based on agriculture and forestry, and the area is also becoming a popular destination for outdoor recreation. The population is primarily white, with a median household income of $76,845 and a median age of 39.7 years.
Common Questions
What is Per Capita Income in Maltby?
Per Capita income in Maltby is $64,910.
What is the Median Family Income in Maltby?
Median Family Income in Maltby is $173,622.
What is the Median Household income in Maltby?
Median Household Income in Maltby is $167,928.
What is Income or Wage Gap in Maltby?
Income or Wage Gap in Maltby is 37.5%.
Women in Maltby earn 62.5 cents for every dollar earned by a man.
What is Inequality or Gini Index in Maltby?
Inequality or Gini Index in Maltby is 0.35.
What is the Total Population of Maltby?
Total Population of Maltby is 11,347.
What is the Total Male Population of Maltby?
Total Male Population of Maltby is 5,869.
What is the Total Female Population of Maltby?
Total Female Population of Maltby is 5,478.
What is the Ratio of Males per 100 Females in Maltby?
There are 107.14 Males per 100 Females in Maltby.
What is the Ratio of Females per 100 Males in Maltby?
There are 93.34 Females per 100 Males in Maltby.
What is the Median Population Age in Maltby?
Median Population Age in Maltby is 46.0 Years.
What is the Average Family Size in Maltby
Average Family Size in Maltby is 3.1 People.
What is the Average Household Size in Maltby
Average Household Size in Maltby is 2.9 People.
How Large is the Labor Force in Maltby?
There are 6,370 People in the Labor Forcein in Maltby.
What is the Percentage of People in the Labor Force in Maltby?
67.2% of People are in the Labor Force in Maltby.
What is the Unemployment Rate in Maltby?
Unemployment Rate in Maltby is 3.1%.