Bellevue, WA Map & Demographics
Bellevue Map
Bellevue Overview
$85,845
PER CAPITA INCOME
$184,922
AVG FAMILY INCOME
$149,551
AVG HOUSEHOLD INCOME
48.7%
WAGE / INCOME GAP [ % ]
51.3¢/ $1
WAGE / INCOME GAP [ $ ]
$12,008
FAMILY INCOME DEFICIT
0.47
INEQUALITY / GINI INDEX
150,606
TOTAL POPULATION
77,187
MALE POPULATION
73,419
FEMALE POPULATION
105.13
MALES / 100 FEMALES
95.12
FEMALES / 100 MALES
38.3
MEDIAN AGE
3.0
AVG FAMILY SIZE
2.5
AVG HOUSEHOLD SIZE
82,704
LABOR FORCE [ PEOPLE ]
66.6%
PERCENT IN LABOR FORCE
4.0%
UNEMPLOYMENT RATE
Bellevue Area Codes
Income in Bellevue
Income Overview in Bellevue
Per Capita Income in Bellevue is $85,845, while median incomes of families and households are $184,922 and $149,551 respectively.
| Characteristic | Number | Measure |
| Per Capita Income | 150,606 | $85,845 |
| Median Family Income | 39,118 | $184,922 |
| Mean Family Income | 39,118 | $247,757 |
| Median Household Income | 60,882 | $149,551 |
| Mean Household Income | 60,882 | $208,947 |
| Income Deficit | 39,118 | $12,008 |
| Wage / Income Gap (%) | 150,606 | 48.67% |
| Wage / Income Gap ($) | 150,606 | 51.33¢ per $1 |
| Gini / Inequality Index | 150,606 | 0.47 |
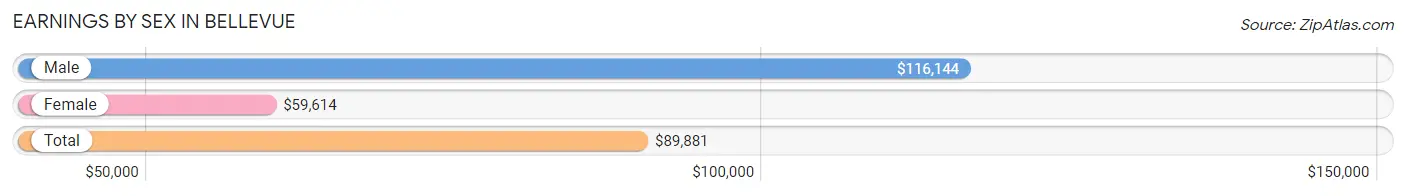
Earnings by Sex in Bellevue
Average Earnings in Bellevue are $89,881, $116,144 for men and $59,614 for women, a difference of 48.7%.
| Sex | Number | Average Earnings |
| Male | 49,331 (57.3%) | $116,144 |
| Female | 36,837 (42.7%) | $59,614 |
| Total | 86,168 (100.0%) | $89,881 |
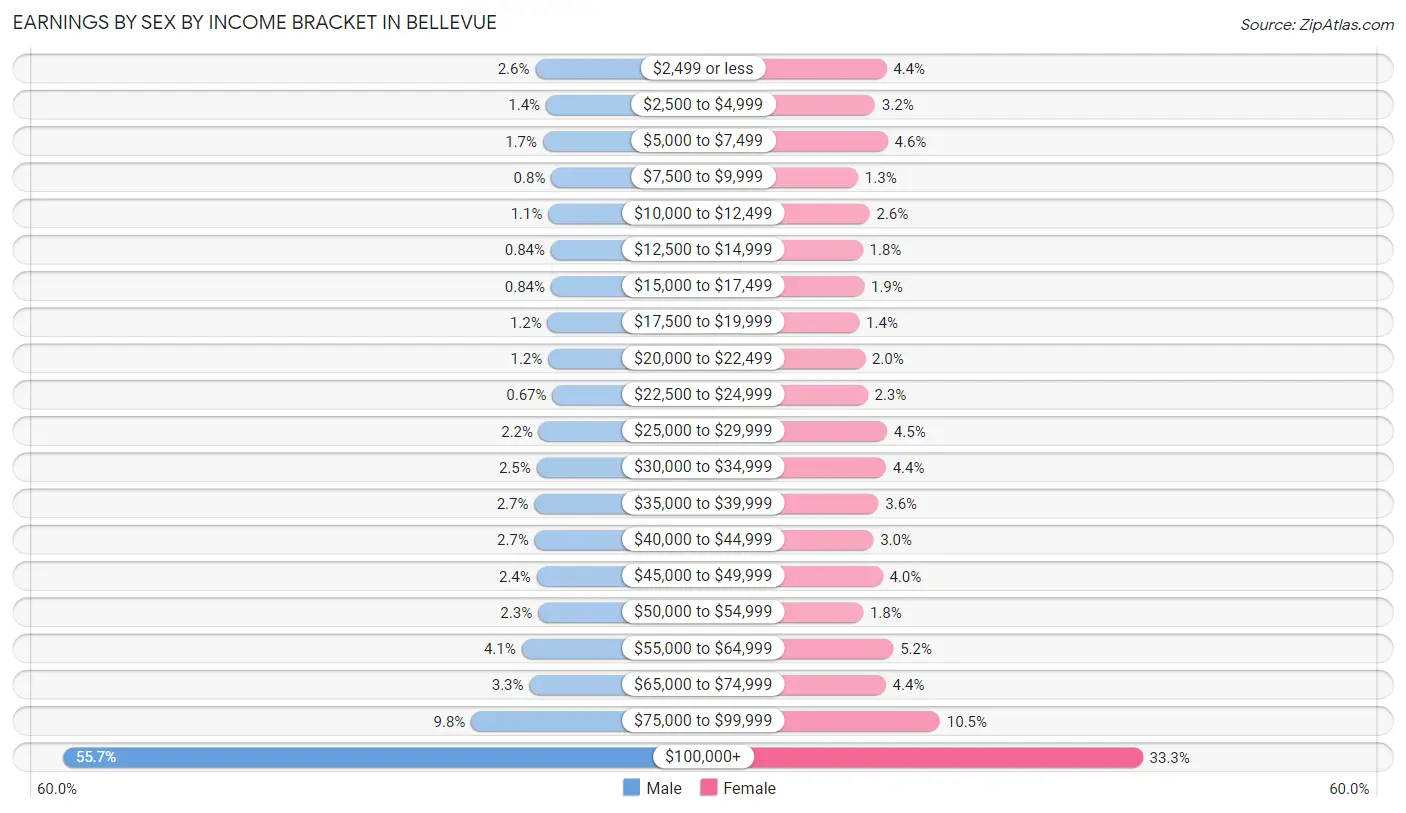
Earnings by Sex by Income Bracket in Bellevue
The most common earnings brackets in Bellevue are $100,000+ for men (27,479 | 55.7%) and $100,000+ for women (12,247 | 33.3%).
| Income | Male | Female |
| $2,499 or less | 1,276 (2.6%) | 1,637 (4.4%) |
| $2,500 to $4,999 | 691 (1.4%) | 1,164 (3.2%) |
| $5,000 to $7,499 | 858 (1.7%) | 1,691 (4.6%) |
| $7,500 to $9,999 | 394 (0.8%) | 459 (1.3%) |
| $10,000 to $12,499 | 558 (1.1%) | 942 (2.6%) |
| $12,500 to $14,999 | 413 (0.8%) | 655 (1.8%) |
| $15,000 to $17,499 | 413 (0.8%) | 713 (1.9%) |
| $17,500 to $19,999 | 595 (1.2%) | 512 (1.4%) |
| $20,000 to $22,499 | 566 (1.1%) | 751 (2.0%) |
| $22,500 to $24,999 | 332 (0.7%) | 857 (2.3%) |
| $25,000 to $29,999 | 1,078 (2.2%) | 1,663 (4.5%) |
| $30,000 to $34,999 | 1,208 (2.5%) | 1,614 (4.4%) |
| $35,000 to $39,999 | 1,334 (2.7%) | 1,306 (3.5%) |
| $40,000 to $44,999 | 1,318 (2.7%) | 1,095 (3.0%) |
| $45,000 to $49,999 | 1,205 (2.4%) | 1,477 (4.0%) |
| $50,000 to $54,999 | 1,128 (2.3%) | 671 (1.8%) |
| $55,000 to $64,999 | 2,044 (4.1%) | 1,922 (5.2%) |
| $65,000 to $74,999 | 1,609 (3.3%) | 1,608 (4.4%) |
| $75,000 to $99,999 | 4,832 (9.8%) | 3,853 (10.5%) |
| $100,000+ | 27,479 (55.7%) | 12,247 (33.3%) |
| Total | 49,331 (100.0%) | 36,837 (100.0%) |
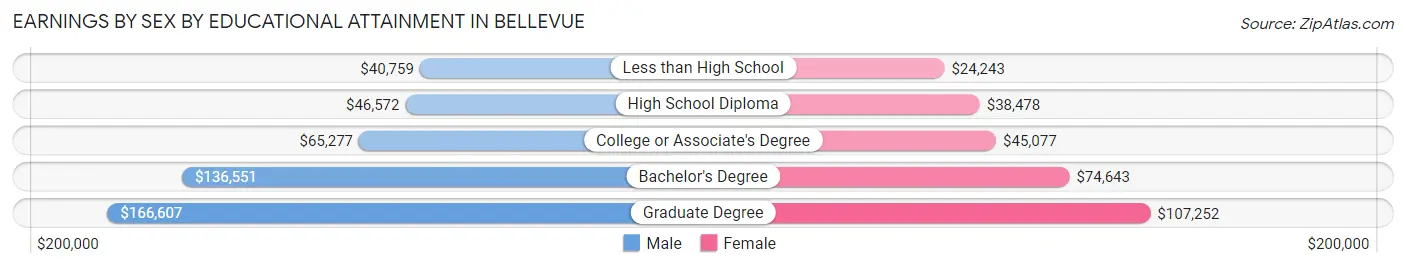
Earnings by Sex by Educational Attainment in Bellevue
Average earnings in Bellevue are $127,571 for men and $71,095 for women, a difference of 44.3%. Men with an educational attainment of graduate degree enjoy the highest average annual earnings of $166,607, while those with less than high school education earn the least with $40,759. Women with an educational attainment of graduate degree earn the most with the average annual earnings of $107,252, while those with less than high school education have the smallest earnings of $24,243.
| Educational Attainment | Male Income | Female Income |
| Less than High School | $40,759 | $24,243 |
| High School Diploma | $46,572 | $38,478 |
| College or Associate's Degree | $65,277 | $45,077 |
| Bachelor's Degree | $136,551 | $74,643 |
| Graduate Degree | $166,607 | $107,252 |
| Total | $127,571 | $71,095 |
Family Income in Bellevue
Family Income Brackets in Bellevue
According to the Bellevue family income data, there are 17,642 families falling into the $200,000+ income range, which is the most common income bracket and makes up 45.1% of all families. Conversely, the $10,000 to $14,999 income bracket is the least frequent group with only 430 families (1.1%) belonging to this category.
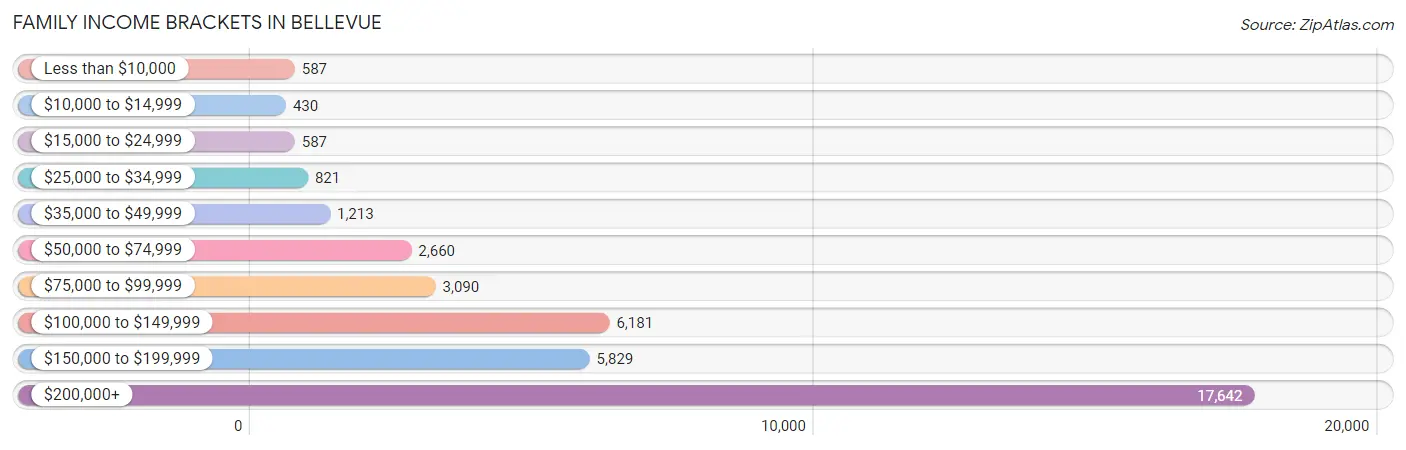
| Income Bracket | # Families | % Families |
| Less than $10,000 | 587 | 1.5% |
| $10,000 to $14,999 | 430 | 1.1% |
| $15,000 to $24,999 | 587 | 1.5% |
| $25,000 to $34,999 | 821 | 2.1% |
| $35,000 to $49,999 | 1,213 | 3.1% |
| $50,000 to $74,999 | 2,660 | 6.8% |
| $75,000 to $99,999 | 3,090 | 7.9% |
| $100,000 to $149,999 | 6,181 | 15.8% |
| $150,000 to $199,999 | 5,829 | 14.9% |
| $200,000+ | 17,642 | 45.1% |
Family Income by Famaliy Size in Bellevue
5-person families (2,305 | 5.9%) account for the highest median family income in Bellevue with $250,001 per family, while 2-person families (17,887 | 45.7%) have the highest median income of $79,169 per family member.
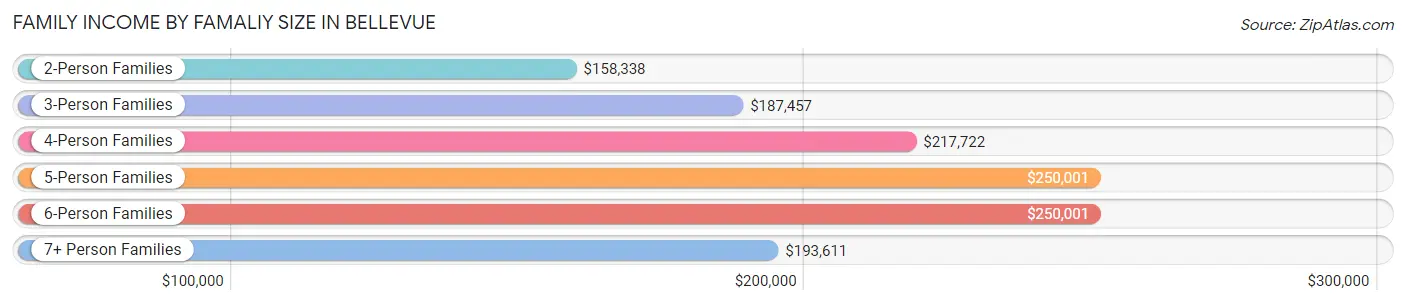
| Income Bracket | # Families | Median Income |
| 2-Person Families | 17,887 (45.7%) | $158,338 |
| 3-Person Families | 9,327 (23.8%) | $187,457 |
| 4-Person Families | 8,681 (22.2%) | $217,722 |
| 5-Person Families | 2,305 (5.9%) | $250,001 |
| 6-Person Families | 594 (1.5%) | $250,001 |
| 7+ Person Families | 324 (0.8%) | $193,611 |
| Total | 39,118 (100.0%) | $184,922 |
Family Income by Number of Earners in Bellevue
The median family income in Bellevue is $184,922, with families comprising 3+ earners (3,472) having the highest median family income of $233,409, while families with no earners (4,324) have the lowest median family income of $81,922, accounting for 8.9% and 11.1% of families, respectively.
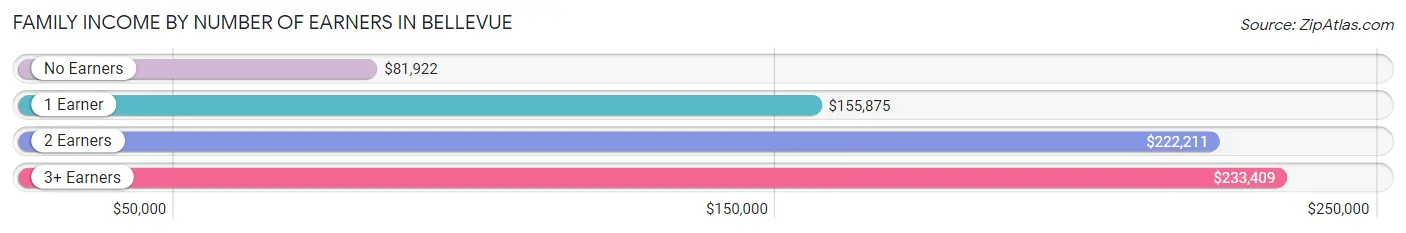
| Number of Earners | # Families | Median Income |
| No Earners | 4,324 (11.1%) | $81,922 |
| 1 Earner | 13,404 (34.3%) | $155,875 |
| 2 Earners | 17,918 (45.8%) | $222,211 |
| 3+ Earners | 3,472 (8.9%) | $233,409 |
| Total | 39,118 (100.0%) | $184,922 |
Household Income in Bellevue
Household Income Brackets in Bellevue
With 22,039 households falling in the category, the $200,000+ income range is the most frequent in Bellevue, accounting for 36.2% of all households. In contrast, only 1,218 households (2.0%) fall into the $10,000 to $14,999 income bracket, making it the least populous group.
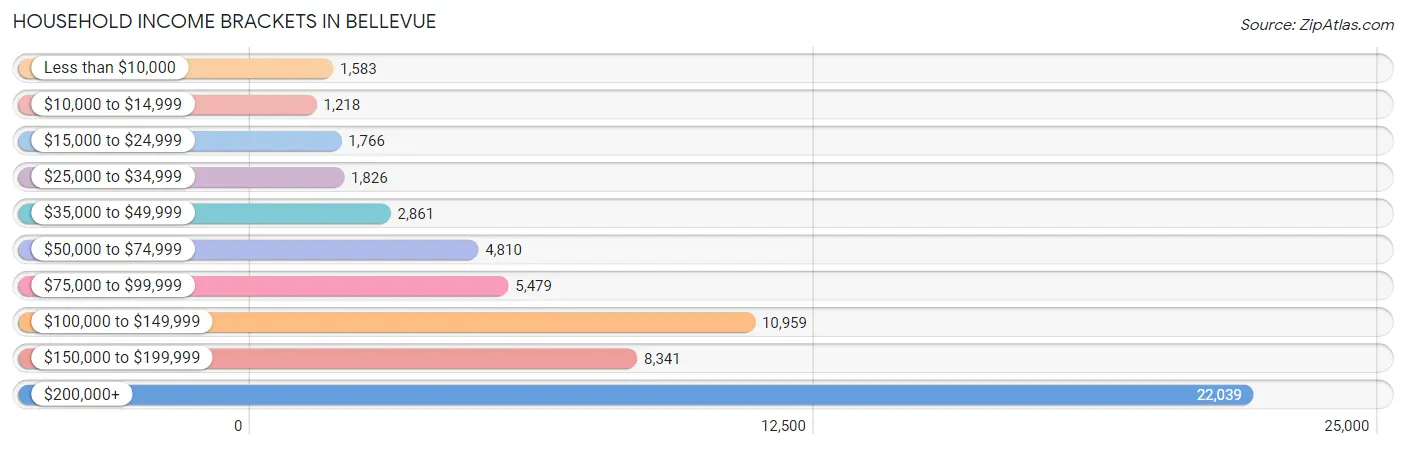
| Income Bracket | # Households | % Households |
| Less than $10,000 | 1,583 | 2.6% |
| $10,000 to $14,999 | 1,218 | 2.0% |
| $15,000 to $24,999 | 1,766 | 2.9% |
| $25,000 to $34,999 | 1,826 | 3.0% |
| $35,000 to $49,999 | 2,861 | 4.7% |
| $50,000 to $74,999 | 4,810 | 7.9% |
| $75,000 to $99,999 | 5,479 | 9.0% |
| $100,000 to $149,999 | 10,959 | 18.0% |
| $150,000 to $199,999 | 8,341 | 13.7% |
| $200,000+ | 22,039 | 36.2% |
Household Income by Householder Age in Bellevue
The median household income in Bellevue is $149,551, with the highest median household income of $184,754 found in the 45 to 64 years age bracket for the primary householder. A total of 20,506 households (33.7%) fall into this category. Meanwhile, the 15 to 24 years age bracket for the primary householder has the lowest median household income of $74,231, with 1,896 households (3.1%) in this group.
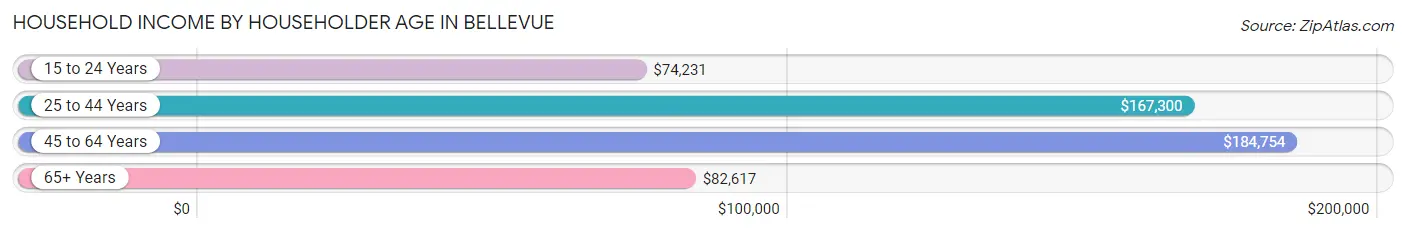
| Income Bracket | # Households | Median Income |
| 15 to 24 Years | 1,896 (3.1%) | $74,231 |
| 25 to 44 Years | 26,194 (43.0%) | $167,300 |
| 45 to 64 Years | 20,506 (33.7%) | $184,754 |
| 65+ Years | 12,286 (20.2%) | $82,617 |
| Total | 60,882 (100.0%) | $149,551 |
Poverty in Bellevue
Income Below Poverty by Sex and Age in Bellevue
With 6.1% poverty level for males and 8.5% for females among the residents of Bellevue, 15 year old males and 15 year old females are the most vulnerable to poverty, with 175 males (17.2%) and 206 females (22.8%) in their respective age groups living below the poverty level.
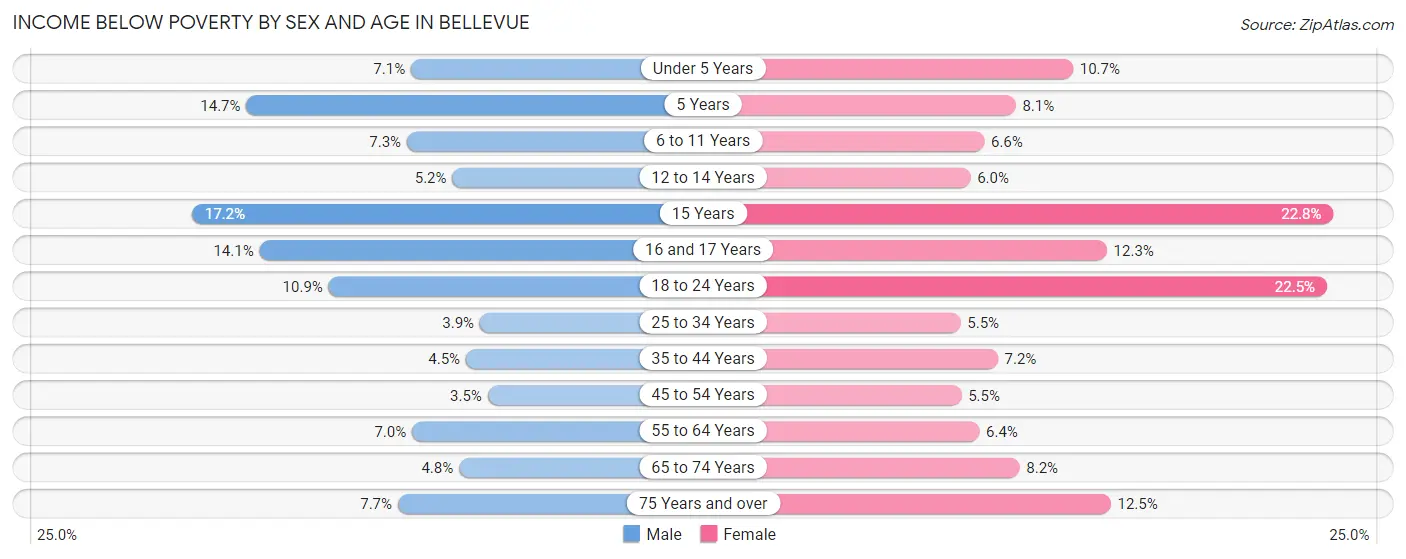
| Age Bracket | Male | Female |
| Under 5 Years | 266 (7.1%) | 372 (10.7%) |
| 5 Years | 138 (14.7%) | 70 (8.1%) |
| 6 to 11 Years | 376 (7.3%) | 288 (6.6%) |
| 12 to 14 Years | 155 (5.1%) | 157 (6.0%) |
| 15 Years | 175 (17.2%) | 206 (22.8%) |
| 16 and 17 Years | 276 (14.1%) | 204 (12.3%) |
| 18 to 24 Years | 603 (10.9%) | 1,026 (22.5%) |
| 25 to 34 Years | 592 (3.9%) | 677 (5.5%) |
| 35 to 44 Years | 537 (4.5%) | 790 (7.2%) |
| 45 to 54 Years | 363 (3.5%) | 585 (5.5%) |
| 55 to 64 Years | 617 (7.0%) | 536 (6.4%) |
| 65 to 74 Years | 234 (4.8%) | 553 (8.2%) |
| 75 Years and over | 334 (7.7%) | 717 (12.5%) |
| Total | 4,666 (6.1%) | 6,181 (8.5%) |
Income Above Poverty by Sex and Age in Bellevue
According to the poverty statistics in Bellevue, males aged 45 to 54 years and females aged 25 to 34 years are the age groups that are most secure financially, with 96.5% of males and 94.5% of females in these age groups living above the poverty line.
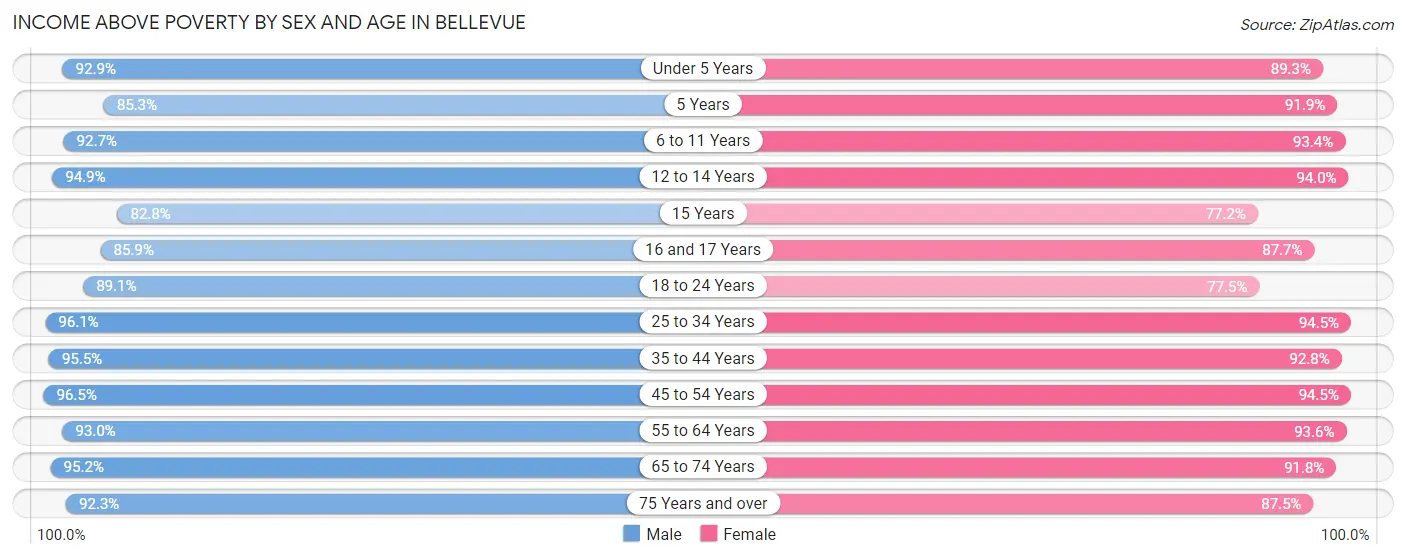
| Age Bracket | Male | Female |
| Under 5 Years | 3,496 (92.9%) | 3,098 (89.3%) |
| 5 Years | 800 (85.3%) | 798 (91.9%) |
| 6 to 11 Years | 4,801 (92.7%) | 4,074 (93.4%) |
| 12 to 14 Years | 2,853 (94.9%) | 2,478 (94.0%) |
| 15 Years | 840 (82.8%) | 697 (77.2%) |
| 16 and 17 Years | 1,682 (85.9%) | 1,456 (87.7%) |
| 18 to 24 Years | 4,934 (89.1%) | 3,531 (77.5%) |
| 25 to 34 Years | 14,691 (96.1%) | 11,627 (94.5%) |
| 35 to 44 Years | 11,342 (95.5%) | 10,144 (92.8%) |
| 45 to 54 Years | 9,971 (96.5%) | 9,974 (94.5%) |
| 55 to 64 Years | 8,173 (93.0%) | 7,876 (93.6%) |
| 65 to 74 Years | 4,601 (95.2%) | 6,155 (91.8%) |
| 75 Years and over | 4,017 (92.3%) | 5,035 (87.5%) |
| Total | 72,201 (93.9%) | 66,943 (91.5%) |
Income Below Poverty Among Married-Couple Families in Bellevue
The poverty statistics for married-couple families in Bellevue show that 2.3% or 774 of the total 33,612 families live below the poverty line. Families with 5 or more children have the highest poverty rate of 71.9%, comprising of 46 families. On the other hand, families with 3 or 4 children have the lowest poverty rate of 0.4%, which includes 6 families.
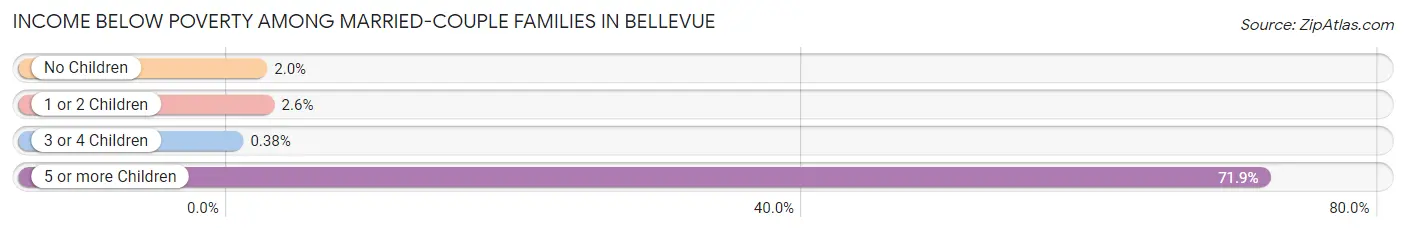
| Children | Above Poverty | Below Poverty |
| No Children | 17,844 (98.0%) | 371 (2.0%) |
| 1 or 2 Children | 13,422 (97.5%) | 351 (2.5%) |
| 3 or 4 Children | 1,554 (99.6%) | 6 (0.4%) |
| 5 or more Children | 18 (28.1%) | 46 (71.9%) |
| Total | 32,838 (97.7%) | 774 (2.3%) |
Income Below Poverty Among Single-Parent Households in Bellevue
According to the poverty data in Bellevue, 8.1% or 129 single-father households and 19.0% or 742 single-mother households are living below the poverty line. Among single-father households, those with 3 or 4 children have the highest poverty rate, with 21 households (61.8%) experiencing poverty. Likewise, among single-mother households, those with 3 or 4 children have the highest poverty rate, with 135 households (44.6%) falling below the poverty line.
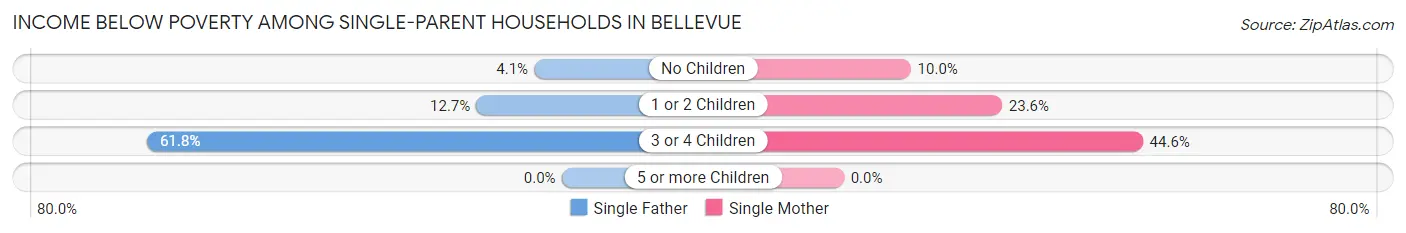
| Children | Single Father | Single Mother |
| No Children | 43 (4.1%) | 179 (10.0%) |
| 1 or 2 Children | 65 (12.7%) | 428 (23.6%) |
| 3 or 4 Children | 21 (61.8%) | 135 (44.6%) |
| 5 or more Children | 0 (0.0%) | 0 (0.0%) |
| Total | 129 (8.1%) | 742 (19.0%) |
Income Below Poverty Among Married-Couple vs Single-Parent Households in Bellevue
The poverty data for Bellevue shows that 774 of the married-couple family households (2.3%) and 871 of the single-parent households (15.8%) are living below the poverty level. Within the married-couple family households, those with 5 or more children have the highest poverty rate, with 46 households (71.9%) falling below the poverty line. Among the single-parent households, those with 3 or 4 children have the highest poverty rate, with 156 household (46.3%) living below poverty.
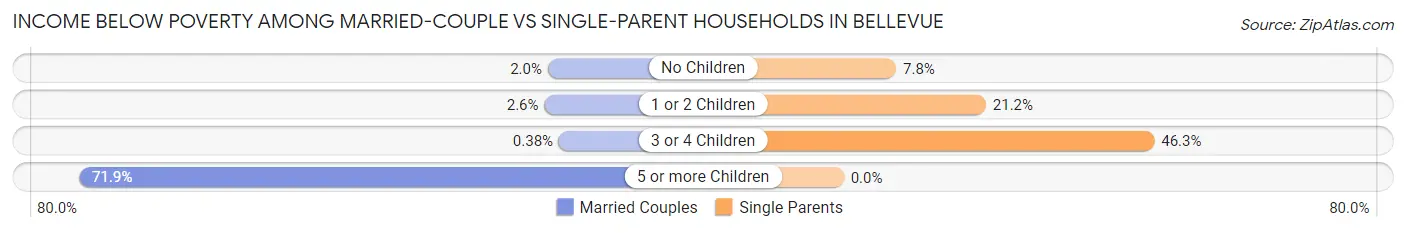
| Children | Married-Couple Families | Single-Parent Households |
| No Children | 371 (2.0%) | 222 (7.8%) |
| 1 or 2 Children | 351 (2.5%) | 493 (21.2%) |
| 3 or 4 Children | 6 (0.4%) | 156 (46.3%) |
| 5 or more Children | 46 (71.9%) | 0 (0.0%) |
| Total | 774 (2.3%) | 871 (15.8%) |
Race in Bellevue
The most populous races in Bellevue are White / Caucasian (71,016 | 47.1%), Asian (59,481 | 39.5%), and Hispanic or Latino (12,320 | 8.2%).
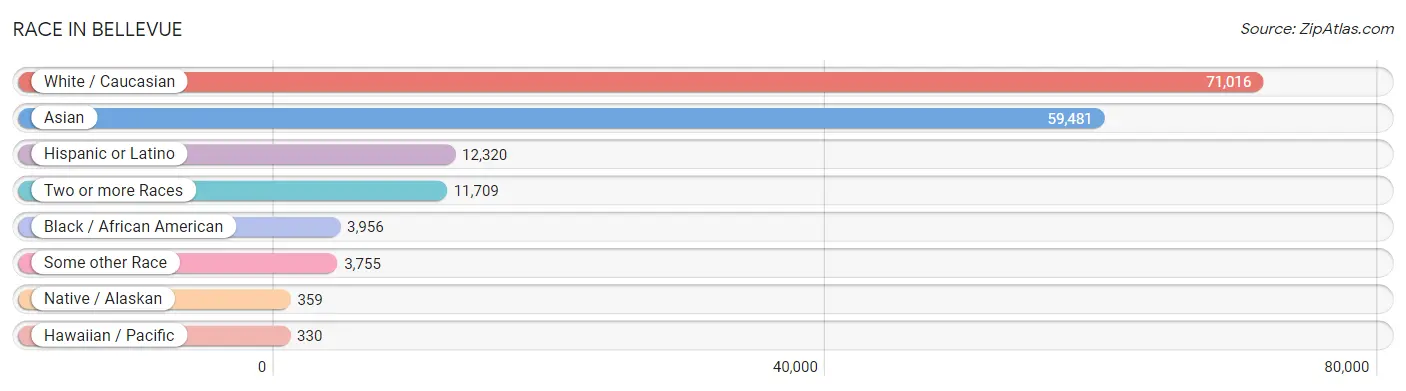
| Race | # Population | % Population |
| Asian | 59,481 | 39.5% |
| Black / African American | 3,956 | 2.6% |
| Hawaiian / Pacific | 330 | 0.2% |
| Hispanic or Latino | 12,320 | 8.2% |
| Native / Alaskan | 359 | 0.2% |
| White / Caucasian | 71,016 | 47.1% |
| Two or more Races | 11,709 | 7.8% |
| Some other Race | 3,755 | 2.5% |
| Total | 150,606 | 100.0% |
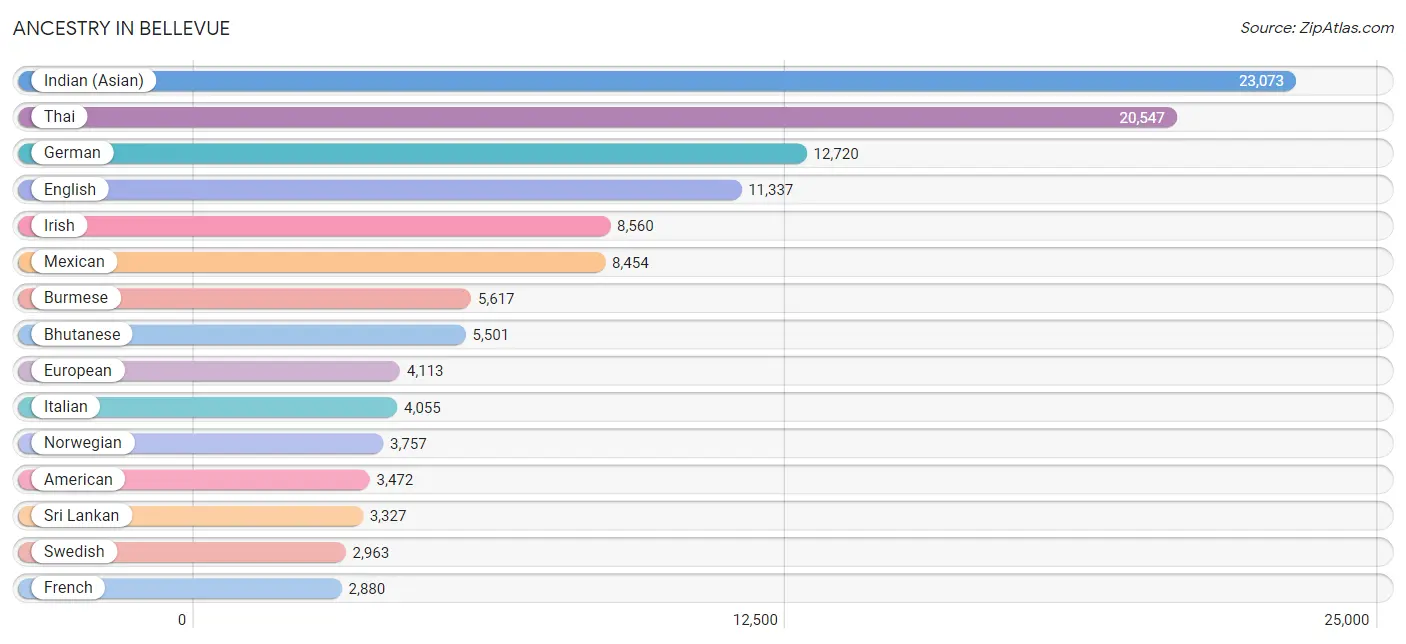
Ancestry in Bellevue
The most populous ancestries reported in Bellevue are Indian (Asian) (23,073 | 15.3%), Thai (20,547 | 13.6%), German (12,720 | 8.5%), English (11,337 | 7.5%), and Irish (8,560 | 5.7%), together accounting for 50.6% of all Bellevue residents.
| Ancestry | # Population | % Population |
| Afghan | 21 | 0.0% |
| African | 1,234 | 0.8% |
| Alaska Native | 34 | 0.0% |
| Alaskan Athabascan | 19 | 0.0% |
| Aleut | 58 | 0.0% |
| American | 3,472 | 2.3% |
| Apache | 9 | 0.0% |
| Arab | 1,286 | 0.9% |
| Argentinean | 206 | 0.1% |
| Armenian | 298 | 0.2% |
| Assyrian / Chaldean / Syriac | 20 | 0.0% |
| Australian | 156 | 0.1% |
| Austrian | 376 | 0.3% |
| Basque | 25 | 0.0% |
| Belgian | 178 | 0.1% |
| Bhutanese | 5,501 | 3.6% |
| Blackfeet | 182 | 0.1% |
| Brazilian | 341 | 0.2% |
| British | 1,500 | 1.0% |
| Bulgarian | 264 | 0.2% |
| Burmese | 5,617 | 3.7% |
| Cajun | 55 | 0.0% |
| Cambodian | 30 | 0.0% |
| Canadian | 877 | 0.6% |
| Celtic | 15 | 0.0% |
| Central American | 1,033 | 0.7% |
| Central American Indian | 145 | 0.1% |
| Cherokee | 240 | 0.2% |
| Chickasaw | 20 | 0.0% |
| Chilean | 154 | 0.1% |
| Chinese | 15 | 0.0% |
| Chippewa | 26 | 0.0% |
| Choctaw | 27 | 0.0% |
| Colombian | 299 | 0.2% |
| Colville | 53 | 0.0% |
| Costa Rican | 86 | 0.1% |
| Cree | 69 | 0.1% |
| Croatian | 185 | 0.1% |
| Crow | 10 | 0.0% |
| Cuban | 354 | 0.2% |
| Czech | 493 | 0.3% |
| Czechoslovakian | 25 | 0.0% |
| Danish | 1,127 | 0.7% |
| Dominican | 11 | 0.0% |
| Dutch | 1,471 | 1.0% |
| Eastern European | 443 | 0.3% |
| Ecuadorian | 149 | 0.1% |
| Egyptian | 392 | 0.3% |
| English | 11,337 | 7.5% |
| Estonian | 51 | 0.0% |
| Ethiopian | 360 | 0.2% |
| European | 4,113 | 2.7% |
| Filipino | 1,966 | 1.3% |
| Finnish | 293 | 0.2% |
| French | 2,880 | 1.9% |
| French American Indian | 14 | 0.0% |
| French Canadian | 359 | 0.2% |
| German | 12,720 | 8.5% |
| Ghanaian | 68 | 0.1% |
| Greek | 281 | 0.2% |
| Guamanian / Chamorro | 177 | 0.1% |
| Guatemalan | 347 | 0.2% |
| Guyanese | 37 | 0.0% |
| Haitian | 32 | 0.0% |
| Honduran | 245 | 0.2% |
| Hungarian | 594 | 0.4% |
| Icelander | 85 | 0.1% |
| Indian (Asian) | 23,073 | 15.3% |
| Inupiat | 34 | 0.0% |
| Iranian | 877 | 0.6% |
| Iraqi | 23 | 0.0% |
| Irish | 8,560 | 5.7% |
| Israeli | 153 | 0.1% |
| Italian | 4,055 | 2.7% |
| Jamaican | 321 | 0.2% |
| Japanese | 237 | 0.2% |
| Jordanian | 44 | 0.0% |
| Kenyan | 37 | 0.0% |
| Korean | 2,247 | 1.5% |
| Laotian | 343 | 0.2% |
| Latvian | 179 | 0.1% |
| Lebanese | 101 | 0.1% |
| Lithuanian | 320 | 0.2% |
| Luxembourger | 26 | 0.0% |
| Macedonian | 9 | 0.0% |
| Malaysian | 273 | 0.2% |
| Maltese | 34 | 0.0% |
| Menominee | 24 | 0.0% |
| Mexican | 8,454 | 5.6% |
| Mexican American Indian | 24 | 0.0% |
| Mongolian | 104 | 0.1% |
| Moroccan | 378 | 0.3% |
| Native Hawaiian | 227 | 0.2% |
| Navajo | 13 | 0.0% |
| New Zealander | 11 | 0.0% |
| Nicaraguan | 35 | 0.0% |
| Nigerian | 62 | 0.0% |
| Northern European | 508 | 0.3% |
| Norwegian | 3,757 | 2.5% |
| Okinawan | 26 | 0.0% |
| Pakistani | 799 | 0.5% |
| Palestinian | 14 | 0.0% |
| Panamanian | 24 | 0.0% |
| Pennsylvania German | 59 | 0.0% |
| Peruvian | 79 | 0.1% |
| Polish | 2,366 | 1.6% |
| Portuguese | 648 | 0.4% |
| Pueblo | 16 | 0.0% |
| Puerto Rican | 420 | 0.3% |
| Puget Sound Salish | 31 | 0.0% |
| Romanian | 1,208 | 0.8% |
| Russian | 2,499 | 1.7% |
| Salvadoran | 296 | 0.2% |
| Samoan | 91 | 0.1% |
| Scandinavian | 750 | 0.5% |
| Scotch-Irish | 1,377 | 0.9% |
| Scottish | 2,384 | 1.6% |
| Serbian | 174 | 0.1% |
| Sioux | 61 | 0.0% |
| Slavic | 39 | 0.0% |
| Slovak | 153 | 0.1% |
| Slovene | 57 | 0.0% |
| Somali | 134 | 0.1% |
| South African | 26 | 0.0% |
| South American | 1,040 | 0.7% |
| South American Indian | 49 | 0.0% |
| Spaniard | 286 | 0.2% |
| Spanish | 271 | 0.2% |
| Spanish American | 16 | 0.0% |
| Sri Lankan | 3,327 | 2.2% |
| Subsaharan African | 2,117 | 1.4% |
| Sudanese | 37 | 0.0% |
| Swedish | 2,963 | 2.0% |
| Swiss | 473 | 0.3% |
| Syrian | 13 | 0.0% |
| Thai | 20,547 | 13.6% |
| Tlingit-Haida | 18 | 0.0% |
| Tongan | 12 | 0.0% |
| Trinidadian and Tobagonian | 7 | 0.0% |
| Tsimshian | 5 | 0.0% |
| Turkish | 363 | 0.2% |
| Ugandan | 8 | 0.0% |
| Ukrainian | 1,134 | 0.7% |
| Uruguayan | 42 | 0.0% |
| Venezuelan | 105 | 0.1% |
| Vietnamese | 109 | 0.1% |
| Welsh | 718 | 0.5% |
| West Indian | 84 | 0.1% |
| Yugoslavian | 797 | 0.5% |
| Yup'ik | 1 | 0.0% | View All 150 Rows |
Immigrants in Bellevue
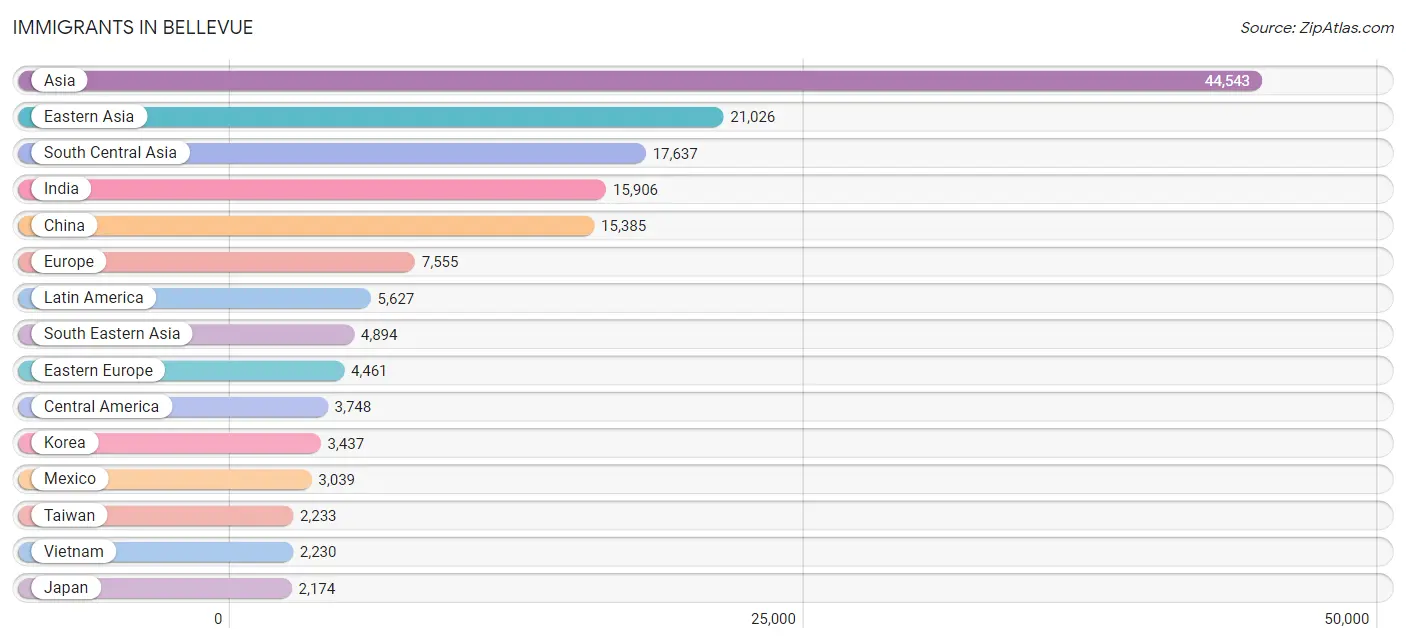
The most numerous immigrant groups reported in Bellevue came from Asia (44,543 | 29.6%), Eastern Asia (21,026 | 14.0%), South Central Asia (17,637 | 11.7%), India (15,906 | 10.6%), and China (15,385 | 10.2%), together accounting for 76.0% of all Bellevue residents.
| Immigration Origin | # Population | % Population |
| Afghanistan | 43 | 0.0% |
| Africa | 1,336 | 0.9% |
| Argentina | 139 | 0.1% |
| Armenia | 25 | 0.0% |
| Asia | 44,543 | 29.6% |
| Australia | 193 | 0.1% |
| Austria | 14 | 0.0% |
| Bangladesh | 101 | 0.1% |
| Belarus | 198 | 0.1% |
| Belgium | 134 | 0.1% |
| Bosnia and Herzegovina | 541 | 0.4% |
| Brazil | 551 | 0.4% |
| Bulgaria | 213 | 0.1% |
| Cambodia | 140 | 0.1% |
| Canada | 1,968 | 1.3% |
| Caribbean | 355 | 0.2% |
| Central America | 3,748 | 2.5% |
| Chile | 110 | 0.1% |
| China | 15,385 | 10.2% |
| Colombia | 331 | 0.2% |
| Costa Rica | 15 | 0.0% |
| Croatia | 33 | 0.0% |
| Cuba | 62 | 0.0% |
| Czechoslovakia | 131 | 0.1% |
| Denmark | 29 | 0.0% |
| Eastern Africa | 480 | 0.3% |
| Eastern Asia | 21,026 | 14.0% |
| Eastern Europe | 4,461 | 3.0% |
| Ecuador | 123 | 0.1% |
| Egypt | 213 | 0.1% |
| El Salvador | 224 | 0.2% |
| England | 286 | 0.2% |
| Ethiopia | 204 | 0.1% |
| Europe | 7,555 | 5.0% |
| Fiji | 29 | 0.0% |
| France | 675 | 0.4% |
| Germany | 403 | 0.3% |
| Ghana | 14 | 0.0% |
| Greece | 30 | 0.0% |
| Guatemala | 317 | 0.2% |
| Guyana | 53 | 0.0% |
| Haiti | 10 | 0.0% |
| Honduras | 127 | 0.1% |
| Hong Kong | 1,298 | 0.9% |
| Hungary | 108 | 0.1% |
| India | 15,906 | 10.6% |
| Indonesia | 261 | 0.2% |
| Iran | 797 | 0.5% |
| Iraq | 53 | 0.0% |
| Ireland | 132 | 0.1% |
| Israel | 307 | 0.2% |
| Italy | 104 | 0.1% |
| Jamaica | 283 | 0.2% |
| Japan | 2,174 | 1.4% |
| Jordan | 50 | 0.0% |
| Kazakhstan | 13 | 0.0% |
| Kenya | 86 | 0.1% |
| Korea | 3,437 | 2.3% |
| Kuwait | 14 | 0.0% |
| Laos | 117 | 0.1% |
| Latin America | 5,627 | 3.7% |
| Latvia | 86 | 0.1% |
| Lebanon | 45 | 0.0% |
| Liberia | 4 | 0.0% |
| Malaysia | 340 | 0.2% |
| Mexico | 3,039 | 2.0% |
| Middle Africa | 62 | 0.0% |
| Moldova | 127 | 0.1% |
| Morocco | 269 | 0.2% |
| Nepal | 326 | 0.2% |
| Netherlands | 60 | 0.0% |
| Nicaragua | 15 | 0.0% |
| Nigeria | 107 | 0.1% |
| Northern Africa | 502 | 0.3% |
| Northern Europe | 1,433 | 0.9% |
| Norway | 93 | 0.1% |
| Oceania | 290 | 0.2% |
| Pakistan | 348 | 0.2% |
| Panama | 11 | 0.0% |
| Peru | 37 | 0.0% |
| Philippines | 815 | 0.5% |
| Poland | 149 | 0.1% |
| Portugal | 116 | 0.1% |
| Romania | 857 | 0.6% |
| Russia | 1,182 | 0.8% |
| Saudi Arabia | 15 | 0.0% |
| Scotland | 38 | 0.0% |
| Serbia | 57 | 0.0% |
| Singapore | 201 | 0.1% |
| Somalia | 21 | 0.0% |
| South Africa | 128 | 0.1% |
| South America | 1,524 | 1.0% |
| South Central Asia | 17,637 | 11.7% |
| South Eastern Asia | 4,894 | 3.3% |
| Southern Europe | 287 | 0.2% |
| Spain | 37 | 0.0% |
| Sudan | 10 | 0.0% |
| Sweden | 71 | 0.1% |
| Switzerland | 66 | 0.0% |
| Taiwan | 2,233 | 1.5% |
| Thailand | 668 | 0.4% |
| Turkey | 201 | 0.1% |
| Uganda | 38 | 0.0% |
| Ukraine | 620 | 0.4% |
| Uruguay | 42 | 0.0% |
| Uzbekistan | 66 | 0.0% |
| Venezuela | 138 | 0.1% |
| Vietnam | 2,230 | 1.5% |
| Western Africa | 152 | 0.1% |
| Western Asia | 910 | 0.6% |
| Western Europe | 1,374 | 0.9% |
| Yemen | 17 | 0.0% |
| Zaire | 62 | 0.0% |
| Zimbabwe | 10 | 0.0% | View All 114 Rows |
Sex and Age in Bellevue
Sex and Age in Bellevue
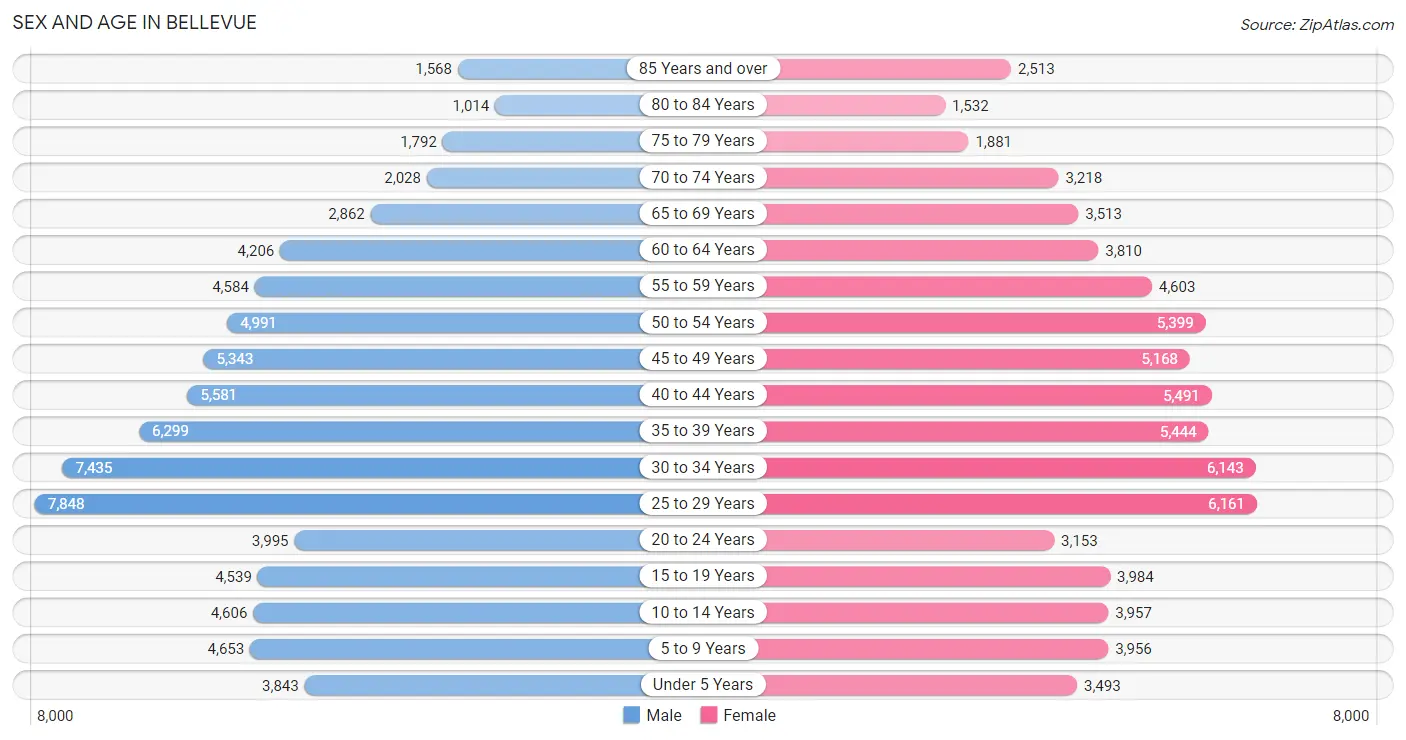
The most populous age groups in Bellevue are 25 to 29 Years (7,848 | 10.2%) for men and 25 to 29 Years (6,161 | 8.4%) for women.
| Age Bracket | Male | Female |
| Under 5 Years | 3,843 (5.0%) | 3,493 (4.8%) |
| 5 to 9 Years | 4,653 (6.0%) | 3,956 (5.4%) |
| 10 to 14 Years | 4,606 (6.0%) | 3,957 (5.4%) |
| 15 to 19 Years | 4,539 (5.9%) | 3,984 (5.4%) |
| 20 to 24 Years | 3,995 (5.2%) | 3,153 (4.3%) |
| 25 to 29 Years | 7,848 (10.2%) | 6,161 (8.4%) |
| 30 to 34 Years | 7,435 (9.6%) | 6,143 (8.4%) |
| 35 to 39 Years | 6,299 (8.2%) | 5,444 (7.4%) |
| 40 to 44 Years | 5,581 (7.2%) | 5,491 (7.5%) |
| 45 to 49 Years | 5,343 (6.9%) | 5,168 (7.0%) |
| 50 to 54 Years | 4,991 (6.5%) | 5,399 (7.3%) |
| 55 to 59 Years | 4,584 (5.9%) | 4,603 (6.3%) |
| 60 to 64 Years | 4,206 (5.4%) | 3,810 (5.2%) |
| 65 to 69 Years | 2,862 (3.7%) | 3,513 (4.8%) |
| 70 to 74 Years | 2,028 (2.6%) | 3,218 (4.4%) |
| 75 to 79 Years | 1,792 (2.3%) | 1,881 (2.6%) |
| 80 to 84 Years | 1,014 (1.3%) | 1,532 (2.1%) |
| 85 Years and over | 1,568 (2.0%) | 2,513 (3.4%) |
| Total | 77,187 (100.0%) | 73,419 (100.0%) |
Families and Households in Bellevue
Median Family Size in Bellevue
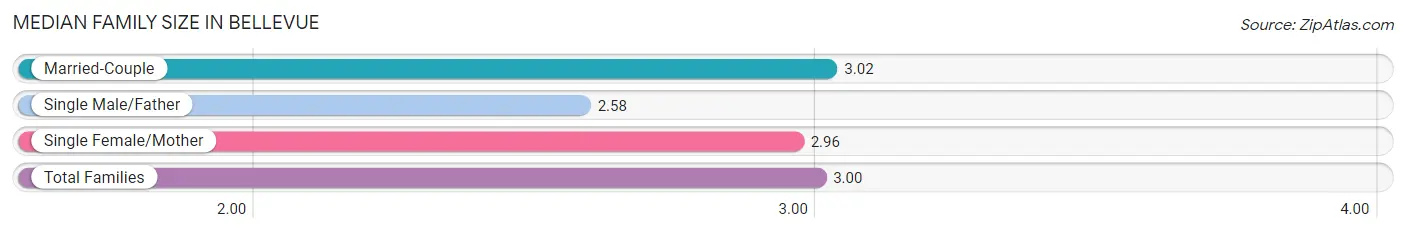
The median family size in Bellevue is 3.00 persons per family, with married-couple families (33,612 | 85.9%) accounting for the largest median family size of 3.02 persons per family. On the other hand, single male/father families (1,594 | 4.1%) represent the smallest median family size with 2.58 persons per family.
| Family Type | # Families | Family Size |
| Married-Couple | 33,612 (85.9%) | 3.02 |
| Single Male/Father | 1,594 (4.1%) | 2.58 |
| Single Female/Mother | 3,912 (10.0%) | 2.96 |
| Total Families | 39,118 (100.0%) | 3.00 |
Median Household Size in Bellevue
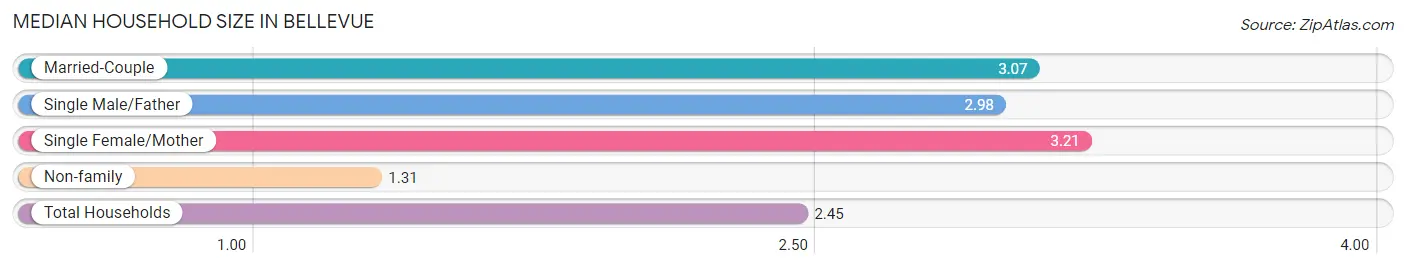
The median household size in Bellevue is 2.45 persons per household, with single female/mother households (3,912 | 6.4%) accounting for the largest median household size of 3.21 persons per household. non-family households (21,764 | 35.7%) represent the smallest median household size with 1.31 persons per household.
| Household Type | # Households | Household Size |
| Married-Couple | 33,612 (55.2%) | 3.07 |
| Single Male/Father | 1,594 (2.6%) | 2.98 |
| Single Female/Mother | 3,912 (6.4%) | 3.21 |
| Non-family | 21,764 (35.7%) | 1.31 |
| Total Households | 60,882 (100.0%) | 2.45 |
Household Size by Marriage Status in Bellevue
Out of a total of 60,882 households in Bellevue, 39,118 (64.2%) are family households, while 21,764 (35.7%) are nonfamily households. The most numerous type of family households are 2-person households, comprising 16,955, and the most common type of nonfamily households are 1-person households, comprising 16,908.
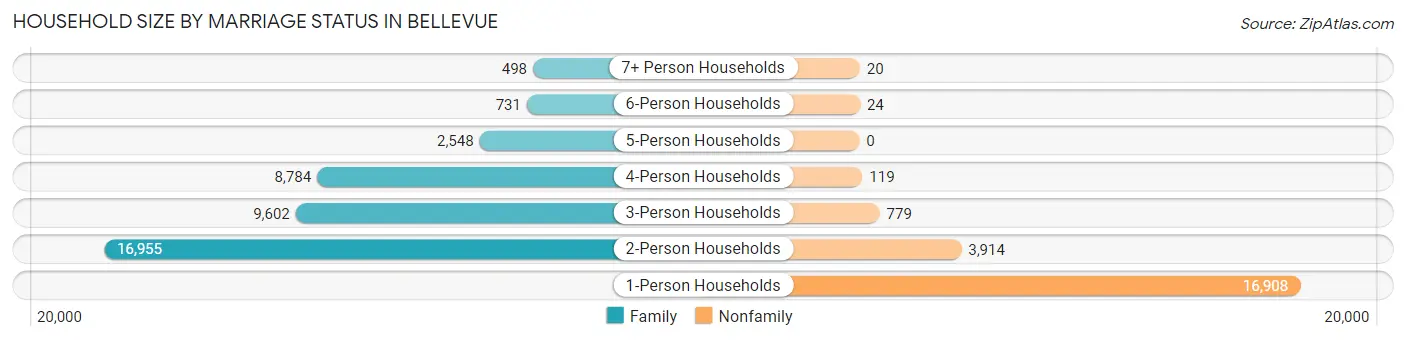
| Household Size | Family Households | Nonfamily Households |
| 1-Person Households | - | 16,908 (27.8%) |
| 2-Person Households | 16,955 (27.9%) | 3,914 (6.4%) |
| 3-Person Households | 9,602 (15.8%) | 779 (1.3%) |
| 4-Person Households | 8,784 (14.4%) | 119 (0.2%) |
| 5-Person Households | 2,548 (4.2%) | 0 (0.0%) |
| 6-Person Households | 731 (1.2%) | 24 (0.0%) |
| 7+ Person Households | 498 (0.8%) | 20 (0.0%) |
| Total | 39,118 (64.2%) | 21,764 (35.7%) |
Female Fertility in Bellevue
Fertility by Age in Bellevue
Average fertility rate in Bellevue is 41.0 births per 1,000 women. Women in the age bracket of 20 to 34 years have the highest fertility rate with 48.0 births per 1,000 women. Women in the age bracket of 35 to 50 years acount for 50.2% of all women with births.
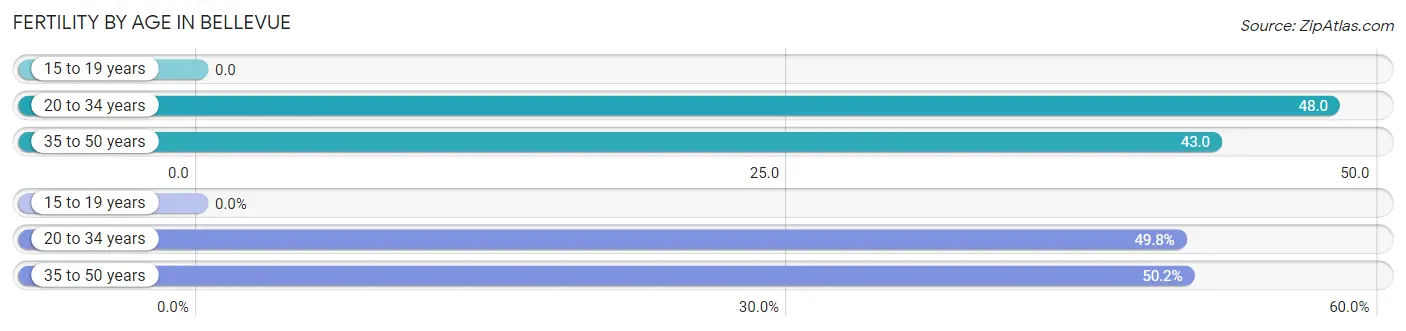
| Age Bracket | Women with Births | Births / 1,000 Women |
| 15 to 19 years | 0 (0.0%) | 0.0 |
| 20 to 34 years | 743 (49.8%) | 48.0 |
| 35 to 50 years | 749 (50.2%) | 43.0 |
| Total | 1,492 (100.0%) | 41.0 |
Fertility by Age by Marriage Status in Bellevue
94.9% of women with births (1,492) in Bellevue are married. The highest percentage of unmarried women with births falls into 35 to 50 years age bracket with 5.3% of them unmarried at the time of birth, while the lowest percentage of unmarried women with births belong to 20 to 34 years age bracket with 4.8% of them unmarried.
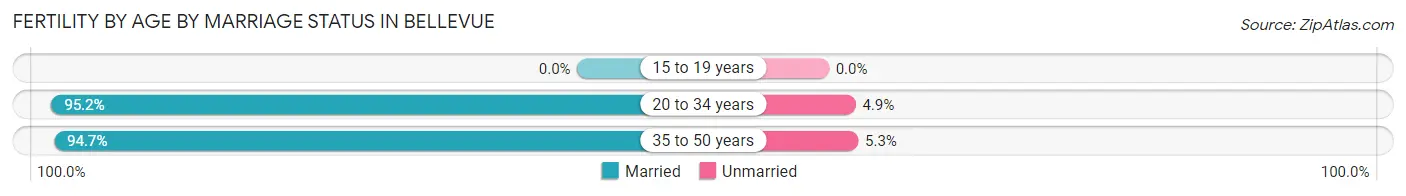
| Age Bracket | Married | Unmarried |
| 15 to 19 years | 0 (0.0%) | 0 (0.0%) |
| 20 to 34 years | 707 (95.2%) | 36 (4.9%) |
| 35 to 50 years | 709 (94.7%) | 40 (5.3%) |
| Total | 1,416 (94.9%) | 76 (5.1%) |
Fertility by Education in Bellevue
Average fertility rate in Bellevue is 41.0 births per 1,000 women. Women with the education attainment of graduate degree have the highest fertility rate of 56.0 births per 1,000 women, while women with the education attainment of less than high school have the lowest fertility at 10.0 births per 1,000 women. Women with the education attainment of graduate degree represent 43.6% of all women with births.
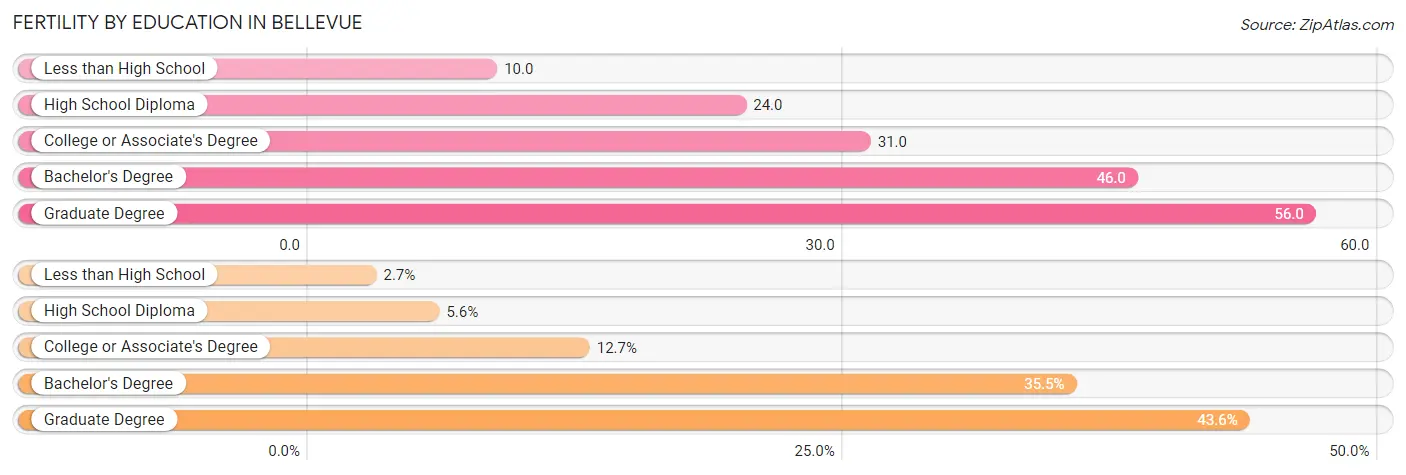
| Educational Attainment | Women with Births | Births / 1,000 Women |
| Less than High School | 40 (2.7%) | 10.0 |
| High School Diploma | 84 (5.6%) | 24.0 |
| College or Associate's Degree | 189 (12.7%) | 31.0 |
| Bachelor's Degree | 529 (35.5%) | 46.0 |
| Graduate Degree | 650 (43.6%) | 56.0 |
| Total | 1,492 (100.0%) | 41.0 |
Fertility by Education by Marriage Status in Bellevue
5.1% of women with births in Bellevue are unmarried. Women with the educational attainment of bachelor's degree are most likely to be married with 100.0% of them married at childbirth, while women with the educational attainment of college or associate's degree are least likely to be married with 38.6% of them unmarried at childbirth.
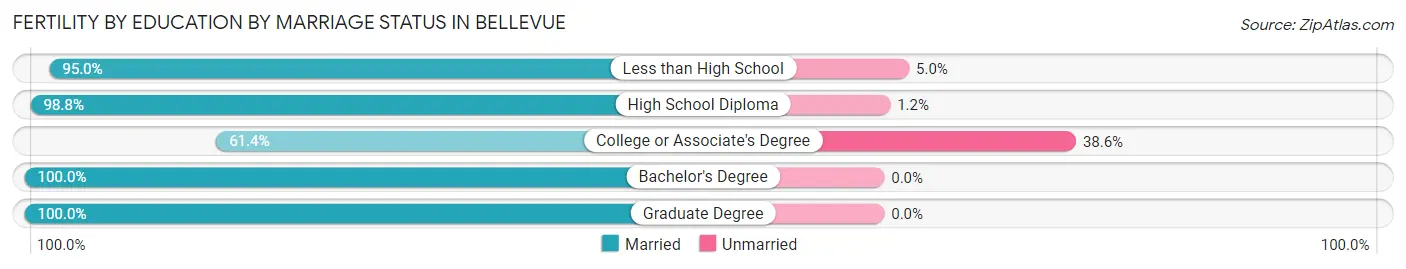
| Educational Attainment | Married | Unmarried |
| Less than High School | 38 (95.0%) | 2 (5.0%) |
| High School Diploma | 83 (98.8%) | 1 (1.2%) |
| College or Associate's Degree | 116 (61.4%) | 73 (38.6%) |
| Bachelor's Degree | 529 (100.0%) | 0 (0.0%) |
| Graduate Degree | 650 (100.0%) | 0 (0.0%) |
| Total | 1,416 (94.9%) | 76 (5.1%) |
Employment Characteristics in Bellevue
Employment by Class of Employer in Bellevue
Among the 78,311 employed individuals in Bellevue, private company employees (59,658 | 76.2%), not-for-profit organizations (5,045 | 6.4%), and self-employed (incorporated) (4,010 | 5.1%) make up the most common classes of employment.
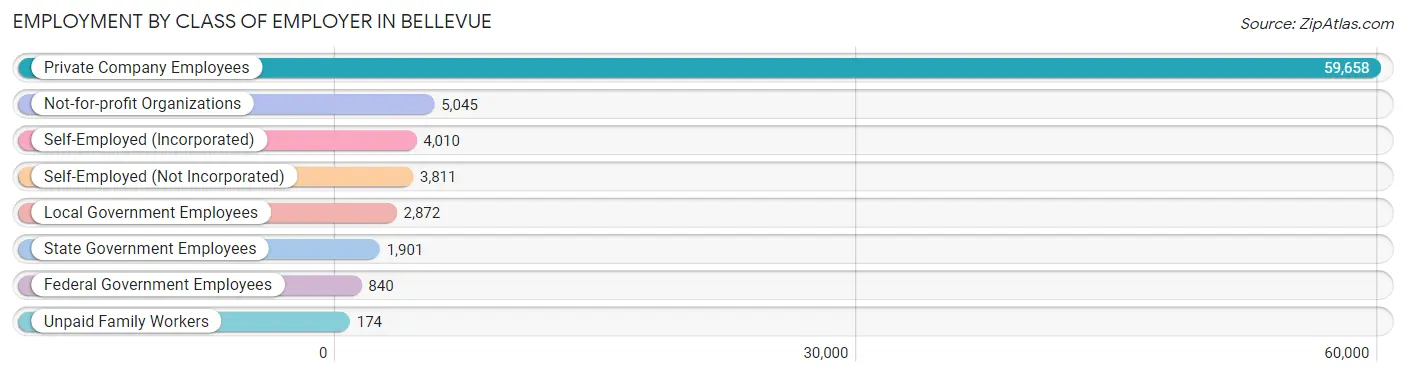
| Employer Class | # Employees | % Employees |
| Private Company Employees | 59,658 | 76.2% |
| Self-Employed (Incorporated) | 4,010 | 5.1% |
| Self-Employed (Not Incorporated) | 3,811 | 4.9% |
| Not-for-profit Organizations | 5,045 | 6.4% |
| Local Government Employees | 2,872 | 3.7% |
| State Government Employees | 1,901 | 2.4% |
| Federal Government Employees | 840 | 1.1% |
| Unpaid Family Workers | 174 | 0.2% |
| Total | 78,311 | 100.0% |
Employment Status by Age in Bellevue
According to the labor force statistics for Bellevue, out of the total population over 16 years of age (124,180), 66.6% or 82,704 individuals are in the labor force, with 4.0% or 3,308 of them unemployed. The age group with the highest labor force participation rate is 25 to 29 years, with 87.6% or 12,272 individuals in the labor force. Within the labor force, the 16 to 19 years age range has the highest percentage of unemployed individuals, with 11.2% or 188 of them being unemployed.
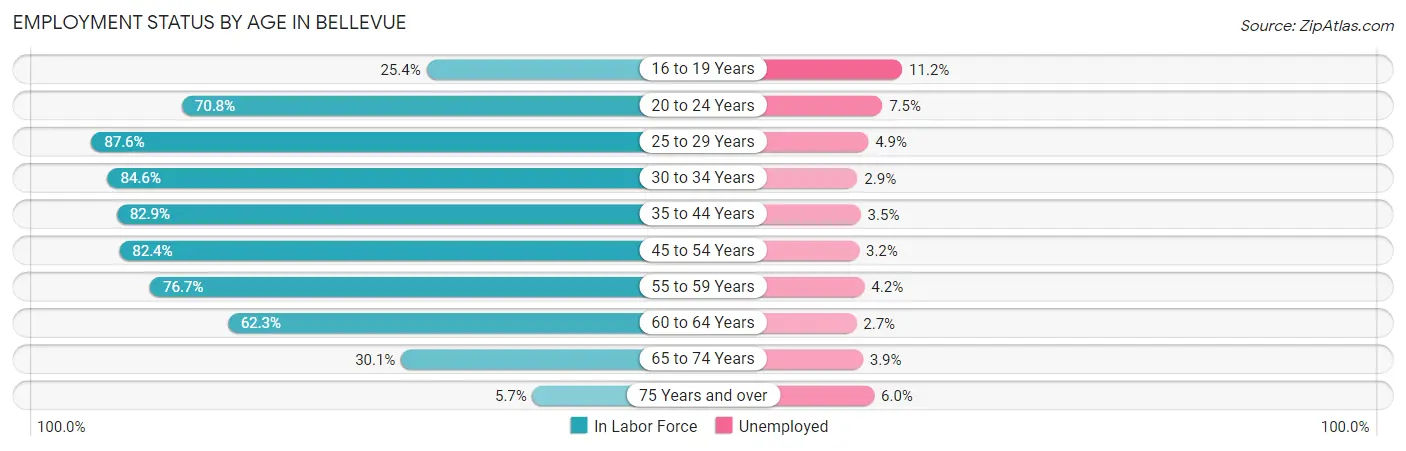
| Age Bracket | In Labor Force | Unemployed |
| 16 to 19 Years | 1,678 (25.4%) | 188 (11.2%) |
| 20 to 24 Years | 5,061 (70.8%) | 380 (7.5%) |
| 25 to 29 Years | 12,272 (87.6%) | 601 (4.9%) |
| 30 to 34 Years | 11,487 (84.6%) | 333 (2.9%) |
| 35 to 44 Years | 18,914 (82.9%) | 662 (3.5%) |
| 45 to 54 Years | 17,222 (82.4%) | 551 (3.2%) |
| 55 to 59 Years | 7,046 (76.7%) | 296 (4.2%) |
| 60 to 64 Years | 4,994 (62.3%) | 135 (2.7%) |
| 65 to 74 Years | 3,498 (30.1%) | 136 (3.9%) |
| 75 Years and over | 587 (5.7%) | 35 (6.0%) |
| Total | 82,704 (66.6%) | 3,308 (4.0%) |
Employment Status by Educational Attainment in Bellevue
According to labor force statistics for Bellevue, 81.3% of individuals (71,955) out of the total population between 25 and 64 years of age (88,506) are in the labor force, with 3.6% or 2,590 of them being unemployed. The group with the highest labor force participation rate are those with the educational attainment of bachelor's degree or higher, with 84.6% or 54,339 individuals in the labor force. Within the labor force, individuals with college / associate degree education have the highest percentage of unemployment, with 7.8% or 810 of them being unemployed.
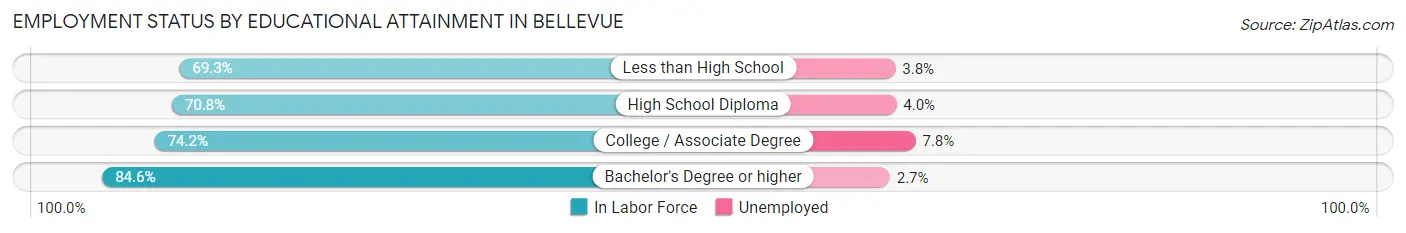
| Educational Attainment | In Labor Force | Unemployed |
| Less than High School | 2,367 (69.3%) | 130 (3.8%) |
| High School Diploma | 4,865 (70.8%) | 275 (4.0%) |
| College / Associate Degree | 10,379 (74.2%) | 1,091 (7.8%) |
| Bachelor's Degree or higher | 54,339 (84.6%) | 1,734 (2.7%) |
| Total | 71,955 (81.3%) | 3,186 (3.6%) |
Employment Occupations by Sex in Bellevue
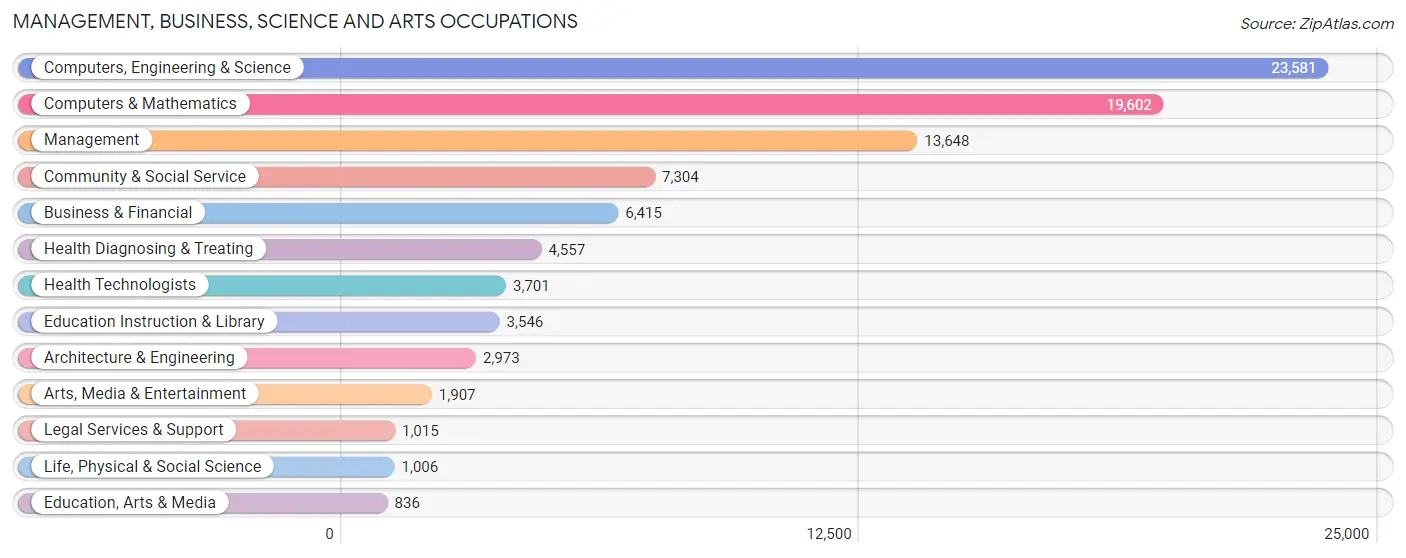
Management, Business, Science and Arts Occupations
The most common Management, Business, Science and Arts occupations in Bellevue are Computers, Engineering & Science (23,581 | 29.7%), Computers & Mathematics (19,602 | 24.7%), Management (13,648 | 17.2%), Community & Social Service (7,304 | 9.2%), and Business & Financial (6,415 | 8.1%).
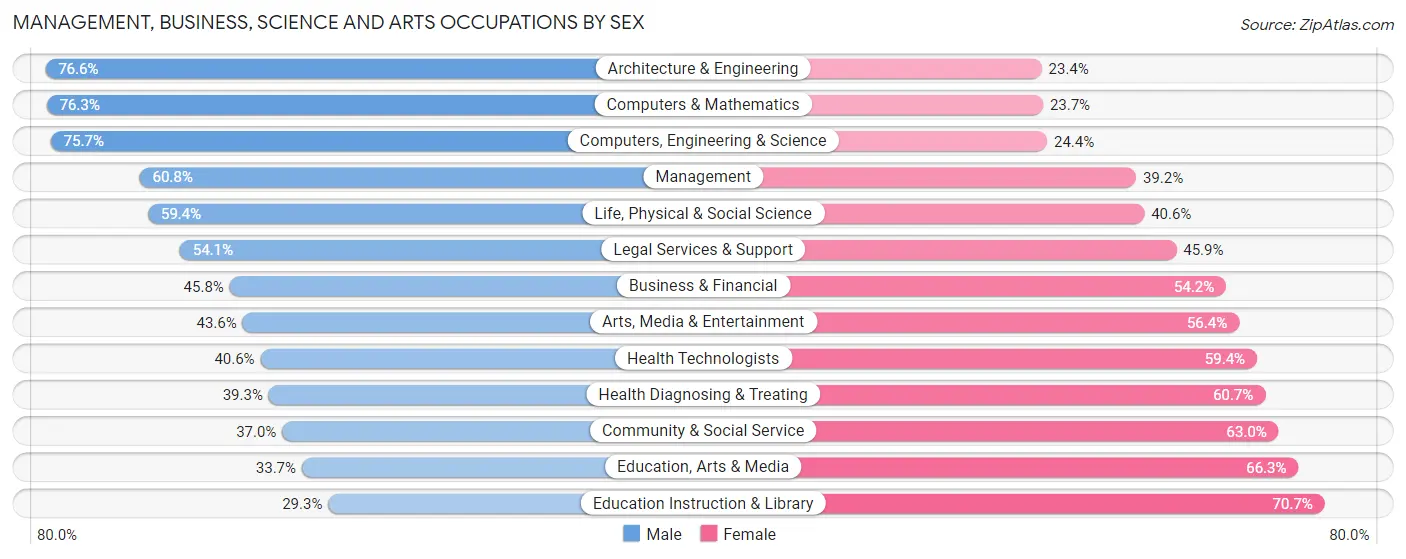
Management, Business, Science and Arts Occupations by Sex
Within the Management, Business, Science and Arts occupations in Bellevue, the most male-oriented occupations are Architecture & Engineering (76.6%), Computers & Mathematics (76.3%), and Computers, Engineering & Science (75.6%), while the most female-oriented occupations are Education Instruction & Library (70.7%), Education, Arts & Media (66.3%), and Community & Social Service (63.0%).
| Occupation | Male | Female |
| Management | 8,300 (60.8%) | 5,348 (39.2%) |
| Business & Financial | 2,937 (45.8%) | 3,478 (54.2%) |
| Computers, Engineering & Science | 17,838 (75.6%) | 5,743 (24.3%) |
| Computers & Mathematics | 14,964 (76.3%) | 4,638 (23.7%) |
| Architecture & Engineering | 2,276 (76.6%) | 697 (23.4%) |
| Life, Physical & Social Science | 598 (59.4%) | 408 (40.6%) |
| Community & Social Service | 2,703 (37.0%) | 4,601 (63.0%) |
| Education, Arts & Media | 282 (33.7%) | 554 (66.3%) |
| Legal Services & Support | 549 (54.1%) | 466 (45.9%) |
| Education Instruction & Library | 1,040 (29.3%) | 2,506 (70.7%) |
| Arts, Media & Entertainment | 832 (43.6%) | 1,075 (56.4%) |
| Health Diagnosing & Treating | 1,789 (39.3%) | 2,768 (60.7%) |
| Health Technologists | 1,504 (40.6%) | 2,197 (59.4%) |
| Total (Category) | 33,567 (60.5%) | 21,938 (39.5%) |
| Total (Overall) | 46,098 (58.1%) | 33,253 (41.9%) |
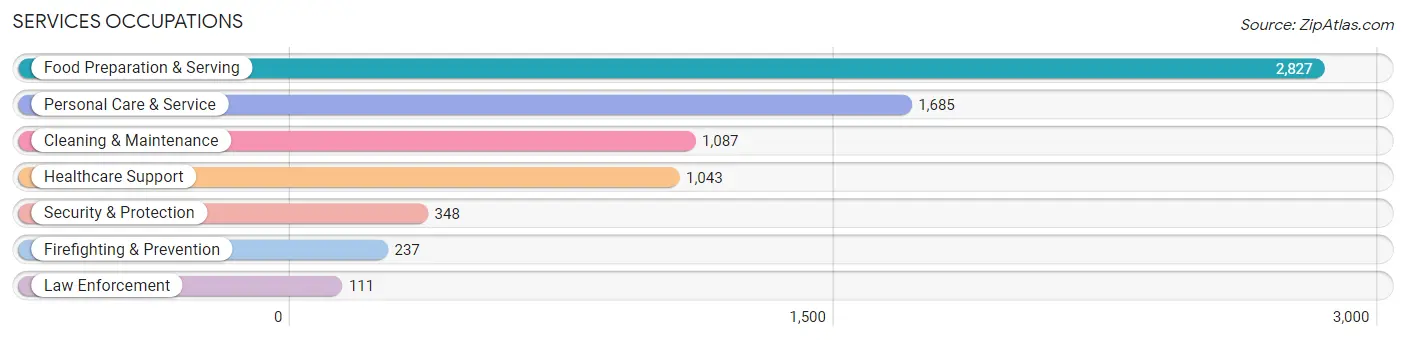
Services Occupations
The most common Services occupations in Bellevue are Food Preparation & Serving (2,827 | 3.6%), Personal Care & Service (1,685 | 2.1%), Cleaning & Maintenance (1,087 | 1.4%), Healthcare Support (1,043 | 1.3%), and Security & Protection (348 | 0.4%).
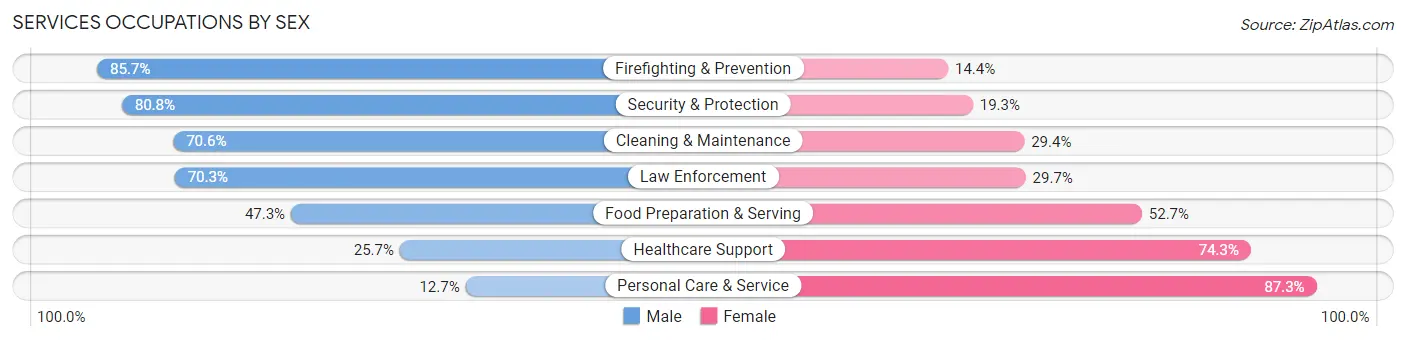
Services Occupations by Sex
Within the Services occupations in Bellevue, the most male-oriented occupations are Firefighting & Prevention (85.7%), Security & Protection (80.7%), and Cleaning & Maintenance (70.6%), while the most female-oriented occupations are Personal Care & Service (87.3%), Healthcare Support (74.3%), and Food Preparation & Serving (52.7%).
| Occupation | Male | Female |
| Healthcare Support | 268 (25.7%) | 775 (74.3%) |
| Security & Protection | 281 (80.7%) | 67 (19.3%) |
| Firefighting & Prevention | 203 (85.7%) | 34 (14.3%) |
| Law Enforcement | 78 (70.3%) | 33 (29.7%) |
| Food Preparation & Serving | 1,336 (47.3%) | 1,491 (52.7%) |
| Cleaning & Maintenance | 767 (70.6%) | 320 (29.4%) |
| Personal Care & Service | 214 (12.7%) | 1,471 (87.3%) |
| Total (Category) | 2,866 (41.0%) | 4,124 (59.0%) |
| Total (Overall) | 46,098 (58.1%) | 33,253 (41.9%) |
Sales and Office Occupations
The most common Sales and Office occupations in Bellevue are Sales & Related (6,547 | 8.3%), and Office & Administration (4,761 | 6.0%).

Sales and Office Occupations by Sex
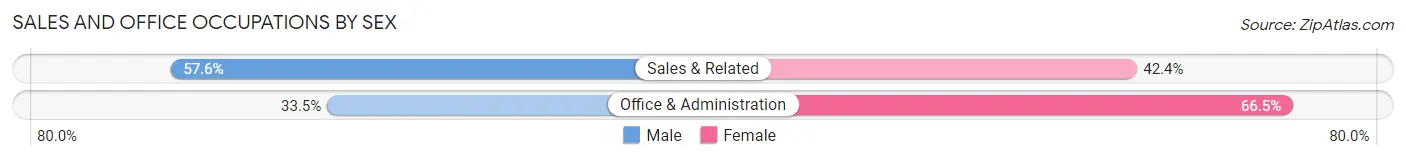
| Occupation | Male | Female |
| Sales & Related | 3,770 (57.6%) | 2,777 (42.4%) |
| Office & Administration | 1,593 (33.5%) | 3,168 (66.5%) |
| Total (Category) | 5,363 (47.4%) | 5,945 (52.6%) |
| Total (Overall) | 46,098 (58.1%) | 33,253 (41.9%) |
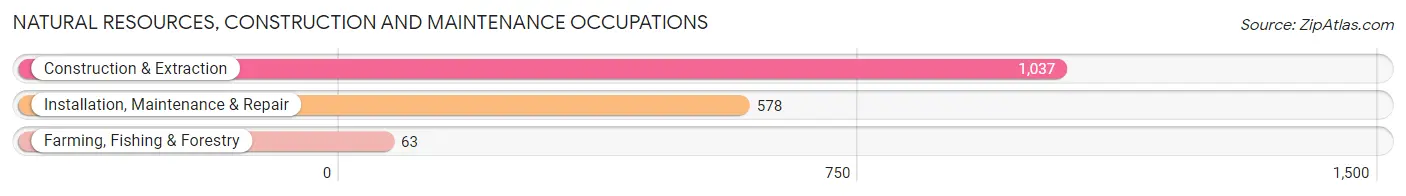
Natural Resources, Construction and Maintenance Occupations
The most common Natural Resources, Construction and Maintenance occupations in Bellevue are Construction & Extraction (1,037 | 1.3%), Installation, Maintenance & Repair (578 | 0.7%), and Farming, Fishing & Forestry (63 | 0.1%).
Natural Resources, Construction and Maintenance Occupations by Sex
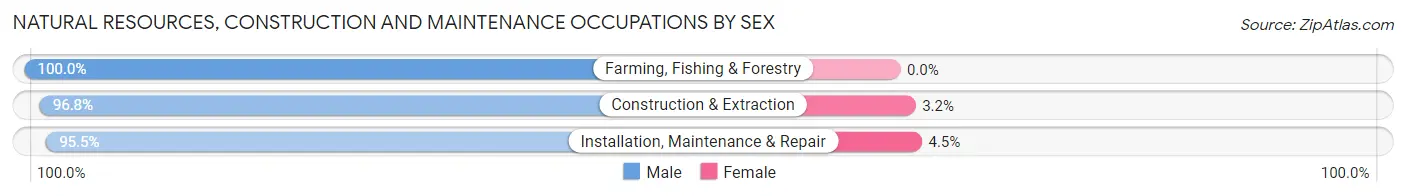
| Occupation | Male | Female |
| Farming, Fishing & Forestry | 63 (100.0%) | 0 (0.0%) |
| Construction & Extraction | 1,004 (96.8%) | 33 (3.2%) |
| Installation, Maintenance & Repair | 552 (95.5%) | 26 (4.5%) |
| Total (Category) | 1,619 (96.5%) | 59 (3.5%) |
| Total (Overall) | 46,098 (58.1%) | 33,253 (41.9%) |
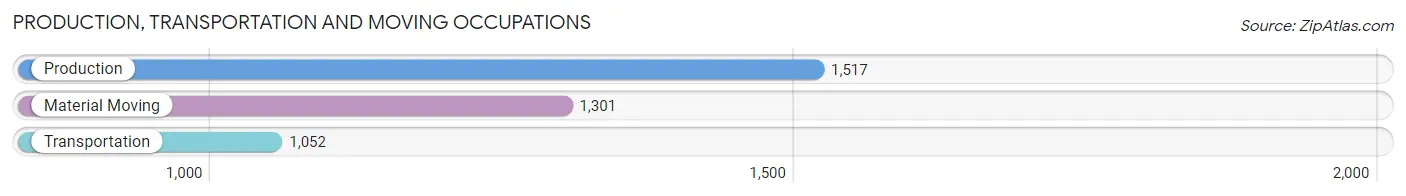
Production, Transportation and Moving Occupations
The most common Production, Transportation and Moving occupations in Bellevue are Production (1,517 | 1.9%), Material Moving (1,301 | 1.6%), and Transportation (1,052 | 1.3%).
Production, Transportation and Moving Occupations by Sex
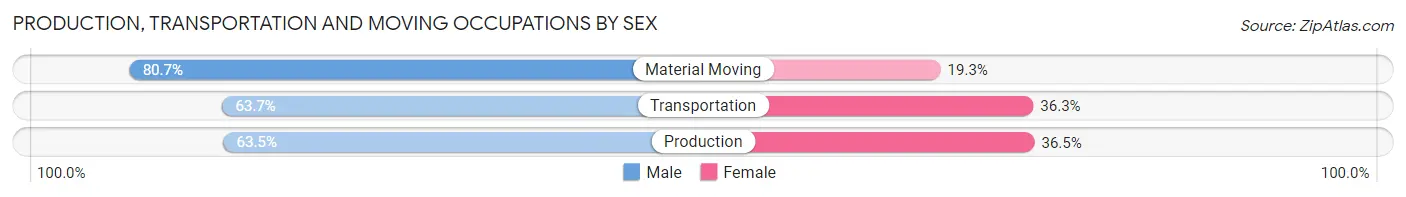
| Occupation | Male | Female |
| Production | 963 (63.5%) | 554 (36.5%) |
| Transportation | 670 (63.7%) | 382 (36.3%) |
| Material Moving | 1,050 (80.7%) | 251 (19.3%) |
| Total (Category) | 2,683 (69.3%) | 1,187 (30.7%) |
| Total (Overall) | 46,098 (58.1%) | 33,253 (41.9%) |
Employment Industries by Sex in Bellevue
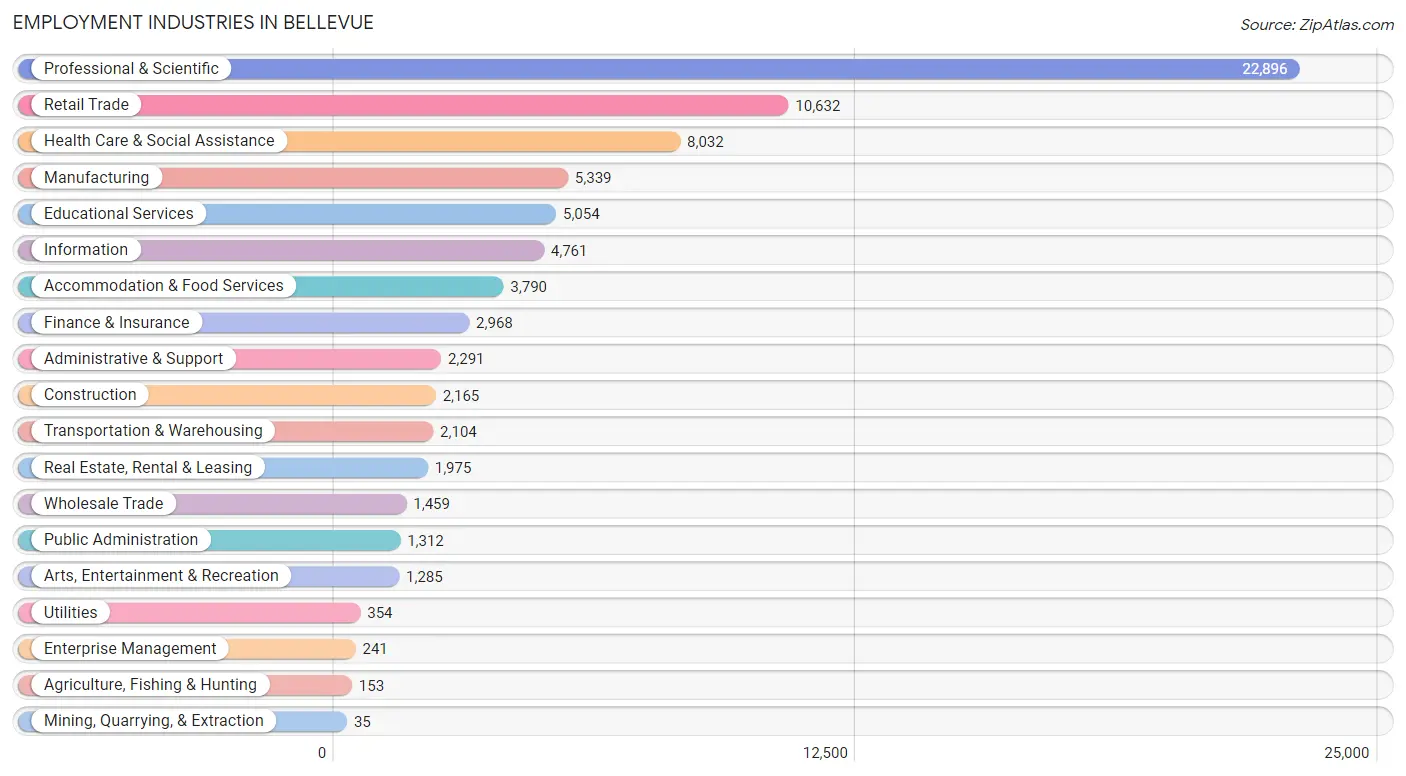
Employment Industries in Bellevue
The major employment industries in Bellevue include Professional & Scientific (22,896 | 28.8%), Retail Trade (10,632 | 13.4%), Health Care & Social Assistance (8,032 | 10.1%), Manufacturing (5,339 | 6.7%), and Educational Services (5,054 | 6.4%).
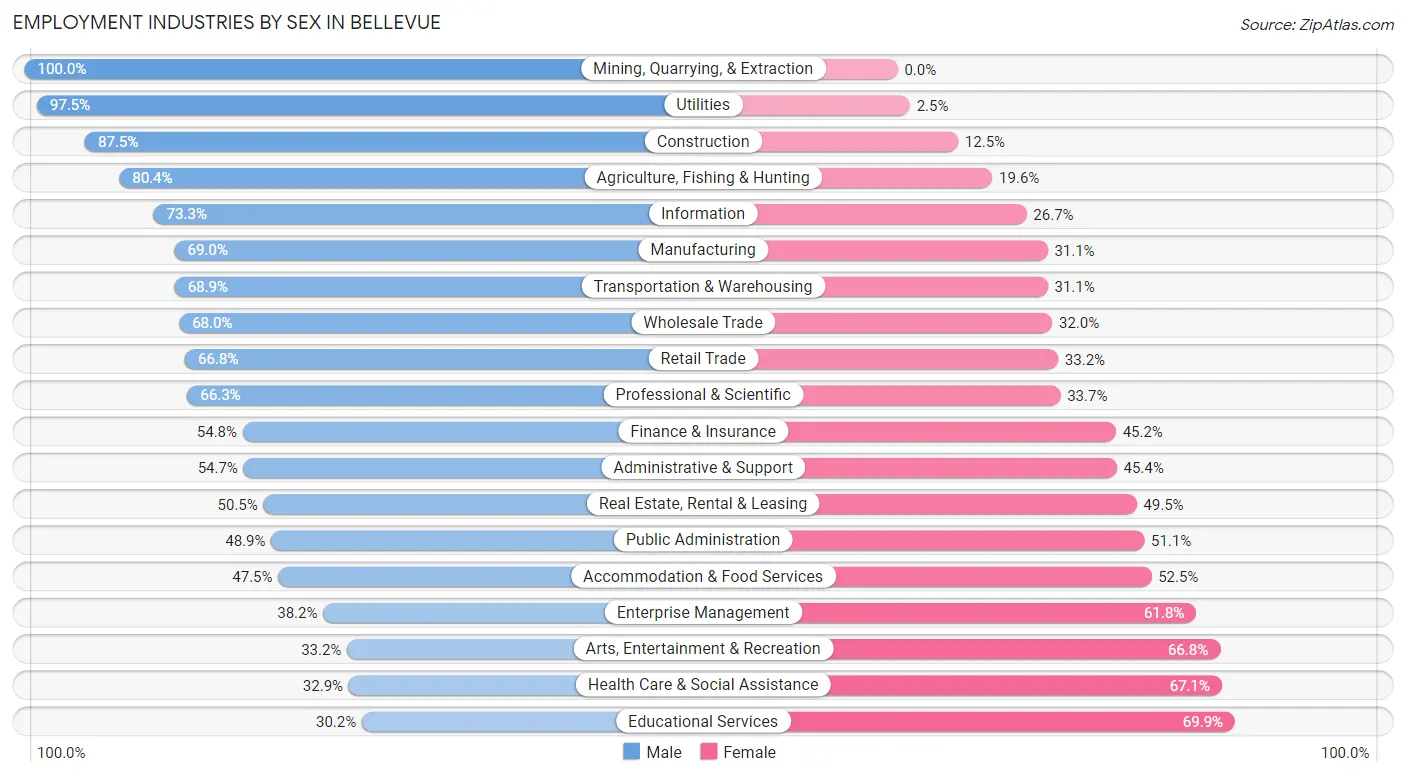
Employment Industries by Sex in Bellevue
The Bellevue industries that see more men than women are Mining, Quarrying, & Extraction (100.0%), Utilities (97.5%), and Construction (87.5%), whereas the industries that tend to have a higher number of women are Educational Services (69.9%), Health Care & Social Assistance (67.1%), and Arts, Entertainment & Recreation (66.8%).
| Industry | Male | Female |
| Agriculture, Fishing & Hunting | 123 (80.4%) | 30 (19.6%) |
| Mining, Quarrying, & Extraction | 35 (100.0%) | 0 (0.0%) |
| Construction | 1,894 (87.5%) | 271 (12.5%) |
| Manufacturing | 3,681 (69.0%) | 1,658 (31.0%) |
| Wholesale Trade | 992 (68.0%) | 467 (32.0%) |
| Retail Trade | 7,100 (66.8%) | 3,532 (33.2%) |
| Transportation & Warehousing | 1,450 (68.9%) | 654 (31.1%) |
| Utilities | 345 (97.5%) | 9 (2.5%) |
| Information | 3,490 (73.3%) | 1,271 (26.7%) |
| Finance & Insurance | 1,627 (54.8%) | 1,341 (45.2%) |
| Real Estate, Rental & Leasing | 998 (50.5%) | 977 (49.5%) |
| Professional & Scientific | 15,179 (66.3%) | 7,717 (33.7%) |
| Enterprise Management | 92 (38.2%) | 149 (61.8%) |
| Administrative & Support | 1,252 (54.6%) | 1,039 (45.4%) |
| Educational Services | 1,524 (30.1%) | 3,530 (69.9%) |
| Health Care & Social Assistance | 2,640 (32.9%) | 5,392 (67.1%) |
| Arts, Entertainment & Recreation | 427 (33.2%) | 858 (66.8%) |
| Accommodation & Food Services | 1,799 (47.5%) | 1,991 (52.5%) |
| Public Administration | 642 (48.9%) | 670 (51.1%) |
| Total | 46,098 (58.1%) | 33,253 (41.9%) |
Education in Bellevue
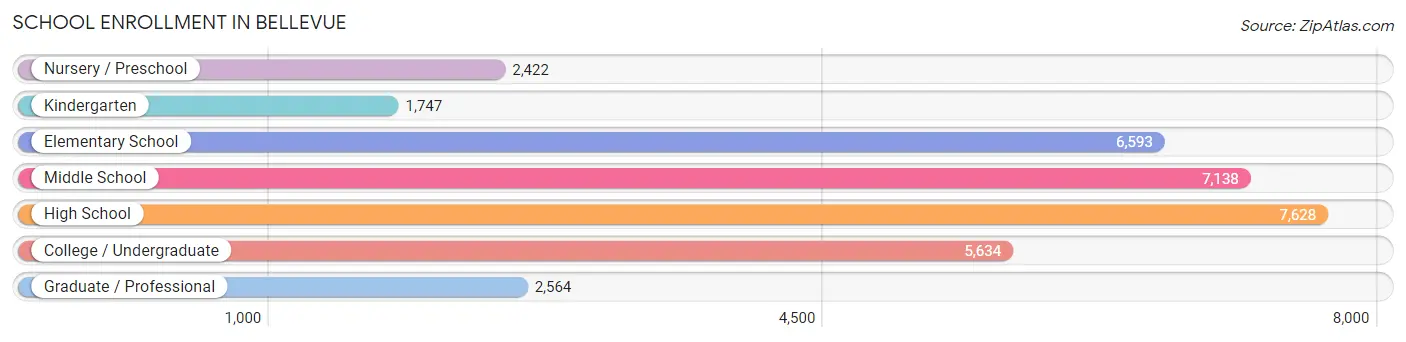
School Enrollment in Bellevue
The most common levels of schooling among the 33,726 students in Bellevue are high school (7,628 | 22.6%), middle school (7,138 | 21.2%), and elementary school (6,593 | 19.6%).
| School Level | # Students | % Students |
| Nursery / Preschool | 2,422 | 7.2% |
| Kindergarten | 1,747 | 5.2% |
| Elementary School | 6,593 | 19.6% |
| Middle School | 7,138 | 21.2% |
| High School | 7,628 | 22.6% |
| College / Undergraduate | 5,634 | 16.7% |
| Graduate / Professional | 2,564 | 7.6% |
| Total | 33,726 | 100.0% |
School Enrollment by Age by Funding Source in Bellevue
Out of a total of 33,726 students who are enrolled in schools in Bellevue, 7,150 (21.2%) attend a private institution, while the remaining 26,576 (78.8%) are enrolled in public schools. The age group of 3 to 4 year olds has the highest likelihood of being enrolled in private schools, with 1,384 (71.7% in the age bracket) enrolled. Conversely, the age group of 18 to 19 year olds has the lowest likelihood of being enrolled in a private school, with 2,379 (92.4% in the age bracket) attending a public institution.
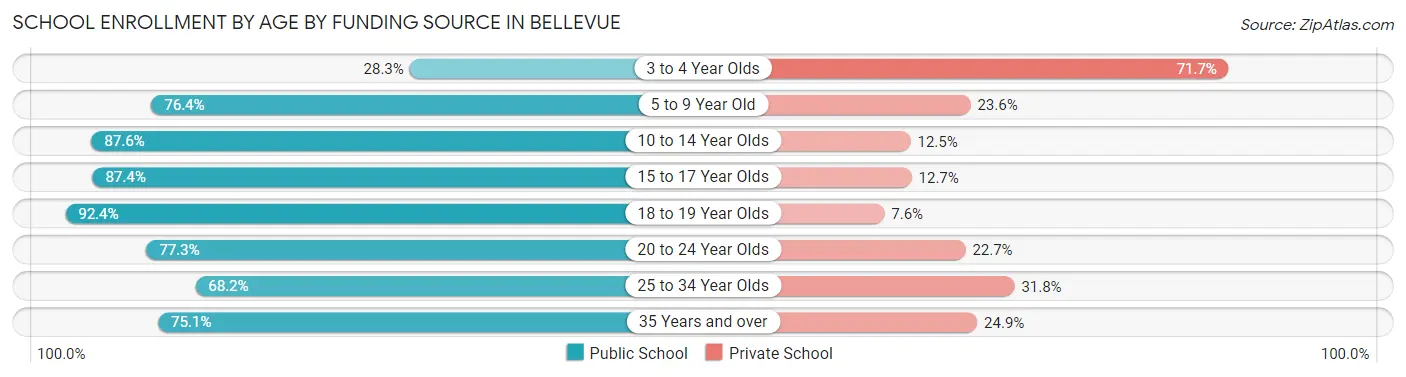
| Age Bracket | Public School | Private School |
| 3 to 4 Year Olds | 546 (28.3%) | 1,384 (71.7%) |
| 5 to 9 Year Old | 6,266 (76.4%) | 1,938 (23.6%) |
| 10 to 14 Year Olds | 7,451 (87.5%) | 1,060 (12.4%) |
| 15 to 17 Year Olds | 4,742 (87.4%) | 687 (12.7%) |
| 18 to 19 Year Olds | 2,379 (92.4%) | 195 (7.6%) |
| 20 to 24 Year Olds | 2,240 (77.3%) | 657 (22.7%) |
| 25 to 34 Year Olds | 1,781 (68.2%) | 831 (31.8%) |
| 35 Years and over | 1,179 (75.1%) | 390 (24.9%) |
| Total | 26,576 (78.8%) | 7,150 (21.2%) |
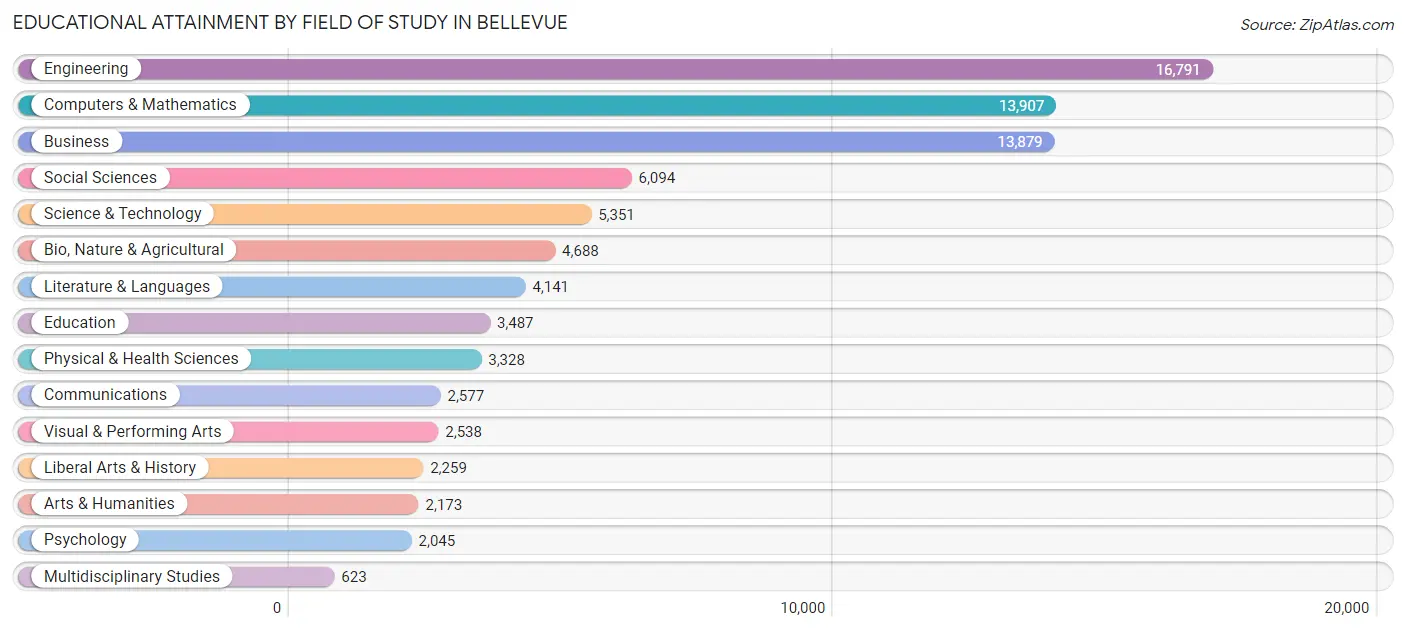
Educational Attainment by Field of Study in Bellevue
Engineering (16,791 | 20.0%), computers & mathematics (13,907 | 16.6%), business (13,879 | 16.6%), social sciences (6,094 | 7.3%), and science & technology (5,351 | 6.4%) are the most common fields of study among 83,881 individuals in Bellevue who have obtained a bachelor's degree or higher.
| Field of Study | # Graduates | % Graduates |
| Computers & Mathematics | 13,907 | 16.6% |
| Bio, Nature & Agricultural | 4,688 | 5.6% |
| Physical & Health Sciences | 3,328 | 4.0% |
| Psychology | 2,045 | 2.4% |
| Social Sciences | 6,094 | 7.3% |
| Engineering | 16,791 | 20.0% |
| Multidisciplinary Studies | 623 | 0.7% |
| Science & Technology | 5,351 | 6.4% |
| Business | 13,879 | 16.6% |
| Education | 3,487 | 4.2% |
| Literature & Languages | 4,141 | 4.9% |
| Liberal Arts & History | 2,259 | 2.7% |
| Visual & Performing Arts | 2,538 | 3.0% |
| Communications | 2,577 | 3.1% |
| Arts & Humanities | 2,173 | 2.6% |
| Total | 83,881 | 100.0% |
Transportation & Commute in Bellevue
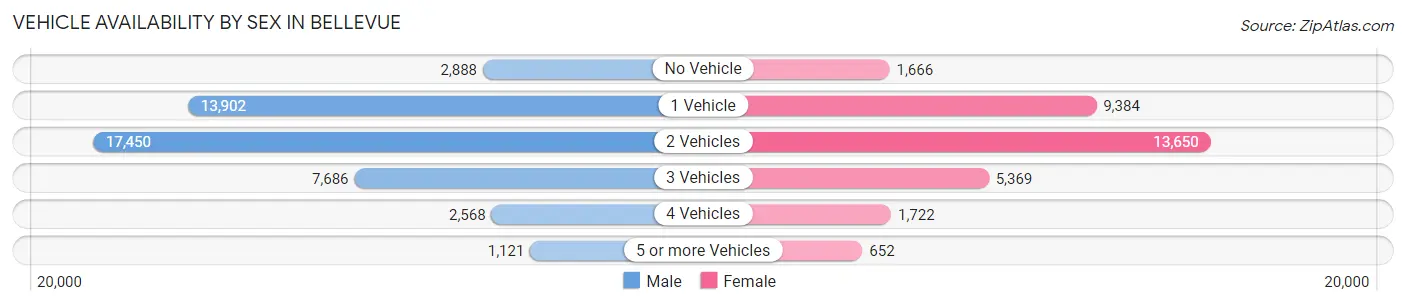
Vehicle Availability by Sex in Bellevue
The most prevalent vehicle ownership categories in Bellevue are males with 2 vehicles (17,450, accounting for 38.3%) and females with 2 vehicles (13,650, making up 53.8%).
| Vehicles Available | Male | Female |
| No Vehicle | 2,888 (6.3%) | 1,666 (5.1%) |
| 1 Vehicle | 13,902 (30.5%) | 9,384 (28.9%) |
| 2 Vehicles | 17,450 (38.3%) | 13,650 (42.1%) |
| 3 Vehicles | 7,686 (16.9%) | 5,369 (16.6%) |
| 4 Vehicles | 2,568 (5.6%) | 1,722 (5.3%) |
| 5 or more Vehicles | 1,121 (2.5%) | 652 (2.0%) |
| Total | 45,615 (100.0%) | 32,443 (100.0%) |
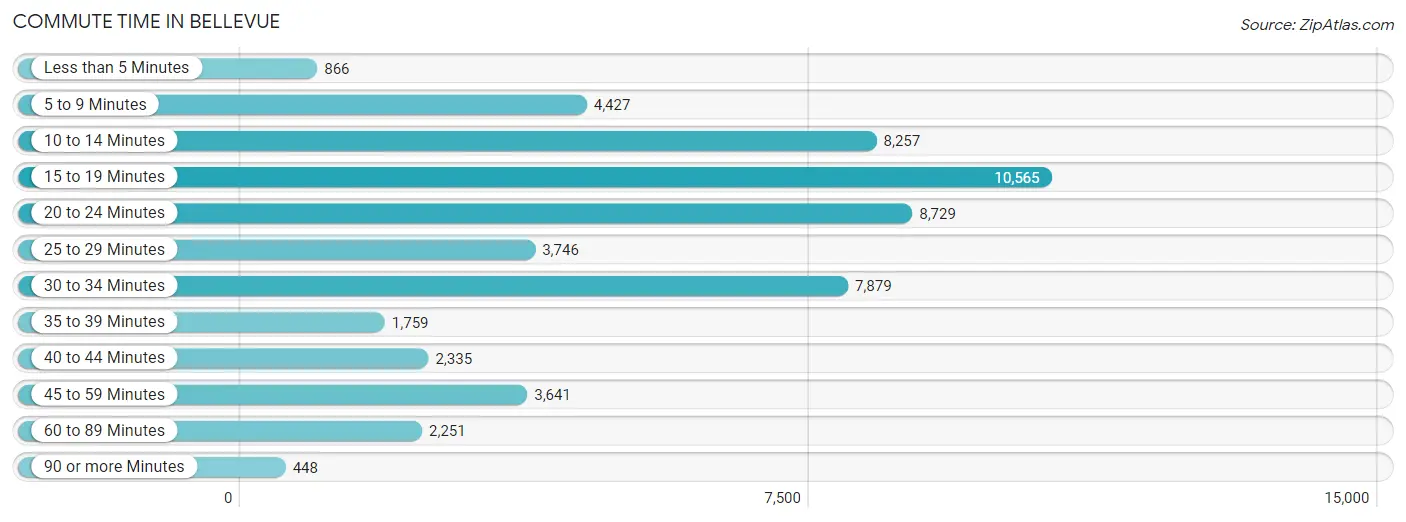
Commute Time in Bellevue
The most frequently occuring commute durations in Bellevue are 15 to 19 minutes (10,565 commuters, 19.2%), 20 to 24 minutes (8,729 commuters, 15.9%), and 10 to 14 minutes (8,257 commuters, 15.0%).
| Commute Time | # Commuters | % Commuters |
| Less than 5 Minutes | 866 | 1.6% |
| 5 to 9 Minutes | 4,427 | 8.1% |
| 10 to 14 Minutes | 8,257 | 15.0% |
| 15 to 19 Minutes | 10,565 | 19.2% |
| 20 to 24 Minutes | 8,729 | 15.9% |
| 25 to 29 Minutes | 3,746 | 6.8% |
| 30 to 34 Minutes | 7,879 | 14.3% |
| 35 to 39 Minutes | 1,759 | 3.2% |
| 40 to 44 Minutes | 2,335 | 4.3% |
| 45 to 59 Minutes | 3,641 | 6.6% |
| 60 to 89 Minutes | 2,251 | 4.1% |
| 90 or more Minutes | 448 | 0.8% |
Commute Time by Sex in Bellevue
The most common commute times in Bellevue are 15 to 19 minutes (5,921 commuters, 18.7%) for males and 15 to 19 minutes (4,644 commuters, 19.9%) for females.
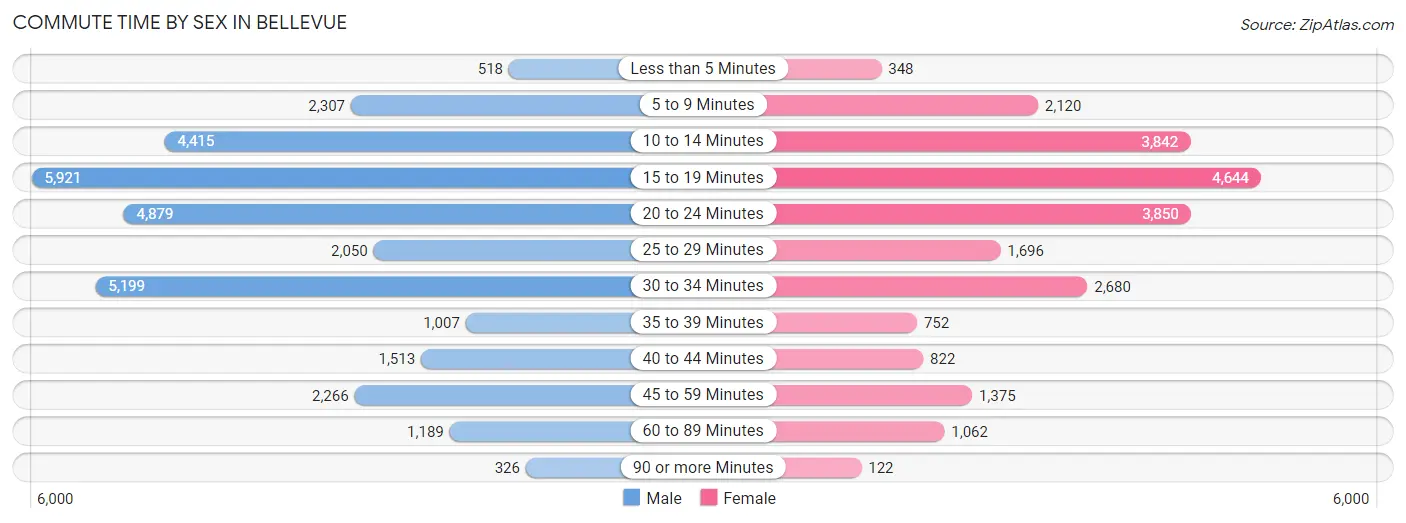
| Commute Time | Male | Female |
| Less than 5 Minutes | 518 (1.6%) | 348 (1.5%) |
| 5 to 9 Minutes | 2,307 (7.3%) | 2,120 (9.1%) |
| 10 to 14 Minutes | 4,415 (14.0%) | 3,842 (16.5%) |
| 15 to 19 Minutes | 5,921 (18.7%) | 4,644 (19.9%) |
| 20 to 24 Minutes | 4,879 (15.4%) | 3,850 (16.5%) |
| 25 to 29 Minutes | 2,050 (6.5%) | 1,696 (7.3%) |
| 30 to 34 Minutes | 5,199 (16.5%) | 2,680 (11.5%) |
| 35 to 39 Minutes | 1,007 (3.2%) | 752 (3.2%) |
| 40 to 44 Minutes | 1,513 (4.8%) | 822 (3.5%) |
| 45 to 59 Minutes | 2,266 (7.2%) | 1,375 (5.9%) |
| 60 to 89 Minutes | 1,189 (3.8%) | 1,062 (4.6%) |
| 90 or more Minutes | 326 (1.0%) | 122 (0.5%) |
Time of Departure to Work by Sex in Bellevue
The most frequent times of departure to work in Bellevue are 8:00 AM to 8:29 AM (5,281, 16.7%) for males and 9:00 AM to 9:59 AM (3,828, 16.4%) for females.
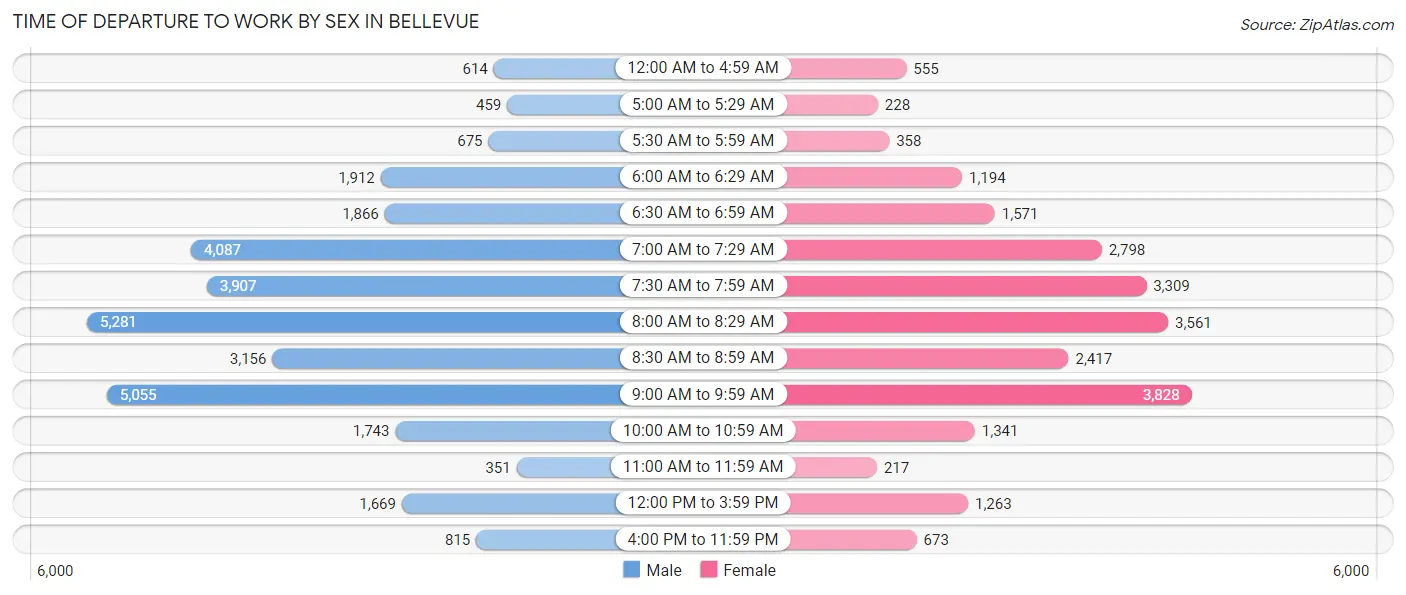
| Time of Departure | Male | Female |
| 12:00 AM to 4:59 AM | 614 (1.9%) | 555 (2.4%) |
| 5:00 AM to 5:29 AM | 459 (1.5%) | 228 (1.0%) |
| 5:30 AM to 5:59 AM | 675 (2.1%) | 358 (1.5%) |
| 6:00 AM to 6:29 AM | 1,912 (6.0%) | 1,194 (5.1%) |
| 6:30 AM to 6:59 AM | 1,866 (5.9%) | 1,571 (6.7%) |
| 7:00 AM to 7:29 AM | 4,087 (12.9%) | 2,798 (12.0%) |
| 7:30 AM to 7:59 AM | 3,907 (12.4%) | 3,309 (14.2%) |
| 8:00 AM to 8:29 AM | 5,281 (16.7%) | 3,561 (15.3%) |
| 8:30 AM to 8:59 AM | 3,156 (10.0%) | 2,417 (10.4%) |
| 9:00 AM to 9:59 AM | 5,055 (16.0%) | 3,828 (16.4%) |
| 10:00 AM to 10:59 AM | 1,743 (5.5%) | 1,341 (5.8%) |
| 11:00 AM to 11:59 AM | 351 (1.1%) | 217 (0.9%) |
| 12:00 PM to 3:59 PM | 1,669 (5.3%) | 1,263 (5.4%) |
| 4:00 PM to 11:59 PM | 815 (2.6%) | 673 (2.9%) |
| Total | 31,590 (100.0%) | 23,313 (100.0%) |
Housing Occupancy in Bellevue
Occupancy by Ownership in Bellevue
Of the total 60,882 dwellings in Bellevue, owner-occupied units account for 31,452 (51.7%), while renter-occupied units make up 29,430 (48.3%).
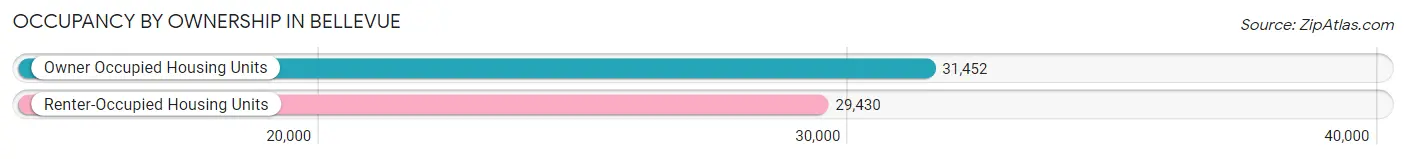
| Occupancy | # Housing Units | % Housing Units |
| Owner Occupied Housing Units | 31,452 | 51.7% |
| Renter-Occupied Housing Units | 29,430 | 48.3% |
| Total Occupied Housing Units | 60,882 | 100.0% |
Occupancy by Household Size in Bellevue
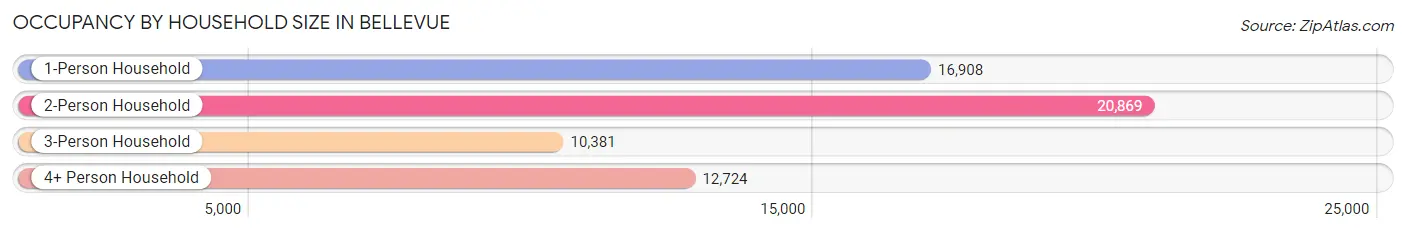
| Household Size | # Housing Units | % Housing Units |
| 1-Person Household | 16,908 | 27.8% |
| 2-Person Household | 20,869 | 34.3% |
| 3-Person Household | 10,381 | 17.1% |
| 4+ Person Household | 12,724 | 20.9% |
| Total Housing Units | 60,882 | 100.0% |
Occupancy by Ownership by Household Size in Bellevue
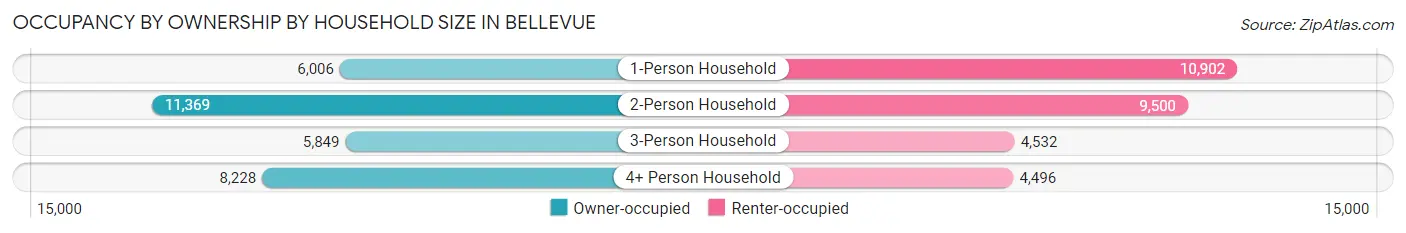
| Household Size | Owner-occupied | Renter-occupied |
| 1-Person Household | 6,006 (35.5%) | 10,902 (64.5%) |
| 2-Person Household | 11,369 (54.5%) | 9,500 (45.5%) |
| 3-Person Household | 5,849 (56.3%) | 4,532 (43.7%) |
| 4+ Person Household | 8,228 (64.7%) | 4,496 (35.3%) |
| Total Housing Units | 31,452 (51.7%) | 29,430 (48.3%) |
Occupancy by Educational Attainment in Bellevue
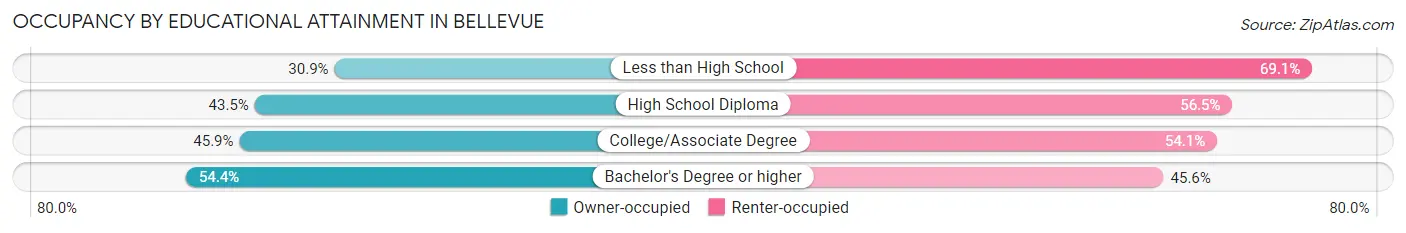
| Household Size | Owner-occupied | Renter-occupied |
| Less than High School | 496 (30.9%) | 1,111 (69.1%) |
| High School Diploma | 1,721 (43.5%) | 2,234 (56.5%) |
| College/Associate Degree | 4,685 (45.9%) | 5,514 (54.1%) |
| Bachelor's Degree or higher | 24,550 (54.4%) | 20,571 (45.6%) |
Occupancy by Age of Householder in Bellevue
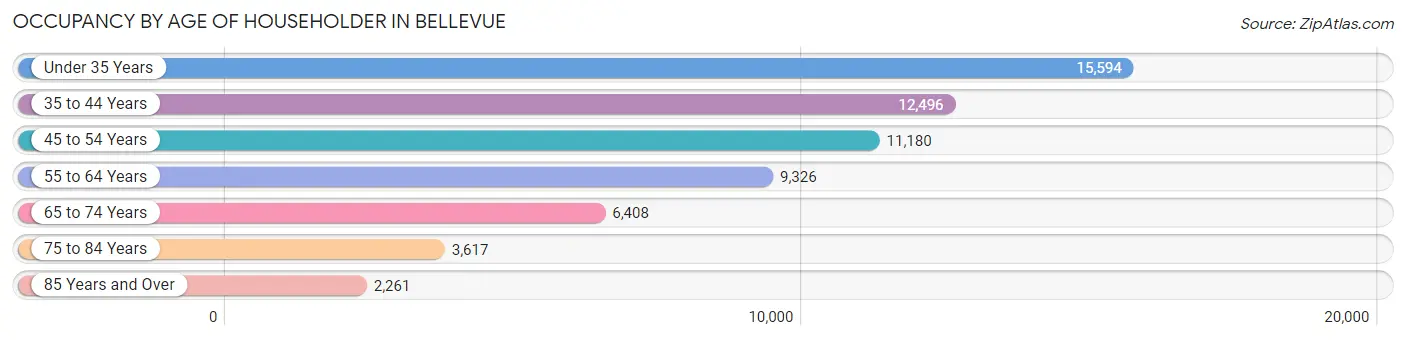
| Age Bracket | # Households | % Households |
| Under 35 Years | 15,594 | 25.6% |
| 35 to 44 Years | 12,496 | 20.5% |
| 45 to 54 Years | 11,180 | 18.4% |
| 55 to 64 Years | 9,326 | 15.3% |
| 65 to 74 Years | 6,408 | 10.5% |
| 75 to 84 Years | 3,617 | 5.9% |
| 85 Years and Over | 2,261 | 3.7% |
| Total | 60,882 | 100.0% |
Housing Finances in Bellevue
Median Income by Occupancy in Bellevue
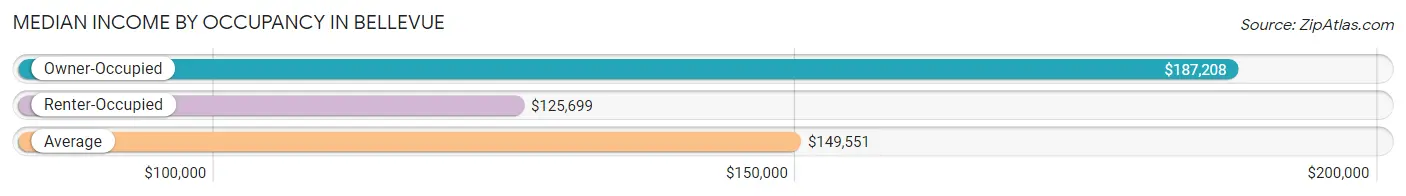
| Occupancy Type | # Households | Median Income |
| Owner-Occupied | 31,452 (51.7%) | $187,208 |
| Renter-Occupied | 29,430 (48.3%) | $125,699 |
| Average | 60,882 (100.0%) | $149,551 |
Occupancy by Householder Income Bracket in Bellevue
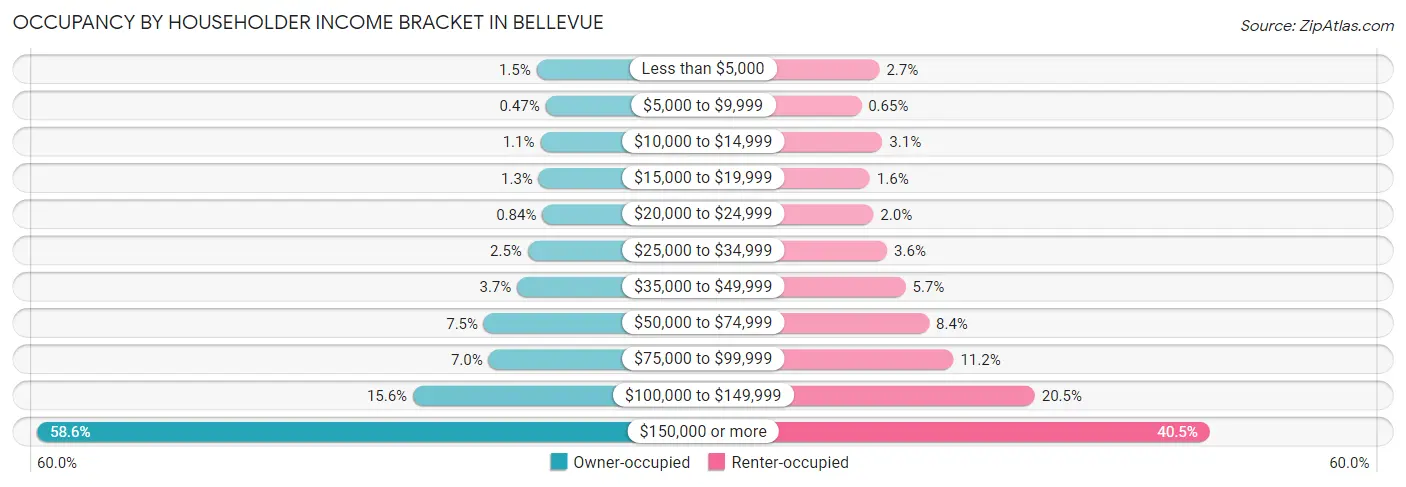
| Income Bracket | Owner-occupied | Renter-occupied |
| Less than $5,000 | 468 (1.5%) | 803 (2.7%) |
| $5,000 to $9,999 | 147 (0.5%) | 192 (0.6%) |
| $10,000 to $14,999 | 334 (1.1%) | 904 (3.1%) |
| $15,000 to $19,999 | 392 (1.3%) | 483 (1.6%) |
| $20,000 to $24,999 | 264 (0.8%) | 599 (2.0%) |
| $25,000 to $34,999 | 787 (2.5%) | 1,063 (3.6%) |
| $35,000 to $49,999 | 1,168 (3.7%) | 1,679 (5.7%) |
| $50,000 to $74,999 | 2,362 (7.5%) | 2,476 (8.4%) |
| $75,000 to $99,999 | 2,196 (7.0%) | 3,294 (11.2%) |
| $100,000 to $149,999 | 4,912 (15.6%) | 6,030 (20.5%) |
| $150,000 or more | 18,422 (58.6%) | 11,907 (40.5%) |
| Total | 31,452 (100.0%) | 29,430 (100.0%) |
Monthly Housing Cost Tiers in Bellevue
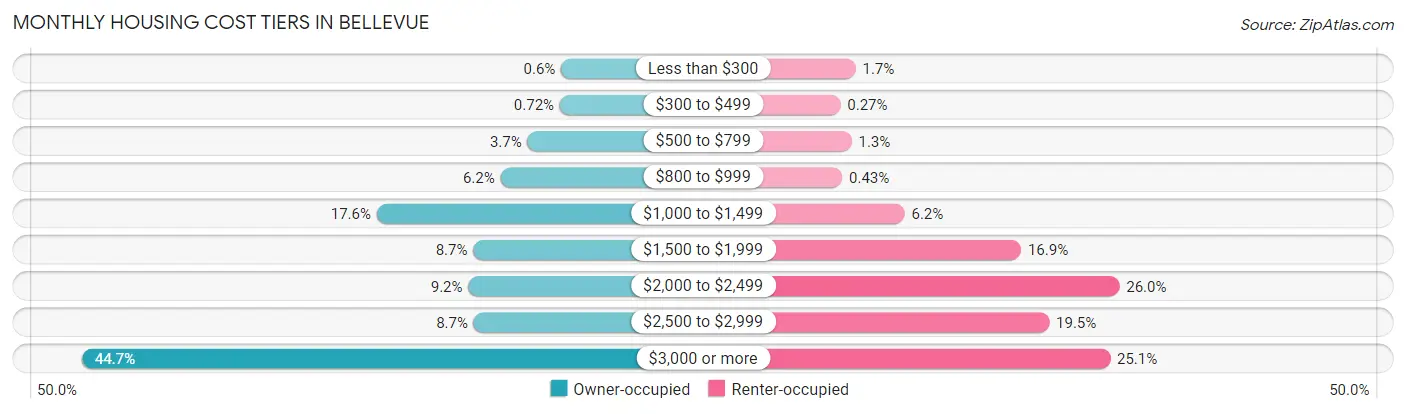
| Monthly Cost | Owner-occupied | Renter-occupied |
| Less than $300 | 190 (0.6%) | 491 (1.7%) |
| $300 to $499 | 227 (0.7%) | 79 (0.3%) |
| $500 to $799 | 1,163 (3.7%) | 383 (1.3%) |
| $800 to $999 | 1,944 (6.2%) | 128 (0.4%) |
| $1,000 to $1,499 | 5,528 (17.6%) | 1,818 (6.2%) |
| $1,500 to $1,999 | 2,733 (8.7%) | 4,973 (16.9%) |
| $2,000 to $2,499 | 2,879 (9.1%) | 7,637 (26.0%) |
| $2,500 to $2,999 | 2,721 (8.6%) | 5,737 (19.5%) |
| $3,000 or more | 14,067 (44.7%) | 7,388 (25.1%) |
| Total | 31,452 (100.0%) | 29,430 (100.0%) |
Physical Housing Characteristics in Bellevue
Housing Structures in Bellevue
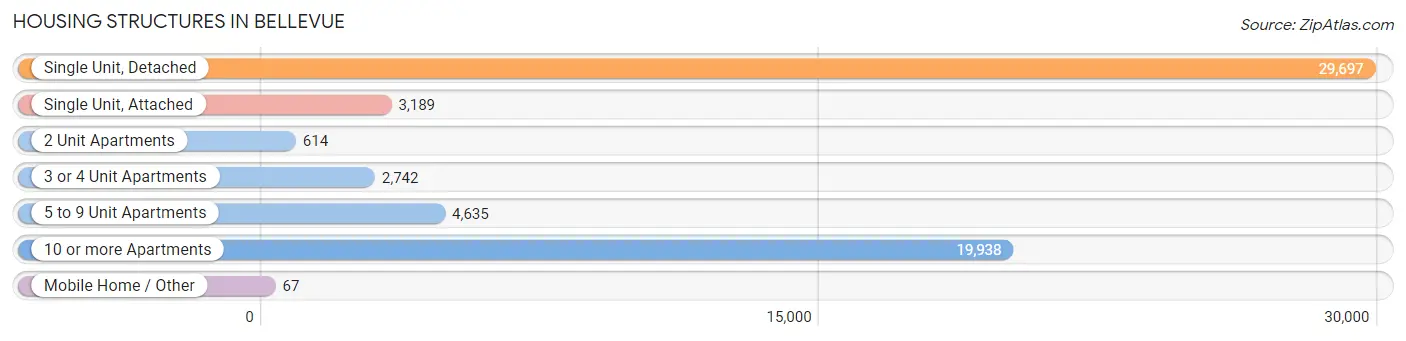
| Structure Type | # Housing Units | % Housing Units |
| Single Unit, Detached | 29,697 | 48.8% |
| Single Unit, Attached | 3,189 | 5.2% |
| 2 Unit Apartments | 614 | 1.0% |
| 3 or 4 Unit Apartments | 2,742 | 4.5% |
| 5 to 9 Unit Apartments | 4,635 | 7.6% |
| 10 or more Apartments | 19,938 | 32.8% |
| Mobile Home / Other | 67 | 0.1% |
| Total | 60,882 | 100.0% |
Housing Structures by Occupancy in Bellevue
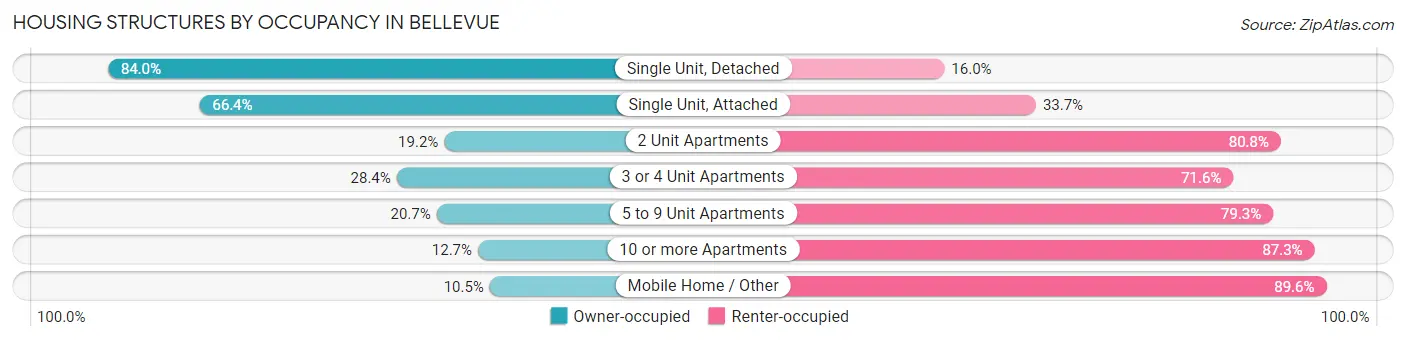
| Structure Type | Owner-occupied | Renter-occupied |
| Single Unit, Detached | 24,936 (84.0%) | 4,761 (16.0%) |
| Single Unit, Attached | 2,116 (66.3%) | 1,073 (33.7%) |
| 2 Unit Apartments | 118 (19.2%) | 496 (80.8%) |
| 3 or 4 Unit Apartments | 778 (28.4%) | 1,964 (71.6%) |
| 5 to 9 Unit Apartments | 959 (20.7%) | 3,676 (79.3%) |
| 10 or more Apartments | 2,538 (12.7%) | 17,400 (87.3%) |
| Mobile Home / Other | 7 (10.4%) | 60 (89.5%) |
| Total | 31,452 (51.7%) | 29,430 (48.3%) |
Housing Structures by Number of Rooms in Bellevue
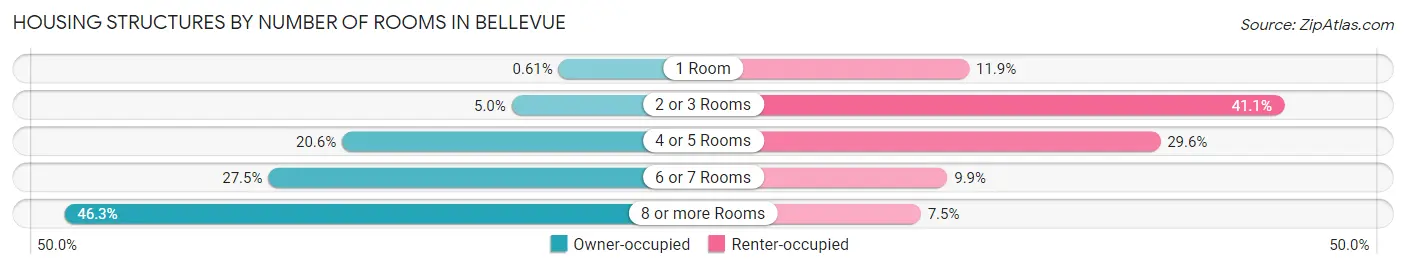
| Number of Rooms | Owner-occupied | Renter-occupied |
| 1 Room | 193 (0.6%) | 3,514 (11.9%) |
| 2 or 3 Rooms | 1,560 (5.0%) | 12,081 (41.0%) |
| 4 or 5 Rooms | 6,492 (20.6%) | 8,716 (29.6%) |
| 6 or 7 Rooms | 8,637 (27.5%) | 2,921 (9.9%) |
| 8 or more Rooms | 14,570 (46.3%) | 2,198 (7.5%) |
| Total | 31,452 (100.0%) | 29,430 (100.0%) |
Housing Structure by Heating Type in Bellevue
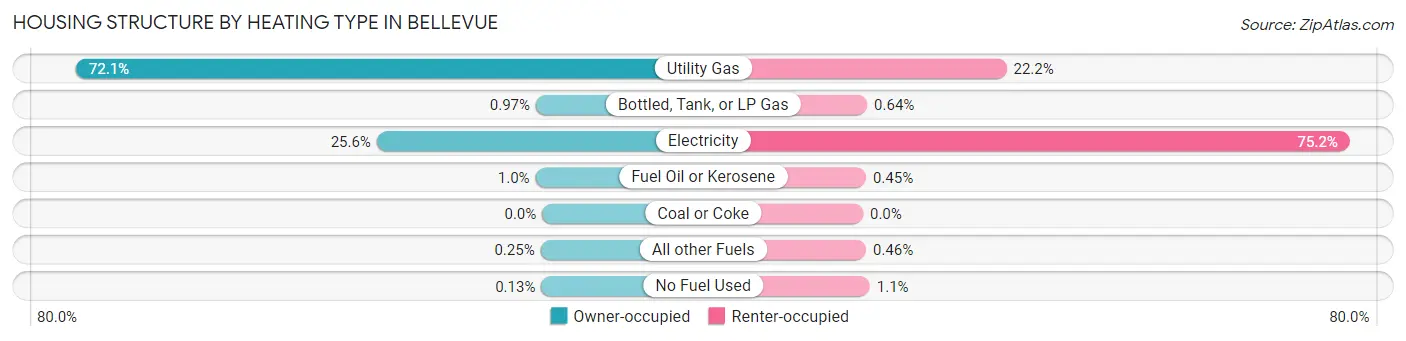
| Heating Type | Owner-occupied | Renter-occupied |
| Utility Gas | 22,664 (72.1%) | 6,527 (22.2%) |
| Bottled, Tank, or LP Gas | 305 (1.0%) | 189 (0.6%) |
| Electricity | 8,041 (25.6%) | 22,138 (75.2%) |
| Fuel Oil or Kerosene | 323 (1.0%) | 131 (0.4%) |
| Coal or Coke | 0 (0.0%) | 0 (0.0%) |
| All other Fuels | 78 (0.3%) | 136 (0.5%) |
| No Fuel Used | 41 (0.1%) | 309 (1.1%) |
| Total | 31,452 (100.0%) | 29,430 (100.0%) |
Household Vehicle Usage in Bellevue
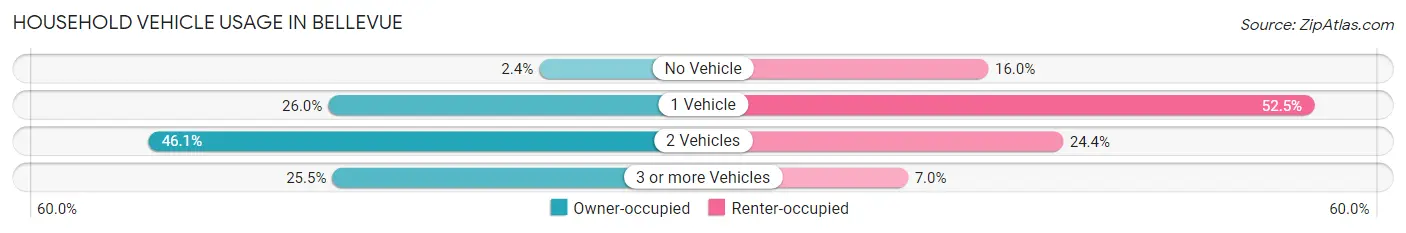
| Vehicles per Household | Owner-occupied | Renter-occupied |
| No Vehicle | 749 (2.4%) | 4,719 (16.0%) |
| 1 Vehicle | 8,176 (26.0%) | 15,460 (52.5%) |
| 2 Vehicles | 14,495 (46.1%) | 7,183 (24.4%) |
| 3 or more Vehicles | 8,032 (25.5%) | 2,068 (7.0%) |
| Total | 31,452 (100.0%) | 29,430 (100.0%) |
Real Estate & Mortgages in Bellevue
Real Estate and Mortgage Overview in Bellevue
| Characteristic | Without Mortgage | With Mortgage |
| Housing Units | 11,685 | 19,767 |
| Median Property Value | $1,092,100 | $1,165,200 |
| Median Household Income | $129,421 | $13,376 |
| Monthly Housing Costs | $1,197 | $13,561 |
| Real Estate Taxes | $8,244 | $111 |
Property Value by Mortgage Status in Bellevue
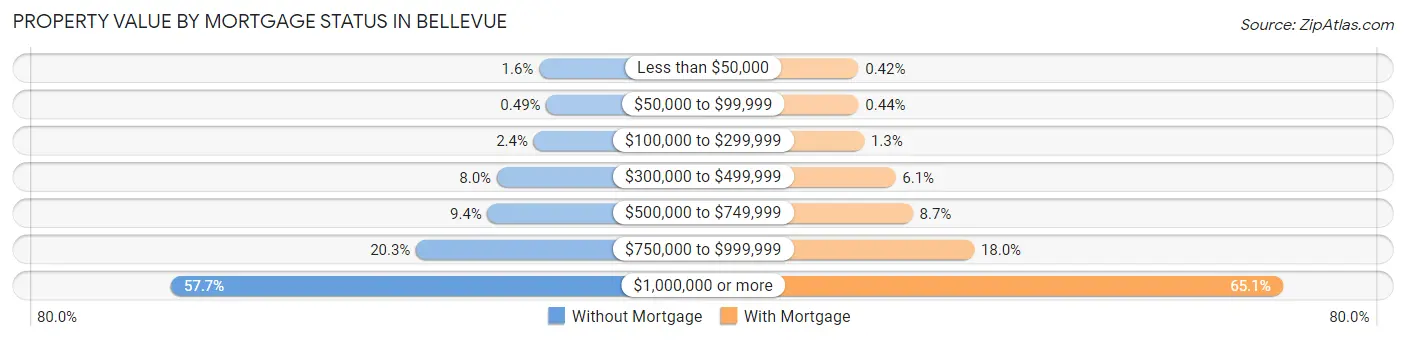
| Property Value | Without Mortgage | With Mortgage |
| Less than $50,000 | 186 (1.6%) | 84 (0.4%) |
| $50,000 to $99,999 | 57 (0.5%) | 86 (0.4%) |
| $100,000 to $299,999 | 282 (2.4%) | 254 (1.3%) |
| $300,000 to $499,999 | 938 (8.0%) | 1,200 (6.1%) |
| $500,000 to $749,999 | 1,103 (9.4%) | 1,718 (8.7%) |
| $750,000 to $999,999 | 2,376 (20.3%) | 3,566 (18.0%) |
| $1,000,000 or more | 6,743 (57.7%) | 12,859 (65.0%) |
| Total | 11,685 (100.0%) | 19,767 (100.0%) |
Household Income by Mortgage Status in Bellevue
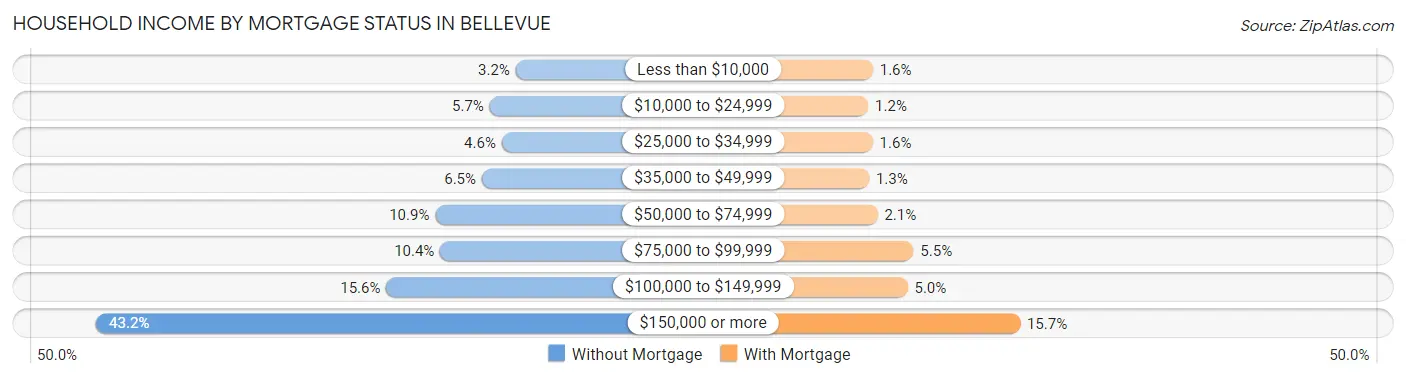
| Household Income | Without Mortgage | With Mortgage |
| Less than $10,000 | 377 (3.2%) | 325 (1.6%) |
| $10,000 to $24,999 | 667 (5.7%) | 238 (1.2%) |
| $25,000 to $34,999 | 533 (4.6%) | 323 (1.6%) |
| $35,000 to $49,999 | 754 (6.5%) | 254 (1.3%) |
| $50,000 to $74,999 | 1,273 (10.9%) | 414 (2.1%) |
| $75,000 to $99,999 | 1,218 (10.4%) | 1,089 (5.5%) |
| $100,000 to $149,999 | 1,817 (15.5%) | 978 (5.0%) |
| $150,000 or more | 5,046 (43.2%) | 3,095 (15.7%) |
| Total | 11,685 (100.0%) | 19,767 (100.0%) |
Property Value to Household Income Ratio in Bellevue
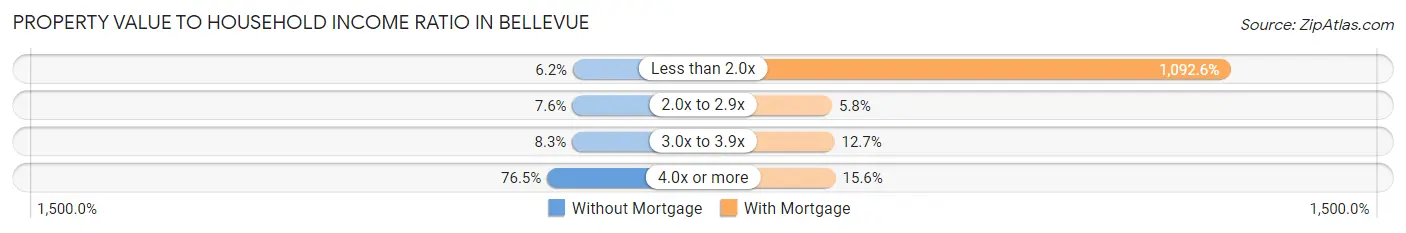
| Value-to-Income Ratio | Without Mortgage | With Mortgage |
| Less than 2.0x | 724 (6.2%) | 215,976 (1,092.6%) |
| 2.0x to 2.9x | 889 (7.6%) | 1,145 (5.8%) |
| 3.0x to 3.9x | 975 (8.3%) | 2,513 (12.7%) |
| 4.0x or more | 8,944 (76.5%) | 3,079 (15.6%) |
| Total | 11,685 (100.0%) | 19,767 (100.0%) |
Real Estate Taxes by Mortgage Status in Bellevue
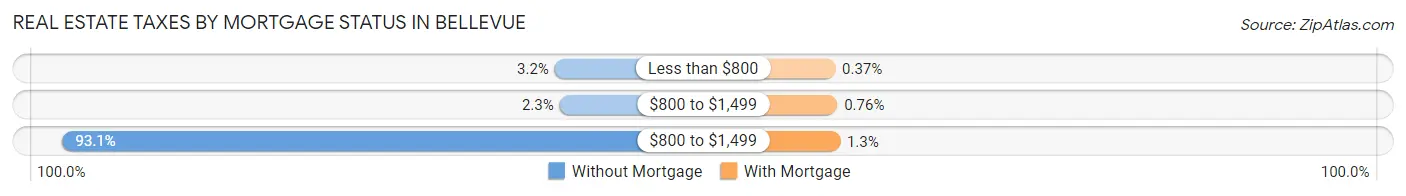
| Property Taxes | Without Mortgage | With Mortgage |
| Less than $800 | 372 (3.2%) | 74 (0.4%) |
| $800 to $1,499 | 268 (2.3%) | 151 (0.8%) |
| $800 to $1,499 | 10,878 (93.1%) | 249 (1.3%) |
| Total | 11,685 (100.0%) | 19,767 (100.0%) |
Health & Disability in Bellevue
Health Insurance Coverage by Age in Bellevue
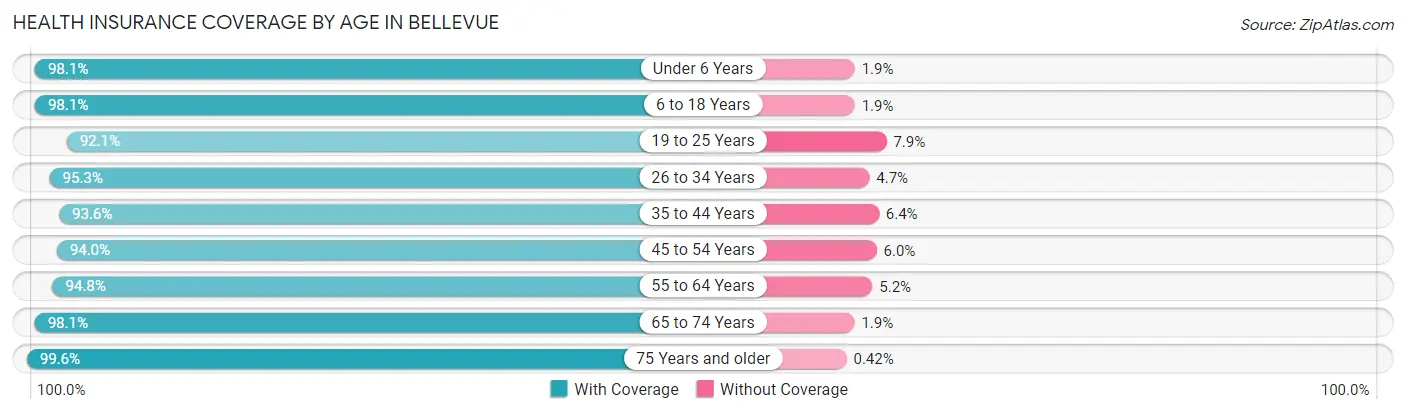
| Age Bracket | With Coverage | Without Coverage |
| Under 6 Years | 8,965 (98.1%) | 177 (1.9%) |
| 6 to 18 Years | 22,295 (98.1%) | 441 (1.9%) |
| 19 to 25 Years | 10,106 (92.1%) | 862 (7.9%) |
| 26 to 34 Years | 23,712 (95.3%) | 1,162 (4.7%) |
| 35 to 44 Years | 21,298 (93.6%) | 1,466 (6.4%) |
| 45 to 54 Years | 19,636 (94.0%) | 1,257 (6.0%) |
| 55 to 64 Years | 16,303 (94.8%) | 899 (5.2%) |
| 65 to 74 Years | 11,324 (98.1%) | 219 (1.9%) |
| 75 Years and older | 10,061 (99.6%) | 42 (0.4%) |
| Total | 143,700 (95.7%) | 6,525 (4.3%) |
Health Insurance Coverage by Citizenship Status in Bellevue
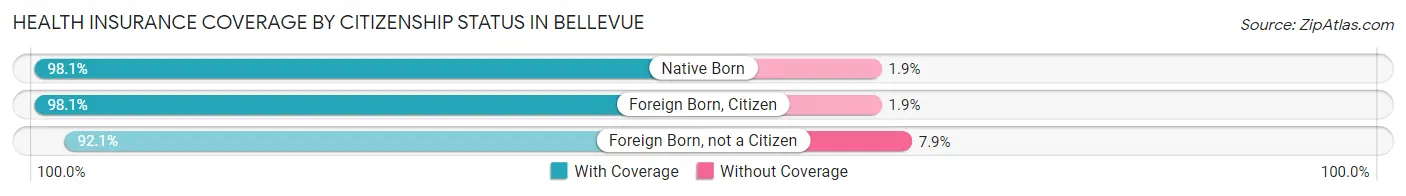
| Citizenship Status | With Coverage | Without Coverage |
| Native Born | 8,965 (98.1%) | 177 (1.9%) |
| Foreign Born, Citizen | 22,295 (98.1%) | 441 (1.9%) |
| Foreign Born, not a Citizen | 10,106 (92.1%) | 862 (7.9%) |
Health Insurance Coverage by Household Income in Bellevue
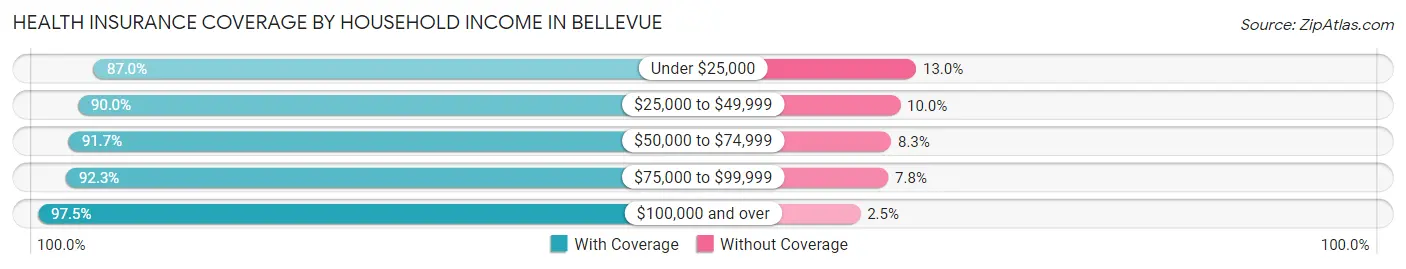
| Household Income | With Coverage | Without Coverage |
| Under $25,000 | 7,349 (87.0%) | 1,096 (13.0%) |
| $25,000 to $49,999 | 7,693 (90.0%) | 853 (10.0%) |
| $50,000 to $74,999 | 8,808 (91.7%) | 796 (8.3%) |
| $75,000 to $99,999 | 10,989 (92.2%) | 923 (7.7%) |
| $100,000 and over | 107,534 (97.5%) | 2,780 (2.5%) |
Public vs Private Health Insurance Coverage by Age in Bellevue
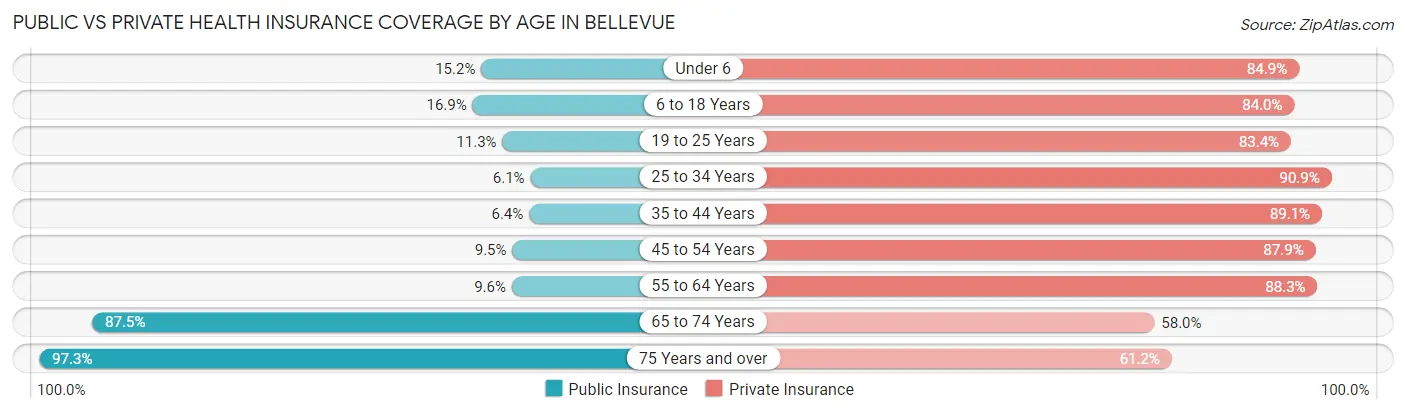
| Age Bracket | Public Insurance | Private Insurance |
| Under 6 | 1,393 (15.2%) | 7,760 (84.9%) |
| 6 to 18 Years | 3,831 (16.9%) | 19,099 (84.0%) |
| 19 to 25 Years | 1,241 (11.3%) | 9,143 (83.4%) |
| 25 to 34 Years | 1,520 (6.1%) | 22,607 (90.9%) |
| 35 to 44 Years | 1,446 (6.4%) | 20,288 (89.1%) |
| 45 to 54 Years | 1,976 (9.5%) | 18,372 (87.9%) |
| 55 to 64 Years | 1,647 (9.6%) | 15,186 (88.3%) |
| 65 to 74 Years | 10,097 (87.5%) | 6,697 (58.0%) |
| 75 Years and over | 9,830 (97.3%) | 6,186 (61.2%) |
| Total | 32,981 (22.0%) | 125,338 (83.4%) |
Disability Status by Sex by Age in Bellevue
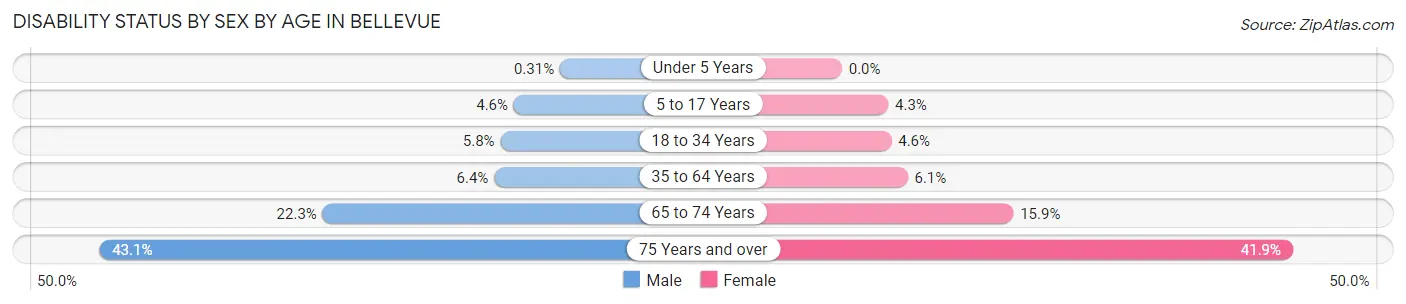
| Age Bracket | Male | Female |
| Under 5 Years | 12 (0.3%) | 0 (0.0%) |
| 5 to 17 Years | 562 (4.6%) | 450 (4.3%) |
| 18 to 34 Years | 1,214 (5.8%) | 774 (4.6%) |
| 35 to 64 Years | 1,988 (6.4%) | 1,823 (6.1%) |
| 65 to 74 Years | 1,080 (22.3%) | 1,067 (15.9%) |
| 75 Years and over | 1,874 (43.1%) | 2,408 (41.9%) |
Disability Class by Sex by Age in Bellevue
Disability Class: Hearing Difficulty
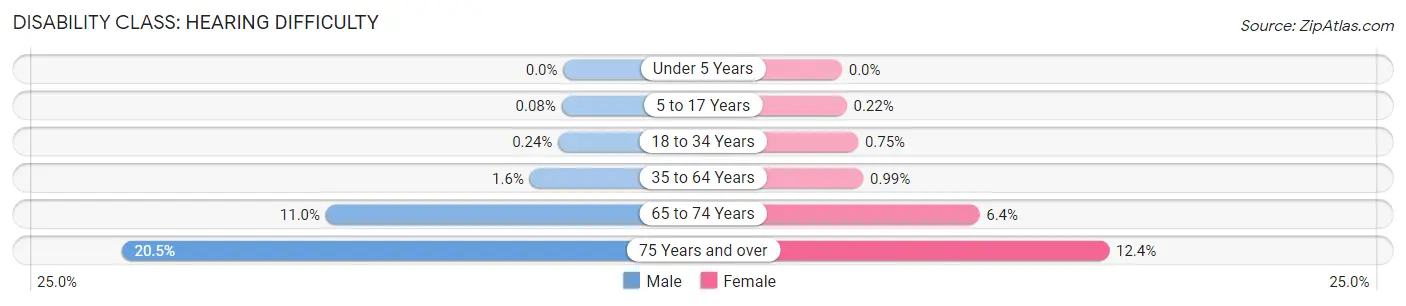
| Age Bracket | Male | Female |
| Under 5 Years | 0 (0.0%) | 0 (0.0%) |
| 5 to 17 Years | 10 (0.1%) | 23 (0.2%) |
| 18 to 34 Years | 50 (0.2%) | 126 (0.7%) |
| 35 to 64 Years | 482 (1.6%) | 297 (1.0%) |
| 65 to 74 Years | 533 (11.0%) | 428 (6.4%) |
| 75 Years and over | 892 (20.5%) | 713 (12.4%) |
Disability Class: Vision Difficulty
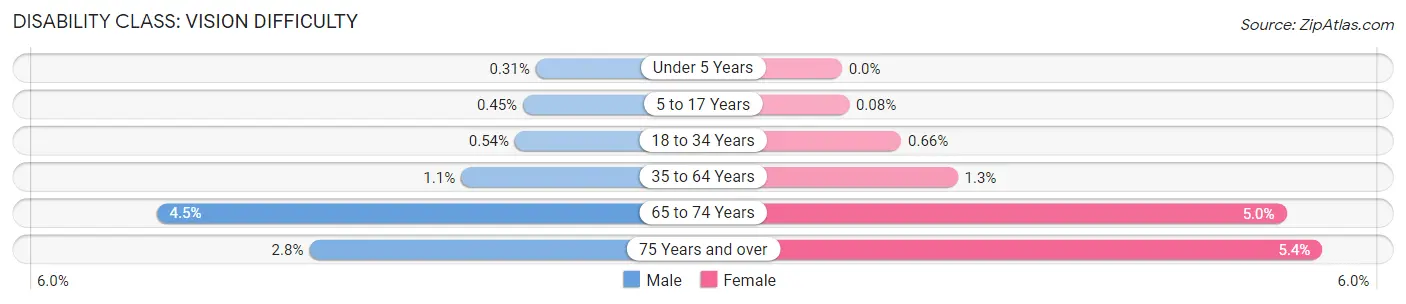
| Age Bracket | Male | Female |
| Under 5 Years | 12 (0.3%) | 0 (0.0%) |
| 5 to 17 Years | 55 (0.4%) | 8 (0.1%) |
| 18 to 34 Years | 112 (0.5%) | 112 (0.7%) |
| 35 to 64 Years | 354 (1.1%) | 386 (1.3%) |
| 65 to 74 Years | 219 (4.5%) | 332 (5.0%) |
| 75 Years and over | 123 (2.8%) | 308 (5.3%) |
Disability Class: Cognitive Difficulty
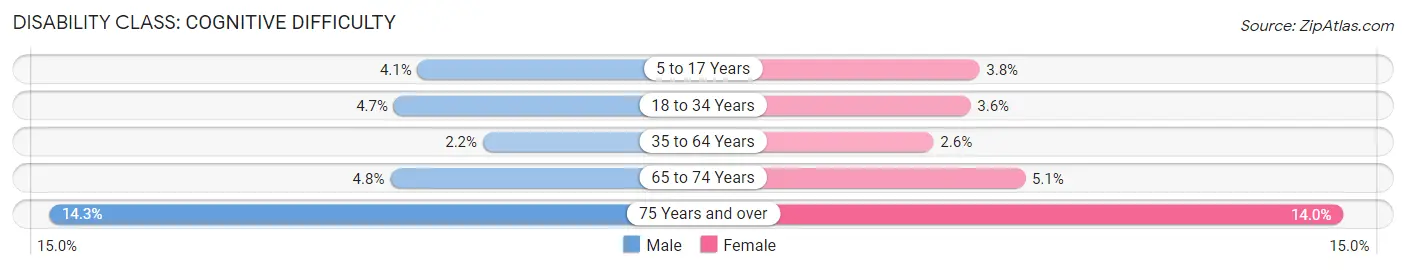
| Age Bracket | Male | Female |
| 5 to 17 Years | 497 (4.1%) | 401 (3.8%) |
| 18 to 34 Years | 981 (4.7%) | 605 (3.6%) |
| 35 to 64 Years | 695 (2.2%) | 762 (2.5%) |
| 65 to 74 Years | 233 (4.8%) | 342 (5.1%) |
| 75 Years and over | 623 (14.3%) | 803 (14.0%) |
Disability Class: Ambulatory Difficulty
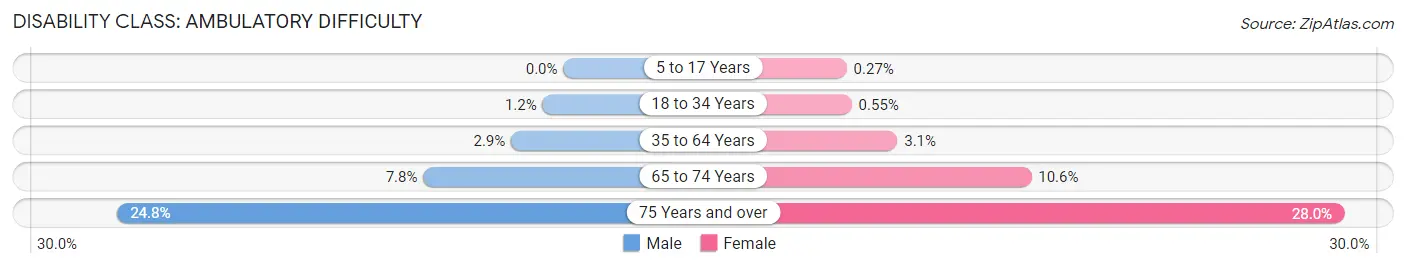
| Age Bracket | Male | Female |
| 5 to 17 Years | 0 (0.0%) | 28 (0.3%) |
| 18 to 34 Years | 242 (1.2%) | 93 (0.5%) |
| 35 to 64 Years | 902 (2.9%) | 923 (3.1%) |
| 65 to 74 Years | 377 (7.8%) | 708 (10.5%) |
| 75 Years and over | 1,081 (24.8%) | 1,608 (28.0%) |
Disability Class: Self-Care Difficulty
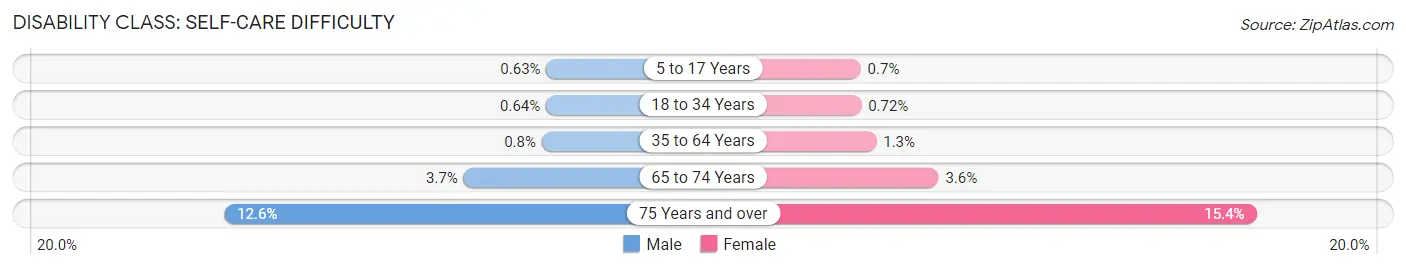
| Age Bracket | Male | Female |
| 5 to 17 Years | 77 (0.6%) | 73 (0.7%) |
| 18 to 34 Years | 134 (0.6%) | 121 (0.7%) |
| 35 to 64 Years | 247 (0.8%) | 382 (1.3%) |
| 65 to 74 Years | 179 (3.7%) | 241 (3.6%) |
| 75 Years and over | 548 (12.6%) | 885 (15.4%) |
Technology Access in Bellevue
Computing Device Access in Bellevue
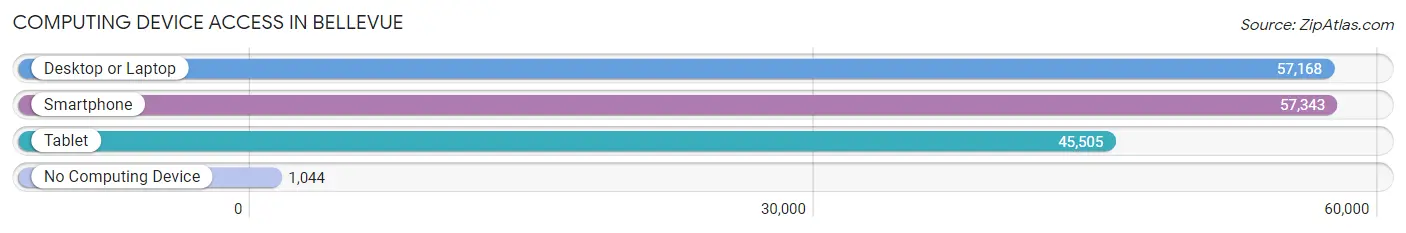
| Device Type | # Households | % Households |
| Desktop or Laptop | 57,168 | 93.9% |
| Smartphone | 57,343 | 94.2% |
| Tablet | 45,505 | 74.7% |
| No Computing Device | 1,044 | 1.7% |
| Total | 60,882 | 100.0% |
Internet Access in Bellevue
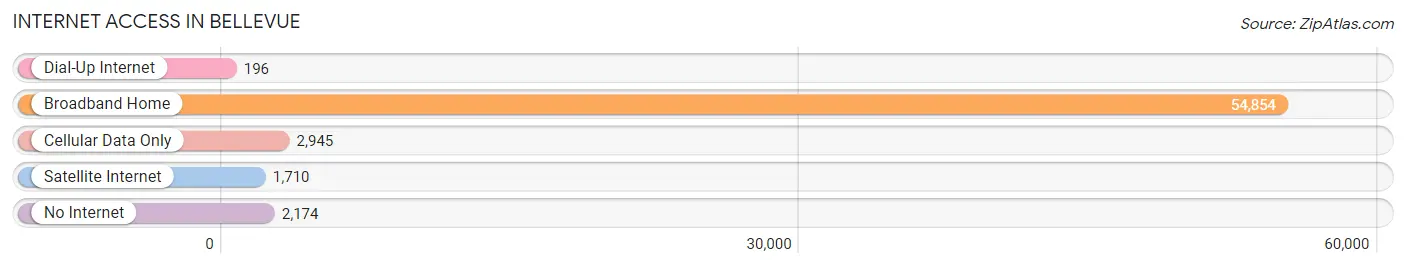
| Internet Type | # Households | % Households |
| Dial-Up Internet | 196 | 0.3% |
| Broadband Home | 54,854 | 90.1% |
| Cellular Data Only | 2,945 | 4.8% |
| Satellite Internet | 1,710 | 2.8% |
| No Internet | 2,174 | 3.6% |
| Total | 60,882 | 100.0% |
Bellevue Summary
Bellevue, Washington is a city located in King County, Washington, United States, across Lake Washington from Seattle. The city had a population of 122,363 at the 2010 census, making it the second largest city in the county and the fifth largest in the state. Bellevue is the largest suburb of Seattle and is part of the Seattle metropolitan area.
History
Bellevue was first settled in 1869 by William Meydenbauer and was originally named Meydenbauer Bay. The city was officially incorporated in 1953 and was named after the French term for “beautiful view”. The city was originally a farming community, but in the 1950s it began to experience rapid growth due to its proximity to Seattle and the development of the Interstate 90 freeway.
Geography
Bellevue is located in King County, Washington, on the east side of Lake Washington. The city is bordered by Redmond to the north, Kirkland to the west, Issaquah to the south, and Newcastle to the east. The city covers an area of 31.12 square miles and has a population density of 3,919 people per square mile.
Economy
Bellevue is a major economic center in the Seattle metropolitan area. The city is home to many corporate headquarters, including Microsoft, T-Mobile, Expedia, and Eddie Bauer. Bellevue is also home to many retail stores, restaurants, and entertainment venues. The city’s economy is largely based on technology, finance, and retail.
Demographics
As of the 2010 census, Bellevue had a population of 122,363. The racial makeup of the city was 68.2% White, 11.3% Asian, 8.2% Hispanic or Latino, 6.2% African American, and 4.2% other. The median household income was $90,837 and the median family income was $106,844. The per capita income was $45,945.
Bellevue is a diverse city with a variety of cultures and backgrounds. The city is home to many immigrants from around the world, including China, India, and the Philippines. The city is also home to many young professionals and families.
Common Questions
What is Per Capita Income in Bellevue?
Per Capita income in Bellevue is $85,845.
What is the Median Family Income in Bellevue?
Median Family Income in Bellevue is $184,922.
What is the Median Household income in Bellevue?
Median Household Income in Bellevue is $149,551.
What is Income or Wage Gap in Bellevue?
Income or Wage Gap in Bellevue is 48.7%.
Women in Bellevue earn 51.3 cents for every dollar earned by a man.
What is Family Income Deficit in Bellevue?
Family Income Deficit in Bellevue is $12,008.
Families that are below poverty line in Bellevue earn $12,008 less on average than the poverty threshold level.
What is Inequality or Gini Index in Bellevue?
Inequality or Gini Index in Bellevue is 0.47.
What is the Total Population of Bellevue?
Total Population of Bellevue is 150,606.
What is the Total Male Population of Bellevue?
Total Male Population of Bellevue is 77,187.
What is the Total Female Population of Bellevue?
Total Female Population of Bellevue is 73,419.
What is the Ratio of Males per 100 Females in Bellevue?
There are 105.13 Males per 100 Females in Bellevue.
What is the Ratio of Females per 100 Males in Bellevue?
There are 95.12 Females per 100 Males in Bellevue.
What is the Median Population Age in Bellevue?
Median Population Age in Bellevue is 38.3 Years.
What is the Average Family Size in Bellevue
Average Family Size in Bellevue is 3.0 People.
What is the Average Household Size in Bellevue
Average Household Size in Bellevue is 2.5 People.
How Large is the Labor Force in Bellevue?
There are 82,704 People in the Labor Forcein in Bellevue.
What is the Percentage of People in the Labor Force in Bellevue?
66.6% of People are in the Labor Force in Bellevue.
What is the Unemployment Rate in Bellevue?
Unemployment Rate in Bellevue is 4.0%.