Cities with the Highest Percentage of Families with Income Above $100,000 in Texas
RELATED REPORTS & OPTIONS
Family Income | $100k+
Texas
Compare Cities
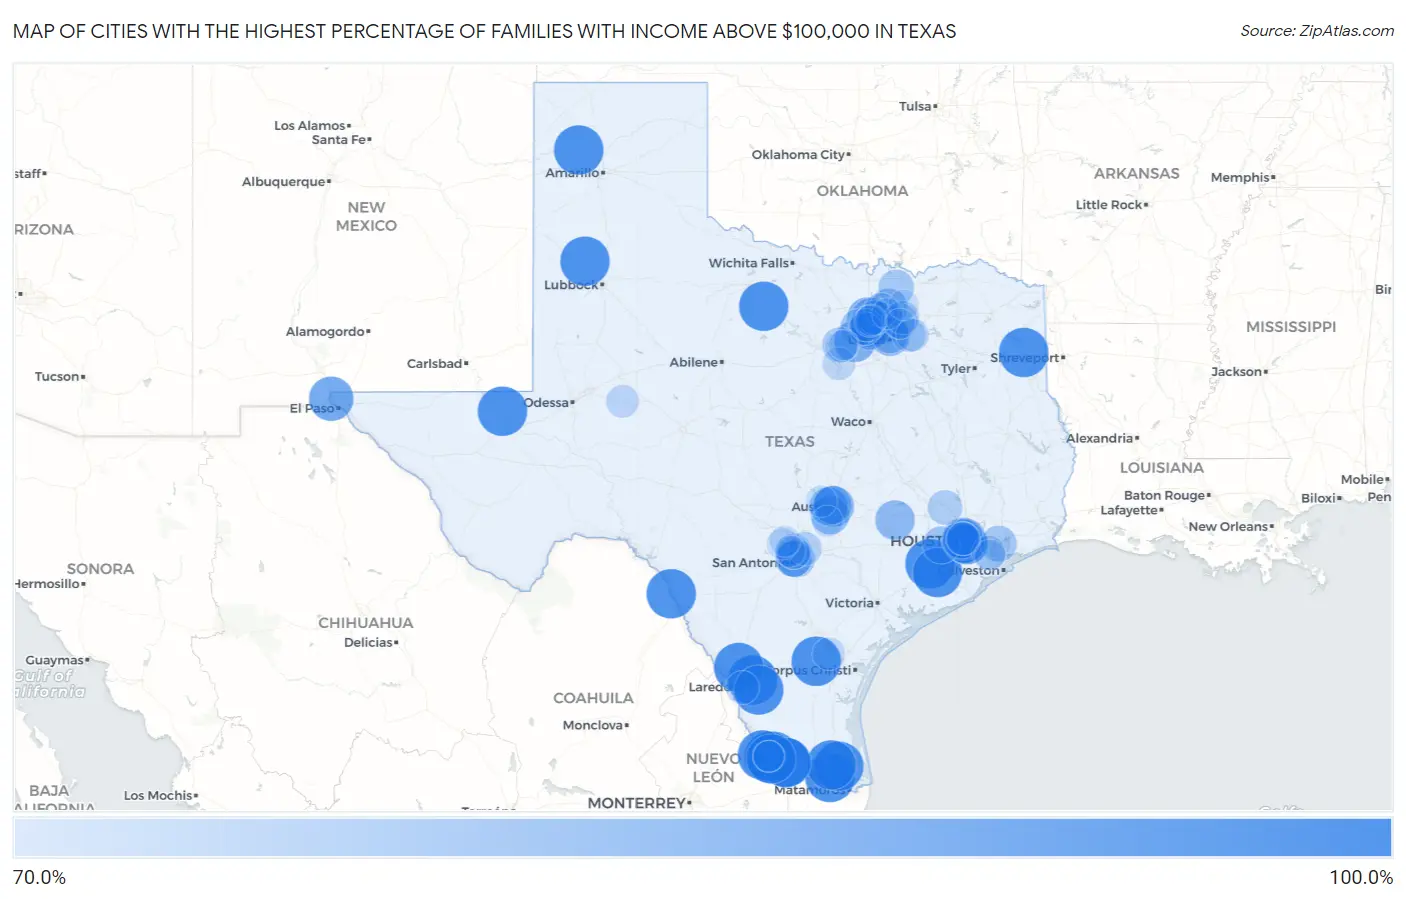
Map of Cities with the Highest Percentage of Families with Income Above $100,000 in Texas
0.0%
100.0%
Cities with the Highest Percentage of Families with Income Above $100,000 in Texas
| City | Families with Income > $100k | vs State | vs National | |
| 1. | Pablo Pena | 100.0% | 43.7%(+56.3)#1 | 46.1%(+53.9)#42 |
| 2. | Shelbyville | 100.0% | 43.7%(+56.3)#2 | 46.1%(+53.9)#68 |
| 3. | Nesbitt | 100.0% | 43.7%(+56.3)#3 | 46.1%(+53.9)#74 |
| 4. | La Rosita | 100.0% | 43.7%(+56.3)#4 | 46.1%(+53.9)#83 |
| 5. | Airport Heights | 100.0% | 43.7%(+56.3)#5 | 46.1%(+53.9)#120 |
| 6. | Los Ebanos Cdp Starr County | 100.0% | 43.7%(+56.3)#6 | 46.1%(+53.9)#123 |
| 7. | Hungerford | 100.0% | 43.7%(+56.3)#7 | 46.1%(+53.9)#127 |
| 8. | Boys Ranch | 100.0% | 43.7%(+56.3)#8 | 46.1%(+53.9)#137 |
| 9. | Owl Ranch | 100.0% | 43.7%(+56.3)#9 | 46.1%(+53.9)#148 |
| 10. | Benjamin Perez | 100.0% | 43.7%(+56.3)#10 | 46.1%(+53.9)#155 |
| 11. | Iglesia Antigua | 100.0% | 43.7%(+56.3)#11 | 46.1%(+53.9)#185 |
| 12. | Quemado | 100.0% | 43.7%(+56.3)#12 | 46.1%(+53.9)#188 |
| 13. | Evergreen | 100.0% | 43.7%(+56.3)#13 | 46.1%(+53.9)#196 |
| 14. | Lasana | 100.0% | 43.7%(+56.3)#14 | 46.1%(+53.9)#214 |
| 15. | Tierra Bonita | 100.0% | 43.7%(+56.3)#15 | 46.1%(+53.9)#236 |
| 16. | Harwood | 100.0% | 43.7%(+56.3)#16 | 46.1%(+53.9)#272 |
| 17. | Los Arcos | 100.0% | 43.7%(+56.3)#17 | 46.1%(+53.9)#288 |
| 18. | Spade | 100.0% | 43.7%(+56.3)#19 | 46.1%(+53.9)#299 |
| 19. | Brookston | 100.0% | 43.7%(+56.3)#20 | 46.1%(+53.9)#302 |
| 20. | Farnsworth | 100.0% | 43.7%(+56.3)#21 | 46.1%(+53.9)#338 |
| 21. | Sunset Acres | 100.0% | 43.7%(+56.3)#22 | 46.1%(+53.9)#342 |
| 22. | La Paloma Ranchettes | 100.0% | 43.7%(+56.3)#23 | 46.1%(+53.9)#343 |
| 23. | Aguilares | 100.0% | 43.7%(+56.3)#24 | 46.1%(+53.9)#357 |
| 24. | Mentone | 100.0% | 43.7%(+56.3)#25 | 46.1%(+53.9)#380 |
| 25. | Santel | 100.0% | 43.7%(+56.3)#26 | 46.1%(+53.9)#401 |
| 26. | Elbert | 100.0% | 43.7%(+56.3)#27 | 46.1%(+53.9)#404 |
| 27. | Iago | 100.0% | 43.7%(+56.3)#28 | 46.1%(+53.9)#411 |
| 28. | South Frydek | 94.7% | 43.7%(+51.0)#29 | 46.1%(+48.6)#457 |
| 29. | Prado Verde | 93.9% | 43.7%(+50.2)#30 | 46.1%(+47.8)#472 |
| 30. | Hunters Creek Village | 93.8% | 43.7%(+50.1)#31 | 46.1%(+47.7)#475 |
| 31. | Westover Hills | 90.3% | 43.7%(+46.6)#32 | 46.1%(+44.2)#571 |
| 32. | Southside Place | 90.0% | 43.7%(+46.3)#33 | 46.1%(+43.9)#586 |
| 33. | Dennis | 89.8% | 43.7%(+46.1)#34 | 46.1%(+43.7)#596 |
| 34. | Hebron | 89.6% | 43.7%(+45.9)#35 | 46.1%(+43.5)#604 |
| 35. | West University Place | 89.4% | 43.7%(+45.7)#36 | 46.1%(+43.3)#611 |
| 36. | Argyle | 89.1% | 43.7%(+45.4)#37 | 46.1%(+43.0)#629 |
| 37. | Piney Point Village | 89.1% | 43.7%(+45.4)#38 | 46.1%(+43.0)#634 |
| 38. | Rollingwood | 89.1% | 43.7%(+45.4)#39 | 46.1%(+43.0)#635 |
| 39. | Spring Valley Village | 88.4% | 43.7%(+44.7)#40 | 46.1%(+42.3)#667 |
| 40. | Steiner Ranch | 87.9% | 43.7%(+44.2)#41 | 46.1%(+41.8)#695 |
| 41. | Round Top | 87.9% | 43.7%(+44.2)#42 | 46.1%(+41.8)#698 |
| 42. | Southlake | 87.7% | 43.7%(+44.0)#43 | 46.1%(+41.6)#707 |
| 43. | Bellaire | 87.6% | 43.7%(+43.9)#44 | 46.1%(+41.5)#708 |
| 44. | Lantana | 87.5% | 43.7%(+43.8)#45 | 46.1%(+41.4)#714 |
| 45. | Highland Park | 87.5% | 43.7%(+43.8)#46 | 46.1%(+41.4)#715 |
| 46. | Manchaca | 87.1% | 43.7%(+43.4)#47 | 46.1%(+41.0)#739 |
| 47. | Kopperl | 86.7% | 43.7%(+43.0)#48 | 46.1%(+40.6)#771 |
| 48. | Barton Creek | 86.6% | 43.7%(+42.9)#49 | 46.1%(+40.5)#774 |
| 49. | West Lake Hills | 86.3% | 43.7%(+42.6)#50 | 46.1%(+40.2)#791 |
| 50. | Prosper | 85.7% | 43.7%(+42.0)#51 | 46.1%(+39.6)#830 |
| 51. | Alamo Beach | 85.7% | 43.7%(+42.0)#52 | 46.1%(+39.6)#838 |
| 52. | Colleyville | 85.2% | 43.7%(+41.5)#53 | 46.1%(+39.1)#874 |
| 53. | Terrell Hills | 85.2% | 43.7%(+41.5)#54 | 46.1%(+39.1)#876 |
| 54. | Fulshear | 85.1% | 43.7%(+41.4)#55 | 46.1%(+39.0)#884 |
| 55. | Bunker Hill Village | 85.1% | 43.7%(+41.4)#56 | 46.1%(+39.0)#886 |
| 56. | Haslet | 84.7% | 43.7%(+41.0)#57 | 46.1%(+38.6)#919 |
| 57. | University Park | 84.6% | 43.7%(+40.9)#58 | 46.1%(+38.5)#927 |
| 58. | Olmos Park | 84.6% | 43.7%(+40.9)#59 | 46.1%(+38.5)#933 |
| 59. | Sienna | 83.9% | 43.7%(+40.2)#60 | 46.1%(+37.8)#978 |
| 60. | Beach City | 83.8% | 43.7%(+40.1)#61 | 46.1%(+37.7)#989 |
| 61. | Trophy Club | 83.7% | 43.7%(+40.0)#62 | 46.1%(+37.6)#997 |
| 62. | Alamo Heights | 83.6% | 43.7%(+39.9)#63 | 46.1%(+37.5)#1,005 |
| 63. | Parker | 83.3% | 43.7%(+39.6)#64 | 46.1%(+37.2)#1,036 |
| 64. | Dorchester | 83.3% | 43.7%(+39.6)#65 | 46.1%(+37.2)#1,046 |
| 65. | Annetta | 83.1% | 43.7%(+39.4)#66 | 46.1%(+37.0)#1,063 |
| 66. | Hollywood Park | 83.0% | 43.7%(+39.3)#67 | 46.1%(+36.9)#1,070 |
| 67. | Todd Mission | 82.1% | 43.7%(+38.4)#68 | 46.1%(+36.0)#1,165 |
| 68. | Highland Village | 81.6% | 43.7%(+37.9)#69 | 46.1%(+35.5)#1,213 |
| 69. | Paloma Creek South | 81.4% | 43.7%(+37.7)#70 | 46.1%(+35.3)#1,238 |
| 70. | Taylor Lake Village | 81.2% | 43.7%(+37.5)#71 | 46.1%(+35.1)#1,269 |
| 71. | Heath | 81.1% | 43.7%(+37.4)#72 | 46.1%(+35.0)#1,279 |
| 72. | Belterra | 80.8% | 43.7%(+37.1)#73 | 46.1%(+34.7)#1,306 |
| 73. | Lucas | 80.7% | 43.7%(+37.0)#74 | 46.1%(+34.6)#1,314 |
| 74. | Garden Ridge | 80.6% | 43.7%(+36.9)#75 | 46.1%(+34.5)#1,323 |
| 75. | Hilshire Village | 80.4% | 43.7%(+36.7)#76 | 46.1%(+34.3)#1,347 |
| 76. | Tanquecitos South Acres | 80.3% | 43.7%(+36.6)#77 | 46.1%(+34.2)#1,354 |
| 77. | Keller | 80.1% | 43.7%(+36.4)#78 | 46.1%(+34.0)#1,365 |
| 78. | Mclendon Chisholm | 80.0% | 43.7%(+36.3)#79 | 46.1%(+33.9)#1,376 |
| 79. | Hill Country Village | 80.0% | 43.7%(+36.3)#80 | 46.1%(+33.9)#1,380 |
| 80. | Hedwig Village | 79.8% | 43.7%(+36.1)#81 | 46.1%(+33.7)#1,398 |
| 81. | Garden City | 79.8% | 43.7%(+36.1)#82 | 46.1%(+33.7)#1,406 |
| 82. | Decordova | 79.7% | 43.7%(+36.0)#83 | 46.1%(+33.6)#1,413 |
| 83. | Sandia | 79.7% | 43.7%(+36.0)#84 | 46.1%(+33.6)#1,417 |
| 84. | Westlake | 79.3% | 43.7%(+35.6)#85 | 46.1%(+33.2)#1,471 |
| 85. | Magnolia Beach | 79.3% | 43.7%(+35.6)#86 | 46.1%(+33.2)#1,475 |
| 86. | Annetta South | 79.0% | 43.7%(+35.3)#87 | 46.1%(+32.9)#1,508 |
| 87. | Lakeway | 78.2% | 43.7%(+34.5)#88 | 46.1%(+32.1)#1,604 |
| 88. | Scenic Oaks | 78.2% | 43.7%(+34.5)#89 | 46.1%(+32.1)#1,608 |
| 89. | Miguel Barrera | 78.1% | 43.7%(+34.4)#90 | 46.1%(+32.0)#1,628 |
| 90. | Mountain City | 78.0% | 43.7%(+34.3)#91 | 46.1%(+31.9)#1,642 |
| 91. | Flower Mound | 77.9% | 43.7%(+34.2)#92 | 46.1%(+31.8)#1,644 |
| 92. | Frisco | 77.8% | 43.7%(+34.1)#93 | 46.1%(+31.7)#1,661 |
| 93. | Shavano Park | 77.7% | 43.7%(+34.0)#94 | 46.1%(+31.6)#1,683 |
| 94. | Fair Oaks Ranch | 77.6% | 43.7%(+33.9)#95 | 46.1%(+31.5)#1,692 |
| 95. | Double Oak | 77.4% | 43.7%(+33.7)#96 | 46.1%(+31.3)#1,719 |
| 96. | Rancho Viejo | 77.4% | 43.7%(+33.7)#97 | 46.1%(+31.3)#1,727 |
| 97. | Clear Lake Shores | 77.3% | 43.7%(+33.6)#98 | 46.1%(+31.2)#1,738 |
| 98. | Melissa | 77.2% | 43.7%(+33.5)#99 | 46.1%(+31.1)#1,746 |
| 99. | Aledo | 77.1% | 43.7%(+33.4)#100 | 46.1%(+31.0)#1,759 |
| 100. | Murphy | 76.9% | 43.7%(+33.2)#101 | 46.1%(+30.8)#1,780 |
Common Questions
What are the Top 10 Cities with the Highest Percentage of Families with Income Above $100,000 in Texas?
Top 10 Cities with the Highest Percentage of Families with Income Above $100,000 in Texas are:
#1
100.0%
#2
100.0%
#3
100.0%
#4
100.0%
#5
100.0%
#6
100.0%
#7
100.0%
#8
100.0%
#9
100.0%
#10
100.0%
What city has the Highest Percentage of Families with Income Above $100,000 in Texas?
Pablo Pena has the Highest Percentage of Families with Income Above $100,000 in Texas with 100.0%.
What is the Percentage of Families with Income Above $100,000 in the State of Texas?
Percentage of Families with Income Above $100,000 in Texas is 43.7%.
What is the Percentage of Families with Income Above $100,000 in the United States?
Percentage of Families with Income Above $100,000 in the United States is 46.1%.