Cities with the Highest Percentage of Families with Income Above $100,000 in New York
RELATED REPORTS & OPTIONS
Family Income | $100k+
New York
Compare Cities
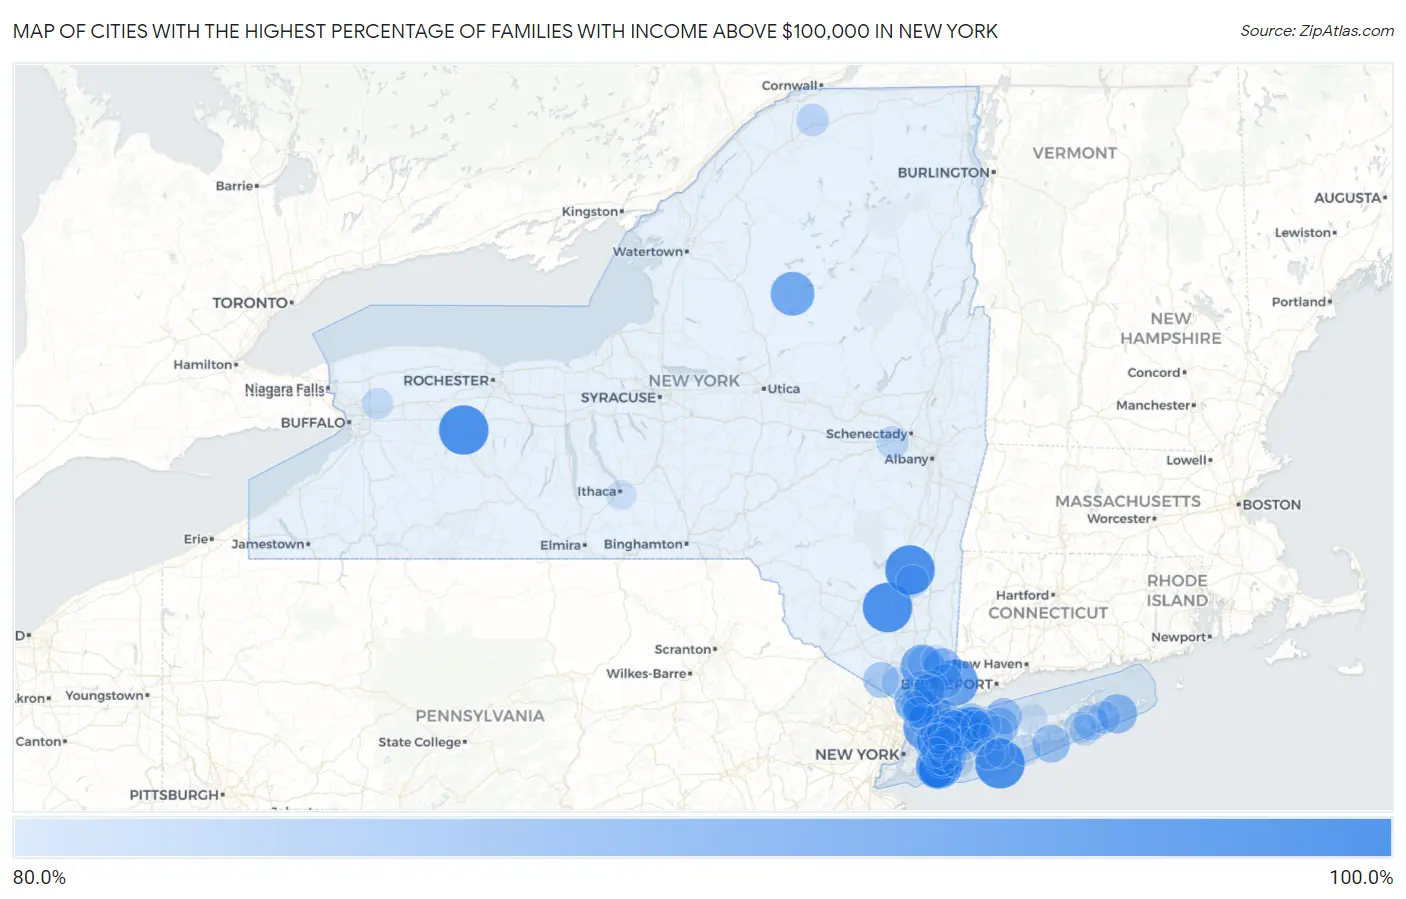
Map of Cities with the Highest Percentage of Families with Income Above $100,000 in New York
0.0%
100.0%
Cities with the Highest Percentage of Families with Income Above $100,000 in New York
| City | Families with Income > $100k | vs State | vs National | |
| 1. | Bard College | 100.0% | 50.3%(+49.7)#1 | 46.1%(+53.9)#2 |
| 2. | Vassar College | 100.0% | 50.3%(+49.7)#2 | 46.1%(+53.9)#11 |
| 3. | Gardiner | 100.0% | 50.3%(+49.7)#3 | 46.1%(+53.9)#17 |
| 4. | Rhinecliff | 100.0% | 50.3%(+49.7)#4 | 46.1%(+53.9)#34 |
| 5. | Danby | 100.0% | 50.3%(+49.7)#5 | 46.1%(+53.9)#41 |
| 6. | Captree | 100.0% | 50.3%(+49.7)#6 | 46.1%(+53.9)#52 |
| 7. | Retsof | 100.0% | 50.3%(+49.7)#7 | 46.1%(+53.9)#62 |
| 8. | Copake | 100.0% | 50.3%(+49.7)#8 | 46.1%(+53.9)#63 |
| 9. | Oak Beach | 100.0% | 50.3%(+49.7)#9 | 46.1%(+53.9)#143 |
| 10. | Upper Red Hook | 100.0% | 50.3%(+49.7)#10 | 46.1%(+53.9)#193 |
| 11. | White Lake | 100.0% | 50.3%(+49.7)#11 | 46.1%(+53.9)#203 |
| 12. | Ocean Beach | 100.0% | 50.3%(+49.7)#12 | 46.1%(+53.9)#340 |
| 13. | Scotts Corners | 97.0% | 50.3%(+46.7)#13 | 46.1%(+50.9)#433 |
| 14. | Pelham Manor | 96.6% | 50.3%(+46.3)#14 | 46.1%(+50.5)#434 |
| 15. | Hewlett Bay Park | 96.1% | 50.3%(+45.8)#15 | 46.1%(+50.0)#445 |
| 16. | Hewlett Harbor | 94.7% | 50.3%(+44.4)#16 | 46.1%(+48.6)#456 |
| 17. | Old Forge | 94.6% | 50.3%(+44.3)#17 | 46.1%(+48.5)#460 |
| 18. | Crompond | 94.4% | 50.3%(+44.1)#18 | 46.1%(+48.3)#462 |
| 19. | Woodsburgh | 93.7% | 50.3%(+43.4)#19 | 46.1%(+47.6)#481 |
| 20. | Laurel Hollow | 93.2% | 50.3%(+42.9)#20 | 46.1%(+47.1)#490 |
| 21. | Scarsdale | 92.9% | 50.3%(+42.6)#21 | 46.1%(+46.8)#493 |
| 22. | Cold Spring Harbor | 92.7% | 50.3%(+42.4)#22 | 46.1%(+46.6)#498 |
| 23. | Plandome Heights | 92.7% | 50.3%(+42.4)#23 | 46.1%(+46.6)#500 |
| 24. | Shorehaven | 92.4% | 50.3%(+42.1)#24 | 46.1%(+46.3)#506 |
| 25. | Halesite | 92.3% | 50.3%(+42.0)#25 | 46.1%(+46.2)#507 |
| 26. | East Hills | 91.7% | 50.3%(+41.4)#26 | 46.1%(+45.6)#520 |
| 27. | Cove Neck | 91.7% | 50.3%(+41.4)#27 | 46.1%(+45.6)#525 |
| 28. | Hewlett Neck | 91.5% | 50.3%(+41.2)#28 | 46.1%(+45.4)#528 |
| 29. | Haines Falls | 91.4% | 50.3%(+41.1)#29 | 46.1%(+45.3)#531 |
| 30. | North Hills | 90.9% | 50.3%(+40.6)#30 | 46.1%(+44.8)#544 |
| 31. | East Norwich | 90.7% | 50.3%(+40.4)#31 | 46.1%(+44.6)#553 |
| 32. | Grand View On Hudson | 90.6% | 50.3%(+40.3)#32 | 46.1%(+44.5)#558 |
| 33. | Otter Lake | 90.5% | 50.3%(+40.2)#33 | 46.1%(+44.4)#560 |
| 34. | Amagansett | 90.4% | 50.3%(+40.1)#34 | 46.1%(+44.3)#566 |
| 35. | Brookville | 90.0% | 50.3%(+39.7)#35 | 46.1%(+43.9)#584 |
| 36. | Malverne Park Oaks | 89.8% | 50.3%(+39.5)#36 | 46.1%(+43.7)#597 |
| 37. | Oyster Bay Cove | 89.7% | 50.3%(+39.4)#37 | 46.1%(+43.6)#600 |
| 38. | Golden S Bridge | 89.6% | 50.3%(+39.3)#38 | 46.1%(+43.5)#603 |
| 39. | West Kill | 89.5% | 50.3%(+39.2)#39 | 46.1%(+43.4)#610 |
| 40. | Ardsley | 89.4% | 50.3%(+39.1)#40 | 46.1%(+43.3)#613 |
| 41. | Rye | 89.3% | 50.3%(+39.0)#41 | 46.1%(+43.2)#615 |
| 42. | Lake Success | 89.3% | 50.3%(+39.0)#42 | 46.1%(+43.2)#618 |
| 43. | Irvington | 89.0% | 50.3%(+38.7)#43 | 46.1%(+42.9)#637 |
| 44. | West Hampton Dunes | 88.9% | 50.3%(+38.6)#44 | 46.1%(+42.8)#646 |
| 45. | Setauket | 88.7% | 50.3%(+38.4)#45 | 46.1%(+42.6)#648 |
| 46. | Head Of The Harbor | 88.7% | 50.3%(+38.4)#46 | 46.1%(+42.6)#650 |
| 47. | Munsey Park | 88.6% | 50.3%(+38.3)#47 | 46.1%(+42.5)#657 |
| 48. | Harbor Hills | 88.2% | 50.3%(+37.9)#48 | 46.1%(+42.1)#684 |
| 49. | South Hempstead | 88.1% | 50.3%(+37.8)#49 | 46.1%(+42.0)#690 |
| 50. | Old Field | 87.8% | 50.3%(+37.5)#50 | 46.1%(+41.7)#706 |
| 51. | Lawrence | 87.5% | 50.3%(+37.2)#51 | 46.1%(+41.4)#716 |
| 52. | Tuxedo Park | 87.3% | 50.3%(+37.0)#52 | 46.1%(+41.2)#729 |
| 53. | Huntington Bay | 87.2% | 50.3%(+36.9)#53 | 46.1%(+41.1)#734 |
| 54. | Eatons Neck | 87.2% | 50.3%(+36.9)#54 | 46.1%(+41.1)#735 |
| 55. | Plandome | 87.1% | 50.3%(+36.8)#55 | 46.1%(+41.0)#741 |
| 56. | Woodbourne | 86.9% | 50.3%(+36.6)#56 | 46.1%(+40.8)#756 |
| 57. | Briarcliff Manor | 86.7% | 50.3%(+36.4)#57 | 46.1%(+40.6)#764 |
| 58. | Water Mill | 86.6% | 50.3%(+36.3)#58 | 46.1%(+40.5)#775 |
| 59. | Garden City | 86.5% | 50.3%(+36.2)#59 | 46.1%(+40.4)#779 |
| 60. | Flower Hill | 86.5% | 50.3%(+36.2)#60 | 46.1%(+40.4)#782 |
| 61. | Sands Point | 86.5% | 50.3%(+36.2)#61 | 46.1%(+40.4)#784 |
| 62. | Lattingtown | 86.5% | 50.3%(+36.2)#62 | 46.1%(+40.4)#785 |
| 63. | Bedford | 86.0% | 50.3%(+35.7)#63 | 46.1%(+39.9)#816 |
| 64. | Chappaqua | 85.9% | 50.3%(+35.6)#64 | 46.1%(+39.8)#820 |
| 65. | Upper Brookville | 85.9% | 50.3%(+35.6)#65 | 46.1%(+39.8)#823 |
| 66. | Old Westbury | 85.8% | 50.3%(+35.5)#66 | 46.1%(+39.7)#827 |
| 67. | Saddle Rock Estates | 85.8% | 50.3%(+35.5)#67 | 46.1%(+39.7)#829 |
| 68. | Village Of The Branch | 85.5% | 50.3%(+35.2)#68 | 46.1%(+39.4)#849 |
| 69. | Mill Neck | 85.4% | 50.3%(+35.1)#69 | 46.1%(+39.3)#863 |
| 70. | East Williston | 85.2% | 50.3%(+34.9)#70 | 46.1%(+39.1)#879 |
| 71. | Plainview | 85.1% | 50.3%(+34.8)#71 | 46.1%(+39.0)#883 |
| 72. | Roslyn Heights | 85.0% | 50.3%(+34.7)#72 | 46.1%(+38.9)#891 |
| 73. | Sea Cliff | 84.9% | 50.3%(+34.6)#73 | 46.1%(+38.8)#902 |
| 74. | Shrub Oak | 84.9% | 50.3%(+34.6)#74 | 46.1%(+38.8)#903 |
| 75. | Wainscott | 84.8% | 50.3%(+34.5)#75 | 46.1%(+38.7)#912 |
| 76. | Staatsburg | 84.5% | 50.3%(+34.2)#76 | 46.1%(+38.4)#939 |
| 77. | Winthrop | 84.5% | 50.3%(+34.2)#77 | 46.1%(+38.4)#940 |
| 78. | Duane Lake | 84.3% | 50.3%(+34.0)#78 | 46.1%(+38.2)#953 |
| 79. | Pleasantville | 84.1% | 50.3%(+33.8)#79 | 46.1%(+38.0)#962 |
| 80. | Shinnecock Hills | 83.7% | 50.3%(+33.4)#80 | 46.1%(+37.6)#1,000 |
| 81. | Centerport | 83.6% | 50.3%(+33.3)#81 | 46.1%(+37.5)#1,006 |
| 82. | Fort Salonga | 83.4% | 50.3%(+33.1)#82 | 46.1%(+37.3)#1,022 |
| 83. | Pomona | 83.4% | 50.3%(+33.1)#83 | 46.1%(+37.3)#1,023 |
| 84. | Brightwaters | 83.4% | 50.3%(+33.1)#84 | 46.1%(+37.3)#1,025 |
| 85. | Crest View Heights | 83.4% | 50.3%(+33.1)#85 | 46.1%(+37.3)#1,026 |
| 86. | Bellport | 83.4% | 50.3%(+33.1)#86 | 46.1%(+37.3)#1,027 |
| 87. | Dix Hills | 83.3% | 50.3%(+33.0)#87 | 46.1%(+37.2)#1,033 |
| 88. | Bronxville | 83.3% | 50.3%(+33.0)#88 | 46.1%(+37.2)#1,034 |
| 89. | Clarence Center | 83.3% | 50.3%(+33.0)#89 | 46.1%(+37.2)#1,037 |
| 90. | Sparkill | 83.3% | 50.3%(+33.0)#90 | 46.1%(+37.2)#1,040 |
| 91. | Bellmore | 83.2% | 50.3%(+32.9)#91 | 46.1%(+37.1)#1,049 |
| 92. | Southampton | 83.2% | 50.3%(+32.9)#92 | 46.1%(+37.1)#1,054 |
| 93. | Hastings On Hudson | 83.0% | 50.3%(+32.7)#93 | 46.1%(+36.9)#1,069 |
| 94. | Plandome Manor | 82.5% | 50.3%(+32.2)#94 | 46.1%(+36.4)#1,111 |
| 95. | Great River | 82.4% | 50.3%(+32.1)#95 | 46.1%(+36.3)#1,120 |
| 96. | Lincolndale | 82.4% | 50.3%(+32.1)#96 | 46.1%(+36.3)#1,121 |
| 97. | East Shoreham | 82.3% | 50.3%(+32.0)#97 | 46.1%(+36.2)#1,127 |
| 98. | South Hill | 82.3% | 50.3%(+32.0)#98 | 46.1%(+36.2)#1,129 |
| 99. | Bellerose | 82.3% | 50.3%(+32.0)#99 | 46.1%(+36.2)#1,133 |
| 100. | Malverne | 82.2% | 50.3%(+31.9)#100 | 46.1%(+36.1)#1,140 |
Common Questions
What are the Top 10 Cities with the Highest Percentage of Families with Income Above $100,000 in New York?
Top 10 Cities with the Highest Percentage of Families with Income Above $100,000 in New York are:
#1
100.0%
#2
100.0%
#3
100.0%
#4
100.0%
#5
97.0%
#6
96.6%
#7
96.1%
#8
94.7%
#9
94.6%
#10
94.4%
What city has the Highest Percentage of Families with Income Above $100,000 in New York?
Gardiner has the Highest Percentage of Families with Income Above $100,000 in New York with 100.0%.
What is the Percentage of Families with Income Above $100,000 in the State of New York?
Percentage of Families with Income Above $100,000 in New York is 50.3%.
What is the Percentage of Families with Income Above $100,000 in the United States?
Percentage of Families with Income Above $100,000 in the United States is 46.1%.