Cities with the Highest Percentage of Families with Income Above $100,000 in Massachusetts
RELATED REPORTS & OPTIONS
Family Income | $100k+
Massachusetts
Compare Cities
Map of Cities with the Highest Percentage of Families with Income Above $100,000 in Massachusetts
0.0%
100.0%
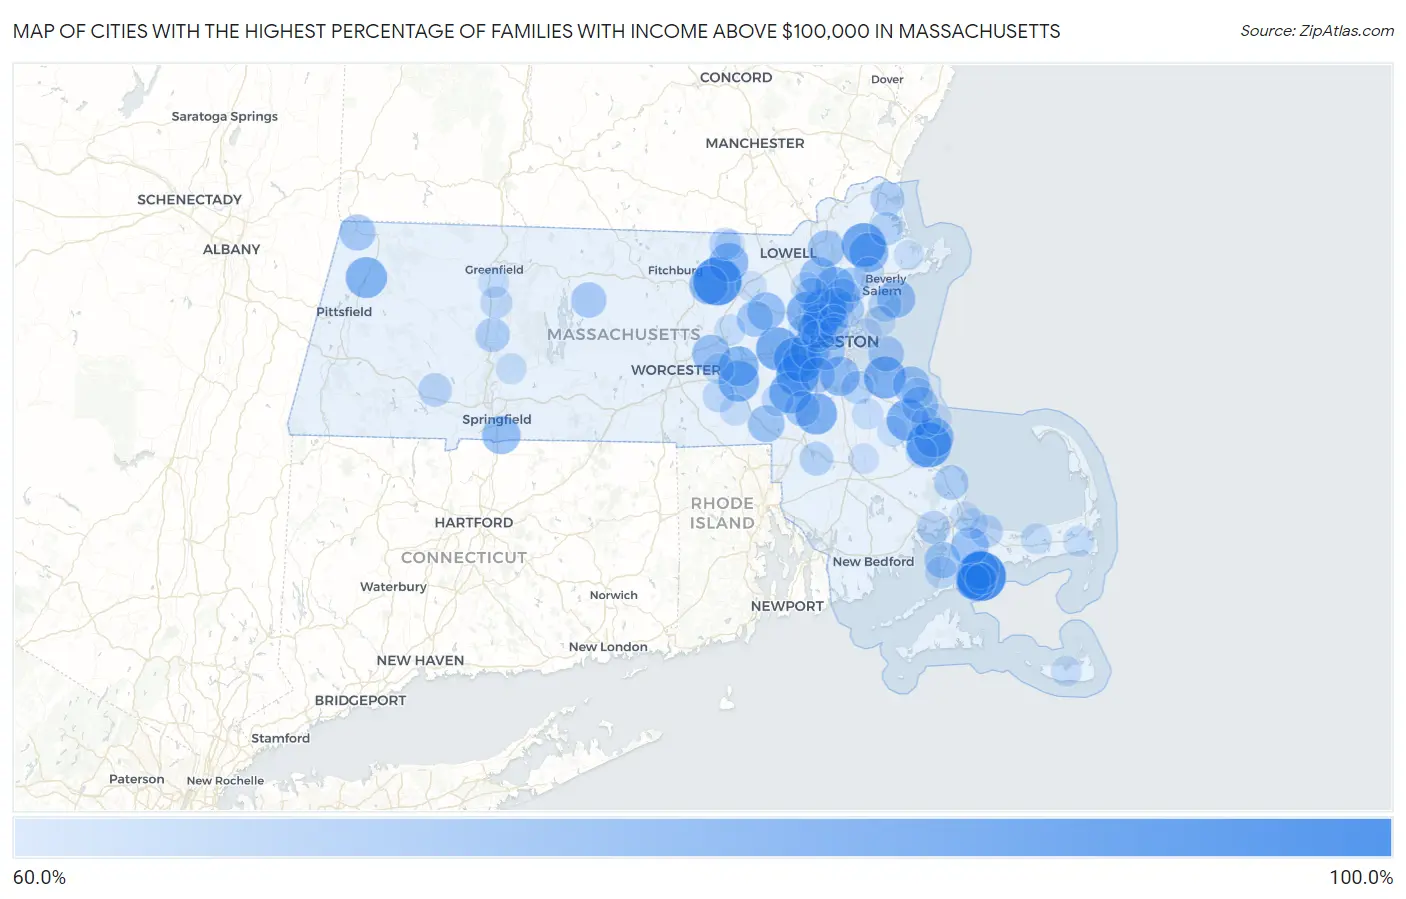
Cities with the Highest Percentage of Families with Income Above $100,000 in Massachusetts
| City | Families with Income > $100k | vs State | vs National | |
| 1. | Popponesset Island | 100.0% | 59.5%(+40.5)#1 | 46.1%(+53.9)#230 |
| 2. | Devens | 97.4% | 59.5%(+37.9)#2 | 46.1%(+51.3)#430 |
| 3. | South Duxbury | 91.7% | 59.5%(+32.2)#3 | 46.1%(+45.6)#521 |
| 4. | Boxford | 89.7% | 59.5%(+30.2)#4 | 46.1%(+43.6)#599 |
| 5. | Winchester | 88.2% | 59.5%(+28.7)#5 | 46.1%(+42.1)#680 |
| 6. | Cochituate | 87.8% | 59.5%(+28.3)#6 | 46.1%(+41.7)#703 |
| 7. | Wellesley | 87.0% | 59.5%(+27.5)#7 | 46.1%(+40.9)#745 |
| 8. | Dover | 86.9% | 59.5%(+27.4)#8 | 46.1%(+40.8)#755 |
| 9. | Hingham | 86.1% | 59.5%(+26.6)#9 | 46.1%(+40.0)#812 |
| 10. | North Pembroke | 85.7% | 59.5%(+26.2)#10 | 46.1%(+39.6)#831 |
| 11. | Lexington | 85.6% | 59.5%(+26.1)#11 | 46.1%(+39.5)#845 |
| 12. | Medfield | 85.4% | 59.5%(+25.9)#12 | 46.1%(+39.3)#856 |
| 13. | Sharon | 85.2% | 59.5%(+25.7)#13 | 46.1%(+39.1)#875 |
| 14. | Green Harbor | 85.0% | 59.5%(+25.5)#14 | 46.1%(+38.9)#897 |
| 15. | Cheshire | 84.3% | 59.5%(+24.8)#15 | 46.1%(+38.2)#952 |
| 16. | Hopkinton | 84.0% | 59.5%(+24.5)#16 | 46.1%(+37.9)#968 |
| 17. | Cordaville | 82.2% | 59.5%(+22.7)#17 | 46.1%(+36.1)#1,142 |
| 18. | Needham | 82.1% | 59.5%(+22.6)#18 | 46.1%(+36.0)#1,151 |
| 19. | Duxbury | 82.1% | 59.5%(+22.6)#19 | 46.1%(+36.0)#1,159 |
| 20. | Topsfield | 81.4% | 59.5%(+21.9)#20 | 46.1%(+35.3)#1,242 |
| 21. | Newton | 81.3% | 59.5%(+21.8)#21 | 46.1%(+35.2)#1,247 |
| 22. | Milton | 81.3% | 59.5%(+21.8)#22 | 46.1%(+35.2)#1,249 |
| 23. | New Seabury | 81.1% | 59.5%(+21.6)#23 | 46.1%(+35.0)#1,282 |
| 24. | Belmont | 81.0% | 59.5%(+21.5)#24 | 46.1%(+34.9)#1,285 |
| 25. | Groton | 81.0% | 59.5%(+21.5)#25 | 46.1%(+34.9)#1,292 |
| 26. | Reading | 80.7% | 59.5%(+21.2)#26 | 46.1%(+34.6)#1,311 |
| 27. | Shirley | 80.2% | 59.5%(+20.7)#27 | 46.1%(+34.1)#1,362 |
| 28. | Cedar Crest | 80.1% | 59.5%(+20.6)#28 | 46.1%(+34.0)#1,368 |
| 29. | Longmeadow | 79.5% | 59.5%(+20.0)#29 | 46.1%(+33.4)#1,432 |
| 30. | Mashpee Neck | 79.1% | 59.5%(+19.6)#30 | 46.1%(+33.0)#1,502 |
| 31. | Wilmington | 78.8% | 59.5%(+19.3)#31 | 46.1%(+32.7)#1,530 |
| 32. | Marblehead | 78.8% | 59.5%(+19.3)#32 | 46.1%(+32.7)#1,531 |
| 33. | Northborough | 78.7% | 59.5%(+19.2)#33 | 46.1%(+32.6)#1,546 |
| 34. | West Concord | 78.3% | 59.5%(+18.8)#34 | 46.1%(+32.2)#1,594 |
| 35. | Forestdale | 78.0% | 59.5%(+18.5)#35 | 46.1%(+31.9)#1,639 |
| 36. | Brookline | 77.6% | 59.5%(+18.1)#36 | 46.1%(+31.5)#1,685 |
| 37. | North Scituate | 77.4% | 59.5%(+17.9)#37 | 46.1%(+31.3)#1,716 |
| 38. | Franklin Town | 76.9% | 59.5%(+17.4)#38 | 46.1%(+30.8)#1,778 |
| 39. | Andover | 76.8% | 59.5%(+17.3)#39 | 46.1%(+30.7)#1,796 |
| 40. | Arlington | 76.7% | 59.5%(+17.2)#40 | 46.1%(+30.6)#1,805 |
| 41. | Marshfield Hills | 76.6% | 59.5%(+17.1)#41 | 46.1%(+30.5)#1,829 |
| 42. | Williamstown | 75.5% | 59.5%(+16.0)#42 | 46.1%(+29.4)#1,990 |
| 43. | Maynard | 75.3% | 59.5%(+15.8)#43 | 46.1%(+29.2)#2,018 |
| 44. | North Falmouth | 75.3% | 59.5%(+15.8)#44 | 46.1%(+29.2)#2,020 |
| 45. | Melrose | 74.6% | 59.5%(+15.1)#45 | 46.1%(+28.5)#2,134 |
| 46. | Hull | 74.3% | 59.5%(+14.8)#46 | 46.1%(+28.2)#2,179 |
| 47. | Petersham | 74.2% | 59.5%(+14.7)#47 | 46.1%(+28.1)#2,200 |
| 48. | Wakefield | 74.1% | 59.5%(+14.6)#48 | 46.1%(+28.0)#2,208 |
| 49. | Dedham | 74.1% | 59.5%(+14.6)#49 | 46.1%(+28.0)#2,209 |
| 50. | Walpole | 73.9% | 59.5%(+14.4)#50 | 46.1%(+27.8)#2,240 |
| 51. | Monomoscoy Island | 73.8% | 59.5%(+14.3)#51 | 46.1%(+27.7)#2,265 |
| 52. | Stoneham | 72.8% | 59.5%(+13.3)#52 | 46.1%(+26.7)#2,398 |
| 53. | The Pinehills | 72.8% | 59.5%(+13.3)#53 | 46.1%(+26.7)#2,407 |
| 54. | Lynnfield | 72.7% | 59.5%(+13.2)#54 | 46.1%(+26.6)#2,420 |
| 55. | Hatfield | 72.3% | 59.5%(+12.8)#55 | 46.1%(+26.2)#2,501 |
| 56. | Burlington | 71.7% | 59.5%(+12.2)#56 | 46.1%(+25.6)#2,598 |
| 57. | Newburyport | 71.6% | 59.5%(+12.1)#57 | 46.1%(+25.5)#2,617 |
| 58. | Norton Center | 71.1% | 59.5%(+11.6)#58 | 46.1%(+25.0)#2,707 |
| 59. | Rowley | 71.0% | 59.5%(+11.5)#59 | 46.1%(+24.9)#2,723 |
| 60. | Russell | 70.7% | 59.5%(+11.2)#60 | 46.1%(+24.6)#2,773 |
| 61. | Swampscott | 70.5% | 59.5%(+11.0)#61 | 46.1%(+24.4)#2,803 |
| 62. | Onset | 70.4% | 59.5%(+10.9)#62 | 46.1%(+24.3)#2,825 |
| 63. | East Sandwich | 70.3% | 59.5%(+10.8)#63 | 46.1%(+24.2)#2,837 |
| 64. | Braintree Town | 70.1% | 59.5%(+10.6)#64 | 46.1%(+24.0)#2,860 |
| 65. | Cambridge | 69.8% | 59.5%(+10.3)#65 | 46.1%(+23.7)#2,908 |
| 66. | North Attleborough | 69.1% | 59.5%(+9.60)#66 | 46.1%(+23.0)#3,026 |
| 67. | Upton | 68.7% | 59.5%(+9.20)#67 | 46.1%(+22.6)#3,109 |
| 68. | Millis Clicquot | 68.6% | 59.5%(+9.10)#68 | 46.1%(+22.5)#3,124 |
| 69. | West Falmouth | 68.5% | 59.5%(+9.00)#69 | 46.1%(+22.4)#3,151 |
| 70. | Pepperell | 68.4% | 59.5%(+8.90)#70 | 46.1%(+22.3)#3,172 |
| 71. | South Deerfield | 68.3% | 59.5%(+8.80)#71 | 46.1%(+22.2)#3,198 |
| 72. | Scituate | 68.2% | 59.5%(+8.70)#72 | 46.1%(+22.1)#3,211 |
| 73. | Watertown Town | 68.1% | 59.5%(+8.60)#73 | 46.1%(+22.0)#3,227 |
| 74. | Kingston | 67.9% | 59.5%(+8.40)#74 | 46.1%(+21.8)#3,268 |
| 75. | Popponesset | 67.3% | 59.5%(+7.80)#75 | 46.1%(+21.2)#3,375 |
| 76. | East Harwich | 66.8% | 59.5%(+7.30)#76 | 46.1%(+20.7)#3,435 |
| 77. | Westborough | 66.8% | 59.5%(+7.30)#77 | 46.1%(+20.7)#3,438 |
| 78. | Hudson | 66.7% | 59.5%(+7.20)#78 | 46.1%(+20.6)#3,448 |
| 79. | Pinehurst | 66.7% | 59.5%(+7.20)#79 | 46.1%(+20.6)#3,453 |
| 80. | Deerfield | 66.6% | 59.5%(+7.10)#80 | 46.1%(+20.5)#3,512 |
| 81. | Abington | 66.5% | 59.5%(+7.00)#81 | 46.1%(+20.4)#3,530 |
| 82. | Hopedale | 66.5% | 59.5%(+7.00)#82 | 46.1%(+20.4)#3,534 |
| 83. | Yarmouth Port | 66.4% | 59.5%(+6.90)#83 | 46.1%(+20.3)#3,548 |
| 84. | Granby | 66.3% | 59.5%(+6.80)#84 | 46.1%(+20.2)#3,567 |
| 85. | Sandwich | 66.2% | 59.5%(+6.70)#85 | 46.1%(+20.1)#3,578 |
| 86. | Littleton Common | 66.1% | 59.5%(+6.60)#86 | 46.1%(+20.0)#3,599 |
| 87. | Winthrop Town | 66.0% | 59.5%(+6.50)#87 | 46.1%(+19.9)#3,611 |
| 88. | East Pepperell | 66.0% | 59.5%(+6.50)#88 | 46.1%(+19.9)#3,617 |
| 89. | Waltham | 65.9% | 59.5%(+6.40)#89 | 46.1%(+19.8)#3,632 |
| 90. | Nahant | 65.9% | 59.5%(+6.40)#90 | 46.1%(+19.8)#3,641 |
| 91. | Hanson | 65.9% | 59.5%(+6.40)#91 | 46.1%(+19.8)#3,646 |
| 92. | Nantucket | 65.8% | 59.5%(+6.30)#92 | 46.1%(+19.7)#3,659 |
| 93. | Ocean Bluff Brant Rock | 65.8% | 59.5%(+6.30)#93 | 46.1%(+19.7)#3,665 |
| 94. | Marshfield | 65.7% | 59.5%(+6.20)#94 | 46.1%(+19.6)#3,689 |
| 95. | Somerville | 65.6% | 59.5%(+6.10)#95 | 46.1%(+19.5)#3,706 |
| 96. | Danvers | 65.6% | 59.5%(+6.10)#96 | 46.1%(+19.5)#3,711 |
| 97. | Medford | 65.5% | 59.5%(+6.00)#97 | 46.1%(+19.4)#3,730 |
| 98. | Bridgewater Town | 65.5% | 59.5%(+6.00)#98 | 46.1%(+19.4)#3,732 |
| 99. | Essex | 65.2% | 59.5%(+5.70)#99 | 46.1%(+19.1)#3,798 |
| 100. | Sagamore | 64.8% | 59.5%(+5.30)#100 | 46.1%(+18.7)#3,880 |
Common Questions
What are the Top 10 Cities with the Highest Percentage of Families with Income Above $100,000 in Massachusetts?
Top 10 Cities with the Highest Percentage of Families with Income Above $100,000 in Massachusetts are:
#1
100.0%
#2
97.4%
#3
91.7%
#4
89.7%
#5
88.2%
#6
87.8%
#7
87.0%
#8
86.9%
#9
86.1%
#10
85.7%
What city has the Highest Percentage of Families with Income Above $100,000 in Massachusetts?
Popponesset Island has the Highest Percentage of Families with Income Above $100,000 in Massachusetts with 100.0%.
What is the Percentage of Families with Income Above $100,000 in the State of Massachusetts?
Percentage of Families with Income Above $100,000 in Massachusetts is 59.5%.
What is the Percentage of Families with Income Above $100,000 in the United States?
Percentage of Families with Income Above $100,000 in the United States is 46.1%.