Cities with the Highest Percentage of Families with Income Above $100,000 in Montana
RELATED REPORTS & OPTIONS
Family Income | $100k+
Montana
Compare Cities
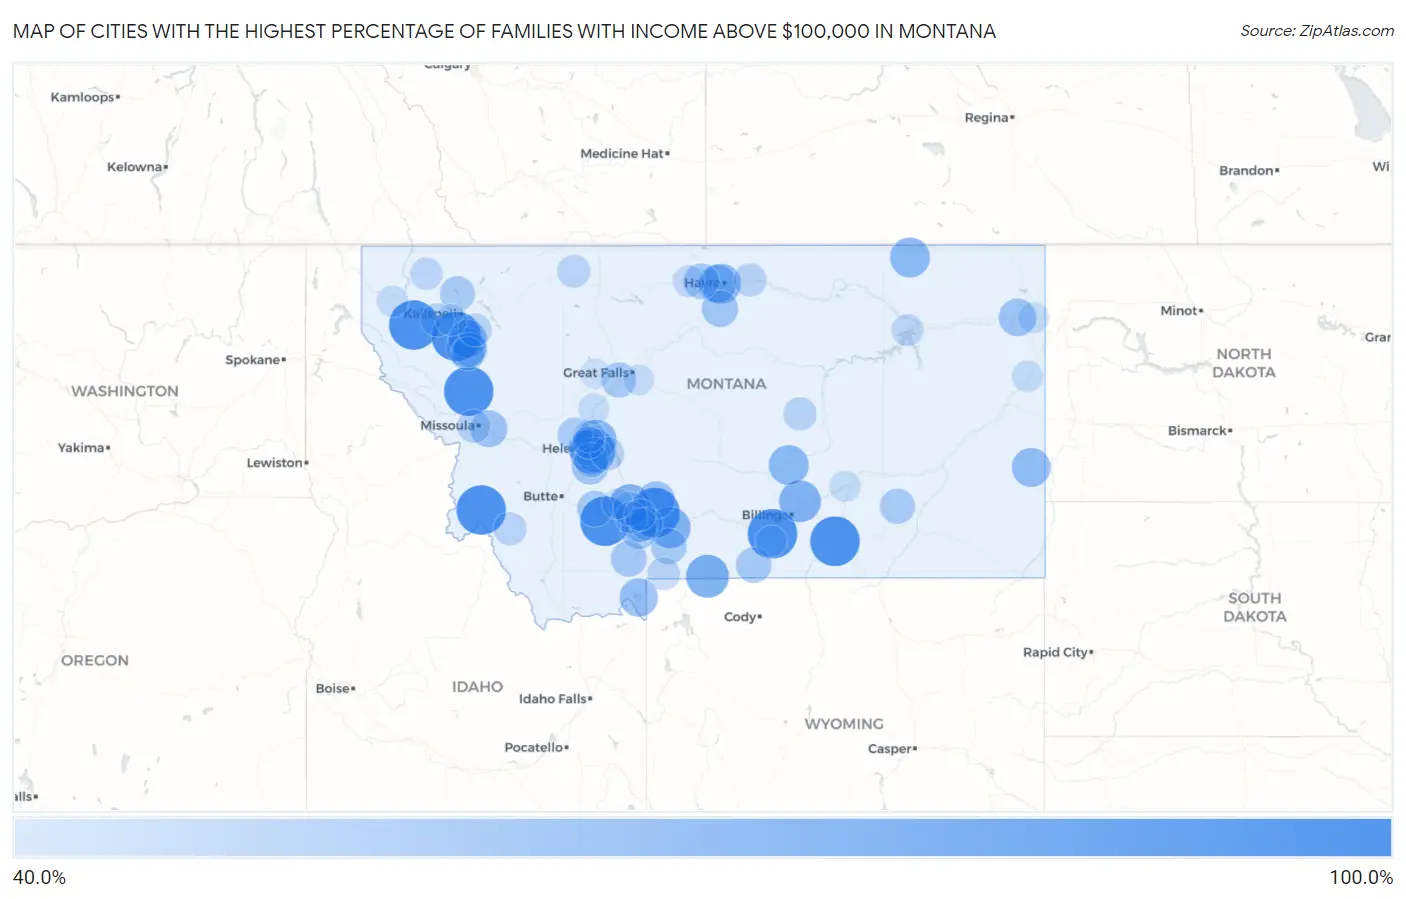
Map of Cities with the Highest Percentage of Families with Income Above $100,000 in Montana
0.0%
100.0%
Cities with the Highest Percentage of Families with Income Above $100,000 in Montana
| City | Families with Income > $100k | vs State | vs National | |
| 1. | Ravalli | 100.0% | 40.5%(+59.5)#1 | 46.1%(+53.9)#96 |
| 2. | Bridger | 100.0% | 40.5%(+59.5)#2 | 46.1%(+53.9)#101 |
| 3. | St Xavier | 100.0% | 40.5%(+59.5)#4 | 46.1%(+53.9)#218 |
| 4. | Happys Inn | 100.0% | 40.5%(+59.5)#5 | 46.1%(+53.9)#219 |
| 5. | Canyon Creek | 100.0% | 40.5%(+59.5)#6 | 46.1%(+53.9)#246 |
| 6. | Lake Mary Ronan | 100.0% | 40.5%(+59.5)#7 | 46.1%(+53.9)#248 |
| 7. | Fords Creek Colony | 100.0% | 40.5%(+59.5)#8 | 46.1%(+53.9)#261 |
| 8. | Harrison | 100.0% | 40.5%(+59.5)#9 | 46.1%(+53.9)#285 |
| 9. | Sula | 100.0% | 40.5%(+59.5)#10 | 46.1%(+53.9)#310 |
| 10. | Floweree | 100.0% | 40.5%(+59.5)#11 | 46.1%(+53.9)#354 |
| 11. | Haugan | 100.0% | 40.5%(+59.5)#12 | 46.1%(+53.9)#358 |
| 12. | Redstone | 100.0% | 40.5%(+59.5)#13 | 46.1%(+53.9)#367 |
| 13. | Mammoth | 100.0% | 40.5%(+59.5)#14 | 46.1%(+53.9)#371 |
| 14. | Potomac | 100.0% | 40.5%(+59.5)#15 | 46.1%(+53.9)#372 |
| 15. | Silesia | 100.0% | 40.5%(+59.5)#16 | 46.1%(+53.9)#400 |
| 16. | Brockway | 100.0% | 40.5%(+59.5)#17 | 46.1%(+53.9)#406 |
| 17. | Whitlash | 100.0% | 40.5%(+59.5)#18 | 46.1%(+53.9)#416 |
| 18. | South Hills | 89.2% | 40.5%(+48.7)#19 | 46.1%(+43.1)#624 |
| 19. | Silver Gate | 81.8% | 40.5%(+41.3)#20 | 46.1%(+35.7)#1,199 |
| 20. | Shepherd | 78.3% | 40.5%(+37.8)#21 | 46.1%(+32.2)#1,600 |
| 21. | Gallatin River Ranch | 78.0% | 40.5%(+37.5)#22 | 46.1%(+31.9)#1,643 |
| 22. | Wineglass | 77.2% | 40.5%(+36.7)#23 | 46.1%(+31.1)#1,755 |
| 23. | Nye | 76.2% | 40.5%(+35.7)#24 | 46.1%(+30.1)#1,896 |
| 24. | Helena Valley Northeast | 75.4% | 40.5%(+34.9)#25 | 46.1%(+29.3)#2,006 |
| 25. | Helmville | 75.0% | 40.5%(+34.5)#26 | 46.1%(+28.9)#2,078 |
| 26. | Utica | 75.0% | 40.5%(+34.5)#27 | 46.1%(+28.9)#2,086 |
| 27. | Klein | 73.7% | 40.5%(+33.2)#28 | 46.1%(+27.6)#2,276 |
| 28. | Opheim | 73.3% | 40.5%(+32.8)#29 | 46.1%(+27.2)#2,334 |
| 29. | West Havre | 73.2% | 40.5%(+32.7)#30 | 46.1%(+27.1)#2,349 |
| 30. | Lindisfarne | 73.0% | 40.5%(+32.5)#31 | 46.1%(+26.9)#2,377 |
| 31. | Homestead | 71.5% | 40.5%(+31.0)#32 | 46.1%(+25.4)#2,650 |
| 32. | Baker | 70.8% | 40.5%(+30.3)#33 | 46.1%(+24.7)#2,751 |
| 33. | Hebgen Lake Estates | 69.0% | 40.5%(+28.5)#34 | 46.1%(+22.9)#3,055 |
| 34. | Rollins | 68.6% | 40.5%(+28.1)#35 | 46.1%(+22.5)#3,137 |
| 35. | Beaver Creek | 68.5% | 40.5%(+28.0)#36 | 46.1%(+22.4)#3,159 |
| 36. | Hardy | 68.5% | 40.5%(+28.0)#37 | 46.1%(+22.4)#3,161 |
| 37. | Culbertson | 67.1% | 40.5%(+26.6)#38 | 46.1%(+21.0)#3,401 |
| 38. | North Harlem Colony | 66.7% | 40.5%(+26.2)#39 | 46.1%(+20.6)#3,477 |
| 39. | Luther | 66.7% | 40.5%(+26.2)#40 | 46.1%(+20.6)#3,482 |
| 40. | Dewey | 66.7% | 40.5%(+26.2)#41 | 46.1%(+20.6)#3,491 |
| 41. | Sedan | 66.6% | 40.5%(+26.1)#42 | 46.1%(+20.5)#3,516 |
| 42. | Turah | 65.6% | 40.5%(+25.1)#43 | 46.1%(+19.5)#3,722 |
| 43. | Fishtail | 65.6% | 40.5%(+25.1)#44 | 46.1%(+19.5)#3,727 |
| 44. | Glacier Colony | 65.0% | 40.5%(+24.5)#45 | 46.1%(+18.9)#3,851 |
| 45. | Jefferson City | 64.5% | 40.5%(+24.0)#46 | 46.1%(+18.4)#3,948 |
| 46. | Rocky Boy S Agency | 64.1% | 40.5%(+23.6)#47 | 46.1%(+18.0)#4,040 |
| 47. | Big Sky | 62.7% | 40.5%(+22.2)#48 | 46.1%(+16.6)#4,334 |
| 48. | Rockvale | 62.5% | 40.5%(+22.0)#49 | 46.1%(+16.4)#4,382 |
| 49. | Cardwell | 62.5% | 40.5%(+22.0)#50 | 46.1%(+16.4)#4,386 |
| 50. | Kremlin | 62.5% | 40.5%(+22.0)#51 | 46.1%(+16.4)#4,387 |
| 51. | Pray | 62.3% | 40.5%(+21.8)#52 | 46.1%(+16.2)#4,433 |
| 52. | Gallatin Gateway | 62.3% | 40.5%(+21.8)#53 | 46.1%(+16.2)#4,434 |
| 53. | Bearcreek | 61.9% | 40.5%(+21.4)#54 | 46.1%(+15.8)#4,521 |
| 54. | Four Corners | 61.3% | 40.5%(+20.8)#55 | 46.1%(+15.2)#4,658 |
| 55. | Helena West Side | 60.9% | 40.5%(+20.4)#56 | 46.1%(+14.8)#4,747 |
| 56. | Colstrip | 60.8% | 40.5%(+20.3)#57 | 46.1%(+14.7)#4,764 |
| 57. | Whitefish | 60.7% | 40.5%(+20.2)#58 | 46.1%(+14.6)#4,792 |
| 58. | Ulm | 60.4% | 40.5%(+19.9)#59 | 46.1%(+14.3)#4,867 |
| 59. | Montana City | 60.0% | 40.5%(+19.5)#60 | 46.1%(+13.9)#4,946 |
| 60. | Marysville | 60.0% | 40.5%(+19.5)#61 | 46.1%(+13.9)#4,982 |
| 61. | Sapphire Ridge | 60.0% | 40.5%(+19.5)#62 | 46.1%(+13.9)#4,991 |
| 62. | Kings Point | 58.9% | 40.5%(+18.4)#63 | 46.1%(+12.8)#5,261 |
| 63. | Rimini | 58.8% | 40.5%(+18.3)#64 | 46.1%(+12.7)#5,289 |
| 64. | Clancy | 58.7% | 40.5%(+18.2)#65 | 46.1%(+12.6)#5,299 |
| 65. | Manhattan | 57.2% | 40.5%(+16.7)#66 | 46.1%(+11.1)#5,659 |
| 66. | King Arthur Park | 57.0% | 40.5%(+16.5)#67 | 46.1%(+10.9)#5,733 |
| 67. | Rocky Point | 56.0% | 40.5%(+15.5)#68 | 46.1%(+9.90)#6,004 |
| 68. | Spokane Creek | 55.9% | 40.5%(+15.4)#69 | 46.1%(+9.80)#6,032 |
| 69. | Little Bitterroot Lake | 55.9% | 40.5%(+15.4)#70 | 46.1%(+9.80)#6,041 |
| 70. | Orchard Homes | 55.8% | 40.5%(+15.3)#71 | 46.1%(+9.70)#6,052 |
| 71. | Winnett | 55.6% | 40.5%(+15.1)#72 | 46.1%(+9.50)#6,120 |
| 72. | Woods Bay | 55.5% | 40.5%(+15.0)#73 | 46.1%(+9.40)#6,145 |
| 73. | Chinook | 55.4% | 40.5%(+14.9)#74 | 46.1%(+9.30)#6,175 |
| 74. | York | 55.1% | 40.5%(+14.6)#75 | 46.1%(+9.00)#6,262 |
| 75. | Wisdom | 55.0% | 40.5%(+14.5)#76 | 46.1%(+8.90)#6,289 |
| 76. | Santa Rita | 54.5% | 40.5%(+14.0)#77 | 46.1%(+8.40)#6,438 |
| 77. | Bozeman | 54.4% | 40.5%(+13.9)#78 | 46.1%(+8.30)#6,447 |
| 78. | Gardiner | 54.2% | 40.5%(+13.7)#79 | 46.1%(+8.10)#6,535 |
| 79. | Cyr | 53.8% | 40.5%(+13.3)#80 | 46.1%(+7.70)#6,658 |
| 80. | Helena Valley Northwest | 53.4% | 40.5%(+12.9)#81 | 46.1%(+7.30)#6,757 |
| 81. | Trego | 53.4% | 40.5%(+12.9)#82 | 46.1%(+7.30)#6,772 |
| 82. | Helena Valley West Central | 53.0% | 40.5%(+12.5)#83 | 46.1%(+6.90)#6,881 |
| 83. | Churchill | 52.4% | 40.5%(+11.9)#84 | 46.1%(+6.30)#7,072 |
| 84. | Fort Peck | 52.3% | 40.5%(+11.8)#85 | 46.1%(+6.20)#7,112 |
| 85. | Rapelje | 52.0% | 40.5%(+11.5)#86 | 46.1%(+5.90)#7,207 |
| 86. | Belgrade | 51.5% | 40.5%(+11.0)#87 | 46.1%(+5.40)#7,325 |
| 87. | Gildford | 51.5% | 40.5%(+11.0)#88 | 46.1%(+5.40)#7,339 |
| 88. | Kila | 51.3% | 40.5%(+10.8)#89 | 46.1%(+5.20)#7,397 |
| 89. | White Haven | 51.0% | 40.5%(+10.5)#90 | 46.1%(+4.90)#7,497 |
| 90. | Savage | 50.7% | 40.5%(+10.2)#91 | 46.1%(+4.60)#7,587 |
| 91. | Custer | 50.0% | 40.5%(+9.50)#92 | 46.1%(+3.90)#7,834 |
| 92. | Nibbe | 50.0% | 40.5%(+9.50)#93 | 46.1%(+3.90)#7,837 |
| 93. | Edgar | 50.0% | 40.5%(+9.50)#94 | 46.1%(+3.90)#7,848 |
| 94. | Ayers Ranch Colony | 50.0% | 40.5%(+9.50)#95 | 46.1%(+3.90)#7,898 |
| 95. | Craig | 50.0% | 40.5%(+9.50)#96 | 46.1%(+3.90)#7,899 |
| 96. | Bloomfield | 50.0% | 40.5%(+9.50)#97 | 46.1%(+3.90)#7,928 |
| 97. | Bainville | 49.9% | 40.5%(+9.40)#98 | 46.1%(+3.80)#7,949 |
| 98. | Sand Coulee | 49.2% | 40.5%(+8.70)#99 | 46.1%(+3.10)#8,149 |
| 99. | Wheatland | 48.7% | 40.5%(+8.20)#100 | 46.1%(+2.60)#8,291 |
| 100. | Simms | 47.4% | 40.5%(+6.90)#101 | 46.1%(+1.30)#8,731 |
Common Questions
What are the Top 10 Cities with the Highest Percentage of Families with Income Above $100,000 in Montana?
Top 10 Cities with the Highest Percentage of Families with Income Above $100,000 in Montana are:
#1
100.0%
#2
100.0%
#3
100.0%
#4
100.0%
#5
100.0%
#6
100.0%
#7
100.0%
#8
100.0%
#9
89.2%
#10
81.8%
What city has the Highest Percentage of Families with Income Above $100,000 in Montana?
Ravalli has the Highest Percentage of Families with Income Above $100,000 in Montana with 100.0%.
What is the Percentage of Families with Income Above $100,000 in the State of Montana?
Percentage of Families with Income Above $100,000 in Montana is 40.5%.
What is the Percentage of Families with Income Above $100,000 in the United States?
Percentage of Families with Income Above $100,000 in the United States is 46.1%.