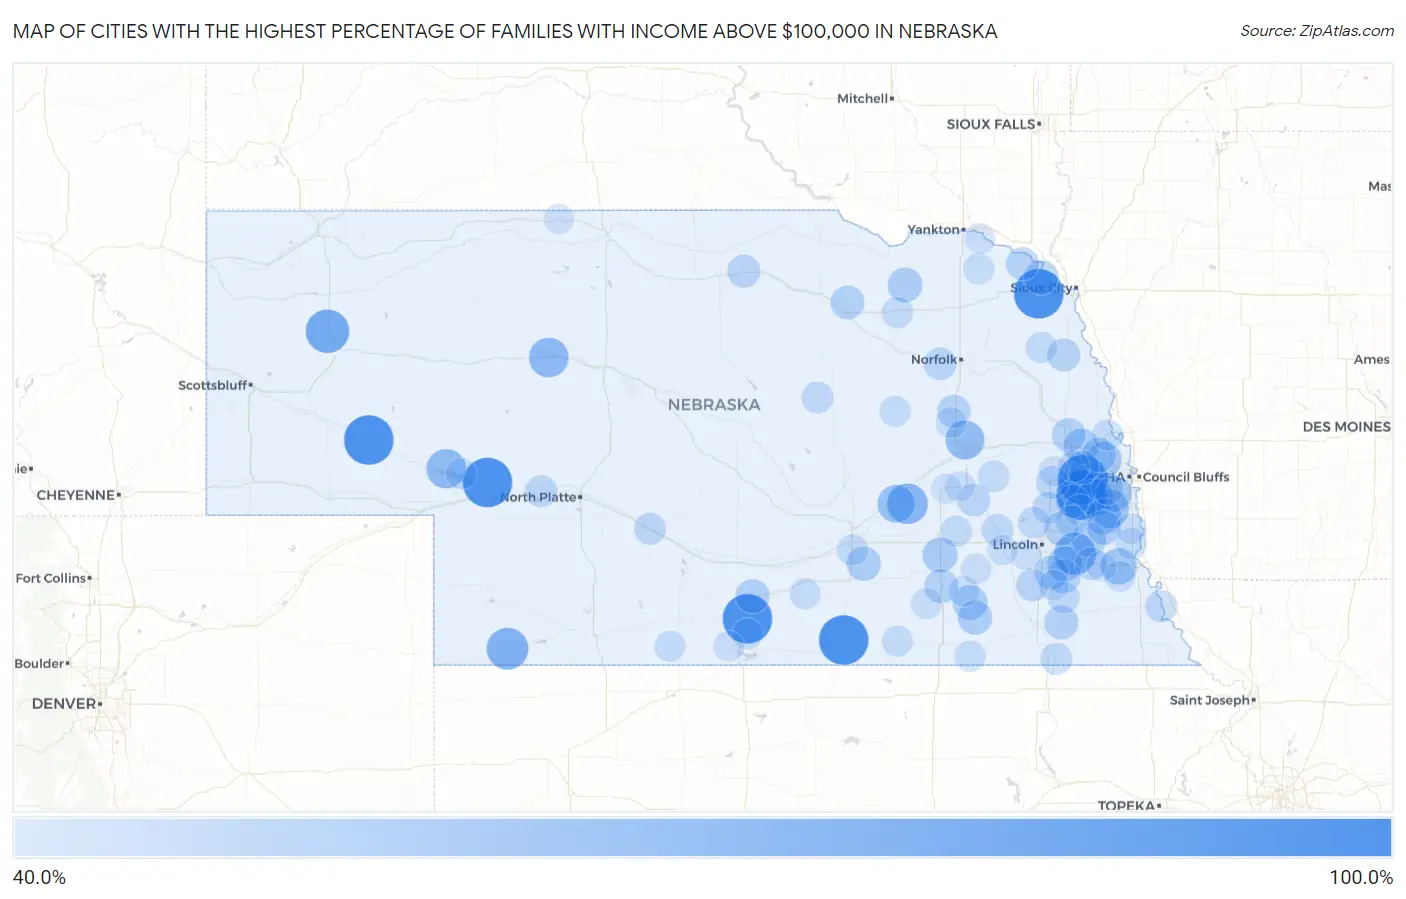
Cities with the Highest Percentage of Families with Income Above $100,000 in Nebraska
RELATED REPORTS & OPTIONS
Family Income | $100k+
Nebraska
Compare Cities
Map of Cities with the Highest Percentage of Families with Income Above $100,000 in Nebraska
0.0%
100.0%
Cities with the Highest Percentage of Families with Income Above $100,000 in Nebraska
| City | Families with Income > $100k | vs State | vs National | |
| 1. | Wann | 100.0% | 45.7%(+54.3)#1 | 46.1%(+53.9)#184 |
| 2. | Waterbury | 100.0% | 45.7%(+54.3)#2 | 46.1%(+53.9)#231 |
| 3. | Venice | 100.0% | 45.7%(+54.3)#3 | 46.1%(+53.9)#337 |
| 4. | Linoma Beach | 100.0% | 45.7%(+54.3)#4 | 46.1%(+53.9)#346 |
| 5. | Keystone | 100.0% | 45.7%(+54.3)#5 | 46.1%(+53.9)#355 |
| 6. | Lisco | 100.0% | 45.7%(+54.3)#6 | 46.1%(+53.9)#377 |
| 7. | Ragan | 100.0% | 45.7%(+54.3)#7 | 46.1%(+53.9)#408 |
| 8. | Cowles | 100.0% | 45.7%(+54.3)#8 | 46.1%(+53.9)#414 |
| 9. | Berea | 83.3% | 45.7%(+37.6)#9 | 46.1%(+37.2)#1,045 |
| 10. | Woodland Hills | 78.9% | 45.7%(+33.2)#10 | 46.1%(+32.8)#1,527 |
| 11. | Princeton | 78.9% | 45.7%(+33.2)#11 | 46.1%(+32.8)#1,529 |
| 12. | Max | 78.6% | 45.7%(+32.9)#12 | 46.1%(+32.5)#1,571 |
| 13. | Hordville | 75.5% | 45.7%(+29.8)#13 | 46.1%(+29.4)#1,996 |
| 14. | Melia | 75.0% | 45.7%(+29.3)#14 | 46.1%(+28.9)#2,077 |
| 15. | Mullen | 72.6% | 45.7%(+26.9)#15 | 46.1%(+26.5)#2,460 |
| 16. | Belmar | 72.2% | 45.7%(+26.5)#16 | 46.1%(+26.1)#2,522 |
| 17. | Lakeview | 70.7% | 45.7%(+25.0)#17 | 46.1%(+24.6)#2,775 |
| 18. | Cheney | 69.0% | 45.7%(+23.3)#18 | 46.1%(+22.9)#3,054 |
| 19. | Cedar Creek | 68.9% | 45.7%(+23.2)#19 | 46.1%(+22.8)#3,075 |
| 20. | Overland | 67.8% | 45.7%(+22.1)#20 | 46.1%(+21.7)#3,292 |
| 21. | Gretna | 65.5% | 45.7%(+19.8)#21 | 46.1%(+19.4)#3,739 |
| 22. | Dunbar | 63.9% | 45.7%(+18.2)#22 | 46.1%(+17.8)#4,077 |
| 23. | Papillion | 63.6% | 45.7%(+17.9)#23 | 46.1%(+17.5)#4,122 |
| 24. | Louisville | 63.2% | 45.7%(+17.5)#24 | 46.1%(+17.1)#4,220 |
| 25. | Bennington | 62.8% | 45.7%(+17.1)#25 | 46.1%(+16.7)#4,313 |
| 26. | Arlington | 60.9% | 45.7%(+15.2)#26 | 46.1%(+14.8)#4,748 |
| 27. | Mccool Junction | 60.8% | 45.7%(+15.1)#27 | 46.1%(+14.7)#4,771 |
| 28. | Bennet | 60.4% | 45.7%(+14.7)#28 | 46.1%(+14.3)#4,865 |
| 29. | Tobias | 60.0% | 45.7%(+14.3)#29 | 46.1%(+13.9)#4,972 |
| 30. | Bazile Mills | 60.0% | 45.7%(+14.3)#30 | 46.1%(+13.9)#4,996 |
| 31. | Ponca | 59.2% | 45.7%(+13.5)#31 | 46.1%(+13.1)#5,183 |
| 32. | Elmwood | 59.1% | 45.7%(+13.4)#32 | 46.1%(+13.0)#5,212 |
| 33. | Trumbull | 59.1% | 45.7%(+13.4)#33 | 46.1%(+13.0)#5,215 |
| 34. | Daykin | 59.1% | 45.7%(+13.4)#34 | 46.1%(+13.0)#5,216 |
| 35. | Martell | 59.1% | 45.7%(+13.4)#35 | 46.1%(+13.0)#5,218 |
| 36. | Manley | 58.7% | 45.7%(+13.0)#36 | 46.1%(+12.6)#5,309 |
| 37. | Washington | 58.7% | 45.7%(+13.0)#37 | 46.1%(+12.6)#5,310 |
| 38. | Funk | 58.0% | 45.7%(+12.3)#38 | 46.1%(+11.9)#5,480 |
| 39. | Geneva | 57.8% | 45.7%(+12.1)#39 | 46.1%(+11.7)#5,515 |
| 40. | Panama | 57.8% | 45.7%(+12.1)#40 | 46.1%(+11.7)#5,524 |
| 41. | Filley | 57.7% | 45.7%(+12.0)#41 | 46.1%(+11.6)#5,557 |
| 42. | Hickman | 57.6% | 45.7%(+11.9)#42 | 46.1%(+11.5)#5,570 |
| 43. | Nickerson | 57.5% | 45.7%(+11.8)#43 | 46.1%(+11.4)#5,600 |
| 44. | Page | 57.5% | 45.7%(+11.8)#44 | 46.1%(+11.4)#5,606 |
| 45. | Waverly | 57.0% | 45.7%(+11.3)#45 | 46.1%(+10.9)#5,726 |
| 46. | Valley | 55.8% | 45.7%(+10.1)#46 | 46.1%(+9.70)#6,056 |
| 47. | Humphrey | 55.8% | 45.7%(+10.1)#47 | 46.1%(+9.70)#6,065 |
| 48. | Memphis | 55.6% | 45.7%(+9.90)#48 | 46.1%(+9.50)#6,124 |
| 49. | Newcastle | 55.5% | 45.7%(+9.80)#49 | 46.1%(+9.40)#6,149 |
| 50. | Rosalie | 55.3% | 45.7%(+9.60)#50 | 46.1%(+9.20)#6,208 |
| 51. | Newport | 55.0% | 45.7%(+9.30)#51 | 46.1%(+8.90)#6,292 |
| 52. | Hallam | 54.6% | 45.7%(+8.90)#52 | 46.1%(+8.50)#6,396 |
| 53. | Surprise | 54.6% | 45.7%(+8.90)#53 | 46.1%(+8.50)#6,403 |
| 54. | Wahoo | 54.3% | 45.7%(+8.60)#54 | 46.1%(+8.20)#6,492 |
| 55. | Battle Creek | 54.3% | 45.7%(+8.60)#55 | 46.1%(+8.20)#6,504 |
| 56. | Unadilla | 54.2% | 45.7%(+8.50)#56 | 46.1%(+8.10)#6,539 |
| 57. | Brownville | 53.0% | 45.7%(+7.30)#57 | 46.1%(+6.90)#6,902 |
| 58. | Chalco | 52.9% | 45.7%(+7.20)#58 | 46.1%(+6.80)#6,914 |
| 59. | Sutherland | 52.7% | 45.7%(+7.00)#59 | 46.1%(+6.60)#6,993 |
| 60. | Gothenburg | 52.6% | 45.7%(+6.90)#60 | 46.1%(+6.50)#7,016 |
| 61. | Ceresco | 52.6% | 45.7%(+6.90)#61 | 46.1%(+6.50)#7,020 |
| 62. | Barneston | 52.4% | 45.7%(+6.70)#62 | 46.1%(+6.30)#7,081 |
| 63. | Ericson | 52.4% | 45.7%(+6.70)#63 | 46.1%(+6.30)#7,083 |
| 64. | Adams | 52.2% | 45.7%(+6.50)#64 | 46.1%(+6.10)#7,140 |
| 65. | Raymond | 52.0% | 45.7%(+6.30)#65 | 46.1%(+5.90)#7,202 |
| 66. | Seward | 51.9% | 45.7%(+6.20)#66 | 46.1%(+5.80)#7,215 |
| 67. | Leshara | 51.9% | 45.7%(+6.20)#67 | 46.1%(+5.80)#7,237 |
| 68. | David City | 51.3% | 45.7%(+5.60)#68 | 46.1%(+5.20)#7,383 |
| 69. | Ashland | 51.2% | 45.7%(+5.50)#69 | 46.1%(+5.10)#7,420 |
| 70. | Pender | 51.2% | 45.7%(+5.50)#70 | 46.1%(+5.10)#7,425 |
| 71. | Doniphan | 51.1% | 45.7%(+5.40)#71 | 46.1%(+5.00)#7,461 |
| 72. | Greenwood | 51.1% | 45.7%(+5.40)#72 | 46.1%(+5.00)#7,464 |
| 73. | Brunswick | 51.1% | 45.7%(+5.40)#74 | 46.1%(+5.00)#7,471 |
| 74. | Waco | 51.1% | 45.7%(+5.40)#75 | 46.1%(+5.00)#7,472 |
| 75. | Union | 50.8% | 45.7%(+5.10)#76 | 46.1%(+4.70)#7,561 |
| 76. | Albion | 50.6% | 45.7%(+4.90)#77 | 46.1%(+4.50)#7,607 |
| 77. | Hartington | 50.5% | 45.7%(+4.80)#78 | 46.1%(+4.40)#7,643 |
| 78. | Blair | 50.2% | 45.7%(+4.50)#79 | 46.1%(+4.10)#7,725 |
| 79. | Huntley | 50.0% | 45.7%(+4.30)#80 | 46.1%(+3.90)#7,871 |
| 80. | Reynolds | 50.0% | 45.7%(+4.30)#81 | 46.1%(+3.90)#7,872 |
| 81. | Lorton | 50.0% | 45.7%(+4.30)#82 | 46.1%(+3.90)#7,873 |
| 82. | Lemoyne | 50.0% | 45.7%(+4.30)#83 | 46.1%(+3.90)#7,878 |
| 83. | Norman | 50.0% | 45.7%(+4.30)#84 | 46.1%(+3.90)#7,901 |
| 84. | Hendley | 50.0% | 45.7%(+4.30)#85 | 46.1%(+3.90)#7,911 |
| 85. | Nora | 50.0% | 45.7%(+4.30)#86 | 46.1%(+3.90)#7,912 |
| 86. | Tarnov | 50.0% | 45.7%(+4.30)#87 | 46.1%(+3.90)#7,925 |
| 87. | Shickley | 49.5% | 45.7%(+3.80)#88 | 46.1%(+3.40)#8,060 |
| 88. | Milligan | 49.2% | 45.7%(+3.50)#89 | 46.1%(+3.10)#8,148 |
| 89. | Murray | 48.9% | 45.7%(+3.20)#90 | 46.1%(+2.80)#8,232 |
| 90. | Orleans | 48.9% | 45.7%(+3.20)#91 | 46.1%(+2.80)#8,234 |
| 91. | Denton | 48.6% | 45.7%(+2.90)#92 | 46.1%(+2.50)#8,329 |
| 92. | Milford | 48.5% | 45.7%(+2.80)#93 | 46.1%(+2.40)#8,349 |
| 93. | Friend | 48.5% | 45.7%(+2.80)#94 | 46.1%(+2.40)#8,354 |
| 94. | Firth | 48.5% | 45.7%(+2.80)#95 | 46.1%(+2.40)#8,362 |
| 95. | St Helena | 48.4% | 45.7%(+2.70)#96 | 46.1%(+2.30)#8,401 |
| 96. | Shelby | 48.3% | 45.7%(+2.60)#97 | 46.1%(+2.20)#8,431 |
| 97. | Colon | 48.1% | 45.7%(+2.40)#98 | 46.1%(+2.00)#8,503 |
| 98. | Kilgore | 48.0% | 45.7%(+2.30)#99 | 46.1%(+1.90)#8,534 |
| 99. | Syracuse | 47.9% | 45.7%(+2.20)#100 | 46.1%(+1.80)#8,549 |
| 100. | Osceola | 47.8% | 45.7%(+2.10)#101 | 46.1%(+1.70)#8,590 |
Common Questions
What are the Top 10 Cities with the Highest Percentage of Families with Income Above $100,000 in Nebraska?
Top 10 Cities with the Highest Percentage of Families with Income Above $100,000 in Nebraska are:
What city has the Highest Percentage of Families with Income Above $100,000 in Nebraska?
Wann has the Highest Percentage of Families with Income Above $100,000 in Nebraska with 100.0%.
What is the Percentage of Families with Income Above $100,000 in the State of Nebraska?
Percentage of Families with Income Above $100,000 in Nebraska is 45.7%.
What is the Percentage of Families with Income Above $100,000 in the United States?
Percentage of Families with Income Above $100,000 in the United States is 46.1%.