Cities with the Highest Percentage of Families with Income Above $100,000 in Tennessee
RELATED REPORTS & OPTIONS
Family Income | $100k+
Tennessee
Compare Cities
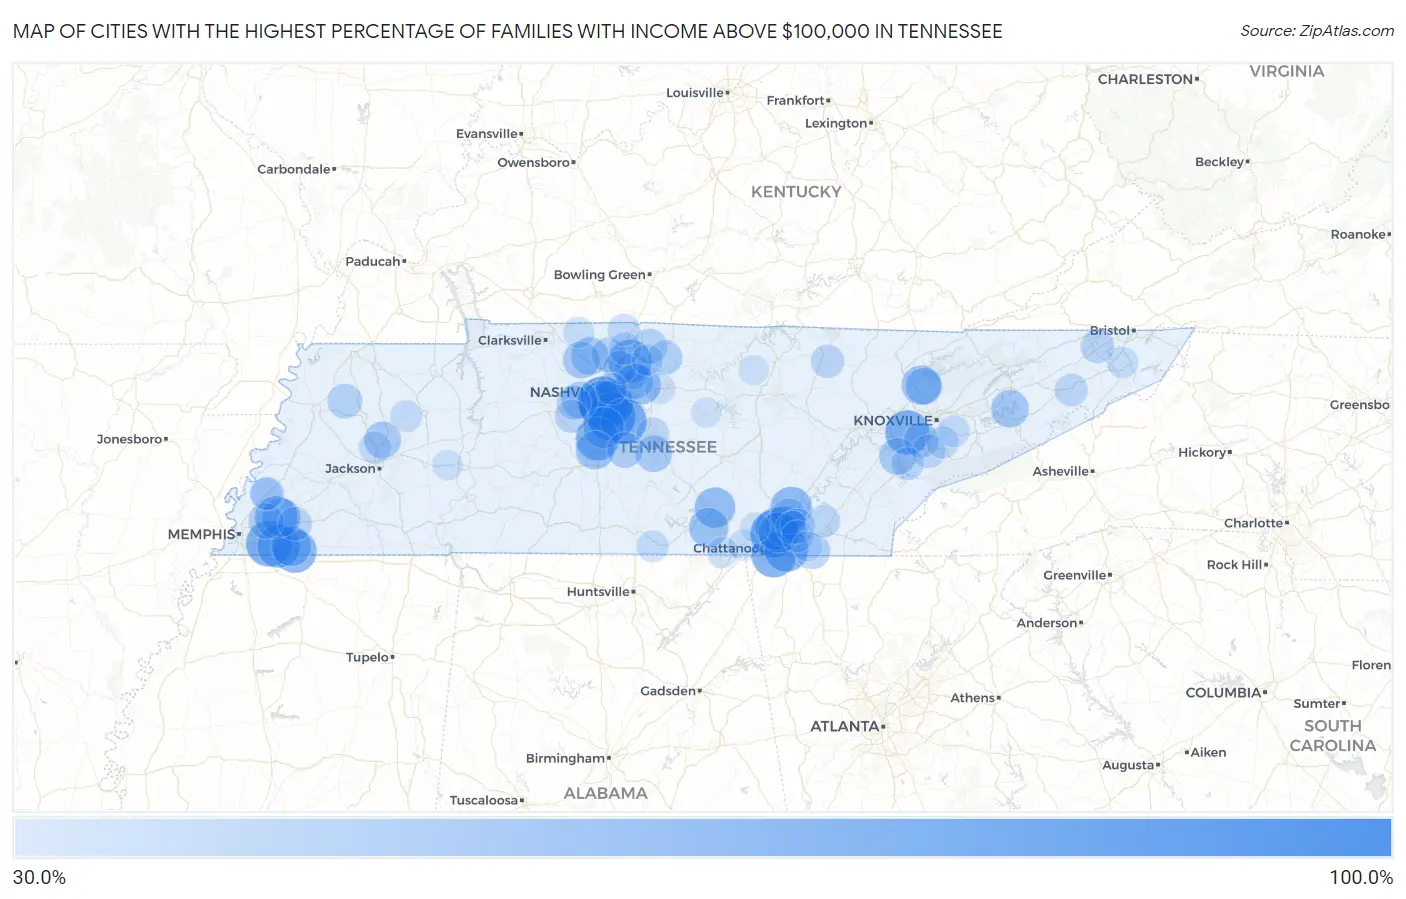
Map of Cities with the Highest Percentage of Families with Income Above $100,000 in Tennessee
0.0%
100.0%
Cities with the Highest Percentage of Families with Income Above $100,000 in Tennessee
| City | Families with Income > $100k | vs State | vs National | |
| 1. | Norene | 100.0% | 38.3%(+61.7)#1 | 46.1%(+53.9)#56 |
| 2. | Pocahontas | 100.0% | 38.3%(+61.7)#2 | 46.1%(+53.9)#64 |
| 3. | Taft | 100.0% | 38.3%(+61.7)#3 | 46.1%(+53.9)#84 |
| 4. | Lavinia | 100.0% | 38.3%(+61.7)#4 | 46.1%(+53.9)#253 |
| 5. | Coker Creek | 100.0% | 38.3%(+61.7)#5 | 46.1%(+53.9)#279 |
| 6. | Belle Meade | 87.4% | 38.3%(+49.1)#6 | 46.1%(+41.3)#723 |
| 7. | Forest Hills | 86.7% | 38.3%(+48.4)#7 | 46.1%(+40.6)#765 |
| 8. | Ocoee | 85.5% | 38.3%(+47.2)#8 | 46.1%(+39.4)#852 |
| 9. | Brentwood | 84.2% | 38.3%(+45.9)#9 | 46.1%(+38.1)#954 |
| 10. | Signal Mountain | 80.4% | 38.3%(+42.1)#10 | 46.1%(+34.3)#1,339 |
| 11. | Oak Hill | 79.3% | 38.3%(+41.0)#11 | 46.1%(+33.2)#1,468 |
| 12. | Nolensville | 78.2% | 38.3%(+39.9)#12 | 46.1%(+32.1)#1,606 |
| 13. | Germantown | 77.2% | 38.3%(+38.9)#13 | 46.1%(+31.1)#1,744 |
| 14. | Lookout Mountain | 75.5% | 38.3%(+37.2)#14 | 46.1%(+29.4)#1,992 |
| 15. | Farragut | 75.1% | 38.3%(+36.8)#15 | 46.1%(+29.0)#2,048 |
| 16. | Ridgeside | 73.0% | 38.3%(+34.7)#16 | 46.1%(+26.9)#2,375 |
| 17. | Thompson S Station | 72.5% | 38.3%(+34.2)#17 | 46.1%(+26.4)#2,466 |
| 18. | Shackle Island | 72.3% | 38.3%(+34.0)#18 | 46.1%(+26.2)#2,494 |
| 19. | Dellrose | 72.2% | 38.3%(+33.9)#19 | 46.1%(+26.1)#2,521 |
| 20. | Rossville | 71.7% | 38.3%(+33.4)#20 | 46.1%(+25.6)#2,608 |
| 21. | Collierville | 71.4% | 38.3%(+33.1)#21 | 46.1%(+25.3)#2,652 |
| 22. | Lakeland | 70.1% | 38.3%(+31.8)#22 | 46.1%(+24.0)#2,863 |
| 23. | Fairmount | 69.4% | 38.3%(+31.1)#23 | 46.1%(+23.3)#2,982 |
| 24. | Flat Top Mountain | 67.4% | 38.3%(+29.1)#24 | 46.1%(+21.3)#3,359 |
| 25. | Franklin | 66.7% | 38.3%(+28.4)#25 | 46.1%(+20.6)#3,444 |
| 26. | Falling Water | 65.3% | 38.3%(+27.0)#26 | 46.1%(+19.2)#3,786 |
| 27. | Walden | 65.2% | 38.3%(+26.9)#27 | 46.1%(+19.1)#3,799 |
| 28. | Pelham | 65.0% | 38.3%(+26.7)#28 | 46.1%(+18.9)#3,850 |
| 29. | Piperton | 63.9% | 38.3%(+25.6)#29 | 46.1%(+17.8)#4,071 |
| 30. | Sewanee | 62.1% | 38.3%(+23.8)#30 | 46.1%(+16.0)#4,473 |
| 31. | Norris | 62.0% | 38.3%(+23.7)#31 | 46.1%(+15.9)#4,491 |
| 32. | Rarity Bay | 61.7% | 38.3%(+23.4)#32 | 46.1%(+15.6)#4,557 |
| 33. | Mount Juliet | 61.4% | 38.3%(+23.1)#33 | 46.1%(+15.3)#4,619 |
| 34. | Arlington | 60.6% | 38.3%(+22.3)#34 | 46.1%(+14.5)#4,814 |
| 35. | Spring Hill | 60.4% | 38.3%(+22.1)#35 | 46.1%(+14.3)#4,852 |
| 36. | Delano | 59.2% | 38.3%(+20.9)#36 | 46.1%(+13.1)#5,182 |
| 37. | Baneberry | 58.0% | 38.3%(+19.7)#37 | 46.1%(+11.9)#5,478 |
| 38. | Coopertown | 57.7% | 38.3%(+19.4)#38 | 46.1%(+11.6)#5,536 |
| 39. | Medina | 55.9% | 38.3%(+17.6)#39 | 46.1%(+9.80)#6,022 |
| 40. | Pleasant View | 55.9% | 38.3%(+17.6)#40 | 46.1%(+9.80)#6,024 |
| 41. | Tellico Village | 55.8% | 38.3%(+17.5)#41 | 46.1%(+9.70)#6,050 |
| 42. | Andersonville | 55.8% | 38.3%(+17.5)#42 | 46.1%(+9.70)#6,072 |
| 43. | Hendersonville | 55.7% | 38.3%(+17.4)#43 | 46.1%(+9.60)#6,080 |
| 44. | Pegram | 55.5% | 38.3%(+17.2)#44 | 46.1%(+9.40)#6,142 |
| 45. | Christiana | 55.4% | 38.3%(+17.1)#45 | 46.1%(+9.30)#6,165 |
| 46. | Green Hill | 54.9% | 38.3%(+16.6)#46 | 46.1%(+8.80)#6,303 |
| 47. | Luray | 54.4% | 38.3%(+16.1)#47 | 46.1%(+8.30)#6,475 |
| 48. | Eagleville | 53.5% | 38.3%(+15.2)#48 | 46.1%(+7.40)#6,740 |
| 49. | Bartlett | 53.2% | 38.3%(+14.9)#49 | 46.1%(+7.10)#6,811 |
| 50. | Mowbray Mountain | 53.0% | 38.3%(+14.7)#50 | 46.1%(+6.90)#6,891 |
| 51. | Apison | 52.1% | 38.3%(+13.8)#51 | 46.1%(+6.00)#7,162 |
| 52. | Whiteside | 52.0% | 38.3%(+13.7)#52 | 46.1%(+5.90)#7,204 |
| 53. | Louisville | 51.8% | 38.3%(+13.5)#53 | 46.1%(+5.70)#7,246 |
| 54. | Lakesite | 51.7% | 38.3%(+13.4)#54 | 46.1%(+5.60)#7,283 |
| 55. | Yorkville | 51.3% | 38.3%(+13.0)#55 | 46.1%(+5.20)#7,401 |
| 56. | Graball | 51.2% | 38.3%(+12.9)#56 | 46.1%(+5.10)#7,436 |
| 57. | Greenbrier | 50.9% | 38.3%(+12.6)#57 | 46.1%(+4.80)#7,515 |
| 58. | Castalian Springs | 50.5% | 38.3%(+12.2)#58 | 46.1%(+4.40)#7,649 |
| 59. | Kingston Springs | 49.6% | 38.3%(+11.3)#59 | 46.1%(+3.50)#8,024 |
| 60. | Oakland | 49.0% | 38.3%(+10.7)#60 | 46.1%(+2.90)#8,184 |
| 61. | Colonial Heights | 48.6% | 38.3%(+10.3)#61 | 46.1%(+2.50)#8,314 |
| 62. | Atoka | 48.3% | 38.3%(+10.0)#62 | 46.1%(+2.20)#8,413 |
| 63. | Big Rock | 48.3% | 38.3%(+10.0)#63 | 46.1%(+2.20)#8,438 |
| 64. | Maryville | 47.7% | 38.3%(+9.40)#64 | 46.1%(+1.60)#8,605 |
| 65. | Goodlettsville | 47.6% | 38.3%(+9.30)#65 | 46.1%(+1.50)#8,646 |
| 66. | Fairview | 47.5% | 38.3%(+9.20)#66 | 46.1%(+1.40)#8,685 |
| 67. | Allardt | 47.4% | 38.3%(+9.10)#67 | 46.1%(+1.30)#8,723 |
| 68. | Middle Valley | 47.2% | 38.3%(+8.90)#68 | 46.1%(+1.10)#8,776 |
| 69. | Kahite | 47.1% | 38.3%(+8.80)#69 | 46.1%(+1.00)#8,845 |
| 70. | Greenback | 46.7% | 38.3%(+8.40)#70 | 46.1%(+0.600)#9,002 |
| 71. | Oak Grove Cdp Washington County | 46.6% | 38.3%(+8.30)#71 | 46.1%(+0.500)#9,027 |
| 72. | Tusculum | 46.6% | 38.3%(+8.30)#72 | 46.1%(+0.500)#9,032 |
| 73. | Karns | 46.3% | 38.3%(+8.00)#73 | 46.1%(+0.200)#9,141 |
| 74. | Murfreesboro | 46.2% | 38.3%(+7.90)#74 | 46.1%(+0.100)#9,166 |
| 75. | Hopewell | 45.8% | 38.3%(+7.50)#75 | 46.1%(-0.300)#9,335 |
| 76. | White House | 45.3% | 38.3%(+7.00)#76 | 46.1%(-0.800)#9,539 |
| 77. | Gladeville | 45.3% | 38.3%(+7.00)#77 | 46.1%(-0.800)#9,556 |
| 78. | Three Way | 45.3% | 38.3%(+7.00)#78 | 46.1%(-0.800)#9,558 |
| 79. | Orlinda | 45.3% | 38.3%(+7.00)#79 | 46.1%(-0.800)#9,559 |
| 80. | Munford | 45.1% | 38.3%(+6.80)#80 | 46.1%(-1.00)#9,638 |
| 81. | Wildwood | 44.8% | 38.3%(+6.50)#81 | 46.1%(-1.30)#9,785 |
| 82. | Harrison | 44.7% | 38.3%(+6.40)#82 | 46.1%(-1.40)#9,811 |
| 83. | Nashville | 44.4% | 38.3%(+6.10)#83 | 46.1%(-1.70)#9,892 |
| 84. | Mclemoresville | 44.3% | 38.3%(+6.00)#84 | 46.1%(-1.80)#9,977 |
| 85. | Walnut Grove Cdp Sumner County | 44.2% | 38.3%(+5.90)#85 | 46.1%(-1.90)#10,011 |
| 86. | Flintville | 44.1% | 38.3%(+5.80)#86 | 46.1%(-2.00)#10,050 |
| 87. | Seymour | 43.9% | 38.3%(+5.60)#87 | 46.1%(-2.20)#10,102 |
| 88. | Powell | 43.7% | 38.3%(+5.40)#88 | 46.1%(-2.40)#10,188 |
| 89. | Gallatin | 43.2% | 38.3%(+4.90)#89 | 46.1%(-2.90)#10,387 |
| 90. | Orme | 42.9% | 38.3%(+4.60)#90 | 46.1%(-3.20)#10,550 |
| 91. | Jasper | 42.6% | 38.3%(+4.30)#91 | 46.1%(-3.50)#10,655 |
| 92. | Watauga | 42.6% | 38.3%(+4.30)#92 | 46.1%(-3.50)#10,677 |
| 93. | Adams | 42.5% | 38.3%(+4.20)#93 | 46.1%(-3.60)#10,705 |
| 94. | Sullivan Gardens | 41.7% | 38.3%(+3.40)#94 | 46.1%(-4.40)#11,005 |
| 95. | Lebanon | 41.2% | 38.3%(+2.90)#95 | 46.1%(-4.90)#11,220 |
| 96. | Darden | 40.9% | 38.3%(+2.60)#96 | 46.1%(-5.20)#11,425 |
| 97. | Collegedale | 40.1% | 38.3%(+1.80)#97 | 46.1%(-6.00)#11,777 |
| 98. | Dodson Branch | 40.0% | 38.3%(+1.70)#98 | 46.1%(-6.10)#11,834 |
| 99. | Dowelltown | 40.0% | 38.3%(+1.70)#99 | 46.1%(-6.10)#11,846 |
| 100. | Whitwell | 39.8% | 38.3%(+1.50)#100 | 46.1%(-6.30)#11,962 |
Common Questions
What are the Top 10 Cities with the Highest Percentage of Families with Income Above $100,000 in Tennessee?
Top 10 Cities with the Highest Percentage of Families with Income Above $100,000 in Tennessee are:
#1
87.4%
#2
86.7%
#3
84.2%
#4
80.4%
#5
79.3%
#6
78.2%
#7
77.2%
#8
75.5%
#9
75.1%
#10
73.0%
What city has the Highest Percentage of Families with Income Above $100,000 in Tennessee?
Belle Meade has the Highest Percentage of Families with Income Above $100,000 in Tennessee with 87.4%.
What is the Percentage of Families with Income Above $100,000 in the State of Tennessee?
Percentage of Families with Income Above $100,000 in Tennessee is 38.3%.
What is the Percentage of Families with Income Above $100,000 in the United States?
Percentage of Families with Income Above $100,000 in the United States is 46.1%.