Cities with the Highest Percentage of Families with Income Above $100,000 in Iowa
RELATED REPORTS & OPTIONS
Family Income | $100k+
Iowa
Compare Cities
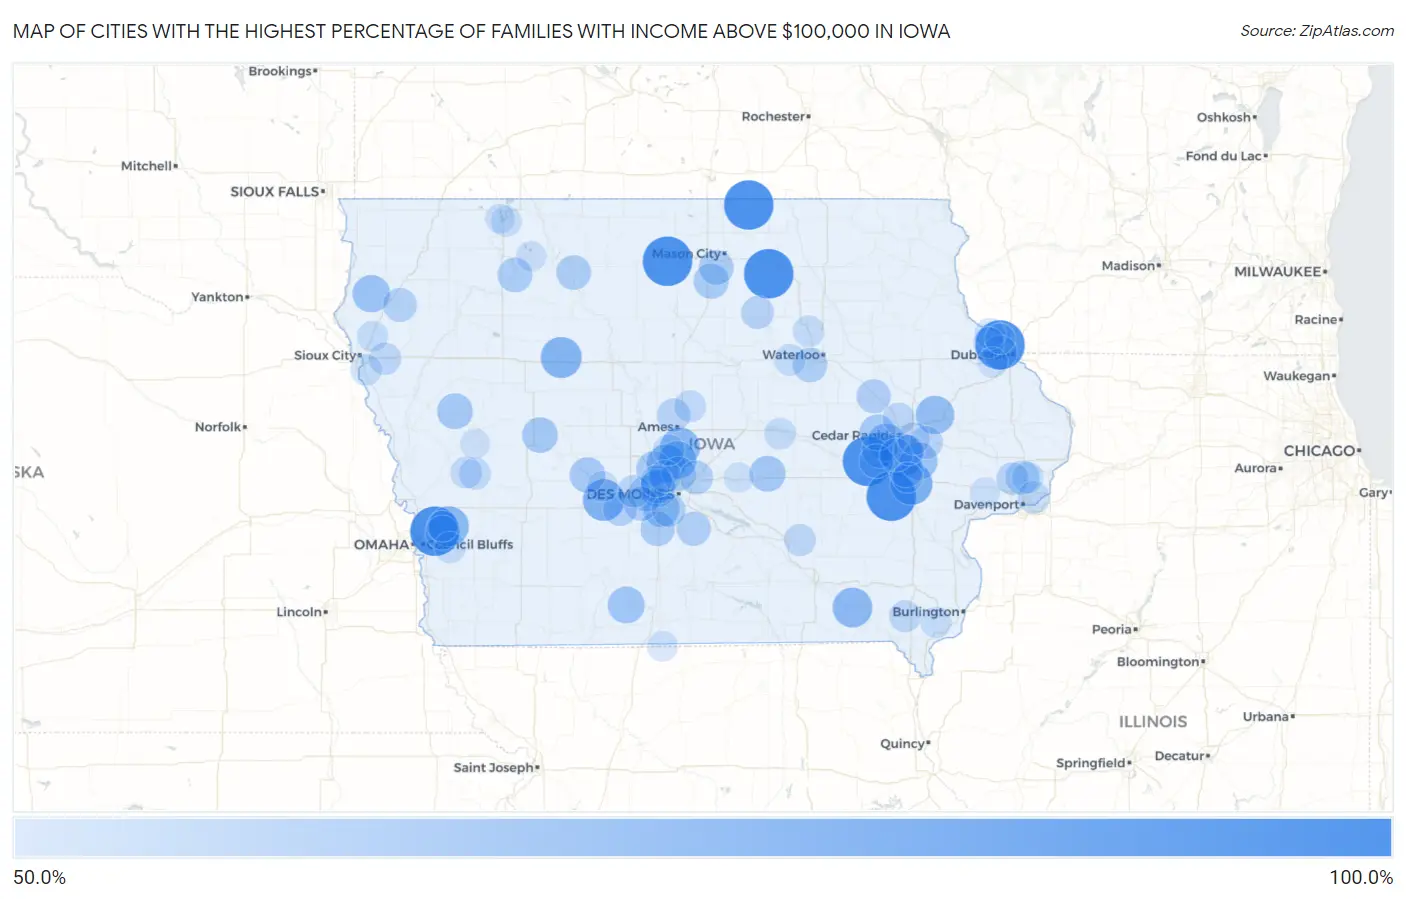
Map of Cities with the Highest Percentage of Families with Income Above $100,000 in Iowa
0.0%
100.0%
Cities with the Highest Percentage of Families with Income Above $100,000 in Iowa
| City | Families with Income > $100k | vs State | vs National | |
| 1. | High Amana | 100.0% | 44.3%(+55.7)#1 | 46.1%(+53.9)#186 |
| 2. | Weston | 100.0% | 44.3%(+55.7)#2 | 46.1%(+53.9)#187 |
| 3. | Duncan | 100.0% | 44.3%(+55.7)#3 | 46.1%(+53.9)#213 |
| 4. | Argyle | 100.0% | 44.3%(+55.7)#4 | 46.1%(+53.9)#283 |
| 5. | Frytown | 100.0% | 44.3%(+55.7)#5 | 46.1%(+53.9)#312 |
| 6. | Otranto | 100.0% | 44.3%(+55.7)#6 | 46.1%(+53.9)#350 |
| 7. | Durango | 100.0% | 44.3%(+55.7)#7 | 46.1%(+53.9)#374 |
| 8. | Roseville | 100.0% | 44.3%(+55.7)#9 | 46.1%(+53.9)#390 |
| 9. | Big Rock | 100.0% | 44.3%(+55.7)#10 | 46.1%(+53.9)#391 |
| 10. | Shueyville | 85.4% | 44.3%(+41.1)#11 | 46.1%(+39.3)#864 |
| 11. | University Heights | 83.5% | 44.3%(+39.2)#12 | 46.1%(+37.4)#1,017 |
| 12. | Diamondhead Lake | 82.2% | 44.3%(+37.9)#13 | 46.1%(+36.1)#1,147 |
| 13. | Twin Lakes | 80.5% | 44.3%(+36.2)#14 | 46.1%(+34.4)#1,334 |
| 14. | Bentley | 78.6% | 44.3%(+34.3)#15 | 46.1%(+32.5)#1,570 |
| 15. | Huxley | 78.1% | 44.3%(+33.8)#16 | 46.1%(+32.0)#1,623 |
| 16. | Douds | 77.8% | 44.3%(+33.5)#17 | 46.1%(+31.7)#1,675 |
| 17. | Polk City | 76.1% | 44.3%(+31.8)#18 | 46.1%(+30.0)#1,907 |
| 18. | Stone City | 75.0% | 44.3%(+30.7)#19 | 46.1%(+28.9)#2,075 |
| 19. | Kent Estates | 74.3% | 44.3%(+30.0)#20 | 46.1%(+28.2)#2,184 |
| 20. | Alleman | 73.6% | 44.3%(+29.3)#21 | 46.1%(+27.5)#2,288 |
| 21. | Solon | 72.9% | 44.3%(+28.6)#22 | 46.1%(+26.8)#2,384 |
| 22. | Fairfax | 72.9% | 44.3%(+28.6)#23 | 46.1%(+26.8)#2,386 |
| 23. | Craig | 72.7% | 44.3%(+28.4)#24 | 46.1%(+26.6)#2,438 |
| 24. | Sun Valley Lake | 71.2% | 44.3%(+26.9)#25 | 46.1%(+25.1)#2,698 |
| 25. | Oak Hills | 71.1% | 44.3%(+26.8)#26 | 46.1%(+25.0)#2,716 |
| 26. | Cumming | 70.6% | 44.3%(+26.3)#27 | 46.1%(+24.5)#2,793 |
| 27. | Clive | 70.0% | 44.3%(+25.7)#28 | 46.1%(+23.9)#2,877 |
| 28. | Walford | 69.6% | 44.3%(+25.3)#29 | 46.1%(+23.5)#2,950 |
| 29. | Oakland Acres | 69.4% | 44.3%(+25.1)#30 | 46.1%(+23.3)#2,987 |
| 30. | Atkins | 69.2% | 44.3%(+24.9)#31 | 46.1%(+23.1)#3,015 |
| 31. | Ricketts | 68.8% | 44.3%(+24.5)#32 | 46.1%(+22.7)#3,095 |
| 32. | Willey | 68.7% | 44.3%(+24.4)#33 | 46.1%(+22.6)#3,113 |
| 33. | Lake Panorama | 68.5% | 44.3%(+24.2)#34 | 46.1%(+22.4)#3,156 |
| 34. | Waukee | 67.9% | 44.3%(+23.6)#35 | 46.1%(+21.8)#3,265 |
| 35. | Swaledale | 67.9% | 44.3%(+23.6)#36 | 46.1%(+21.8)#3,277 |
| 36. | Granger | 67.4% | 44.3%(+23.1)#37 | 46.1%(+21.3)#3,357 |
| 37. | Swedesburg | 66.7% | 44.3%(+22.4)#38 | 46.1%(+20.6)#3,467 |
| 38. | Augusta | 66.7% | 44.3%(+22.4)#39 | 46.1%(+20.6)#3,478 |
| 39. | Burchinal | 66.7% | 44.3%(+22.4)#40 | 46.1%(+20.6)#3,487 |
| 40. | Rodman | 66.7% | 44.3%(+22.4)#41 | 46.1%(+20.6)#3,490 |
| 41. | Gillett Grove | 66.6% | 44.3%(+22.3)#42 | 46.1%(+20.5)#3,521 |
| 42. | Bevington | 66.6% | 44.3%(+22.3)#43 | 46.1%(+20.5)#3,523 |
| 43. | North Liberty | 66.4% | 44.3%(+22.1)#44 | 46.1%(+20.3)#3,545 |
| 44. | Urbandale | 66.1% | 44.3%(+21.8)#45 | 46.1%(+20.0)#3,587 |
| 45. | Hudson | 66.1% | 44.3%(+21.8)#46 | 46.1%(+20.0)#3,601 |
| 46. | Van Meter | 65.7% | 44.3%(+21.4)#47 | 46.1%(+19.6)#3,694 |
| 47. | Earlham | 65.7% | 44.3%(+21.4)#48 | 46.1%(+19.6)#3,695 |
| 48. | Ackworth | 65.7% | 44.3%(+21.4)#49 | 46.1%(+19.6)#3,703 |
| 49. | Ankeny | 65.6% | 44.3%(+21.3)#50 | 46.1%(+19.5)#3,707 |
| 50. | Urbana | 65.5% | 44.3%(+21.2)#51 | 46.1%(+19.4)#3,745 |
| 51. | Mcclelland | 65.2% | 44.3%(+20.9)#52 | 46.1%(+19.1)#3,809 |
| 52. | Asbury | 65.0% | 44.3%(+20.7)#53 | 46.1%(+18.9)#3,841 |
| 53. | Long Grove | 64.9% | 44.3%(+20.6)#54 | 46.1%(+18.8)#3,865 |
| 54. | Oyens | 64.9% | 44.3%(+20.6)#55 | 46.1%(+18.8)#3,872 |
| 55. | Sperry | 64.8% | 44.3%(+20.5)#56 | 46.1%(+18.7)#3,889 |
| 56. | Amana | 64.7% | 44.3%(+20.4)#57 | 46.1%(+18.6)#3,902 |
| 57. | Norwalk | 64.5% | 44.3%(+20.2)#58 | 46.1%(+18.4)#3,932 |
| 58. | Bondurant | 64.5% | 44.3%(+20.2)#59 | 46.1%(+18.4)#3,938 |
| 59. | Gilbert | 63.4% | 44.3%(+19.1)#60 | 46.1%(+17.3)#4,176 |
| 60. | Swisher | 63.3% | 44.3%(+19.0)#61 | 46.1%(+17.2)#4,198 |
| 61. | Bristow | 63.0% | 44.3%(+18.7)#62 | 46.1%(+16.9)#4,270 |
| 62. | Mount Vernon | 62.8% | 44.3%(+18.5)#63 | 46.1%(+16.7)#4,309 |
| 63. | Downey | 62.5% | 44.3%(+18.2)#64 | 46.1%(+16.4)#4,385 |
| 64. | Donahue | 62.3% | 44.3%(+18.0)#65 | 46.1%(+16.2)#4,435 |
| 65. | Bettendorf | 62.0% | 44.3%(+17.7)#66 | 46.1%(+15.9)#4,479 |
| 66. | Adel | 62.0% | 44.3%(+17.7)#67 | 46.1%(+15.9)#4,484 |
| 67. | Johnston | 61.7% | 44.3%(+17.4)#68 | 46.1%(+15.6)#4,544 |
| 68. | Bertram | 61.7% | 44.3%(+17.4)#69 | 46.1%(+15.6)#4,561 |
| 69. | Lawton | 61.4% | 44.3%(+17.1)#70 | 46.1%(+15.3)#4,633 |
| 70. | Robins | 61.1% | 44.3%(+16.8)#71 | 46.1%(+15.0)#4,703 |
| 71. | Keomah Village | 61.1% | 44.3%(+16.8)#72 | 46.1%(+15.0)#4,716 |
| 72. | Houghton | 60.8% | 44.3%(+16.5)#73 | 46.1%(+14.7)#4,782 |
| 73. | Grimes | 60.7% | 44.3%(+16.4)#74 | 46.1%(+14.6)#4,788 |
| 74. | Roland | 60.7% | 44.3%(+16.4)#75 | 46.1%(+14.6)#4,805 |
| 75. | Westphalia | 60.5% | 44.3%(+16.2)#76 | 46.1%(+14.4)#4,850 |
| 76. | Panama | 60.3% | 44.3%(+16.0)#77 | 46.1%(+14.2)#4,891 |
| 77. | Dike | 60.0% | 44.3%(+15.7)#78 | 46.1%(+13.9)#4,951 |
| 78. | Janesville | 60.0% | 44.3%(+15.7)#79 | 46.1%(+13.9)#4,953 |
| 79. | Park View | 59.9% | 44.3%(+15.6)#80 | 46.1%(+13.8)#5,020 |
| 80. | Treynor | 59.6% | 44.3%(+15.3)#81 | 46.1%(+13.5)#5,085 |
| 81. | Montour | 59.6% | 44.3%(+15.3)#82 | 46.1%(+13.5)#5,088 |
| 82. | Sergeant Bluff | 59.5% | 44.3%(+15.2)#83 | 46.1%(+13.4)#5,101 |
| 83. | Slater | 59.0% | 44.3%(+14.7)#84 | 46.1%(+12.9)#5,232 |
| 84. | Denmark | 58.8% | 44.3%(+14.5)#85 | 46.1%(+12.7)#5,279 |
| 85. | Balltown | 58.8% | 44.3%(+14.5)#86 | 46.1%(+12.7)#5,290 |
| 86. | Hinton | 58.6% | 44.3%(+14.3)#87 | 46.1%(+12.5)#5,326 |
| 87. | Arnolds Park | 58.5% | 44.3%(+14.2)#88 | 46.1%(+12.4)#5,355 |
| 88. | Rickardsville | 58.3% | 44.3%(+14.0)#89 | 46.1%(+12.2)#5,400 |
| 89. | Underwood | 58.1% | 44.3%(+13.8)#90 | 46.1%(+12.0)#5,444 |
| 90. | Linden | 58.1% | 44.3%(+13.8)#91 | 46.1%(+12.0)#5,450 |
| 91. | Peosta | 57.7% | 44.3%(+13.4)#92 | 46.1%(+11.6)#5,541 |
| 92. | Pleasanton | 57.7% | 44.3%(+13.4)#93 | 46.1%(+11.6)#5,559 |
| 93. | Ruthven | 57.6% | 44.3%(+13.3)#94 | 46.1%(+11.5)#5,577 |
| 94. | Ely | 57.4% | 44.3%(+13.1)#95 | 46.1%(+11.3)#5,612 |
| 95. | Coralville | 57.3% | 44.3%(+13.0)#96 | 46.1%(+11.2)#5,627 |
| 96. | Lambs Grove | 57.1% | 44.3%(+12.8)#97 | 46.1%(+11.0)#5,700 |
| 97. | Sherrill | 57.1% | 44.3%(+12.8)#98 | 46.1%(+11.0)#5,701 |
| 98. | Buck Grove | 57.1% | 44.3%(+12.8)#99 | 46.1%(+11.0)#5,714 |
| 99. | Durant | 56.9% | 44.3%(+12.6)#100 | 46.1%(+10.8)#5,746 |
| 100. | Wahpeton | 56.8% | 44.3%(+12.5)#101 | 46.1%(+10.7)#5,777 |
Common Questions
What are the Top 10 Cities with the Highest Percentage of Families with Income Above $100,000 in Iowa?
Top 10 Cities with the Highest Percentage of Families with Income Above $100,000 in Iowa are:
#1
100.0%
#2
100.0%
#3
100.0%
#4
100.0%
#5
100.0%
#6
100.0%
#7
100.0%
#8
85.4%
#9
83.5%
#10
82.2%
What city has the Highest Percentage of Families with Income Above $100,000 in Iowa?
High Amana has the Highest Percentage of Families with Income Above $100,000 in Iowa with 100.0%.
What is the Percentage of Families with Income Above $100,000 in the State of Iowa?
Percentage of Families with Income Above $100,000 in Iowa is 44.3%.
What is the Percentage of Families with Income Above $100,000 in the United States?
Percentage of Families with Income Above $100,000 in the United States is 46.1%.