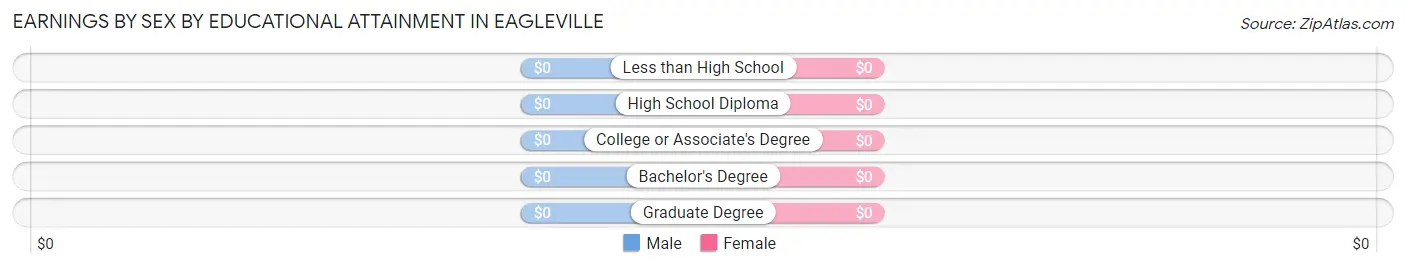
Earnings by Sex by Educational Attainment in Eagleville
Educational Attainment
Male Income
Female Income
Less than High School
-
-
High School Diploma
-
-
College or Associate's Degree
-
-
Bachelor's Degree
-
-
Graduate Degree
-
-
Total
-
-
Family Income in Eagleville
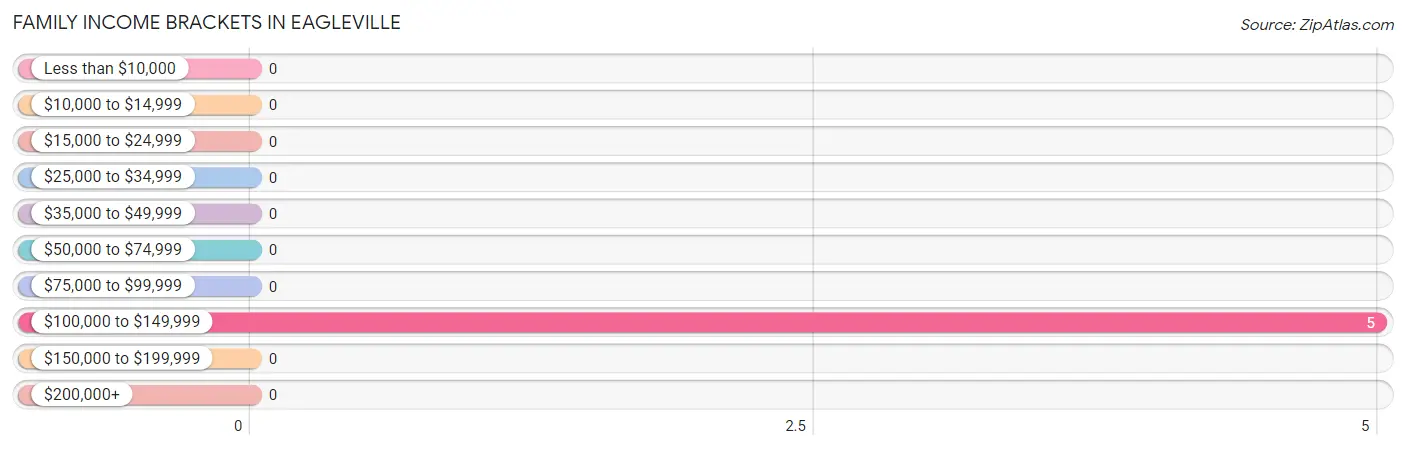
Family Income Brackets in Eagleville
According to the Eagleville family income data, there are 5 families falling into the $100,000 to $149,999 income range, which is the most common income bracket and makes up 100.0% of all families.
Income Bracket
# Families
% Families
Less than $10,000
0
0.0%
$10,000 to $14,999
0
0.0%
$15,000 to $24,999
0
0.0%
$25,000 to $34,999
0
0.0%
$35,000 to $49,999
0
0.0%
$50,000 to $74,999
0
0.0%
$75,000 to $99,999
0
0.0%
$100,000 to $149,999
5
100.0%
$150,000 to $199,999
0
0.0%
$200,000+
0
0.0%
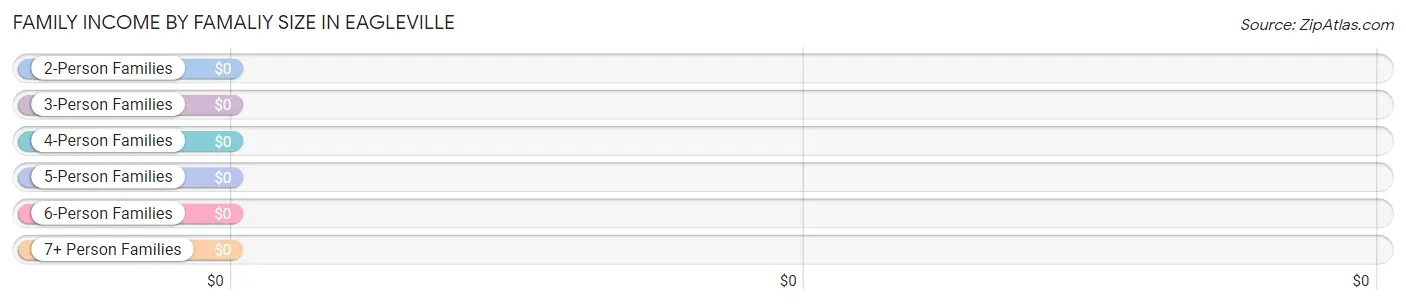
Family Income by Famaliy Size in Eagleville
Income Bracket
# Families
Median Income
2-Person Families
5 (100.0%)
$0
3-Person Families
0 (0.0%)
$0
4-Person Families
0 (0.0%)
$0
5-Person Families
0 (0.0%)
$0
6-Person Families
0 (0.0%)
$0
7+ Person Families
0 (0.0%)
$0
Total
5 (100.0%)
$0
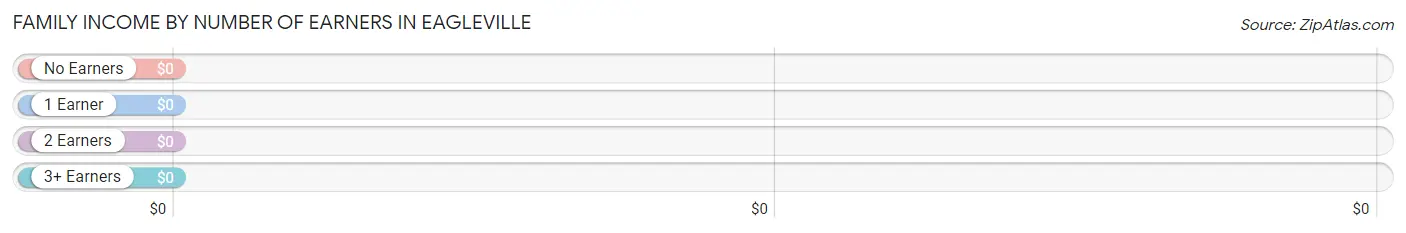
Family Income by Number of Earners in Eagleville
Number of Earners
# Families
Median Income
No Earners
5 (100.0%)
$0
1 Earner
0 (0.0%)
$0
2 Earners
0 (0.0%)
$0
3+ Earners
0 (0.0%)
$0
Total
5 (100.0%)
$0
Household Income in Eagleville
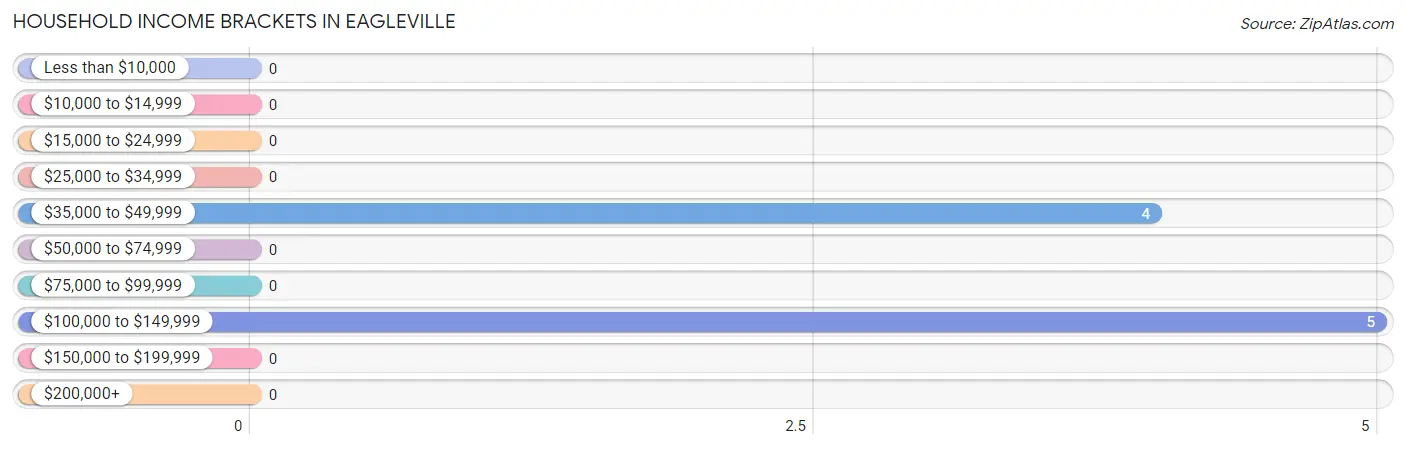
Household Income Brackets in Eagleville
With 5 households falling in the category, the $100,000 to $149,999 income range is the most frequent in Eagleville, accounting for 55.6% of all households.
Income Bracket
# Households
% Households
Less than $10,000
0
0.0%
$10,000 to $14,999
0
0.0%
$15,000 to $24,999
0
0.0%
$25,000 to $34,999
0
0.0%
$35,000 to $49,999
4
44.4%
$50,000 to $74,999
0
0.0%
$75,000 to $99,999
0
0.0%
$100,000 to $149,999
5
55.6%
$150,000 to $199,999
0
0.0%
$200,000+
0
0.0%
Household Income by Householder Age in Eagleville
Income Bracket
# Households
Median Income
15 to 24 Years
0 (0.0%)
$0
25 to 44 Years
0 (0.0%)
$0
45 to 64 Years
4 (44.4%)
$0
65+ Years
5 (55.6%)
$0
Total
9 (100.0%)
$0
Poverty in Eagleville
Income Below Poverty by Sex and Age in Eagleville
Age Bracket
Male
Female
Under 5 Years
0 (0.0%)
0 (0.0%)
5 Years
0 (0.0%)
0 (0.0%)
6 to 11 Years
0 (0.0%)
0 (0.0%)
12 to 14 Years
0 (0.0%)
0 (0.0%)
15 Years
0 (0.0%)
0 (0.0%)
16 and 17 Years
0 (0.0%)
0 (0.0%)
18 to 24 Years
0 (0.0%)
0 (0.0%)
25 to 34 Years
0 (0.0%)
0 (0.0%)
35 to 44 Years
0 (0.0%)
0 (0.0%)
45 to 54 Years
0 (0.0%)
0 (0.0%)
55 to 64 Years
0 (0.0%)
0 (0.0%)
65 to 74 Years
0 (0.0%)
0 (0.0%)
75 Years and over
0 (0.0%)
0 (0.0%)
Total
0 (0.0%)
0 (0.0%)
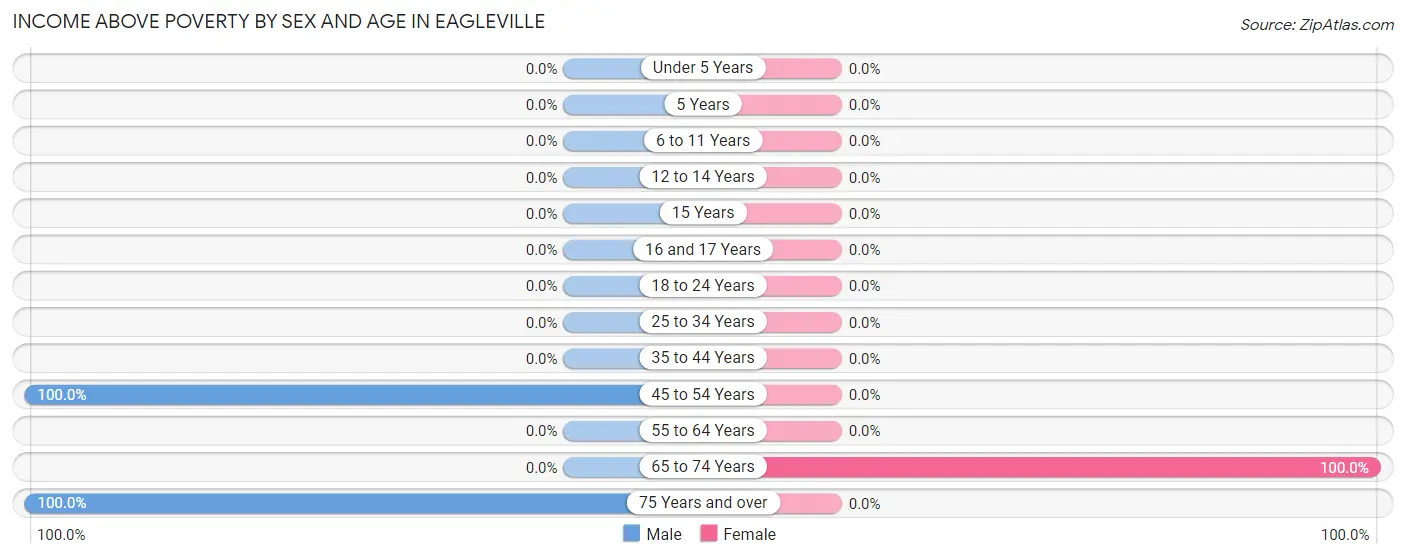
Income Above Poverty by Sex and Age in Eagleville
According to the poverty statistics in Eagleville, males aged 45 to 54 years and females aged 65 to 74 years are the age groups that are most secure financially, with 100.0% of males and 100.0% of females in these age groups living above the poverty line.
Age Bracket
Male
Female
Under 5 Years
0 (0.0%)
0 (0.0%)
5 Years
0 (0.0%)
0 (0.0%)
6 to 11 Years
0 (0.0%)
0 (0.0%)
12 to 14 Years
0 (0.0%)
0 (0.0%)
15 Years
0 (0.0%)
0 (0.0%)
16 and 17 Years
0 (0.0%)
0 (0.0%)
18 to 24 Years
0 (0.0%)
0 (0.0%)
25 to 34 Years
0 (0.0%)
0 (0.0%)
35 to 44 Years
0 (0.0%)
0 (0.0%)
45 to 54 Years
4 (100.0%)
0 (0.0%)
55 to 64 Years
0 (0.0%)
0 (0.0%)
65 to 74 Years
0 (0.0%)
4 (100.0%)
75 Years and over
5 (100.0%)
0 (0.0%)
Total
9 (100.0%)
4 (100.0%)
Income Below Poverty Among Married-Couple Families in Eagleville
Children
Above Poverty
Below Poverty
No Children
5 (100.0%)
0 (0.0%)
1 or 2 Children
0 (0.0%)
0 (0.0%)
3 or 4 Children
0 (0.0%)
0 (0.0%)
5 or more Children
0 (0.0%)
0 (0.0%)
Total
5 (100.0%)
0 (0.0%)
Income Below Poverty Among Single-Parent Households in Eagleville
Children
Single Father
Single Mother
No Children
0 (0.0%)
0 (0.0%)
1 or 2 Children
0 (0.0%)
0 (0.0%)
3 or 4 Children
0 (0.0%)
0 (0.0%)
5 or more Children
0 (0.0%)
0 (0.0%)
Total
0 (0.0%)
0 (0.0%)
Income Below Poverty Among Married-Couple vs Single-Parent Households in Eagleville
Children
Married-Couple Families
Single-Parent Households
No Children
0 (0.0%)
0 (0.0%)
1 or 2 Children
0 (0.0%)
0 (0.0%)
3 or 4 Children
0 (0.0%)
0 (0.0%)
5 or more Children
0 (0.0%)
0 (0.0%)
Total
0 (0.0%)
0 (0.0%)
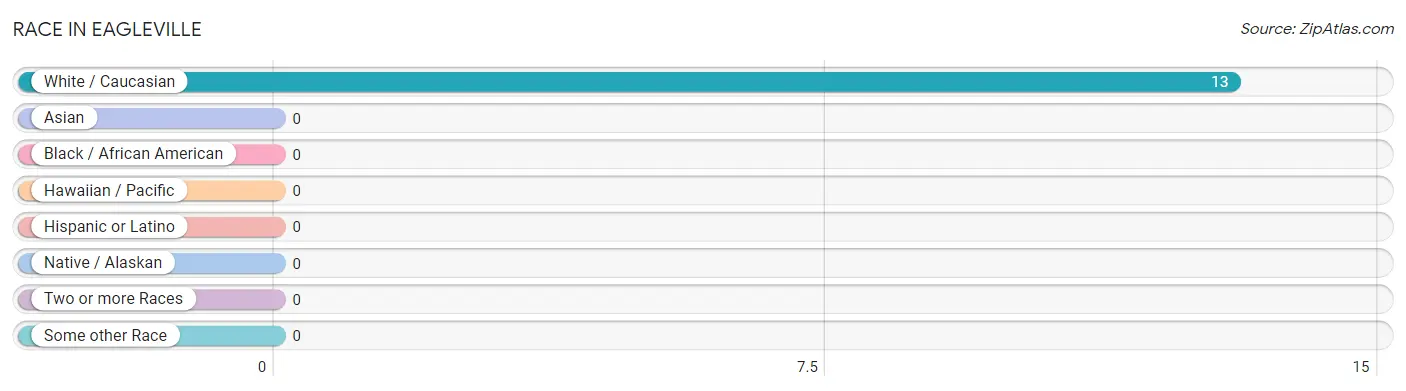
Race in Eagleville
The most populous races in Eagleville are , and White / Caucasian (13 | 100.0%).
Race
# Population
% Population
Asian
0
0.0%
Black / African American
0
0.0%
Hawaiian / Pacific
0
0.0%
Hispanic or Latino
0
0.0%
Native / Alaskan
0
0.0%
White / Caucasian
13
100.0%
Two or more Races
0
0.0%
Some other Race
0
0.0%
Total
13
100.0%
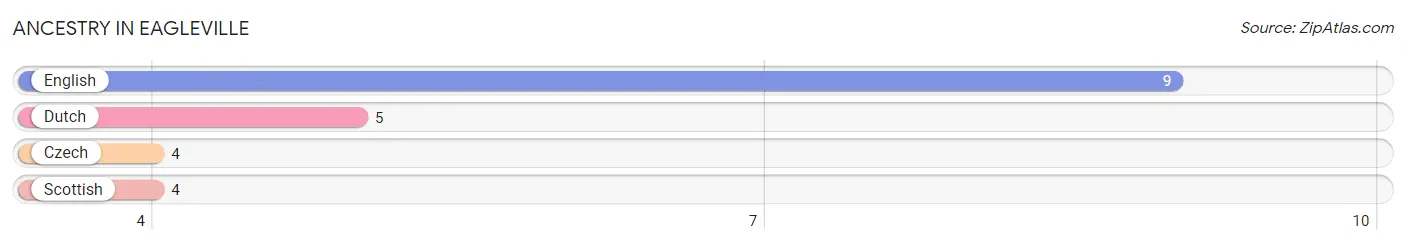
Ancestry in Eagleville
The most populous ancestries reported in Eagleville are English (9 | 69.2%), Dutch (5 | 38.5%), Czech (4 | 30.8%), and Scottish (4 | 30.8%), together accounting for 169.2% of all Eagleville residents.
Ancestry
# Population
% Population
Czech
4
30.8%
Dutch
5
38.5%
English
9
69.2%
Scottish
4
30.8%
View All 4 Rows
Immigrants in Eagleville
Immigration Origin
# Population
% Population
View All 0 Rows
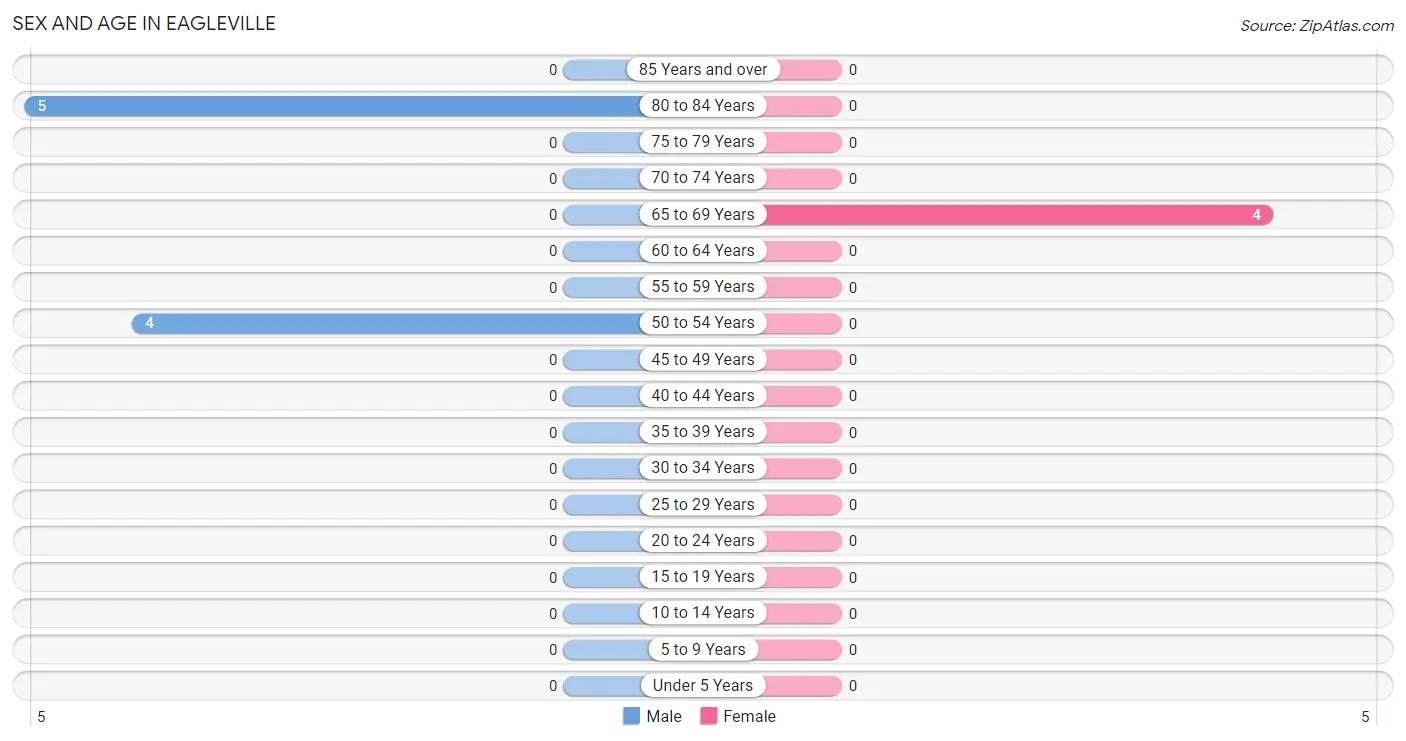
Sex and Age in Eagleville
Sex and Age in Eagleville
The most populous age groups in Eagleville are 80 to 84 Years (5 | 55.6%) for men and 65 to 69 Years (4 | 100.0%) for women.
Age Bracket
Male
Female
Under 5 Years
0 (0.0%)
0 (0.0%)
5 to 9 Years
0 (0.0%)
0 (0.0%)
10 to 14 Years
0 (0.0%)
0 (0.0%)
15 to 19 Years
0 (0.0%)
0 (0.0%)
20 to 24 Years
0 (0.0%)
0 (0.0%)
25 to 29 Years
0 (0.0%)
0 (0.0%)
30 to 34 Years
0 (0.0%)
0 (0.0%)
35 to 39 Years
0 (0.0%)
0 (0.0%)
40 to 44 Years
0 (0.0%)
0 (0.0%)
45 to 49 Years
0 (0.0%)
0 (0.0%)
50 to 54 Years
4 (44.4%)
0 (0.0%)
55 to 59 Years
0 (0.0%)
0 (0.0%)
60 to 64 Years
0 (0.0%)
0 (0.0%)
65 to 69 Years
0 (0.0%)
4 (100.0%)
70 to 74 Years
0 (0.0%)
0 (0.0%)
75 to 79 Years
0 (0.0%)
0 (0.0%)
80 to 84 Years
5 (55.6%)
0 (0.0%)
85 Years and over
0 (0.0%)
0 (0.0%)
Total
9 (100.0%)
4 (100.0%)
Families and Households in Eagleville
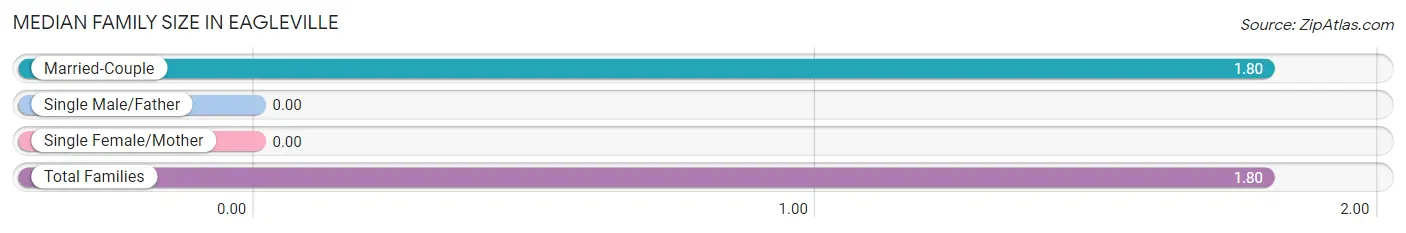
Median Family Size in Eagleville
Family Type
# Families
Family Size
Married-Couple
5 (100.0%)
1.80
Single Male/Father
0 (0.0%)
-
Single Female/Mother
0 (0.0%)
-
Total Families
5 (100.0%)
1.80
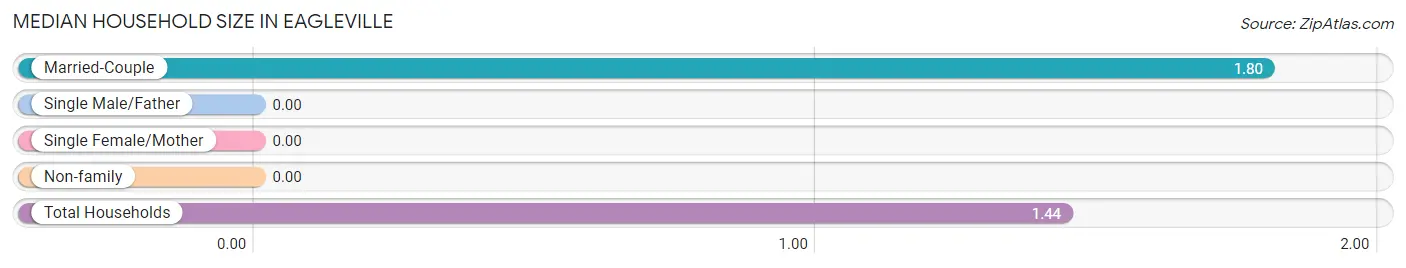
Median Household Size in Eagleville
Household Type
# Households
Household Size
Married-Couple
5 (55.6%)
1.80
Single Male/Father
0 (0.0%)
-
Single Female/Mother
0 (0.0%)
-
Non-family
4 (44.4%)
-
Total Households
9 (100.0%)
1.44
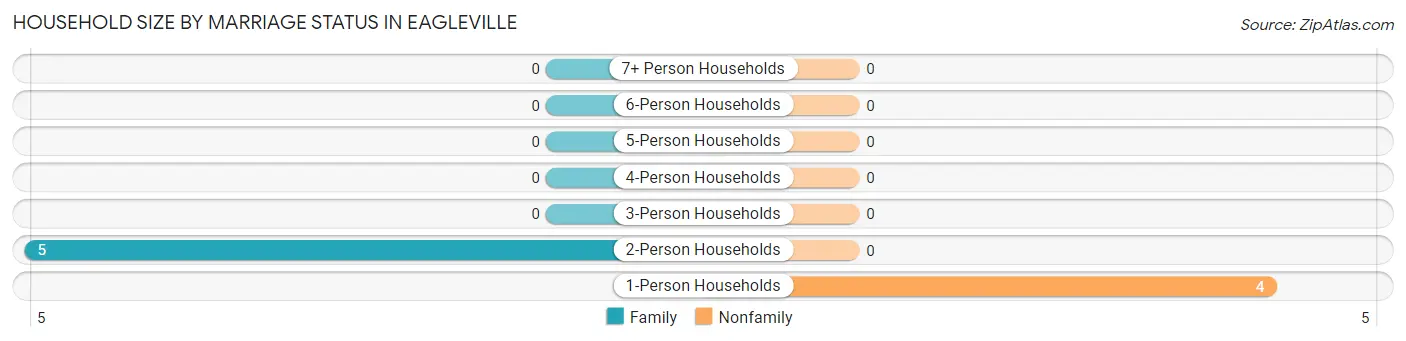
Household Size by Marriage Status in Eagleville
Out of a total of 9 households in Eagleville, 5 (55.6%) are family households, while 4 (44.4%) are nonfamily households. The most numerous type of family households are 2-person households, comprising 5, and the most common type of nonfamily households are 1-person households, comprising 4.
Household Size
Family Households
Nonfamily Households
1-Person Households
-
4 (44.4%)
2-Person Households
5 (55.6%)
0 (0.0%)
3-Person Households
0 (0.0%)
0 (0.0%)
4-Person Households
0 (0.0%)
0 (0.0%)
5-Person Households
0 (0.0%)
0 (0.0%)
6-Person Households
0 (0.0%)
0 (0.0%)
7+ Person Households
0 (0.0%)
0 (0.0%)
Total
5 (55.6%)
4 (44.4%)
Female Fertility in Eagleville
Fertility by Age in Eagleville
Age Bracket
Women with Births
Births / 1,000 Women
15 to 19 years
0 (0.0%)
0.0
20 to 34 years
0 (0.0%)
0.0
35 to 50 years
0 (0.0%)
0.0
Total
0 (0.0%)
0.0
Fertility by Age by Marriage Status in Eagleville
Age Bracket
Married
Unmarried
15 to 19 years
0 (0.0%)
0 (0.0%)
20 to 34 years
0 (0.0%)
0 (0.0%)
35 to 50 years
0 (0.0%)
0 (0.0%)
Total
0 (0.0%)
0 (0.0%)
Fertility by Education in Eagleville
Educational Attainment
Women with Births
Births / 1,000 Women
Less than High School
0 (0.0%)
0.0
High School Diploma
0 (0.0%)
0.0
College or Associate's Degree
0 (0.0%)
0.0
Bachelor's Degree
0 (0.0%)
0.0
Graduate Degree
0 (0.0%)
0.0
Total
0 (0.0%)
0.0
Fertility by Education by Marriage Status in Eagleville
Educational Attainment
Married
Unmarried
Less than High School
0 (0.0%)
0 (0.0%)
High School Diploma
0 (0.0%)
0 (0.0%)
College or Associate's Degree
0 (0.0%)
0 (0.0%)
Bachelor's Degree
0 (0.0%)
0 (0.0%)
Graduate Degree
0 (0.0%)
0 (0.0%)
Total
0 (0.0%)
0 (0.0%)
Employment Characteristics in Eagleville
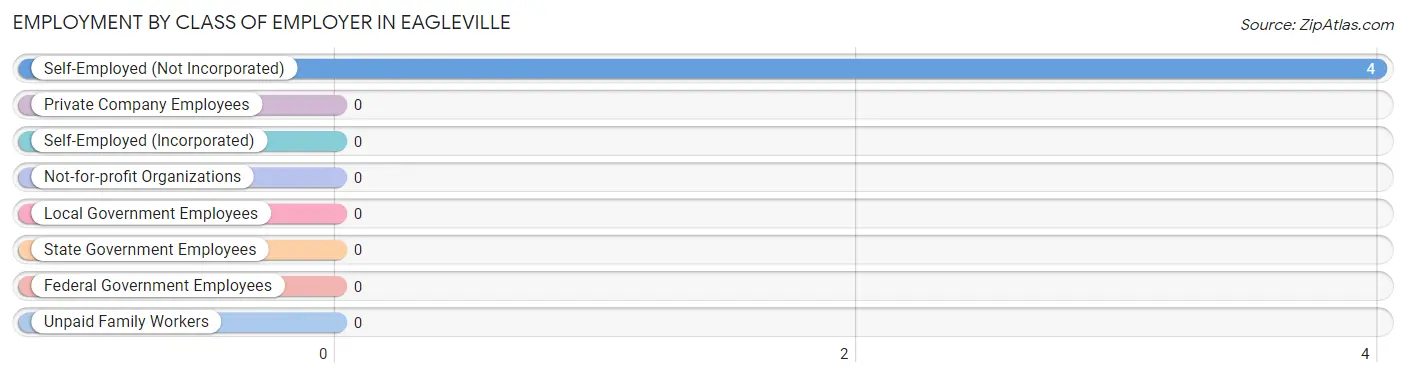
Employment by Class of Employer in Eagleville
Among the 4 employed individuals in Eagleville, , and self-employed (not incorporated) (4 | 100.0%) make up the most common classes of employment.
Employer Class
# Employees
% Employees
Private Company Employees
0
0.0%
Self-Employed (Incorporated)
0
0.0%
Self-Employed (Not Incorporated)
4
100.0%
Not-for-profit Organizations
0
0.0%
Local Government Employees
0
0.0%
State Government Employees
0
0.0%
Federal Government Employees
0
0.0%
Unpaid Family Workers
0
0.0%
Total
4
100.0%
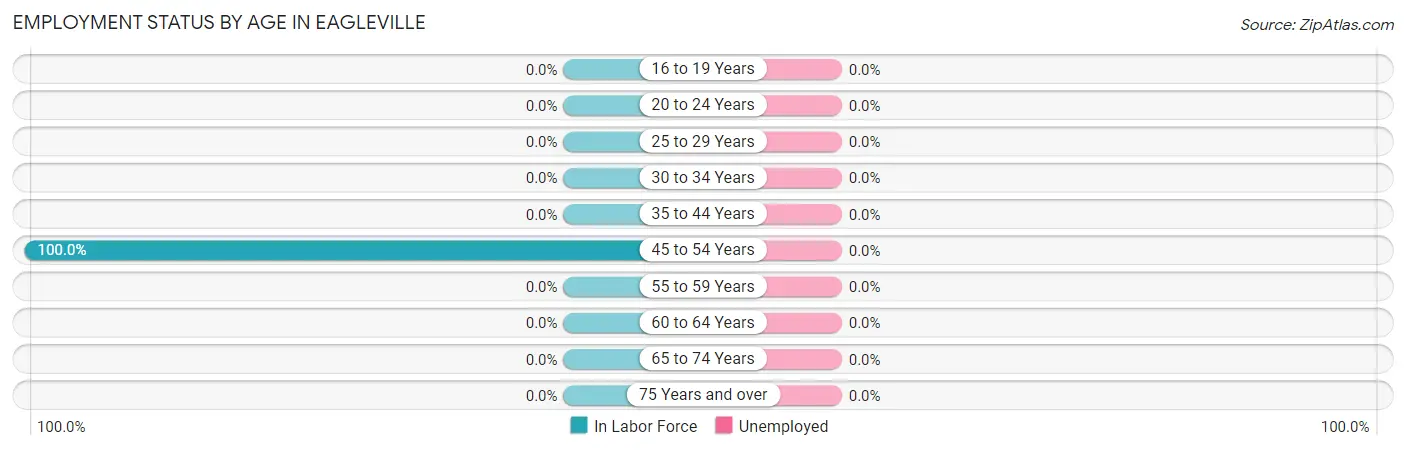
Employment Status by Age in Eagleville
Age Bracket
In Labor Force
Unemployed
16 to 19 Years
0 (0.0%)
0 (0.0%)
20 to 24 Years
0 (0.0%)
0 (0.0%)
25 to 29 Years
0 (0.0%)
0 (0.0%)
30 to 34 Years
0 (0.0%)
0 (0.0%)
35 to 44 Years
0 (0.0%)
0 (0.0%)
45 to 54 Years
4 (100.0%)
0 (0.0%)
55 to 59 Years
0 (0.0%)
0 (0.0%)
60 to 64 Years
0 (0.0%)
0 (0.0%)
65 to 74 Years
0 (0.0%)
0 (0.0%)
75 Years and over
0 (0.0%)
0 (0.0%)
Total
4 (30.8%)
0 (0.0%)
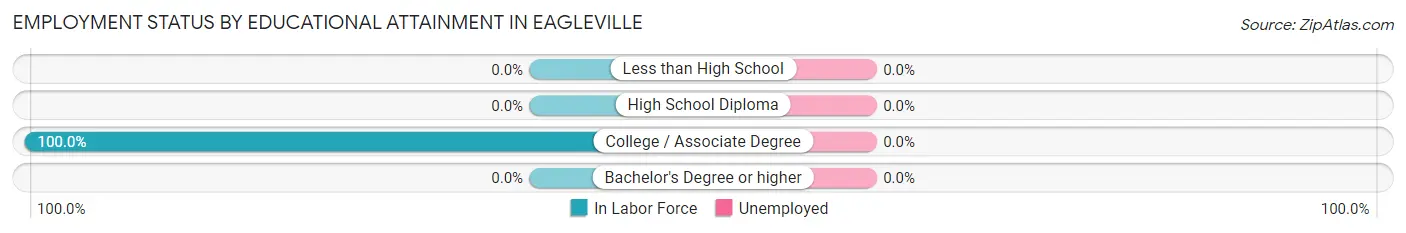
Employment Status by Educational Attainment in Eagleville
Educational Attainment
In Labor Force
Unemployed
Less than High School
0 (0.0%)
0 (0.0%)
High School Diploma
0 (0.0%)
0 (0.0%)
College / Associate Degree
4 (100.0%)
0 (0.0%)
Bachelor's Degree or higher
0 (0.0%)
0 (0.0%)
Total
4 (100.0%)
0 (0.0%)
Employment Occupations by Sex in Eagleville
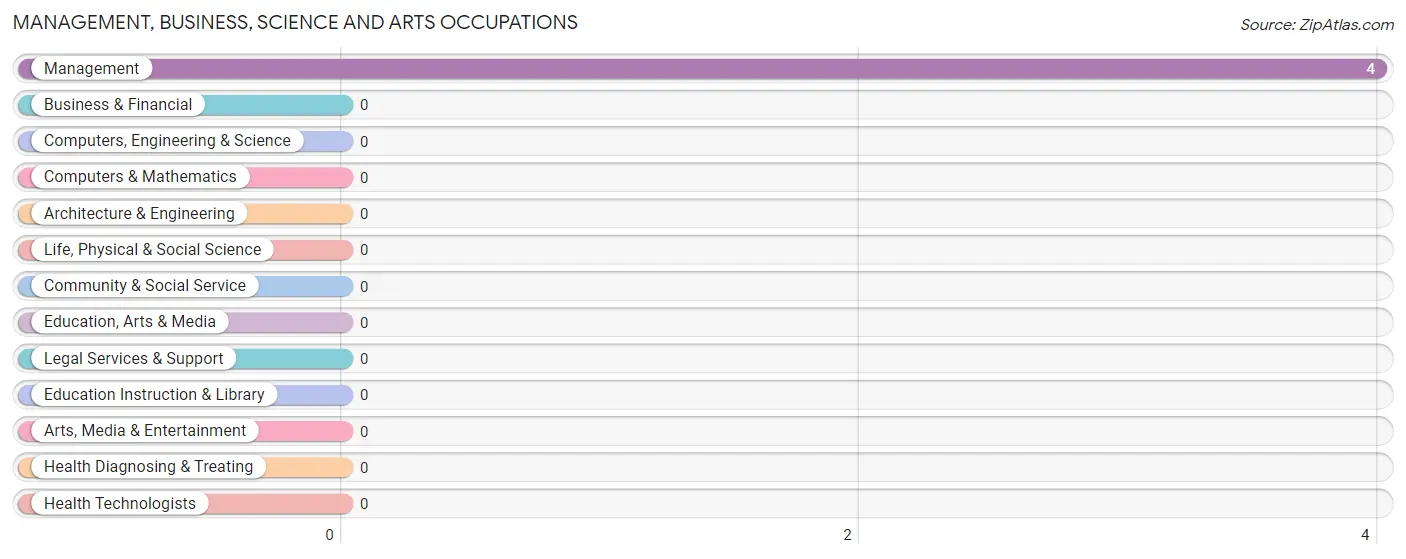
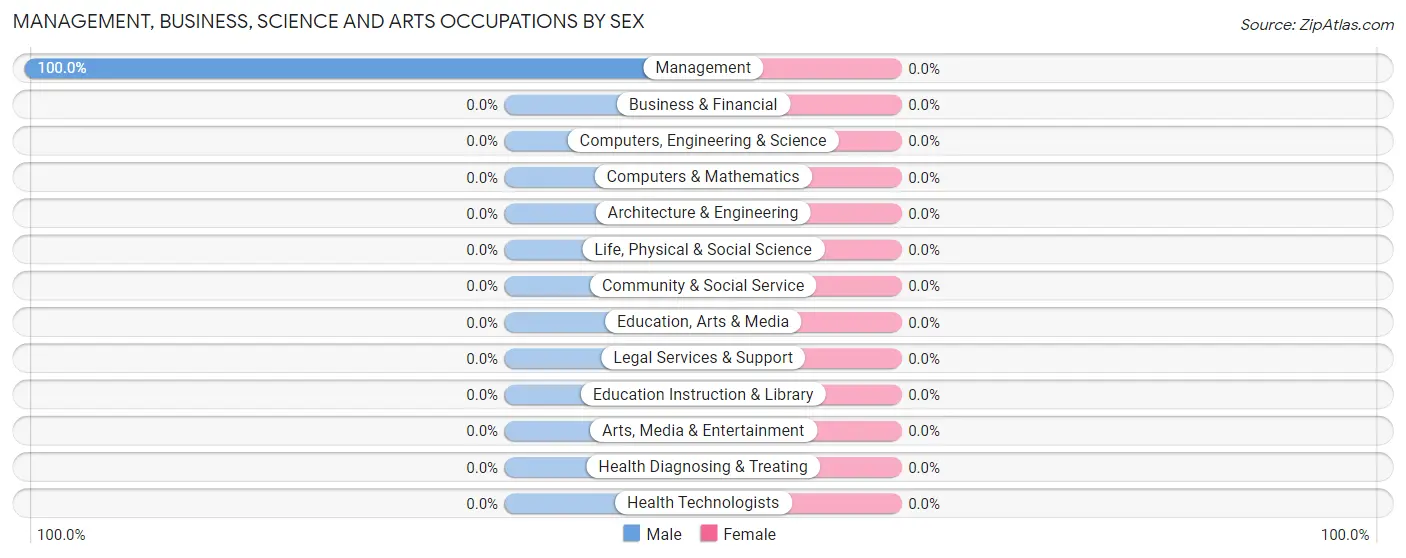
Management, Business, Science and Arts Occupations
The most common Management, Business, Science and Arts occupations in Eagleville are , and Management (4 | 100.0%).
Management, Business, Science and Arts Occupations by Sex
Occupation
Male
Female
Management
4 (100.0%)
0 (0.0%)
Business & Financial
0 (0.0%)
0 (0.0%)
Computers, Engineering & Science
0 (0.0%)
0 (0.0%)
Computers & Mathematics
0 (0.0%)
0 (0.0%)
Architecture & Engineering
0 (0.0%)
0 (0.0%)
Life, Physical & Social Science
0 (0.0%)
0 (0.0%)
Community & Social Service
0 (0.0%)
0 (0.0%)
Education, Arts & Media
0 (0.0%)
0 (0.0%)
Legal Services & Support
0 (0.0%)
0 (0.0%)
Education Instruction & Library
0 (0.0%)
0 (0.0%)
Arts, Media & Entertainment
0 (0.0%)
0 (0.0%)
Health Diagnosing & Treating
0 (0.0%)
0 (0.0%)
Health Technologists
0 (0.0%)
0 (0.0%)
Total (Category)
4 (100.0%)
0 (0.0%)
Total (Overall)
4 (100.0%)
0 (0.0%)
Services Occupations
Services Occupations by Sex
Occupation
Male
Female
Healthcare Support
0 (0.0%)
0 (0.0%)
Security & Protection
0 (0.0%)
0 (0.0%)
Firefighting & Prevention
0 (0.0%)
0 (0.0%)
Law Enforcement
0 (0.0%)
0 (0.0%)
Food Preparation & Serving
0 (0.0%)
0 (0.0%)
Cleaning & Maintenance
0 (0.0%)
0 (0.0%)
Personal Care & Service
0 (0.0%)
0 (0.0%)
Total (Category)
0 (0.0%)
0 (0.0%)
Total (Overall)
4 (100.0%)
0 (0.0%)
Sales and Office Occupations
Sales and Office Occupations by Sex
Occupation
Male
Female
Sales & Related
0 (0.0%)
0 (0.0%)
Office & Administration
0 (0.0%)
0 (0.0%)
Total (Category)
0 (0.0%)
0 (0.0%)
Total (Overall)
4 (100.0%)
0 (0.0%)
Natural Resources, Construction and Maintenance Occupations
Natural Resources, Construction and Maintenance Occupations by Sex
Occupation
Male
Female
Farming, Fishing & Forestry
0 (0.0%)
0 (0.0%)
Construction & Extraction
0 (0.0%)
0 (0.0%)
Installation, Maintenance & Repair
0 (0.0%)
0 (0.0%)
Total (Category)
0 (0.0%)
0 (0.0%)
Total (Overall)
4 (100.0%)
0 (0.0%)
Production, Transportation and Moving Occupations
Production, Transportation and Moving Occupations by Sex
Occupation
Male
Female
Production
0 (0.0%)
0 (0.0%)
Transportation
0 (0.0%)
0 (0.0%)
Material Moving
0 (0.0%)
0 (0.0%)
Total (Category)
0 (0.0%)
0 (0.0%)
Total (Overall)
4 (100.0%)
0 (0.0%)
Employment Industries by Sex in Eagleville
Employment Industries in Eagleville
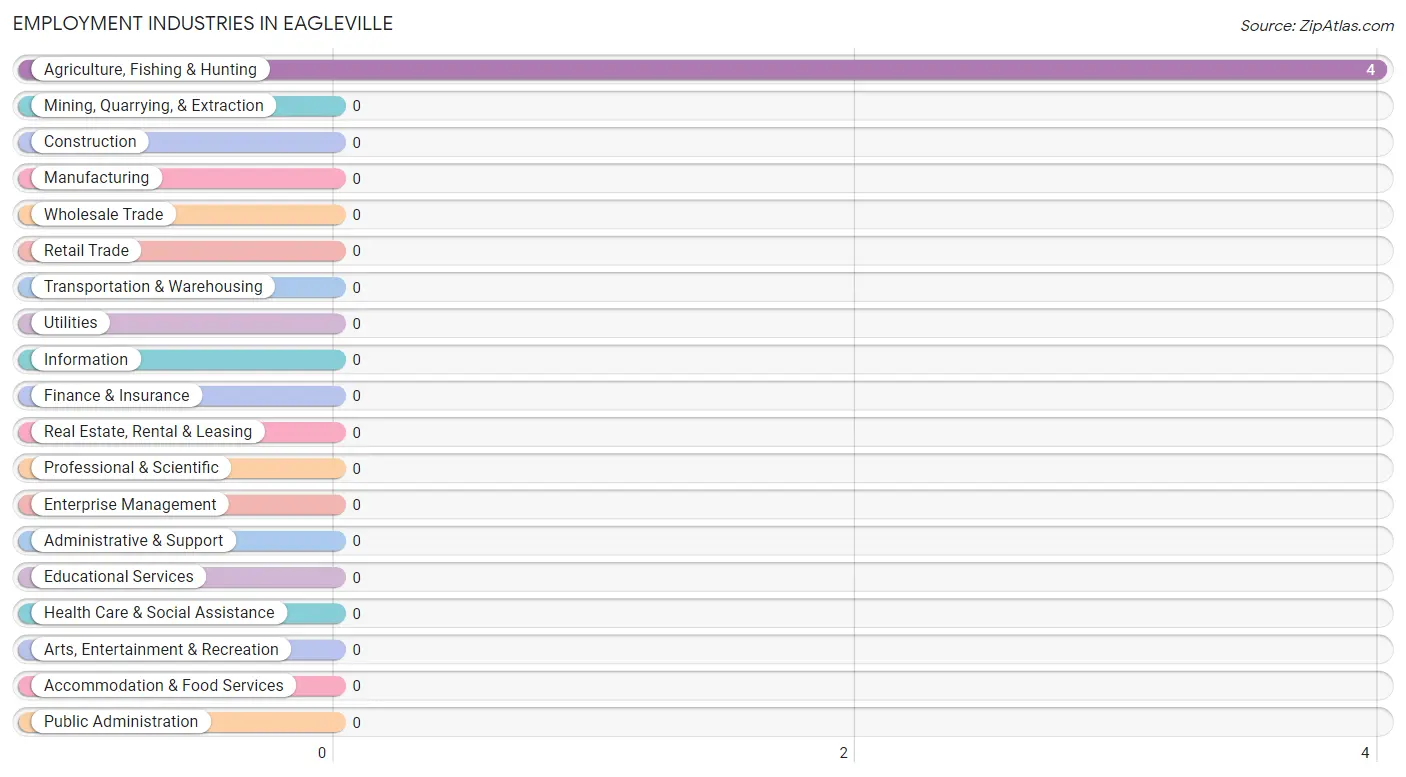
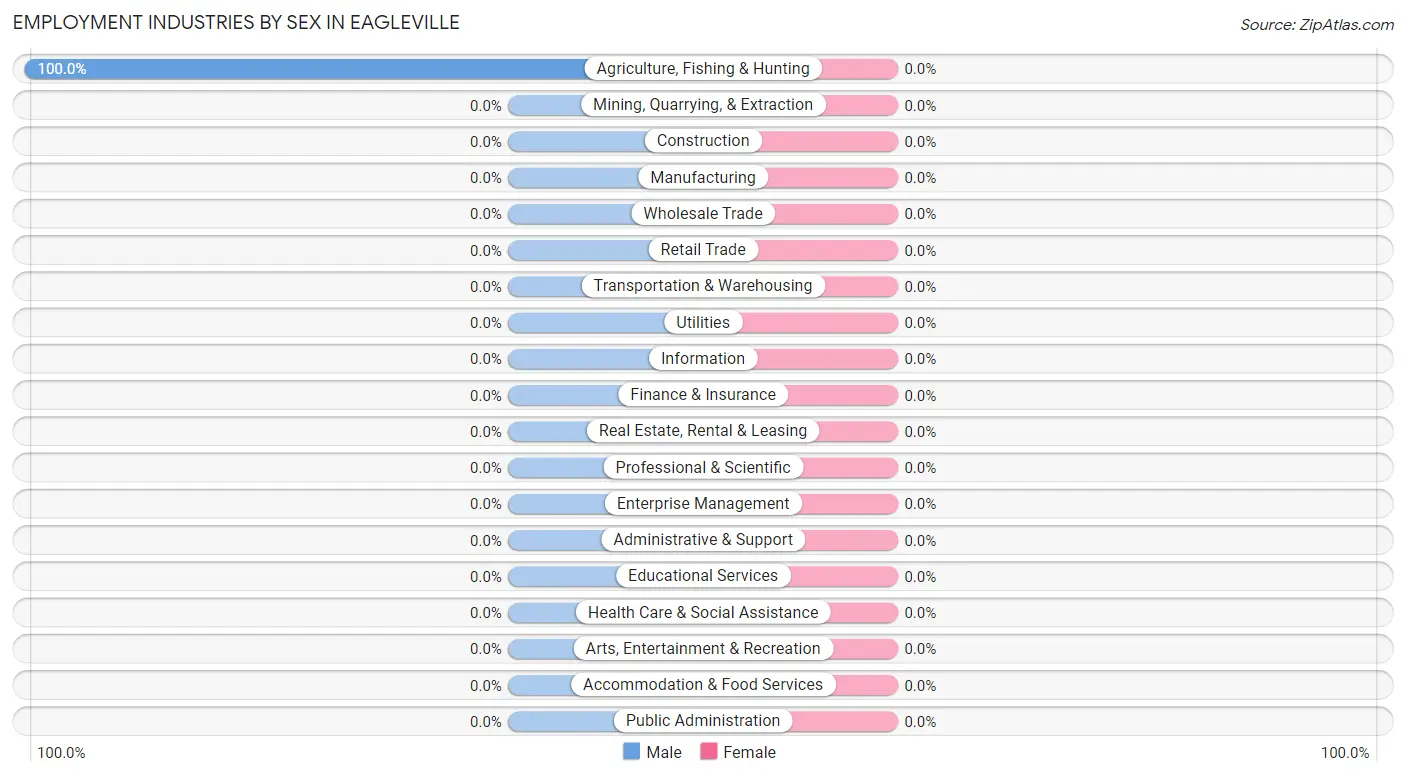
The major employment industries in Eagleville include , and Agriculture, Fishing & Hunting (4 | 100.0%).
Employment Industries by Sex in Eagleville
Industry
Male
Female
Agriculture, Fishing & Hunting
4 (100.0%)
0 (0.0%)
Mining, Quarrying, & Extraction
0 (0.0%)
0 (0.0%)
Construction
0 (0.0%)
0 (0.0%)
Manufacturing
0 (0.0%)
0 (0.0%)
Wholesale Trade
0 (0.0%)
0 (0.0%)
Retail Trade
0 (0.0%)
0 (0.0%)
Transportation & Warehousing
0 (0.0%)
0 (0.0%)
Utilities
0 (0.0%)
0 (0.0%)
Information
0 (0.0%)
0 (0.0%)
Finance & Insurance
0 (0.0%)
0 (0.0%)
Real Estate, Rental & Leasing
0 (0.0%)
0 (0.0%)
Professional & Scientific
0 (0.0%)
0 (0.0%)
Enterprise Management
0 (0.0%)
0 (0.0%)
Administrative & Support
0 (0.0%)
0 (0.0%)
Educational Services
0 (0.0%)
0 (0.0%)
Health Care & Social Assistance
0 (0.0%)
0 (0.0%)
Arts, Entertainment & Recreation
0 (0.0%)
0 (0.0%)
Accommodation & Food Services
0 (0.0%)
0 (0.0%)
Public Administration
0 (0.0%)
0 (0.0%)
Total
4 (100.0%)
0 (0.0%)
Education in Eagleville
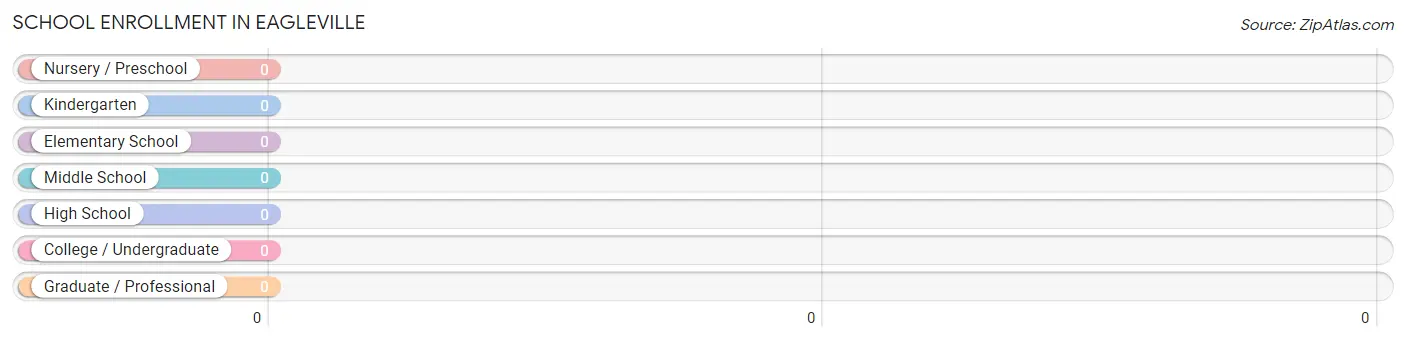
School Enrollment in Eagleville
School Level
# Students
% Students
Nursery / Preschool
0
0.0%
Kindergarten
0
0.0%
Elementary School
0
0.0%
Middle School
0
0.0%
High School
0
0.0%
College / Undergraduate
0
0.0%
Graduate / Professional
0
0.0%
Total
0
0.0%
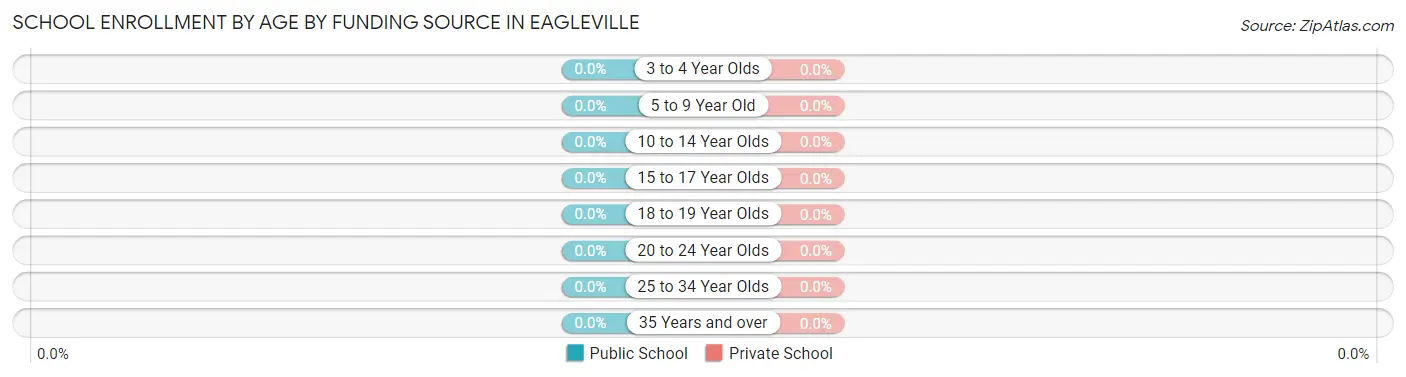
School Enrollment by Age by Funding Source in Eagleville
Age Bracket
Public School
Private School
3 to 4 Year Olds
0 (0.0%)
0 (0.0%)
5 to 9 Year Old
0 (0.0%)
0 (0.0%)
10 to 14 Year Olds
0 (0.0%)
0 (0.0%)
15 to 17 Year Olds
0 (0.0%)
0 (0.0%)
18 to 19 Year Olds
0 (0.0%)
0 (0.0%)
20 to 24 Year Olds
0 (0.0%)
0 (0.0%)
25 to 34 Year Olds
0 (0.0%)
0 (0.0%)
35 Years and over
0 (0.0%)
0 (0.0%)
Total
0 (0.0%)
0 (0.0%)
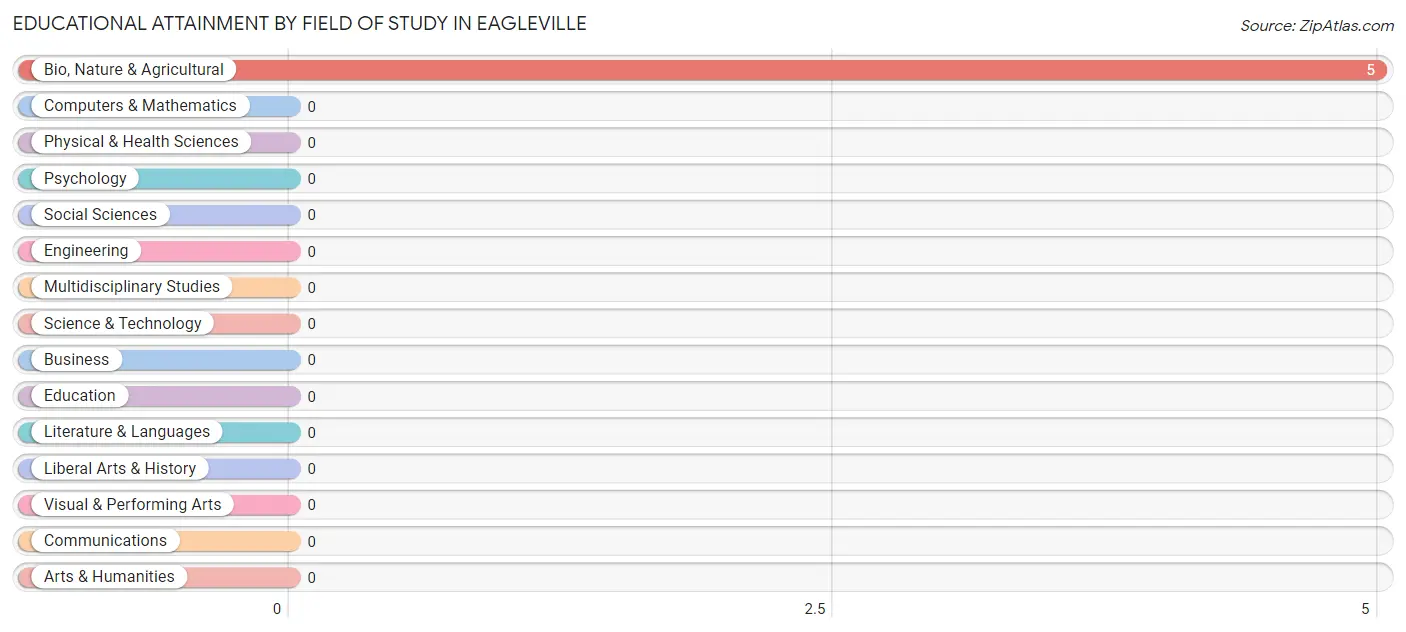
Educational Attainment by Field of Study in Eagleville
, and bio, nature & agricultural (5 | 100.0%) are the most common fields of study among 5 individuals in Eagleville who have obtained a bachelor's degree or higher.
Field of Study
# Graduates
% Graduates
Computers & Mathematics
0
0.0%
Bio, Nature & Agricultural
5
100.0%
Physical & Health Sciences
0
0.0%
Psychology
0
0.0%
Social Sciences
0
0.0%
Engineering
0
0.0%
Multidisciplinary Studies
0
0.0%
Science & Technology
0
0.0%
Business
0
0.0%
Education
0
0.0%
Literature & Languages
0
0.0%
Liberal Arts & History
0
0.0%
Visual & Performing Arts
0
0.0%
Communications
0
0.0%
Arts & Humanities
0
0.0%
Total
5
100.0%
Transportation & Commute in Eagleville
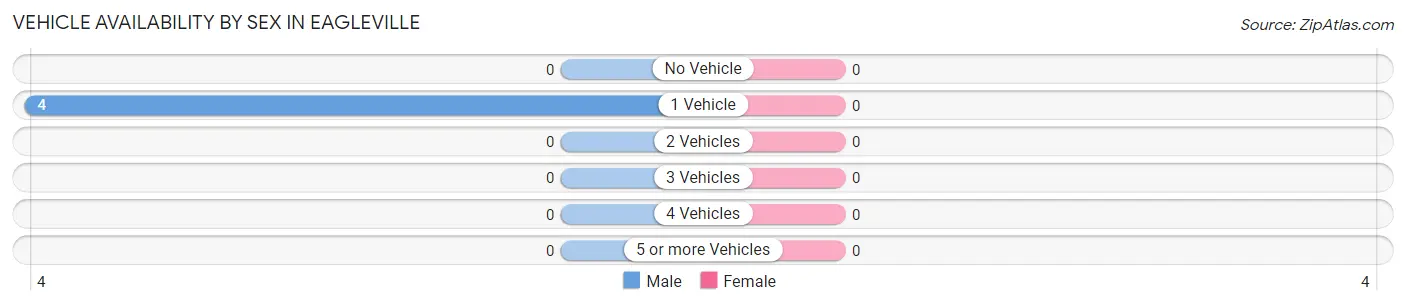
Vehicle Availability by Sex in Eagleville
Vehicles Available
Male
Female
No Vehicle
0 (0.0%)
0 (0.0%)
1 Vehicle
4 (100.0%)
0 (0.0%)
2 Vehicles
0 (0.0%)
0 (0.0%)
3 Vehicles
0 (0.0%)
0 (0.0%)
4 Vehicles
0 (0.0%)
0 (0.0%)
5 or more Vehicles
0 (0.0%)
0 (0.0%)
Total
4 (100.0%)
0 (0.0%)
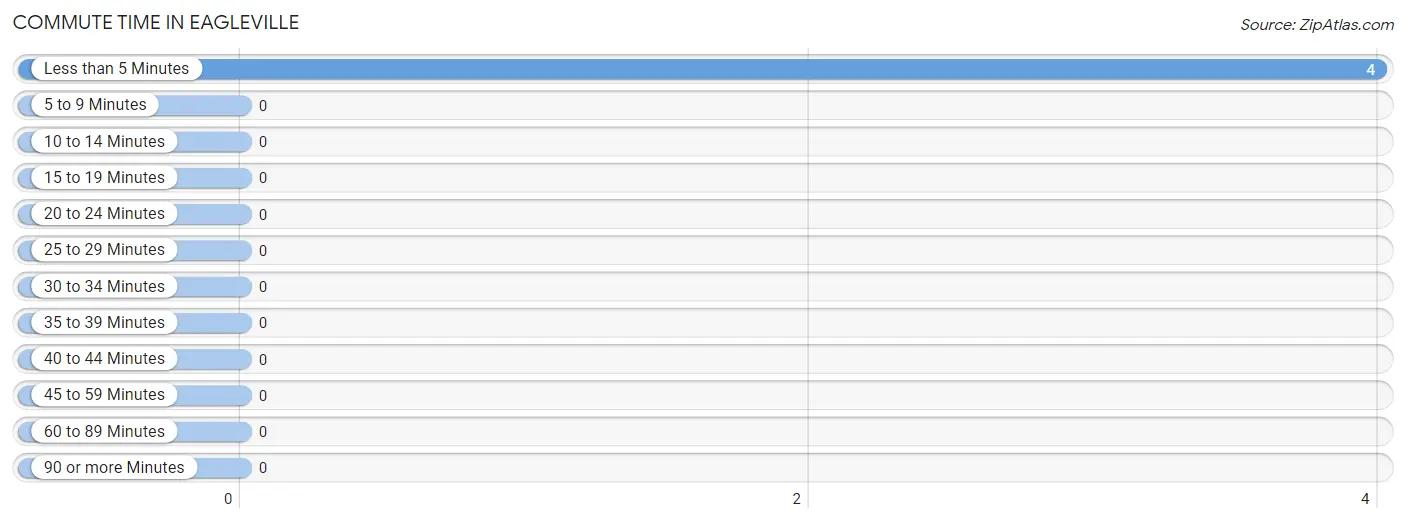
Commute Time in Eagleville
The most frequently occuring commute durations in Eagleville are less than 5 minutes (4 commuters, 100.0%), 5 to 9 minutes (0 commuters, 0.0%), and 10 to 14 minutes (0 commuters, 0.0%).
Commute Time
# Commuters
% Commuters
Less than 5 Minutes
4
100.0%
5 to 9 Minutes
0
0.0%
10 to 14 Minutes
0
0.0%
15 to 19 Minutes
0
0.0%
20 to 24 Minutes
0
0.0%
25 to 29 Minutes
0
0.0%
30 to 34 Minutes
0
0.0%
35 to 39 Minutes
0
0.0%
40 to 44 Minutes
0
0.0%
45 to 59 Minutes
0
0.0%
60 to 89 Minutes
0
0.0%
90 or more Minutes
0
0.0%
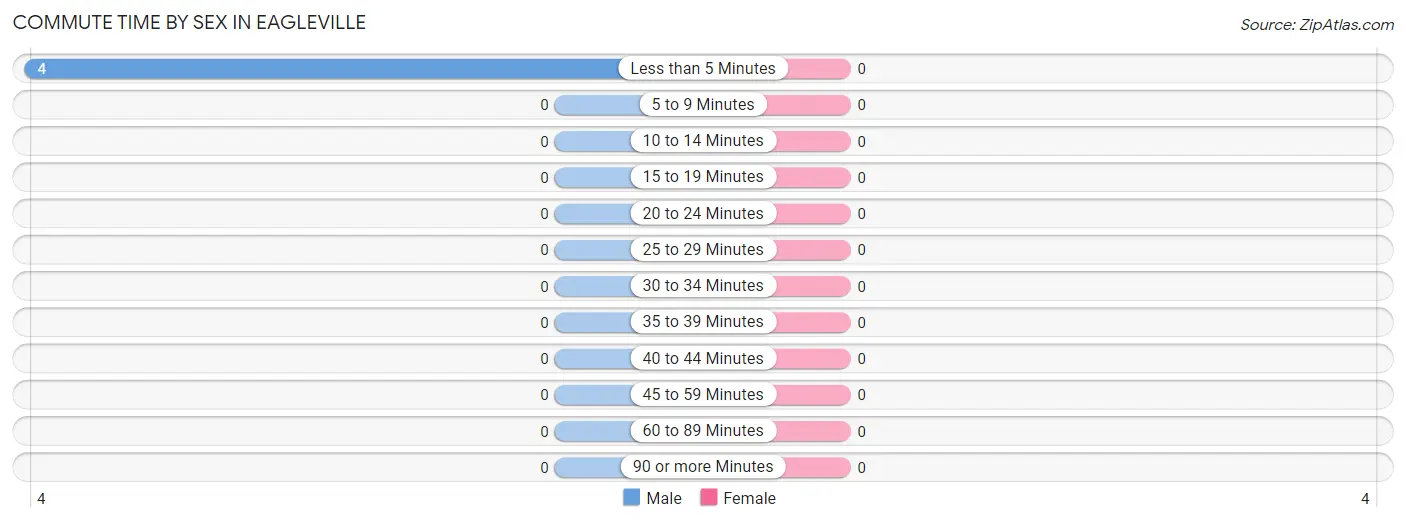
Commute Time by Sex in Eagleville
Commute Time
Male
Female
Less than 5 Minutes
4 (100.0%)
0 (0.0%)
5 to 9 Minutes
0 (0.0%)
0 (0.0%)
10 to 14 Minutes
0 (0.0%)
0 (0.0%)
15 to 19 Minutes
0 (0.0%)
0 (0.0%)
20 to 24 Minutes
0 (0.0%)
0 (0.0%)
25 to 29 Minutes
0 (0.0%)
0 (0.0%)
30 to 34 Minutes
0 (0.0%)
0 (0.0%)
35 to 39 Minutes
0 (0.0%)
0 (0.0%)
40 to 44 Minutes
0 (0.0%)
0 (0.0%)
45 to 59 Minutes
0 (0.0%)
0 (0.0%)
60 to 89 Minutes
0 (0.0%)
0 (0.0%)
90 or more Minutes
0 (0.0%)
0 (0.0%)
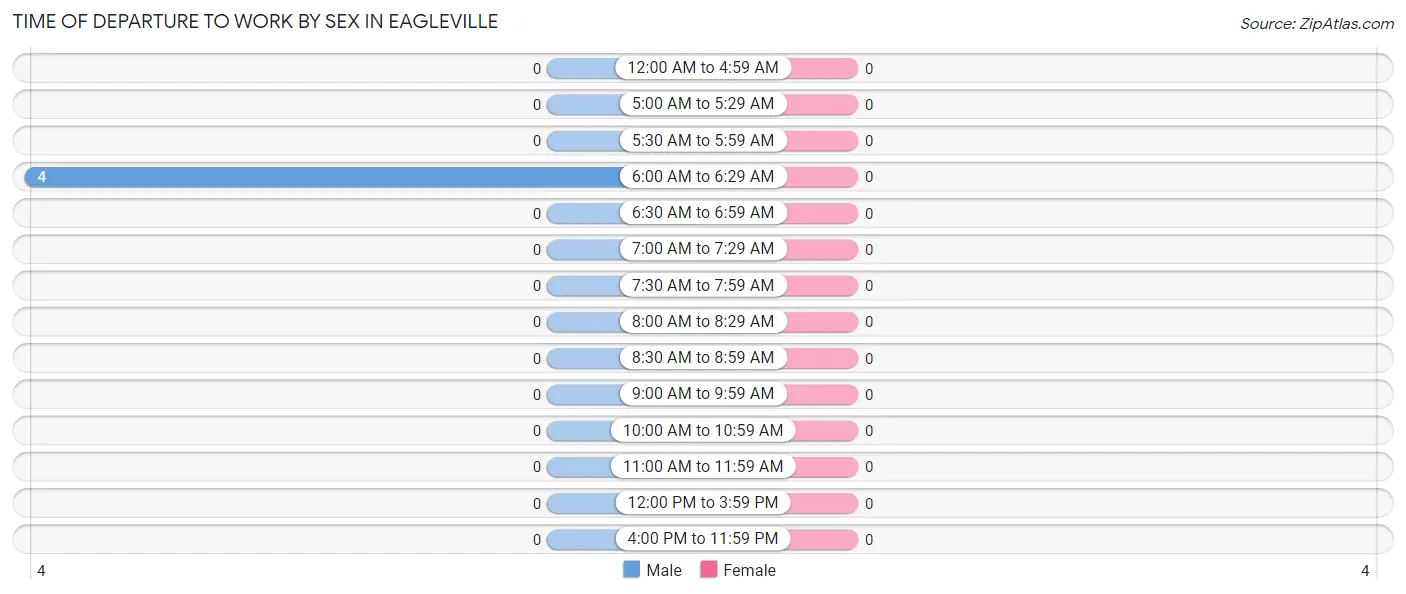
Time of Departure to Work by Sex in Eagleville
Time of Departure
Male
Female
12:00 AM to 4:59 AM
0 (0.0%)
0 (0.0%)
5:00 AM to 5:29 AM
0 (0.0%)
0 (0.0%)
5:30 AM to 5:59 AM
0 (0.0%)
0 (0.0%)
6:00 AM to 6:29 AM
4 (100.0%)
0 (0.0%)
6:30 AM to 6:59 AM
0 (0.0%)
0 (0.0%)
7:00 AM to 7:29 AM
0 (0.0%)
0 (0.0%)
7:30 AM to 7:59 AM
0 (0.0%)
0 (0.0%)
8:00 AM to 8:29 AM
0 (0.0%)
0 (0.0%)
8:30 AM to 8:59 AM
0 (0.0%)
0 (0.0%)
9:00 AM to 9:59 AM
0 (0.0%)
0 (0.0%)
10:00 AM to 10:59 AM
0 (0.0%)
0 (0.0%)
11:00 AM to 11:59 AM
0 (0.0%)
0 (0.0%)
12:00 PM to 3:59 PM
0 (0.0%)
0 (0.0%)
4:00 PM to 11:59 PM
0 (0.0%)
0 (0.0%)
Total
4 (100.0%)
0 (0.0%)
Housing Occupancy in Eagleville
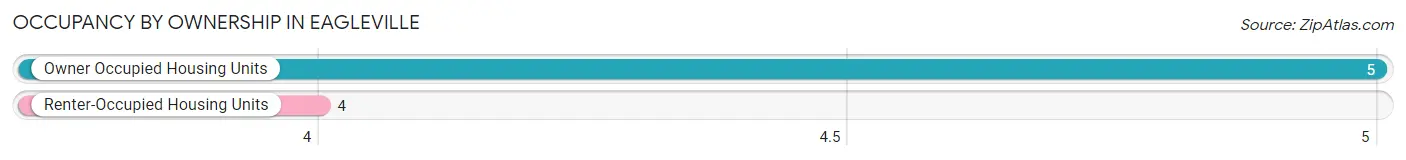
Occupancy by Ownership in Eagleville
Of the total 9 dwellings in Eagleville, owner-occupied units account for 5 (55.6%), while renter-occupied units make up 4 (44.4%).
Occupancy
# Housing Units
% Housing Units
Owner Occupied Housing Units
5
55.6%
Renter-Occupied Housing Units
4
44.4%
Total Occupied Housing Units
9
100.0%
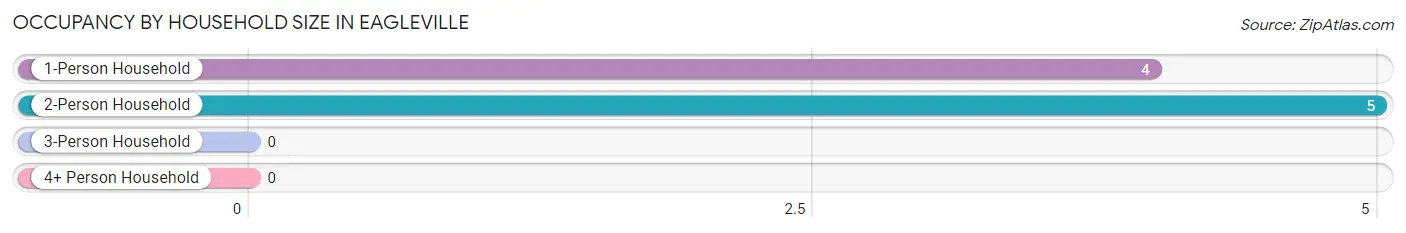
Occupancy by Household Size in Eagleville
Household Size
# Housing Units
% Housing Units
1-Person Household
4
44.4%
2-Person Household
5
55.6%
3-Person Household
0
0.0%
4+ Person Household
0
0.0%
Total Housing Units
9
100.0%
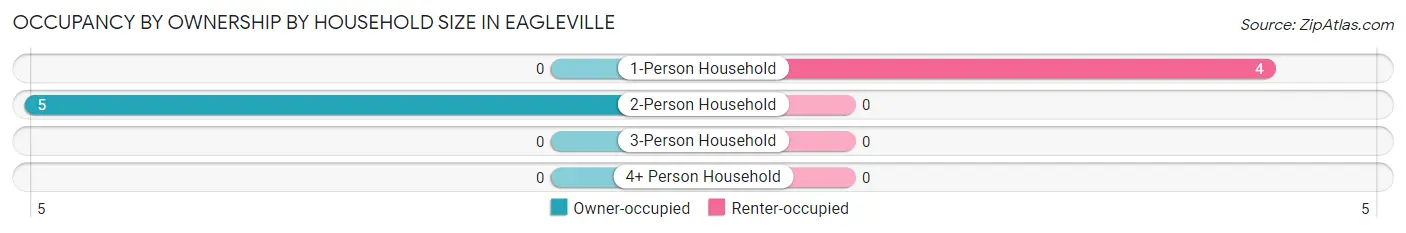
Occupancy by Ownership by Household Size in Eagleville
Household Size
Owner-occupied
Renter-occupied
1-Person Household
0 (0.0%)
4 (100.0%)
2-Person Household
5 (100.0%)
0 (0.0%)
3-Person Household
0 (0.0%)
0 (0.0%)
4+ Person Household
0 (0.0%)
0 (0.0%)
Total Housing Units
5 (55.6%)
4 (44.4%)
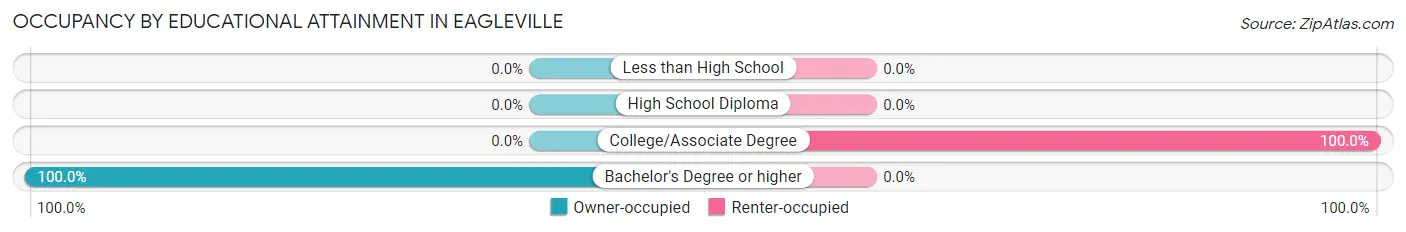
Occupancy by Educational Attainment in Eagleville
Household Size
Owner-occupied
Renter-occupied
Less than High School
0 (0.0%)
0 (0.0%)
High School Diploma
0 (0.0%)
0 (0.0%)
College/Associate Degree
0 (0.0%)
4 (100.0%)
Bachelor's Degree or higher
5 (100.0%)
0 (0.0%)
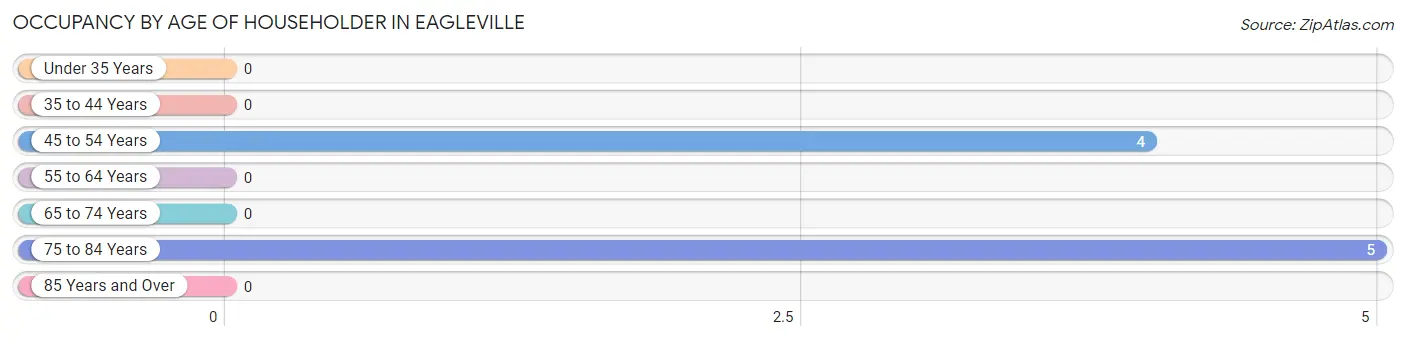
Occupancy by Age of Householder in Eagleville
Age Bracket
# Households
% Households
Under 35 Years
0
0.0%
35 to 44 Years
0
0.0%
45 to 54 Years
4
44.4%
55 to 64 Years
0
0.0%
65 to 74 Years
0
0.0%
75 to 84 Years
5
55.6%
85 Years and Over
0
0.0%
Total
9
100.0%
Housing Finances in Eagleville
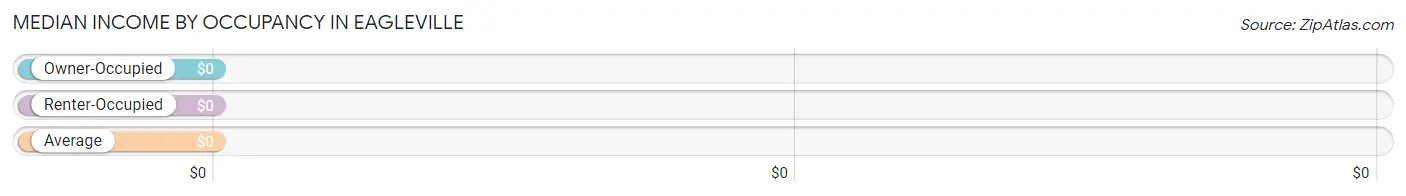
Median Income by Occupancy in Eagleville
Occupancy Type
# Households
Median Income
Owner-Occupied
5 (55.6%)
$0
Renter-Occupied
4 (44.4%)
$0
Average
9 (100.0%)
$0
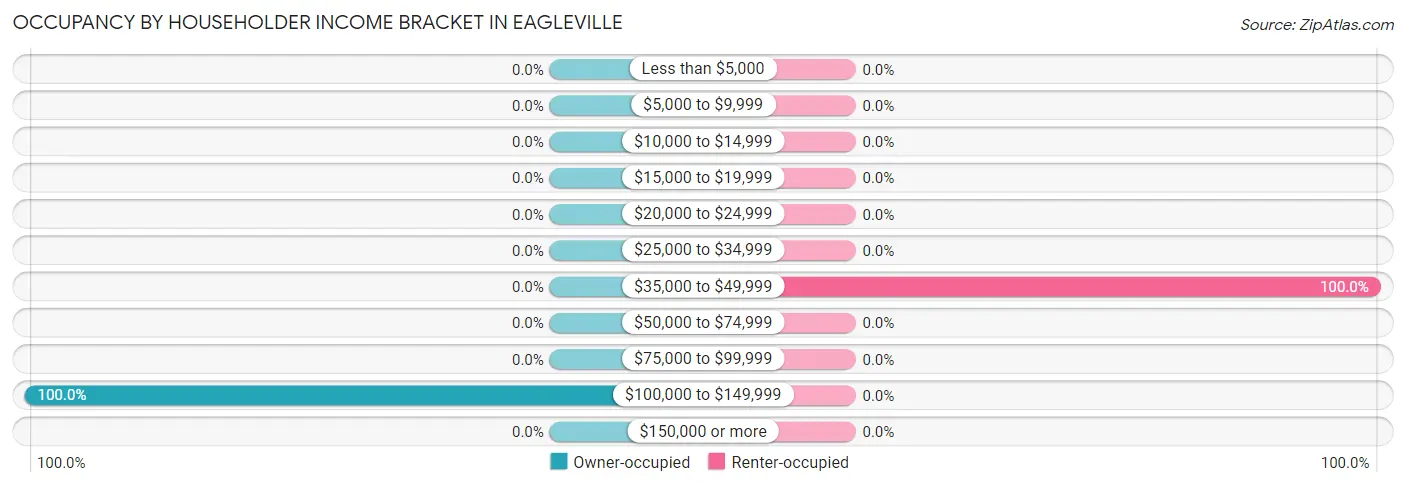
Occupancy by Householder Income Bracket in Eagleville
Income Bracket
Owner-occupied
Renter-occupied
Less than $5,000
0 (0.0%)
0 (0.0%)
$5,000 to $9,999
0 (0.0%)
0 (0.0%)
$10,000 to $14,999
0 (0.0%)
0 (0.0%)
$15,000 to $19,999
0 (0.0%)
0 (0.0%)
$20,000 to $24,999
0 (0.0%)
0 (0.0%)
$25,000 to $34,999
0 (0.0%)
0 (0.0%)
$35,000 to $49,999
0 (0.0%)
4 (100.0%)
$50,000 to $74,999
0 (0.0%)
0 (0.0%)
$75,000 to $99,999
0 (0.0%)
0 (0.0%)
$100,000 to $149,999
5 (100.0%)
0 (0.0%)
$150,000 or more
0 (0.0%)
0 (0.0%)
Total
5 (100.0%)
4 (100.0%)
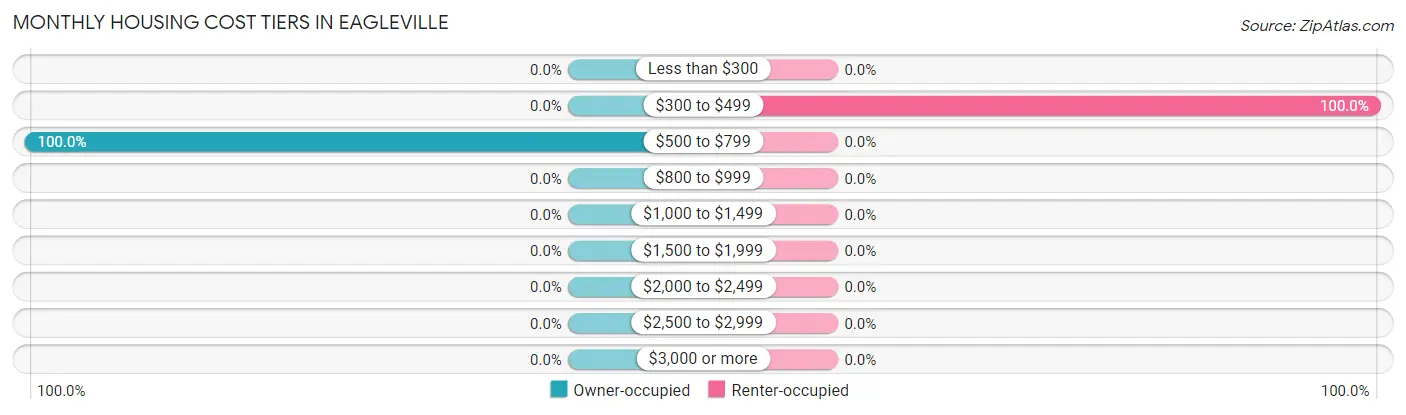
Monthly Housing Cost Tiers in Eagleville
Monthly Cost
Owner-occupied
Renter-occupied
Less than $300
0 (0.0%)
0 (0.0%)
$300 to $499
0 (0.0%)
4 (100.0%)
$500 to $799
5 (100.0%)
0 (0.0%)
$800 to $999
0 (0.0%)
0 (0.0%)
$1,000 to $1,499
0 (0.0%)
0 (0.0%)
$1,500 to $1,999
0 (0.0%)
0 (0.0%)
$2,000 to $2,499
0 (0.0%)
0 (0.0%)
$2,500 to $2,999
0 (0.0%)
0 (0.0%)
$3,000 or more
0 (0.0%)
0 (0.0%)
Total
5 (100.0%)
4 (100.0%)
Physical Housing Characteristics in Eagleville
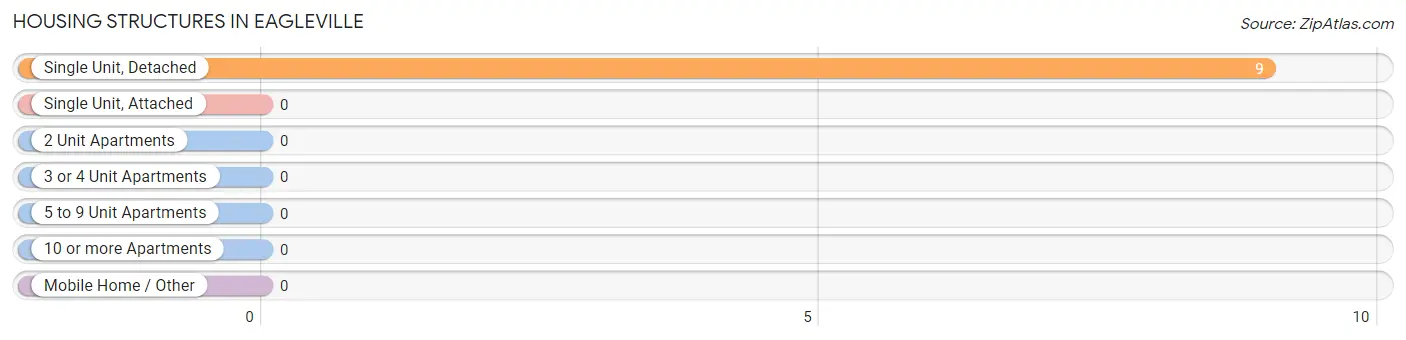
Housing Structures in Eagleville
Structure Type
# Housing Units
% Housing Units
Single Unit, Detached
9
100.0%
Single Unit, Attached
0
0.0%
2 Unit Apartments
0
0.0%
3 or 4 Unit Apartments
0
0.0%
5 to 9 Unit Apartments
0
0.0%
10 or more Apartments
0
0.0%
Mobile Home / Other
0
0.0%
Total
9
100.0%
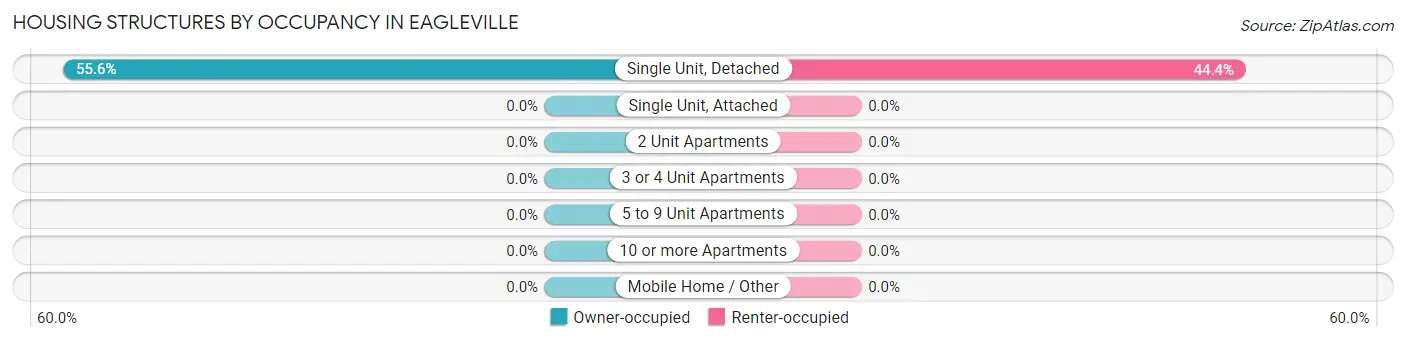
Housing Structures by Occupancy in Eagleville
Structure Type
Owner-occupied
Renter-occupied
Single Unit, Detached
5 (55.6%)
4 (44.4%)
Single Unit, Attached
0 (0.0%)
0 (0.0%)
2 Unit Apartments
0 (0.0%)
0 (0.0%)
3 or 4 Unit Apartments
0 (0.0%)
0 (0.0%)
5 to 9 Unit Apartments
0 (0.0%)
0 (0.0%)
10 or more Apartments
0 (0.0%)
0 (0.0%)
Mobile Home / Other
0 (0.0%)
0 (0.0%)
Total
5 (55.6%)
4 (44.4%)
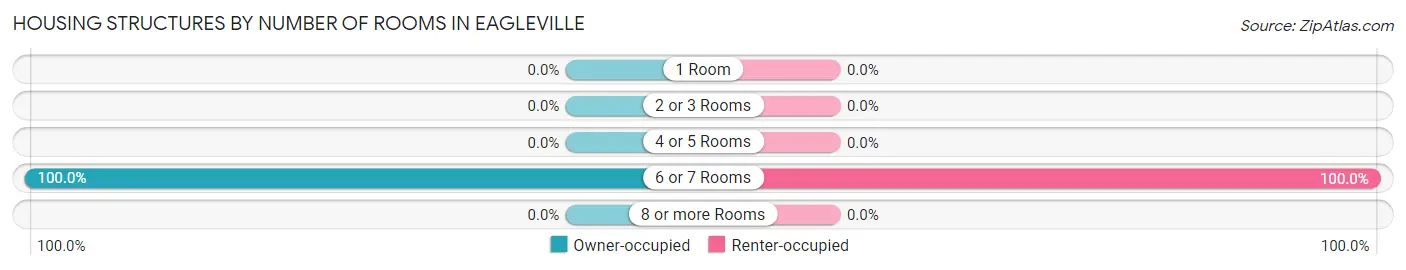
Housing Structures by Number of Rooms in Eagleville
Number of Rooms
Owner-occupied
Renter-occupied
1 Room
0 (0.0%)
0 (0.0%)
2 or 3 Rooms
0 (0.0%)
0 (0.0%)
4 or 5 Rooms
0 (0.0%)
0 (0.0%)
6 or 7 Rooms
5 (100.0%)
4 (100.0%)
8 or more Rooms
0 (0.0%)
0 (0.0%)
Total
5 (100.0%)
4 (100.0%)
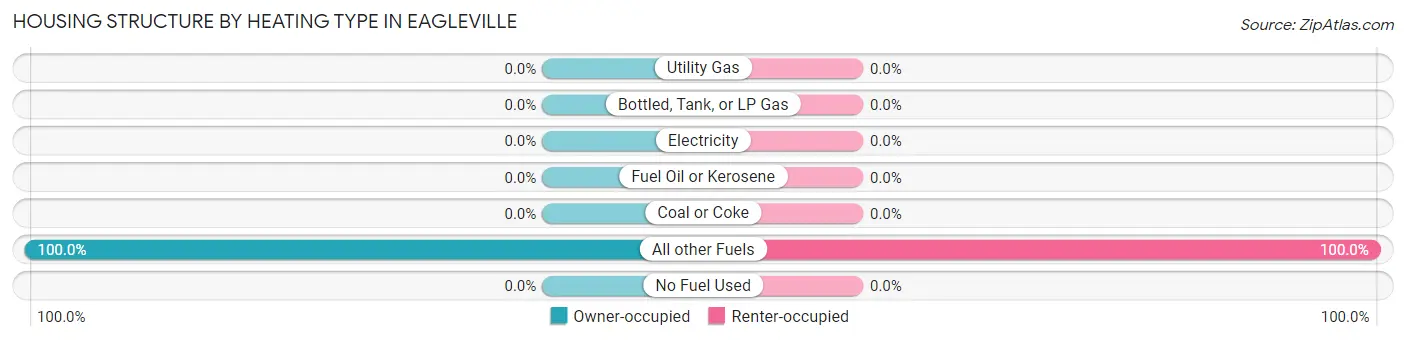
Housing Structure by Heating Type in Eagleville
Heating Type
Owner-occupied
Renter-occupied
Utility Gas
0 (0.0%)
0 (0.0%)
Bottled, Tank, or LP Gas
0 (0.0%)
0 (0.0%)
Electricity
0 (0.0%)
0 (0.0%)
Fuel Oil or Kerosene
0 (0.0%)
0 (0.0%)
Coal or Coke
0 (0.0%)
0 (0.0%)
All other Fuels
5 (100.0%)
4 (100.0%)
No Fuel Used
0 (0.0%)
0 (0.0%)
Total
5 (100.0%)
4 (100.0%)
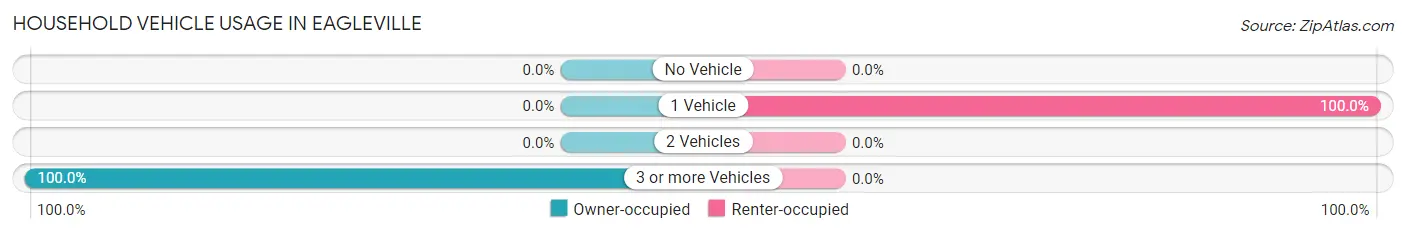
Household Vehicle Usage in Eagleville
Vehicles per Household
Owner-occupied
Renter-occupied
No Vehicle
0 (0.0%)
0 (0.0%)
1 Vehicle
0 (0.0%)
4 (100.0%)
2 Vehicles
0 (0.0%)
0 (0.0%)
3 or more Vehicles
5 (100.0%)
0 (0.0%)
Total
5 (100.0%)
4 (100.0%)
Real Estate & Mortgages in Eagleville
Real Estate and Mortgage Overview in Eagleville
Characteristic
Without Mortgage
With Mortgage
Housing Units
5
0
Median Property Value
-
-
Median Household Income
-
-
Monthly Housing Costs
-
-
Real Estate Taxes
-
-
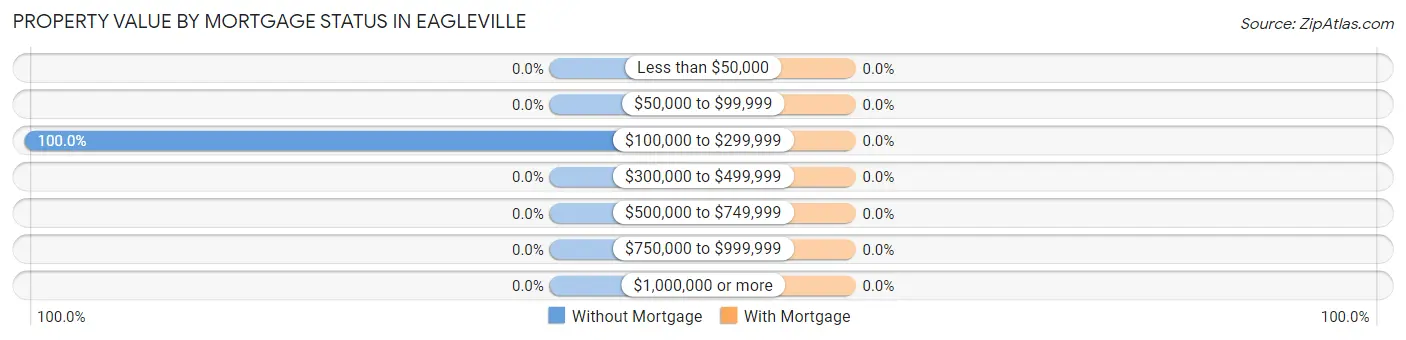
Property Value by Mortgage Status in Eagleville
Property Value
Without Mortgage
With Mortgage
Less than $50,000
0 (0.0%)
0 (0.0%)
$50,000 to $99,999
0 (0.0%)
0 (0.0%)
$100,000 to $299,999
5 (100.0%)
0 (0.0%)
$300,000 to $499,999
0 (0.0%)
0 (0.0%)
$500,000 to $749,999
0 (0.0%)
0 (0.0%)
$750,000 to $999,999
0 (0.0%)
0 (0.0%)
$1,000,000 or more
0 (0.0%)
0 (0.0%)
Total
5 (100.0%)
0 (0.0%)
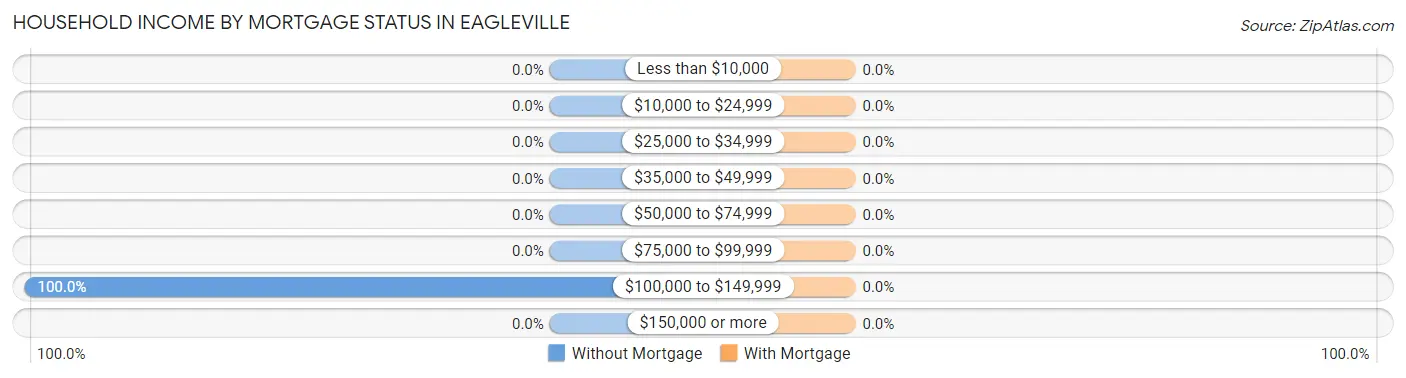
Household Income by Mortgage Status in Eagleville
Household Income
Without Mortgage
With Mortgage
Less than $10,000
0 (0.0%)
0 (0.0%)
$10,000 to $24,999
0 (0.0%)
0 (0.0%)
$25,000 to $34,999
0 (0.0%)
0 (0.0%)
$35,000 to $49,999
0 (0.0%)
0 (0.0%)
$50,000 to $74,999
0 (0.0%)
0 (0.0%)
$75,000 to $99,999
0 (0.0%)
0 (0.0%)
$100,000 to $149,999
5 (100.0%)
0 (0.0%)
$150,000 or more
0 (0.0%)
0 (0.0%)
Total
5 (100.0%)
0 (0.0%)
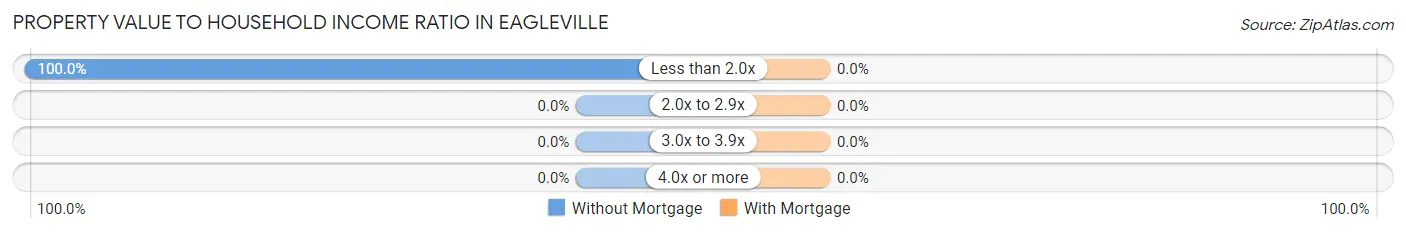
Property Value to Household Income Ratio in Eagleville
Value-to-Income Ratio
Without Mortgage
With Mortgage
Less than 2.0x
5 (100.0%)
0 (0.0%)
2.0x to 2.9x
0 (0.0%)
0 (0.0%)
3.0x to 3.9x
0 (0.0%)
0 (0.0%)
4.0x or more
0 (0.0%)
0 (0.0%)
Total
5 (100.0%)
0 (0.0%)
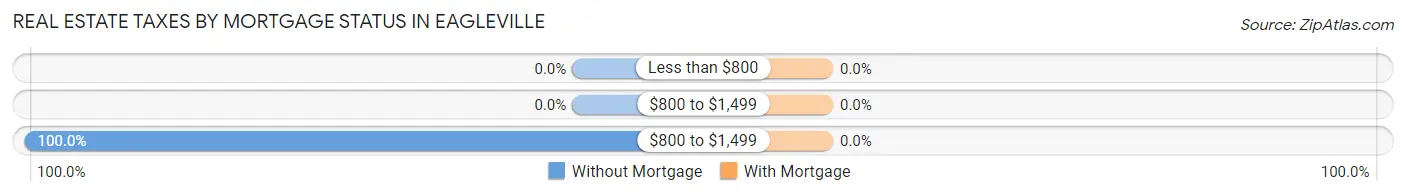
Real Estate Taxes by Mortgage Status in Eagleville
Property Taxes
Without Mortgage
With Mortgage
Less than $800
0 (0.0%)
0 (0.0%)
$800 to $1,499
0 (0.0%)
0 (0.0%)
$800 to $1,499
5 (100.0%)
0 (0.0%)
Total
5 (100.0%)
0 (0.0%)
Health & Disability in Eagleville
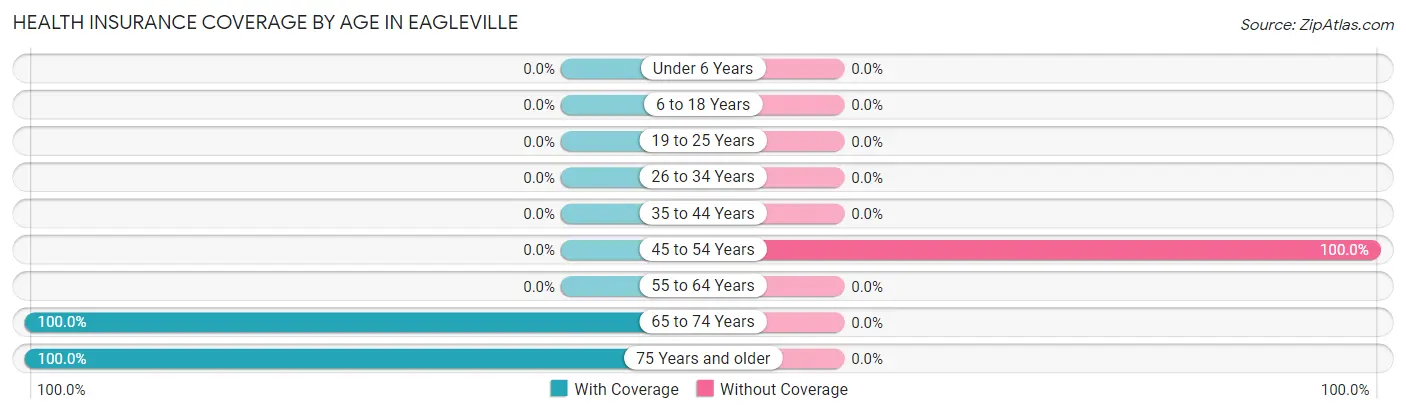
Health Insurance Coverage by Age in Eagleville
Age Bracket
With Coverage
Without Coverage
Under 6 Years
0 (0.0%)
0 (0.0%)
6 to 18 Years
0 (0.0%)
0 (0.0%)
19 to 25 Years
0 (0.0%)
0 (0.0%)
26 to 34 Years
0 (0.0%)
0 (0.0%)
35 to 44 Years
0 (0.0%)
0 (0.0%)
45 to 54 Years
0 (0.0%)
4 (100.0%)
55 to 64 Years
0 (0.0%)
0 (0.0%)
65 to 74 Years
4 (100.0%)
0 (0.0%)
75 Years and older
5 (100.0%)
0 (0.0%)
Total
9 (69.2%)
4 (30.8%)
Health Insurance Coverage by Citizenship Status in Eagleville
Citizenship Status
With Coverage
Without Coverage
Native Born
0 (0.0%)
0 (0.0%)
Foreign Born, Citizen
0 (0.0%)
0 (0.0%)
Foreign Born, not a Citizen
0 (0.0%)
0 (0.0%)
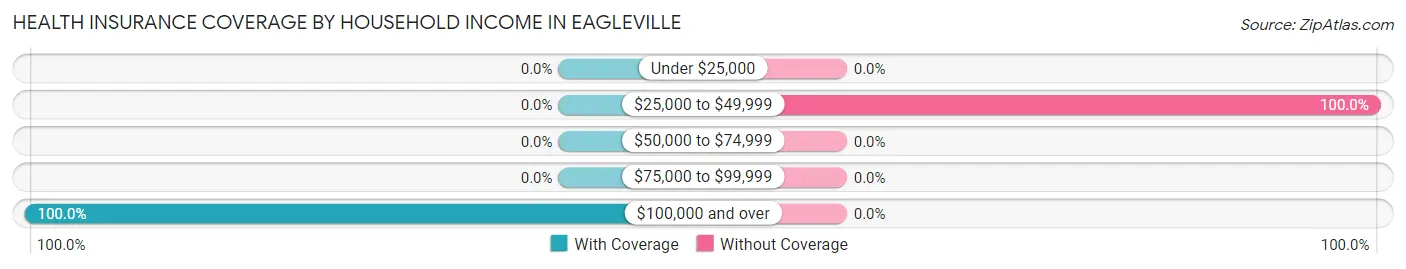
Health Insurance Coverage by Household Income in Eagleville
Household Income
With Coverage
Without Coverage
Under $25,000
0 (0.0%)
0 (0.0%)
$25,000 to $49,999
0 (0.0%)
4 (100.0%)
$50,000 to $74,999
0 (0.0%)
0 (0.0%)
$75,000 to $99,999
0 (0.0%)
0 (0.0%)
$100,000 and over
9 (100.0%)
0 (0.0%)
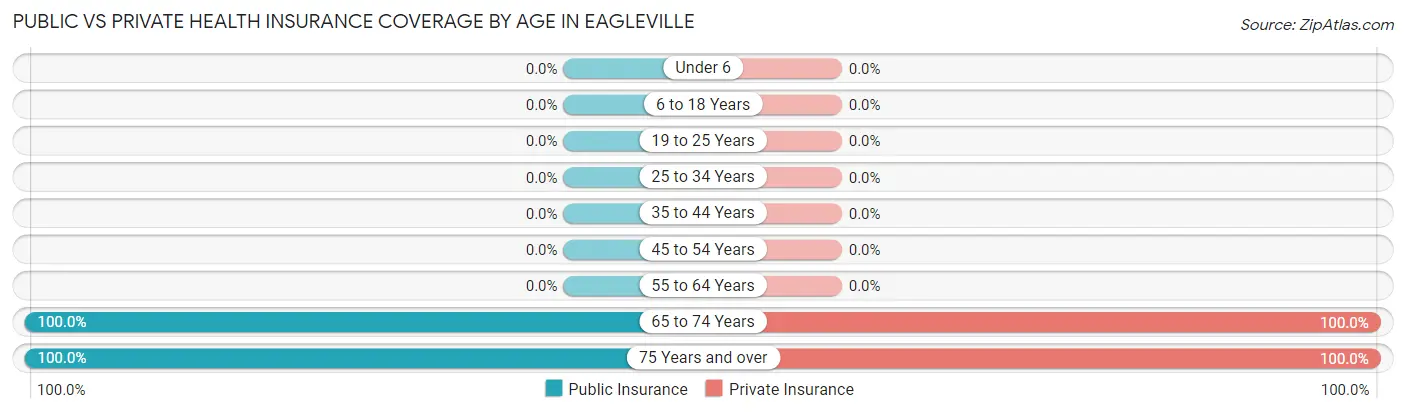
Public vs Private Health Insurance Coverage by Age in Eagleville
Age Bracket
Public Insurance
Private Insurance
Under 6
0 (0.0%)
0 (0.0%)
6 to 18 Years
0 (0.0%)
0 (0.0%)
19 to 25 Years
0 (0.0%)
0 (0.0%)
25 to 34 Years
0 (0.0%)
0 (0.0%)
35 to 44 Years
0 (0.0%)
0 (0.0%)
45 to 54 Years
0 (0.0%)
0 (0.0%)
55 to 64 Years
0 (0.0%)
0 (0.0%)
65 to 74 Years
4 (100.0%)
4 (100.0%)
75 Years and over
5 (100.0%)
5 (100.0%)
Total
9 (69.2%)
9 (69.2%)
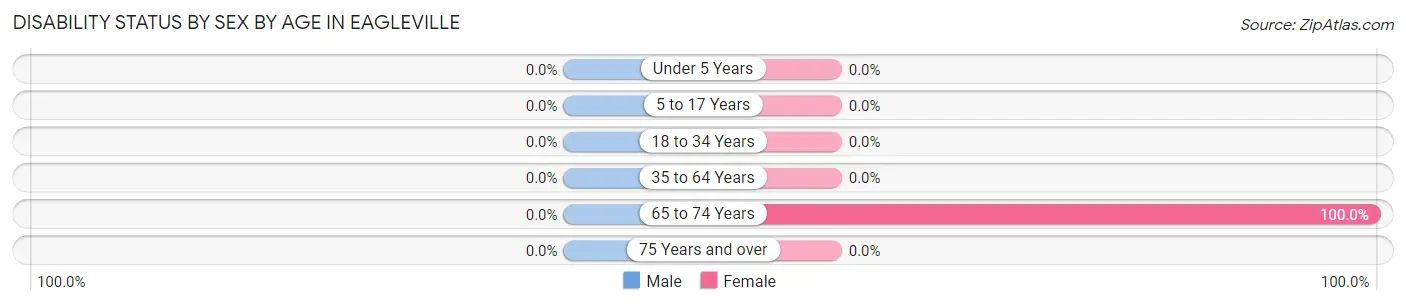
Disability Status by Sex by Age in Eagleville
Age Bracket
Male
Female
Under 5 Years
0 (0.0%)
0 (0.0%)
5 to 17 Years
0 (0.0%)
0 (0.0%)
18 to 34 Years
0 (0.0%)
0 (0.0%)
35 to 64 Years
0 (0.0%)
0 (0.0%)
65 to 74 Years
0 (0.0%)
4 (100.0%)
75 Years and over
0 (0.0%)
0 (0.0%)
Disability Class by Sex by Age in Eagleville
Disability Class: Hearing Difficulty
Age Bracket
Male
Female
Under 5 Years
0 (0.0%)
0 (0.0%)
5 to 17 Years
0 (0.0%)
0 (0.0%)
18 to 34 Years
0 (0.0%)
0 (0.0%)
35 to 64 Years
0 (0.0%)
0 (0.0%)
65 to 74 Years
0 (0.0%)
0 (0.0%)
75 Years and over
0 (0.0%)
0 (0.0%)
Disability Class: Vision Difficulty
Age Bracket
Male
Female
Under 5 Years
0 (0.0%)
0 (0.0%)
5 to 17 Years
0 (0.0%)
0 (0.0%)
18 to 34 Years
0 (0.0%)
0 (0.0%)
35 to 64 Years
0 (0.0%)
0 (0.0%)
65 to 74 Years
0 (0.0%)
0 (0.0%)
75 Years and over
0 (0.0%)
0 (0.0%)
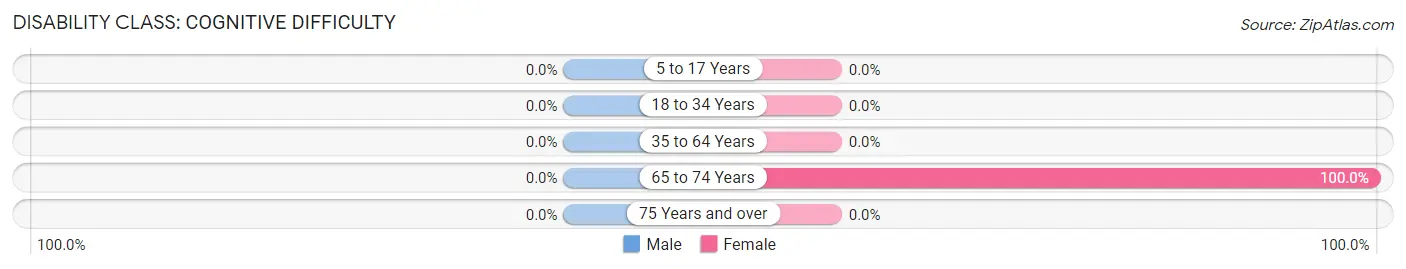
Disability Class: Cognitive Difficulty
Age Bracket
Male
Female
5 to 17 Years
0 (0.0%)
0 (0.0%)
18 to 34 Years
0 (0.0%)
0 (0.0%)
35 to 64 Years
0 (0.0%)
0 (0.0%)
65 to 74 Years
0 (0.0%)
4 (100.0%)
75 Years and over
0 (0.0%)
0 (0.0%)
Disability Class: Ambulatory Difficulty
Age Bracket
Male
Female
5 to 17 Years
0 (0.0%)
0 (0.0%)
18 to 34 Years
0 (0.0%)
0 (0.0%)
35 to 64 Years
0 (0.0%)
0 (0.0%)
65 to 74 Years
0 (0.0%)
0 (0.0%)
75 Years and over
0 (0.0%)
0 (0.0%)
Disability Class: Self-Care Difficulty
Age Bracket
Male
Female
5 to 17 Years
0 (0.0%)
0 (0.0%)
18 to 34 Years
0 (0.0%)
0 (0.0%)
35 to 64 Years
0 (0.0%)
0 (0.0%)
65 to 74 Years
0 (0.0%)
0 (0.0%)
75 Years and over
0 (0.0%)
0 (0.0%)
Technology Access in Eagleville
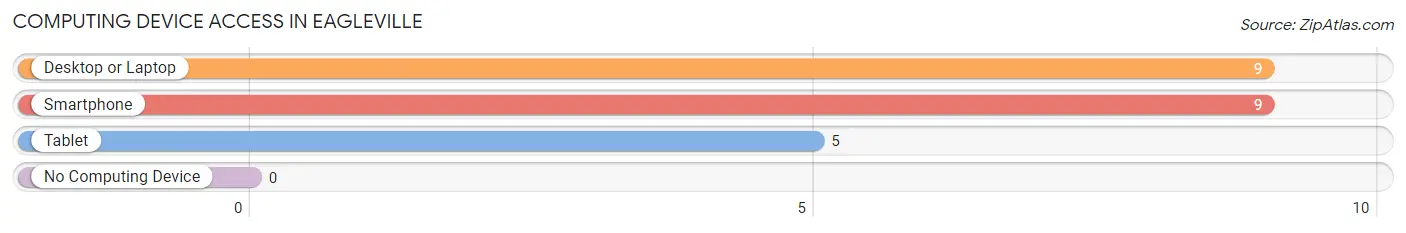
Computing Device Access in Eagleville
Device Type
# Households
% Households
Desktop or Laptop
9
100.0%
Smartphone
9
100.0%
Tablet
5
55.6%
No Computing Device
0
0.0%
Total
9
100.0%
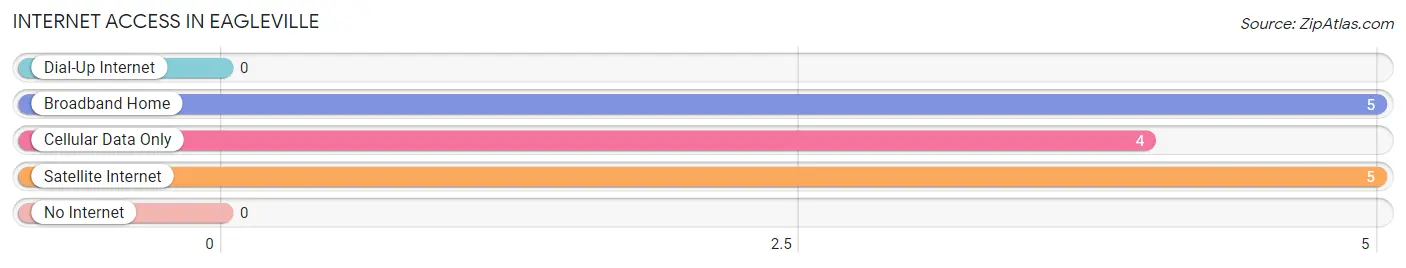
Internet Access in Eagleville
Internet Type
# Households
% Households
Dial-Up Internet
0
0.0%
Broadband Home
5
55.6%
Cellular Data Only
4
44.4%
Satellite Internet
5
55.6%
No Internet
0
0.0%
Total
9
100.0%
Eagleville Summary
Eagleville is a small unincorporated community located in the foothills of the Sierra Nevada Mountains in California. It is situated in the northern part of the state, in Modoc County, and is approximately 30 miles east of the city of Alturas. The population of Eagleville is estimated to be around 200 people.
History
Eagleville was founded in 1864 by a group of settlers from the Midwest. The settlers were looking for a place to settle and start a new life, and they chose the area around Eagleville because of its abundance of natural resources. The settlers built a sawmill and a flour mill, and the town quickly grew. By the late 1800s, Eagleville had become a thriving community with a post office, a school, a hotel, and several stores.
In the early 1900s, the town began to decline as the timber industry moved away and the population dwindled. By the 1950s, Eagleville was a small, quiet town with a population of only a few hundred people.
Geography
Eagleville is located in the northern part of California, in Modoc County. It is situated in the foothills of the Sierra Nevada Mountains, approximately 30 miles east of the city of Alturas. The town is surrounded by rolling hills and open meadows, and is home to a variety of wildlife, including deer, coyotes, and wild turkeys.
The climate in Eagleville is semi-arid, with hot summers and cold winters. The average annual temperature is around 50 degrees Fahrenheit, and the average annual precipitation is around 10 inches.
Economy
The economy of Eagleville is largely based on agriculture and tourism. The town is home to several small farms, which produce a variety of crops, including hay, alfalfa, and wheat. The town also has several small businesses, including a gas station, a grocery store, and a restaurant.
Tourism is an important part of the local economy, as the town is a popular destination for outdoor enthusiasts. The nearby Modoc National Forest offers a variety of activities, including camping, hiking, fishing, and hunting.
Demographics
As of the 2010 census, the population of Eagleville was estimated to be around 200 people. The racial makeup of the town was 95.0% White, 0.5% African American, 0.5% Native American, 0.5% Asian, and 3.5% from other races. The median household income was $31,250, and the median age was 44.
Conclusion
Eagleville is a small unincorporated community located in the foothills of the Sierra Nevada Mountains in California. It is situated in the northern part of the state, in Modoc County, and is approximately 30 miles east of the city of Alturas. The population of Eagleville is estimated to be around 200 people. The town was founded in 1864 by a group of settlers from the Midwest, and the economy is largely based on agriculture and tourism. The racial makeup of the town is 95.0% White, 0.5% African American, 0.5% Native American, 0.5% Asian, and 3.5% from other races. The median household income was $31,250, and the median age was 44.
Common Questions
What is Per Capita Income in Eagleville?
Per Capita income in Eagleville is $55,223.
What is Inequality or Gini Index in Eagleville?
Inequality or Gini Index in Eagleville is 0.17.
What is the Total Population of Eagleville?
Total Population of Eagleville is 13.
What is the Total Male Population of Eagleville?
Total Male Population of Eagleville is 9.
What is the Total Female Population of Eagleville?
Total Female Population of Eagleville is 4.
What is the Ratio of Males per 100 Females in Eagleville?
There are 225.00 Males per 100 Females in Eagleville.
What is the Ratio of Females per 100 Males in Eagleville?
There are 44.44 Females per 100 Males in Eagleville.
What is the Median Population Age in Eagleville?
Median Population Age in Eagleville is 69.6 Years.
What is the Average Family Size in Eagleville
Average Family Size in Eagleville is 1.8 People.
What is the Average Household Size in Eagleville
Average Household Size in Eagleville is 1.4 People.
How Large is the Labor Force in Eagleville?
There are 4 People in the Labor Forcein in Eagleville.
What is the Percentage of People in the Labor Force in Eagleville?
30.8% of People are in the Labor Force in Eagleville.
Report Title
Report Link
HTML Copy & Paste Link
Social Media
Copy and paste the folowing code into any webpage where you would like this interactive chart to display