Cities with the Highest Percentage of Families with Income Above $100,000 in Colorado
RELATED REPORTS & OPTIONS
Family Income | $100k+
Colorado
Compare Cities
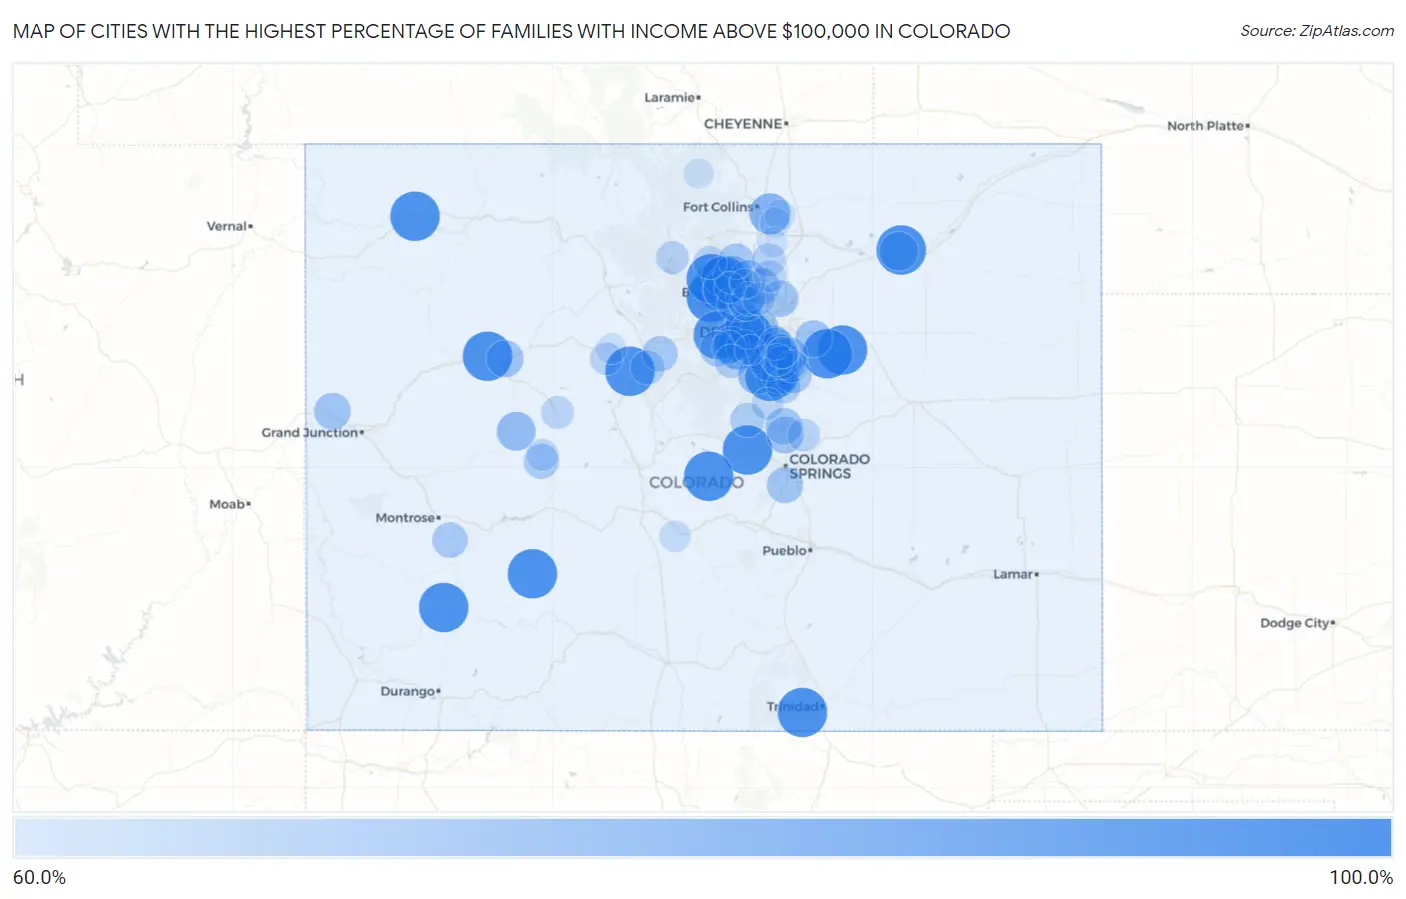
Map of Cities with the Highest Percentage of Families with Income Above $100,000 in Colorado
0.0%
100.0%
Cities with the Highest Percentage of Families with Income Above $100,000 in Colorado
| City | Families with Income > $100k | vs State | vs National | |
| 1. | Comanche Creek | 100.0% | 54.4%(+45.6)#1 | 46.1%(+53.9)#22 |
| 2. | Chacra | 100.0% | 54.4%(+45.6)#2 | 46.1%(+53.9)#30 |
| 3. | Echo Hills | 100.0% | 54.4%(+45.6)#3 | 46.1%(+53.9)#37 |
| 4. | Copper Mountain | 100.0% | 54.4%(+45.6)#4 | 46.1%(+53.9)#49 |
| 5. | Gold Hill | 100.0% | 54.4%(+45.6)#5 | 46.1%(+53.9)#60 |
| 6. | Divide | 100.0% | 54.4%(+45.6)#6 | 46.1%(+53.9)#121 |
| 7. | East Pleasant View | 100.0% | 54.4%(+45.6)#7 | 46.1%(+53.9)#128 |
| 8. | Bonanza Mountain Estates | 100.0% | 54.4%(+45.6)#8 | 46.1%(+53.9)#130 |
| 9. | Blue Sky | 100.0% | 54.4%(+45.6)#9 | 46.1%(+53.9)#173 |
| 10. | Brick Center | 100.0% | 54.4%(+45.6)#10 | 46.1%(+53.9)#197 |
| 11. | Glendale | 100.0% | 54.4%(+45.6)#11 | 46.1%(+53.9)#233 |
| 12. | Somerset | 100.0% | 54.4%(+45.6)#12 | 46.1%(+53.9)#240 |
| 13. | Sedalia | 100.0% | 54.4%(+45.6)#13 | 46.1%(+53.9)#306 |
| 14. | Guffey | 100.0% | 54.4%(+45.6)#15 | 46.1%(+53.9)#328 |
| 15. | Hidden Lake | 100.0% | 54.4%(+45.6)#16 | 46.1%(+53.9)#329 |
| 16. | Maybell | 100.0% | 54.4%(+45.6)#17 | 46.1%(+53.9)#359 |
| 17. | Cathedral | 100.0% | 54.4%(+45.6)#18 | 46.1%(+53.9)#378 |
| 18. | Valdez | 100.0% | 54.4%(+45.6)#19 | 46.1%(+53.9)#394 |
| 19. | Ophir | 99.9% | 54.4%(+45.5)#20 | 46.1%(+53.8)#424 |
| 20. | Floyd Hill | 97.5% | 54.4%(+43.1)#21 | 46.1%(+51.4)#429 |
| 21. | Stepping Stone | 96.6% | 54.4%(+42.2)#22 | 46.1%(+50.5)#435 |
| 22. | Cherry Hills Village | 90.8% | 54.4%(+36.4)#23 | 46.1%(+44.7)#547 |
| 23. | Castle Pines Village | 87.2% | 54.4%(+32.8)#24 | 46.1%(+41.1)#732 |
| 24. | Crisman | 87.2% | 54.4%(+32.8)#25 | 46.1%(+41.1)#736 |
| 25. | Indian Hills | 86.8% | 54.4%(+32.4)#26 | 46.1%(+40.7)#762 |
| 26. | Genesee | 86.5% | 54.4%(+32.1)#27 | 46.1%(+40.4)#783 |
| 27. | Columbine Valley | 86.3% | 54.4%(+31.9)#28 | 46.1%(+40.2)#794 |
| 28. | Timnath | 86.0% | 54.4%(+31.6)#29 | 46.1%(+39.9)#815 |
| 29. | Fairmount | 84.2% | 54.4%(+29.8)#30 | 46.1%(+38.1)#955 |
| 30. | Bow Mar | 84.0% | 54.4%(+29.6)#31 | 46.1%(+37.9)#972 |
| 31. | Jamestown | 83.2% | 54.4%(+28.8)#32 | 46.1%(+37.1)#1,058 |
| 32. | Morgan Heights | 82.9% | 54.4%(+28.5)#33 | 46.1%(+36.8)#1,080 |
| 33. | Roxborough Park | 82.8% | 54.4%(+28.4)#34 | 46.1%(+36.7)#1,085 |
| 34. | Marble | 82.6% | 54.4%(+28.2)#35 | 46.1%(+36.5)#1,105 |
| 35. | Mountain Meadows | 82.5% | 54.4%(+28.1)#36 | 46.1%(+36.4)#1,113 |
| 36. | Greenwood Village | 82.3% | 54.4%(+27.9)#37 | 46.1%(+36.2)#1,124 |
| 37. | Eldorado Springs | 81.9% | 54.4%(+27.5)#38 | 46.1%(+35.8)#1,186 |
| 38. | Paragon Estates | 81.7% | 54.4%(+27.3)#39 | 46.1%(+35.6)#1,209 |
| 39. | Altona | 81.7% | 54.4%(+27.3)#40 | 46.1%(+35.6)#1,210 |
| 40. | Meridian | 81.3% | 54.4%(+26.9)#41 | 46.1%(+35.2)#1,256 |
| 41. | Castle Pines | 81.1% | 54.4%(+26.7)#42 | 46.1%(+35.0)#1,278 |
| 42. | Sterling Ranch | 80.4% | 54.4%(+26.0)#43 | 46.1%(+34.3)#1,344 |
| 43. | No Name | 80.0% | 54.4%(+25.6)#44 | 46.1%(+33.9)#1,382 |
| 44. | Watkins | 79.8% | 54.4%(+25.4)#45 | 46.1%(+33.7)#1,401 |
| 45. | Niwot | 79.7% | 54.4%(+25.3)#46 | 46.1%(+33.6)#1,412 |
| 46. | Highlands Ranch | 79.6% | 54.4%(+25.2)#47 | 46.1%(+33.5)#1,419 |
| 47. | Gleneagle | 79.6% | 54.4%(+25.2)#48 | 46.1%(+33.5)#1,423 |
| 48. | Upper Witter Gulch | 79.5% | 54.4%(+25.1)#49 | 46.1%(+33.4)#1,441 |
| 49. | Loma | 79.4% | 54.4%(+25.0)#50 | 46.1%(+33.3)#1,452 |
| 50. | Erie | 79.3% | 54.4%(+24.9)#51 | 46.1%(+33.2)#1,459 |
| 51. | Woodmoor | 79.3% | 54.4%(+24.9)#52 | 46.1%(+33.2)#1,464 |
| 52. | Todd Creek | 79.3% | 54.4%(+24.9)#53 | 46.1%(+33.2)#1,466 |
| 53. | Mountain View | 79.3% | 54.4%(+24.9)#54 | 46.1%(+33.2)#1,472 |
| 54. | Kittredge | 79.1% | 54.4%(+24.7)#55 | 46.1%(+33.0)#1,503 |
| 55. | Pine Valley | 79.0% | 54.4%(+24.6)#56 | 46.1%(+32.9)#1,509 |
| 56. | Rock Creek Park | 78.7% | 54.4%(+24.3)#57 | 46.1%(+32.6)#1,554 |
| 57. | The Pinery | 78.1% | 54.4%(+23.7)#58 | 46.1%(+32.0)#1,620 |
| 58. | Lyons | 77.9% | 54.4%(+23.5)#59 | 46.1%(+31.8)#1,655 |
| 59. | Keystone | 77.6% | 54.4%(+23.2)#60 | 46.1%(+31.5)#1,696 |
| 60. | Foxfield | 77.6% | 54.4%(+23.2)#61 | 46.1%(+31.5)#1,697 |
| 61. | Upper Bear Creek | 77.5% | 54.4%(+23.1)#62 | 46.1%(+31.4)#1,704 |
| 62. | Colona | 77.5% | 54.4%(+23.1)#63 | 46.1%(+31.4)#1,712 |
| 63. | Morrison | 77.3% | 54.4%(+22.9)#64 | 46.1%(+31.2)#1,741 |
| 64. | Crested Butte | 77.0% | 54.4%(+22.6)#65 | 46.1%(+30.9)#1,774 |
| 65. | Applewood | 76.4% | 54.4%(+22.0)#66 | 46.1%(+30.3)#1,860 |
| 66. | Stonegate | 76.3% | 54.4%(+21.9)#67 | 46.1%(+30.2)#1,873 |
| 67. | Inverness | 76.3% | 54.4%(+21.9)#68 | 46.1%(+30.2)#1,876 |
| 68. | Superior | 76.1% | 54.4%(+21.7)#69 | 46.1%(+30.0)#1,899 |
| 69. | Cherry Creek | 76.1% | 54.4%(+21.7)#70 | 46.1%(+30.0)#1,901 |
| 70. | Breckenridge | 75.8% | 54.4%(+21.4)#71 | 46.1%(+29.7)#1,948 |
| 71. | Castle Rock | 75.6% | 54.4%(+21.2)#72 | 46.1%(+29.5)#1,969 |
| 72. | Westcreek | 75.6% | 54.4%(+21.2)#73 | 46.1%(+29.5)#1,984 |
| 73. | Evergreen | 74.8% | 54.4%(+20.4)#74 | 46.1%(+28.7)#2,112 |
| 74. | Louisville | 74.5% | 54.4%(+20.1)#75 | 46.1%(+28.4)#2,152 |
| 75. | Mead | 74.5% | 54.4%(+20.1)#76 | 46.1%(+28.4)#2,159 |
| 76. | Lone Tree | 74.2% | 54.4%(+19.8)#77 | 46.1%(+28.1)#2,194 |
| 77. | Aspen Park | 74.2% | 54.4%(+19.8)#78 | 46.1%(+28.1)#2,197 |
| 78. | Allenspark | 73.9% | 54.4%(+19.5)#79 | 46.1%(+27.8)#2,245 |
| 79. | Grand Lake | 73.5% | 54.4%(+19.1)#80 | 46.1%(+27.4)#2,295 |
| 80. | Aspen | 73.3% | 54.4%(+18.9)#81 | 46.1%(+27.2)#2,326 |
| 81. | Sierra Ridge | 73.3% | 54.4%(+18.9)#82 | 46.1%(+27.2)#2,330 |
| 82. | Minturn | 73.1% | 54.4%(+18.7)#83 | 46.1%(+27.0)#2,358 |
| 83. | Black Forest | 73.0% | 54.4%(+18.6)#84 | 46.1%(+26.9)#2,367 |
| 84. | Broomfield | 72.7% | 54.4%(+18.3)#85 | 46.1%(+26.6)#2,418 |
| 85. | Parker | 72.4% | 54.4%(+18.0)#86 | 46.1%(+26.3)#2,475 |
| 86. | Holly Hills | 72.4% | 54.4%(+18.0)#87 | 46.1%(+26.3)#2,485 |
| 87. | Perry Park | 72.3% | 54.4%(+17.9)#88 | 46.1%(+26.2)#2,499 |
| 88. | Acres Green | 72.1% | 54.4%(+17.7)#89 | 46.1%(+26.0)#2,529 |
| 89. | Mount Crested Butte | 72.1% | 54.4%(+17.7)#90 | 46.1%(+26.0)#2,535 |
| 90. | Frederick | 72.0% | 54.4%(+17.6)#91 | 46.1%(+25.9)#2,545 |
| 91. | Coaldale | 71.2% | 54.4%(+16.8)#92 | 46.1%(+25.1)#2,697 |
| 92. | Centennial | 70.9% | 54.4%(+16.5)#93 | 46.1%(+24.8)#2,728 |
| 93. | Pine Brook Hill | 70.8% | 54.4%(+16.4)#94 | 46.1%(+24.7)#2,755 |
| 94. | Severance | 70.0% | 54.4%(+15.6)#95 | 46.1%(+23.9)#2,883 |
| 95. | Vail | 69.9% | 54.4%(+15.5)#96 | 46.1%(+23.8)#2,902 |
| 96. | Dakota Ridge | 69.5% | 54.4%(+15.1)#97 | 46.1%(+23.4)#2,957 |
| 97. | Windsor | 69.5% | 54.4%(+15.1)#98 | 46.1%(+23.4)#2,958 |
| 98. | Gunbarrel | 69.3% | 54.4%(+14.9)#99 | 46.1%(+23.2)#2,996 |
| 99. | Red Feather Lakes | 69.3% | 54.4%(+14.9)#100 | 46.1%(+23.2)#3,003 |
| 100. | Johnstown | 69.1% | 54.4%(+14.7)#101 | 46.1%(+23.0)#3,029 |
Common Questions
What are the Top 10 Cities with the Highest Percentage of Families with Income Above $100,000 in Colorado?
Top 10 Cities with the Highest Percentage of Families with Income Above $100,000 in Colorado are:
#1
100.0%
#2
100.0%
#3
100.0%
#4
100.0%
#5
100.0%
#6
100.0%
#7
100.0%
#8
100.0%
#9
100.0%
#10
100.0%
What city has the Highest Percentage of Families with Income Above $100,000 in Colorado?
Comanche Creek has the Highest Percentage of Families with Income Above $100,000 in Colorado with 100.0%.
What is the Percentage of Families with Income Above $100,000 in the State of Colorado?
Percentage of Families with Income Above $100,000 in Colorado is 54.4%.
What is the Percentage of Families with Income Above $100,000 in the United States?
Percentage of Families with Income Above $100,000 in the United States is 46.1%.