Zip Codes with the Highest Percentage of Families with Income Above $100,000 in San Jose, CA
RELATED REPORTS & OPTIONS
Family Income | $100k+
San Jose
Compare Zip Codes
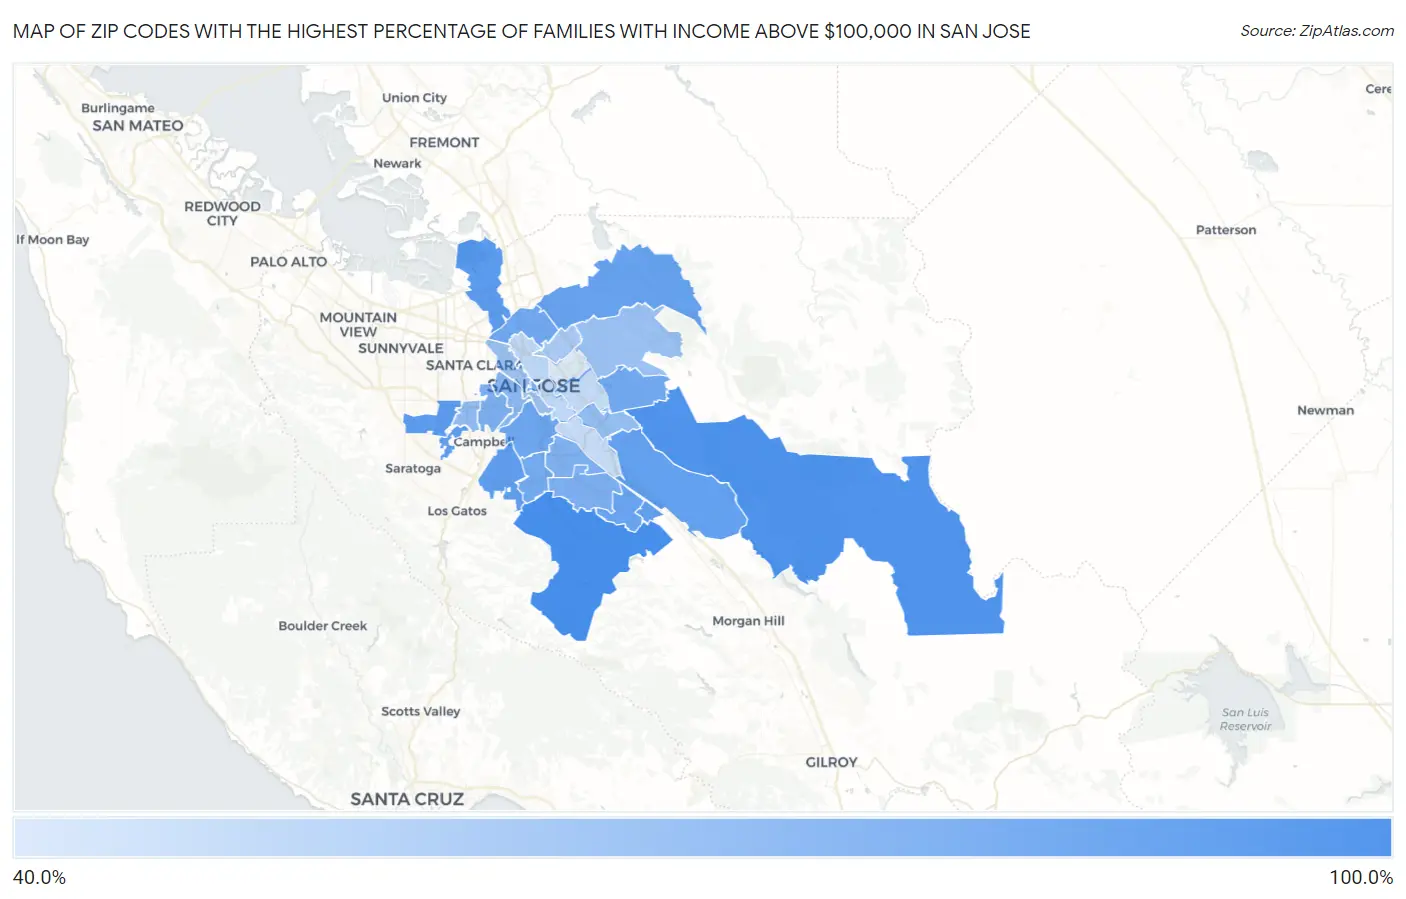
Map of Zip Codes with the Highest Percentage of Families with Income Above $100,000 in San Jose
42.7%
87.2%
Zip Codes with the Highest Percentage of Families with Income Above $100,000 in San Jose, CA
| Zip Code | Families with Income > $100k | vs State | vs National | |
| 1. | 95120 | 87.2% | 52.2%(+35.0)#37 | 46.1%(+41.1)#465 |
| 2. | 95135 | 85.0% | 52.2%(+32.8)#54 | 46.1%(+38.9)#588 |
| 3. | 95134 | 80.3% | 52.2%(+28.1)#112 | 46.1%(+34.2)#987 |
| 4. | 95129 | 79.2% | 52.2%(+27.0)#126 | 46.1%(+33.1)#1,116 |
| 5. | 95124 | 79.0% | 52.2%(+26.8)#129 | 46.1%(+32.9)#1,140 |
| 6. | 95130 | 78.5% | 52.2%(+26.3)#136 | 46.1%(+32.4)#1,208 |
| 7. | 95138 | 78.4% | 52.2%(+26.2)#139 | 46.1%(+32.3)#1,219 |
| 8. | 95139 | 78.2% | 52.2%(+26.0)#142 | 46.1%(+32.1)#1,239 |
| 9. | 95132 | 76.5% | 52.2%(+24.3)#167 | 46.1%(+30.4)#1,478 |
| 10. | 95119 | 76.0% | 52.2%(+23.8)#175 | 46.1%(+29.9)#1,563 |
| 11. | 95125 | 74.1% | 52.2%(+21.9)#213 | 46.1%(+28.0)#1,850 |
| 12. | 95131 | 73.4% | 52.2%(+21.2)#236 | 46.1%(+27.3)#1,963 |
| 13. | 95148 | 73.1% | 52.2%(+20.9)#242 | 46.1%(+27.0)#2,016 |
| 14. | 95118 | 72.0% | 52.2%(+19.8)#262 | 46.1%(+25.9)#2,207 |
| 15. | 95128 | 69.4% | 52.2%(+17.2)#339 | 46.1%(+23.3)#2,737 |
| 16. | 95123 | 69.1% | 52.2%(+16.9)#342 | 46.1%(+23.0)#2,791 |
| 17. | 95136 | 68.9% | 52.2%(+16.7)#345 | 46.1%(+22.8)#2,828 |
| 18. | 95113 | 67.7% | 52.2%(+15.5)#375 | 46.1%(+21.6)#3,101 |
| 19. | 95126 | 65.0% | 52.2%(+12.8)#452 | 46.1%(+18.9)#3,738 |
| 20. | 95117 | 63.0% | 52.2%(+10.8)#511 | 46.1%(+16.9)#4,277 |
| 21. | 95121 | 62.7% | 52.2%(+10.5)#520 | 46.1%(+16.6)#4,352 |
| 22. | 95127 | 60.4% | 52.2%(+8.20)#571 | 46.1%(+14.3)#5,017 |
| 23. | 95110 | 59.9% | 52.2%(+7.70)#583 | 46.1%(+13.8)#5,163 |
| 24. | 95133 | 56.6% | 52.2%(+4.40)#660 | 46.1%(+10.5)#6,224 |
| 25. | 95112 | 50.5% | 52.2%(-1.70)#818 | 46.1%(+4.40)#8,599 |
| 26. | 95122 | 48.6% | 52.2%(-3.60)#855 | 46.1%(+2.50)#9,441 |
| 27. | 95111 | 48.2% | 52.2%(-4.00)#866 | 46.1%(+2.10)#9,634 |
| 28. | 95116 | 42.7% | 52.2%(-9.50)#1,022 | 46.1%(-3.40)#12,677 |
1
Common Questions
What are the Top 10 Zip Codes with the Highest Percentage of Families with Income Above $100,000 in San Jose, CA?
Top 10 Zip Codes with the Highest Percentage of Families with Income Above $100,000 in San Jose, CA are:
What zip code has the Highest Percentage of Families with Income Above $100,000 in San Jose, CA?
95120 has the Highest Percentage of Families with Income Above $100,000 in San Jose, CA with 87.2%.
What is the Percentage of Families with Income Above $100,000 in San Jose, CA?
Percentage of Families with Income Above $100,000 in San Jose is 67.6%.
What is the Percentage of Families with Income Above $100,000 in California?
Percentage of Families with Income Above $100,000 in California is 52.2%.
What is the Percentage of Families with Income Above $100,000 in the United States?
Percentage of Families with Income Above $100,000 in the United States is 46.1%.