Cities with the Highest Percentage of Families with Income Above $100,000 in North Carolina
RELATED REPORTS & OPTIONS
Family Income | $100k+
North Carolina
Compare Cities
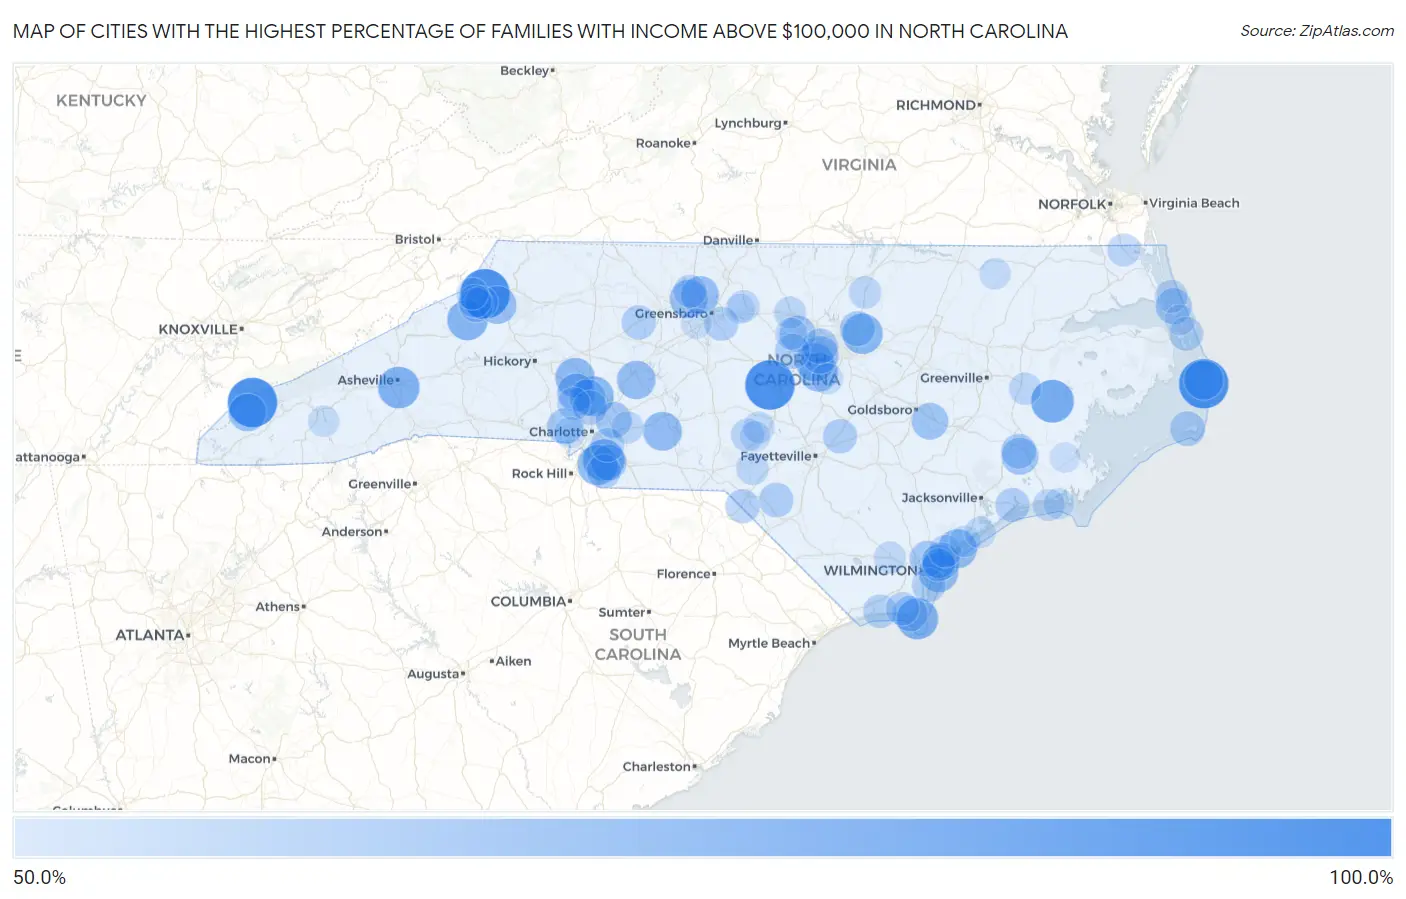
Map of Cities with the Highest Percentage of Families with Income Above $100,000 in North Carolina
0.0%
100.0%
Cities with the Highest Percentage of Families with Income Above $100,000 in North Carolina
| City | Families with Income > $100k | vs State | vs National | |
| 1. | Gulf | 100.0% | 40.4%(+59.6)#1 | 46.1%(+53.9)#94 |
| 2. | Waves | 100.0% | 40.4%(+59.6)#2 | 46.1%(+53.9)#122 |
| 3. | Valle Crucis | 100.0% | 40.4%(+59.6)#3 | 46.1%(+53.9)#124 |
| 4. | Fontana Dam | 100.0% | 40.4%(+59.6)#4 | 46.1%(+53.9)#399 |
| 5. | Grandfather | 95.6% | 40.4%(+55.2)#5 | 46.1%(+49.5)#447 |
| 6. | Glenwood | 86.9% | 40.4%(+46.5)#6 | 46.1%(+40.8)#757 |
| 7. | Bayview | 84.2% | 40.4%(+43.8)#7 | 46.1%(+38.1)#957 |
| 8. | Weddington | 81.3% | 40.4%(+40.9)#8 | 46.1%(+35.2)#1,252 |
| 9. | Biltmore Forest | 81.3% | 40.4%(+40.9)#9 | 46.1%(+35.2)#1,258 |
| 10. | Bald Head Island | 80.8% | 40.4%(+40.4)#10 | 46.1%(+34.7)#1,310 |
| 11. | Crossnore | 79.2% | 40.4%(+38.8)#11 | 46.1%(+33.1)#1,489 |
| 12. | Governors Club | 79.0% | 40.4%(+38.6)#12 | 46.1%(+32.9)#1,507 |
| 13. | Rolesville | 78.5% | 40.4%(+38.1)#13 | 46.1%(+32.4)#1,579 |
| 14. | Marvin | 78.2% | 40.4%(+37.8)#14 | 46.1%(+32.1)#1,610 |
| 15. | Briar Chapel | 77.6% | 40.4%(+37.2)#15 | 46.1%(+31.5)#1,694 |
| 16. | Davidson | 77.5% | 40.4%(+37.1)#16 | 46.1%(+31.4)#1,698 |
| 17. | Rodanthe | 76.7% | 40.4%(+36.3)#17 | 46.1%(+30.6)#1,818 |
| 18. | Lake Norman Of Catawba | 76.2% | 40.4%(+35.8)#18 | 46.1%(+30.1)#1,888 |
| 19. | Wrightsville Beach | 75.8% | 40.4%(+35.4)#19 | 46.1%(+29.7)#1,950 |
| 20. | Topsail Beach | 75.8% | 40.4%(+35.4)#20 | 46.1%(+29.7)#1,957 |
| 21. | Aquadale | 75.0% | 40.4%(+34.6)#21 | 46.1%(+28.9)#2,063 |
| 22. | Governors | 74.8% | 40.4%(+34.4)#22 | 46.1%(+28.7)#2,116 |
| 23. | Holly Springs | 74.1% | 40.4%(+33.7)#23 | 46.1%(+28.0)#2,206 |
| 24. | Faith | 74.1% | 40.4%(+33.7)#24 | 46.1%(+28.0)#2,223 |
| 25. | Apex | 74.0% | 40.4%(+33.6)#25 | 46.1%(+27.9)#2,228 |
| 26. | Carolina Meadows | 73.1% | 40.4%(+32.7)#26 | 46.1%(+27.0)#2,360 |
| 27. | Oak Ridge | 73.0% | 40.4%(+32.6)#27 | 46.1%(+26.9)#2,368 |
| 28. | Westport | 73.0% | 40.4%(+32.6)#28 | 46.1%(+26.9)#2,372 |
| 29. | Summerfield | 72.9% | 40.4%(+32.5)#29 | 46.1%(+26.8)#2,381 |
| 30. | Blowing Rock | 72.9% | 40.4%(+32.5)#30 | 46.1%(+26.8)#2,389 |
| 31. | Lake Santeetlah | 72.4% | 40.4%(+32.0)#31 | 46.1%(+26.3)#2,490 |
| 32. | Porters Neck | 71.8% | 40.4%(+31.4)#32 | 46.1%(+25.7)#2,578 |
| 33. | Cary | 71.6% | 40.4%(+31.2)#33 | 46.1%(+25.5)#2,613 |
| 34. | Barnardsville | 71.6% | 40.4%(+31.2)#34 | 46.1%(+25.5)#2,627 |
| 35. | Brices Creek | 70.6% | 40.4%(+30.2)#35 | 46.1%(+24.5)#2,784 |
| 36. | Walnut Creek | 70.2% | 40.4%(+29.8)#36 | 46.1%(+24.1)#2,852 |
| 37. | Jackson Springs | 70.2% | 40.4%(+29.8)#37 | 46.1%(+24.1)#2,857 |
| 38. | Cornelius | 69.1% | 40.4%(+28.7)#38 | 46.1%(+23.0)#3,025 |
| 39. | Chapel Hill | 68.8% | 40.4%(+28.4)#39 | 46.1%(+22.7)#3,079 |
| 40. | Harrisburg | 68.8% | 40.4%(+28.4)#40 | 46.1%(+22.7)#3,083 |
| 41. | Wesley Chapel | 68.4% | 40.4%(+28.0)#41 | 46.1%(+22.3)#3,166 |
| 42. | Southern Shores | 68.4% | 40.4%(+28.0)#42 | 46.1%(+22.3)#3,169 |
| 43. | Mcadenville | 68.4% | 40.4%(+28.0)#43 | 46.1%(+22.3)#3,176 |
| 44. | Blue Clay Farms | 67.9% | 40.4%(+27.5)#44 | 46.1%(+21.8)#3,276 |
| 45. | Morrisville | 67.4% | 40.4%(+27.0)#45 | 46.1%(+21.3)#3,345 |
| 46. | Caswell Beach | 67.0% | 40.4%(+26.6)#46 | 46.1%(+20.9)#3,415 |
| 47. | Wake Forest | 66.5% | 40.4%(+26.1)#47 | 46.1%(+20.4)#3,524 |
| 48. | Trent Woods | 66.1% | 40.4%(+25.7)#48 | 46.1%(+20.0)#3,597 |
| 49. | Fearrington Village | 66.1% | 40.4%(+25.7)#49 | 46.1%(+20.0)#3,600 |
| 50. | Frisco | 65.8% | 40.4%(+25.4)#50 | 46.1%(+19.7)#3,672 |
| 51. | Prospect | 65.2% | 40.4%(+24.8)#51 | 46.1%(+19.1)#3,805 |
| 52. | Sugar Mountain | 65.1% | 40.4%(+24.7)#52 | 46.1%(+19.0)#3,827 |
| 53. | Huntersville | 65.0% | 40.4%(+24.6)#53 | 46.1%(+18.9)#3,831 |
| 54. | Falcon | 64.7% | 40.4%(+24.3)#54 | 46.1%(+18.6)#3,906 |
| 55. | Swansboro | 64.5% | 40.4%(+24.1)#55 | 46.1%(+18.4)#3,941 |
| 56. | Bermuda Run | 64.4% | 40.4%(+24.0)#56 | 46.1%(+18.3)#3,963 |
| 57. | Forest Oaks | 64.2% | 40.4%(+23.8)#57 | 46.1%(+18.1)#4,007 |
| 58. | Scotch Meadows | 64.2% | 40.4%(+23.8)#58 | 46.1%(+18.1)#4,020 |
| 59. | Waxhaw | 64.0% | 40.4%(+23.6)#59 | 46.1%(+17.9)#4,045 |
| 60. | Myrtle Grove | 63.9% | 40.4%(+23.5)#60 | 46.1%(+17.8)#4,067 |
| 61. | Nags Head | 63.7% | 40.4%(+23.3)#61 | 46.1%(+17.6)#4,104 |
| 62. | Matthews | 63.6% | 40.4%(+23.2)#62 | 46.1%(+17.5)#4,120 |
| 63. | Holden Beach | 63.3% | 40.4%(+22.9)#63 | 46.1%(+17.2)#4,200 |
| 64. | Bayshore | 63.0% | 40.4%(+22.6)#64 | 46.1%(+16.9)#4,262 |
| 65. | St James | 62.7% | 40.4%(+22.3)#65 | 46.1%(+16.6)#4,325 |
| 66. | Stokesdale | 62.0% | 40.4%(+21.6)#66 | 46.1%(+15.9)#4,485 |
| 67. | Seven Devils | 62.0% | 40.4%(+21.6)#67 | 46.1%(+15.9)#4,496 |
| 68. | Ogden | 61.9% | 40.4%(+21.5)#68 | 46.1%(+15.8)#4,508 |
| 69. | Banner Elk | 61.8% | 40.4%(+21.4)#69 | 46.1%(+15.7)#4,534 |
| 70. | Pinehurst | 61.7% | 40.4%(+21.3)#70 | 46.1%(+15.6)#4,547 |
| 71. | Moyock | 61.6% | 40.4%(+21.2)#71 | 46.1%(+15.5)#4,568 |
| 72. | Duck | 61.6% | 40.4%(+21.2)#72 | 46.1%(+15.5)#4,574 |
| 73. | Gold Hill | 61.6% | 40.4%(+21.2)#73 | 46.1%(+15.5)#4,576 |
| 74. | Lowesville | 61.5% | 40.4%(+21.1)#74 | 46.1%(+15.4)#4,601 |
| 75. | Hampstead | 60.9% | 40.4%(+20.5)#75 | 46.1%(+14.8)#4,737 |
| 76. | Kittrell | 60.9% | 40.4%(+20.5)#76 | 46.1%(+14.8)#4,756 |
| 77. | Deercroft | 60.4% | 40.4%(+20.0)#77 | 46.1%(+14.3)#4,871 |
| 78. | Washington Park | 60.3% | 40.4%(+19.9)#78 | 46.1%(+14.2)#4,887 |
| 79. | Midland | 59.9% | 40.4%(+19.5)#79 | 46.1%(+13.8)#5,011 |
| 80. | Elon | 59.8% | 40.4%(+19.4)#80 | 46.1%(+13.7)#5,031 |
| 81. | Cherry Branch | 59.8% | 40.4%(+19.4)#81 | 46.1%(+13.7)#5,041 |
| 82. | Hillsborough | 59.7% | 40.4%(+19.3)#82 | 46.1%(+13.6)#5,053 |
| 83. | Pine Knoll Shores | 59.6% | 40.4%(+19.2)#83 | 46.1%(+13.5)#5,081 |
| 84. | Carrboro | 59.5% | 40.4%(+19.1)#84 | 46.1%(+13.4)#5,092 |
| 85. | Whispering Pines | 59.4% | 40.4%(+19.0)#85 | 46.1%(+13.3)#5,125 |
| 86. | Delco | 59.3% | 40.4%(+18.9)#86 | 46.1%(+13.2)#5,164 |
| 87. | Beech Mountain | 59.1% | 40.4%(+18.7)#87 | 46.1%(+13.0)#5,209 |
| 88. | Surf City | 58.3% | 40.4%(+17.9)#88 | 46.1%(+12.2)#5,395 |
| 89. | Brandywine Bay | 58.3% | 40.4%(+17.9)#89 | 46.1%(+12.2)#5,397 |
| 90. | North Topsail Beach | 58.3% | 40.4%(+17.9)#90 | 46.1%(+12.2)#5,398 |
| 91. | Forest Hills | 58.2% | 40.4%(+17.8)#91 | 46.1%(+12.1)#5,427 |
| 92. | Lasker | 58.1% | 40.4%(+17.7)#92 | 46.1%(+12.0)#5,451 |
| 93. | Fuquay Varina | 58.0% | 40.4%(+17.6)#93 | 46.1%(+11.9)#5,455 |
| 94. | Belmont | 58.0% | 40.4%(+17.6)#94 | 46.1%(+11.9)#5,462 |
| 95. | Atlantic Beach | 57.4% | 40.4%(+17.0)#95 | 46.1%(+11.3)#5,613 |
| 96. | Southern Pines | 57.0% | 40.4%(+16.6)#96 | 46.1%(+10.9)#5,721 |
| 97. | Kill Devil Hills | 56.7% | 40.4%(+16.3)#97 | 46.1%(+10.6)#5,787 |
| 98. | Jamestown | 56.3% | 40.4%(+15.9)#98 | 46.1%(+10.2)#5,892 |
| 99. | Oriental | 56.0% | 40.4%(+15.6)#99 | 46.1%(+9.90)#5,997 |
| 100. | Gibsonville | 55.4% | 40.4%(+15.0)#100 | 46.1%(+9.30)#6,161 |
Common Questions
What are the Top 10 Cities with the Highest Percentage of Families with Income Above $100,000 in North Carolina?
Top 10 Cities with the Highest Percentage of Families with Income Above $100,000 in North Carolina are:
#1
100.0%
#2
100.0%
#3
100.0%
#4
100.0%
#5
84.2%
#6
81.3%
#7
81.3%
#8
80.8%
#9
79.2%
#10
78.5%
What city has the Highest Percentage of Families with Income Above $100,000 in North Carolina?
Gulf has the Highest Percentage of Families with Income Above $100,000 in North Carolina with 100.0%.
What is the Percentage of Families with Income Above $100,000 in the State of North Carolina?
Percentage of Families with Income Above $100,000 in North Carolina is 40.4%.
What is the Percentage of Families with Income Above $100,000 in the United States?
Percentage of Families with Income Above $100,000 in the United States is 46.1%.