Cities with the Highest Percentage of Families with Income Above $100,000 in Mississippi
RELATED REPORTS & OPTIONS
Family Income | $100k+
Mississippi
Compare Cities
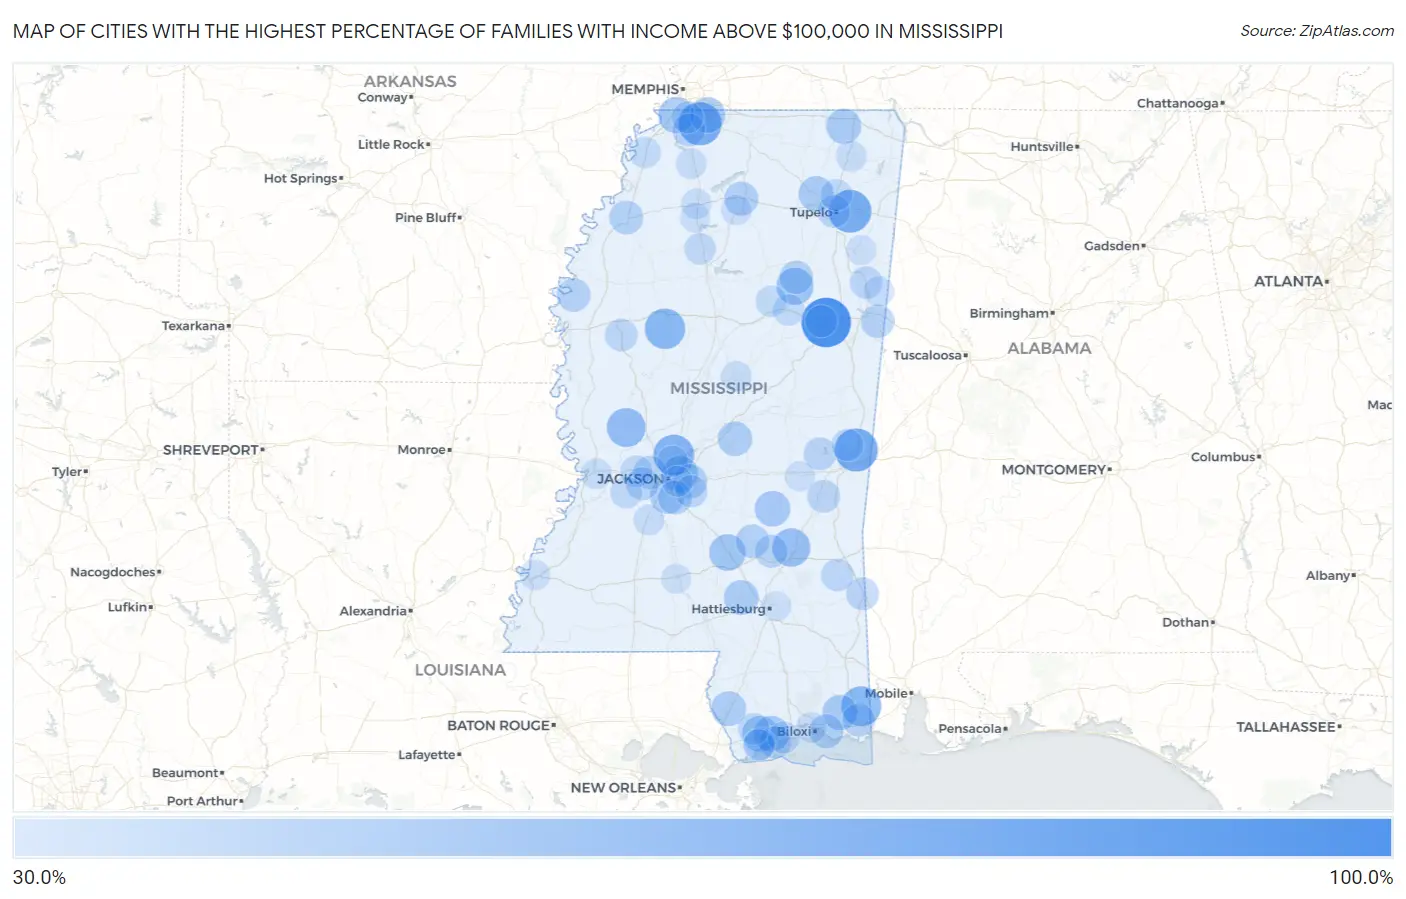
Map of Cities with the Highest Percentage of Families with Income Above $100,000 in Mississippi
0.0%
100.0%
Cities with the Highest Percentage of Families with Income Above $100,000 in Mississippi
| City | Families with Income > $100k | vs State | vs National | |
| 1. | Mississippi State | 100.0% | 31.1%(+68.9)#1 | 46.1%(+53.9)#10 |
| 2. | Runnelstown | 100.0% | 31.1%(+68.9)#2 | 46.1%(+53.9)#35 |
| 3. | Eastabuchie | 100.0% | 31.1%(+68.9)#3 | 46.1%(+53.9)#112 |
| 4. | Stewart | 100.0% | 31.1%(+68.9)#4 | 46.1%(+53.9)#135 |
| 5. | Ovett | 100.0% | 31.1%(+68.9)#5 | 46.1%(+53.9)#159 |
| 6. | Bolivar | 100.0% | 31.1%(+68.9)#6 | 46.1%(+53.9)#269 |
| 7. | Red Banks | 100.0% | 31.1%(+68.9)#7 | 46.1%(+53.9)#289 |
| 8. | Scott | 100.0% | 31.1%(+68.9)#8 | 46.1%(+53.9)#297 |
| 9. | Longview | 86.2% | 31.1%(+55.1)#9 | 46.1%(+40.1)#804 |
| 10. | Lauderdale | 77.5% | 31.1%(+46.4)#10 | 46.1%(+31.4)#1,709 |
| 11. | Bridgetown | 77.4% | 31.1%(+46.3)#11 | 46.1%(+31.3)#1,720 |
| 12. | Mooreville | 76.9% | 31.1%(+45.8)#12 | 46.1%(+30.8)#1,787 |
| 13. | Grace | 76.0% | 31.1%(+44.9)#13 | 46.1%(+29.9)#1,929 |
| 14. | New Site | 74.3% | 31.1%(+43.2)#14 | 46.1%(+28.2)#2,191 |
| 15. | Madison | 69.5% | 31.1%(+38.4)#15 | 46.1%(+23.4)#2,959 |
| 16. | Sidon | 68.0% | 31.1%(+36.9)#16 | 46.1%(+21.9)#3,259 |
| 17. | Big Point | 66.9% | 31.1%(+35.8)#17 | 46.1%(+20.8)#3,426 |
| 18. | Bogue Chitto Cdp Kemper And Neshoba Counties | 66.7% | 31.1%(+35.6)#18 | 46.1%(+20.6)#3,460 |
| 19. | Bobo | 63.0% | 31.1%(+31.9)#19 | 46.1%(+16.9)#4,273 |
| 20. | Satartia | 62.6% | 31.1%(+31.5)#20 | 46.1%(+16.5)#4,362 |
| 21. | Bogue Chitto | 61.4% | 31.1%(+30.3)#21 | 46.1%(+15.3)#4,639 |
| 22. | Sharon | 60.7% | 31.1%(+29.6)#22 | 46.1%(+14.6)#4,803 |
| 23. | Mantee | 56.6% | 31.1%(+25.5)#23 | 46.1%(+10.5)#5,839 |
| 24. | Mount Olive | 55.1% | 31.1%(+24.0)#24 | 46.1%(+9.00)#6,254 |
| 25. | Gluckstadt | 53.3% | 31.1%(+22.2)#25 | 46.1%(+7.20)#6,794 |
| 26. | Flowood | 53.0% | 31.1%(+21.9)#26 | 46.1%(+6.90)#6,879 |
| 27. | Lynchburg | 53.0% | 31.1%(+21.9)#27 | 46.1%(+6.90)#6,890 |
| 28. | Diamondhead | 52.3% | 31.1%(+21.2)#28 | 46.1%(+6.20)#7,092 |
| 29. | Delisle | 52.1% | 31.1%(+21.0)#29 | 46.1%(+6.00)#7,167 |
| 30. | Louin | 51.8% | 31.1%(+20.7)#30 | 46.1%(+5.70)#7,258 |
| 31. | Olive Branch | 51.7% | 31.1%(+20.6)#31 | 46.1%(+5.60)#7,269 |
| 32. | Blue Springs | 50.7% | 31.1%(+19.6)#32 | 46.1%(+4.60)#7,589 |
| 33. | Vancleave | 50.3% | 31.1%(+19.2)#33 | 46.1%(+4.20)#7,700 |
| 34. | Kossuth | 50.0% | 31.1%(+18.9)#34 | 46.1%(+3.90)#7,835 |
| 35. | Hide A Way Lake | 49.6% | 31.1%(+18.5)#35 | 46.1%(+3.50)#8,026 |
| 36. | Sumrall | 48.8% | 31.1%(+17.7)#36 | 46.1%(+2.70)#8,251 |
| 37. | Cleary | 48.8% | 31.1%(+17.7)#37 | 46.1%(+2.70)#8,252 |
| 38. | Rena Lara | 48.3% | 31.1%(+17.2)#38 | 46.1%(+2.20)#8,440 |
| 39. | Lena | 47.8% | 31.1%(+16.7)#39 | 46.1%(+1.70)#8,599 |
| 40. | Independence | 47.3% | 31.1%(+16.2)#40 | 46.1%(+1.20)#8,767 |
| 41. | Brandon | 47.2% | 31.1%(+16.1)#41 | 46.1%(+1.10)#8,771 |
| 42. | Ocean Springs | 46.7% | 31.1%(+15.6)#42 | 46.1%(+0.600)#8,983 |
| 43. | Oxford | 46.5% | 31.1%(+15.4)#43 | 46.1%(+0.400)#9,054 |
| 44. | Elizabeth | 46.4% | 31.1%(+15.3)#44 | 46.1%(+0.300)#9,126 |
| 45. | Arkabutla | 46.3% | 31.1%(+15.2)#45 | 46.1%(+0.200)#9,159 |
| 46. | Lyon | 45.9% | 31.1%(+14.8)#46 | 46.1%(-0.200)#9,309 |
| 47. | Florence | 45.8% | 31.1%(+14.7)#47 | 46.1%(-0.300)#9,328 |
| 48. | Taylorsville | 45.3% | 31.1%(+14.2)#48 | 46.1%(-0.800)#9,557 |
| 49. | Benoit | 44.7% | 31.1%(+13.6)#49 | 46.1%(-1.40)#9,828 |
| 50. | Clinton | 44.6% | 31.1%(+13.5)#50 | 46.1%(-1.50)#9,838 |
| 51. | New Hope | 44.4% | 31.1%(+13.3)#51 | 46.1%(-1.70)#9,904 |
| 52. | Woodland | 44.4% | 31.1%(+13.3)#52 | 46.1%(-1.70)#9,929 |
| 53. | Wheeler | 44.3% | 31.1%(+13.2)#53 | 46.1%(-1.80)#9,974 |
| 54. | Helena | 43.2% | 31.1%(+12.1)#54 | 46.1%(-2.90)#10,414 |
| 55. | Victoria | 42.8% | 31.1%(+11.7)#55 | 46.1%(-3.30)#10,577 |
| 56. | Enterprise | 42.7% | 31.1%(+11.6)#56 | 46.1%(-3.40)#10,634 |
| 57. | Soso | 42.7% | 31.1%(+11.6)#57 | 46.1%(-3.40)#10,637 |
| 58. | Collinsville | 42.6% | 31.1%(+11.5)#58 | 46.1%(-3.50)#10,664 |
| 59. | Hernando | 42.3% | 31.1%(+11.2)#59 | 46.1%(-3.80)#10,756 |
| 60. | Raymond | 42.2% | 31.1%(+11.1)#60 | 46.1%(-3.90)#10,805 |
| 61. | State Line | 42.1% | 31.1%(+11.0)#61 | 46.1%(-4.00)#10,853 |
| 62. | Tupelo | 42.0% | 31.1%(+10.9)#62 | 46.1%(-4.10)#10,871 |
| 63. | Clara | 41.7% | 31.1%(+10.6)#63 | 46.1%(-4.40)#11,017 |
| 64. | Inverness | 41.3% | 31.1%(+10.2)#64 | 46.1%(-4.80)#11,185 |
| 65. | New Hamilton | 41.3% | 31.1%(+10.2)#65 | 46.1%(-4.80)#11,188 |
| 66. | Robinhood | 40.7% | 31.1%(+9.60)#66 | 46.1%(-5.40)#11,512 |
| 67. | Pass Christian | 40.2% | 31.1%(+9.10)#67 | 46.1%(-5.90)#11,745 |
| 68. | Starkville | 40.1% | 31.1%(+9.00)#68 | 46.1%(-6.00)#11,774 |
| 69. | Meridian Station | 39.7% | 31.1%(+8.60)#69 | 46.1%(-6.40)#12,016 |
| 70. | Saltillo | 39.6% | 31.1%(+8.50)#70 | 46.1%(-6.50)#12,034 |
| 71. | Bolton | 39.5% | 31.1%(+8.40)#71 | 46.1%(-6.60)#12,109 |
| 72. | Long Beach | 39.4% | 31.1%(+8.30)#72 | 46.1%(-6.70)#12,129 |
| 73. | Bay St Louis | 39.4% | 31.1%(+8.30)#73 | 46.1%(-6.70)#12,132 |
| 74. | Tillatoba | 38.9% | 31.1%(+7.80)#74 | 46.1%(-7.20)#12,410 |
| 75. | Learned | 38.9% | 31.1%(+7.80)#75 | 46.1%(-7.20)#12,411 |
| 76. | Southaven | 38.7% | 31.1%(+7.60)#76 | 46.1%(-7.40)#12,463 |
| 77. | Kiln | 38.7% | 31.1%(+7.60)#77 | 46.1%(-7.40)#12,481 |
| 78. | Tunica | 38.4% | 31.1%(+7.30)#78 | 46.1%(-7.70)#12,640 |
| 79. | Waveland | 38.2% | 31.1%(+7.10)#79 | 46.1%(-7.90)#12,724 |
| 80. | Mathiston | 38.0% | 31.1%(+6.90)#80 | 46.1%(-8.10)#12,844 |
| 81. | Oak Grove | 37.6% | 31.1%(+6.50)#81 | 46.1%(-8.50)#13,033 |
| 82. | Walthall | 37.5% | 31.1%(+6.40)#82 | 46.1%(-8.60)#13,120 |
| 83. | Ridgeland | 36.4% | 31.1%(+5.30)#83 | 46.1%(-9.70)#13,655 |
| 84. | Booneville | 36.3% | 31.1%(+5.20)#84 | 46.1%(-9.80)#13,729 |
| 85. | Biloxi | 36.0% | 31.1%(+4.90)#85 | 46.1%(-10.1)#13,859 |
| 86. | Bond | 36.0% | 31.1%(+4.90)#86 | 46.1%(-10.1)#13,911 |
| 87. | Senatobia | 35.7% | 31.1%(+4.60)#87 | 46.1%(-10.4)#14,048 |
| 88. | Pearl | 35.6% | 31.1%(+4.50)#88 | 46.1%(-10.5)#14,094 |
| 89. | Kosciusko | 35.6% | 31.1%(+4.50)#89 | 46.1%(-10.5)#14,100 |
| 90. | Beechwood | 35.6% | 31.1%(+4.50)#90 | 46.1%(-10.5)#14,104 |
| 91. | Crystal Springs | 35.5% | 31.1%(+4.40)#91 | 46.1%(-10.6)#14,148 |
| 92. | Taylor | 34.8% | 31.1%(+3.70)#92 | 46.1%(-11.3)#14,535 |
| 93. | Caledonia | 34.7% | 31.1%(+3.60)#93 | 46.1%(-11.4)#14,567 |
| 94. | Morgantown | 34.7% | 31.1%(+3.60)#94 | 46.1%(-11.4)#14,570 |
| 95. | Batesville | 34.6% | 31.1%(+3.50)#95 | 46.1%(-11.5)#14,605 |
| 96. | Hickory | 34.2% | 31.1%(+3.10)#96 | 46.1%(-11.9)#14,837 |
| 97. | Amory | 33.8% | 31.1%(+2.70)#97 | 46.1%(-12.3)#15,027 |
| 98. | Petal | 33.7% | 31.1%(+2.60)#98 | 46.1%(-12.4)#15,083 |
| 99. | Pope | 33.7% | 31.1%(+2.60)#99 | 46.1%(-12.4)#15,119 |
| 100. | Monticello | 33.6% | 31.1%(+2.50)#100 | 46.1%(-12.5)#15,162 |
Common Questions
What are the Top 10 Cities with the Highest Percentage of Families with Income Above $100,000 in Mississippi?
Top 10 Cities with the Highest Percentage of Families with Income Above $100,000 in Mississippi are:
#1
100.0%
#2
77.5%
#3
77.4%
#4
76.9%
#5
69.5%
#6
68.0%
#7
66.9%
#8
62.6%
#9
60.7%
#10
56.6%
What city has the Highest Percentage of Families with Income Above $100,000 in Mississippi?
Mississippi State has the Highest Percentage of Families with Income Above $100,000 in Mississippi with 100.0%.
What is the Percentage of Families with Income Above $100,000 in the State of Mississippi?
Percentage of Families with Income Above $100,000 in Mississippi is 31.1%.
What is the Percentage of Families with Income Above $100,000 in the United States?
Percentage of Families with Income Above $100,000 in the United States is 46.1%.