Cities with the Highest Percentage of Families with Income Above $100,000 in Michigan
RELATED REPORTS & OPTIONS
Family Income | $100k+
Michigan
Compare Cities
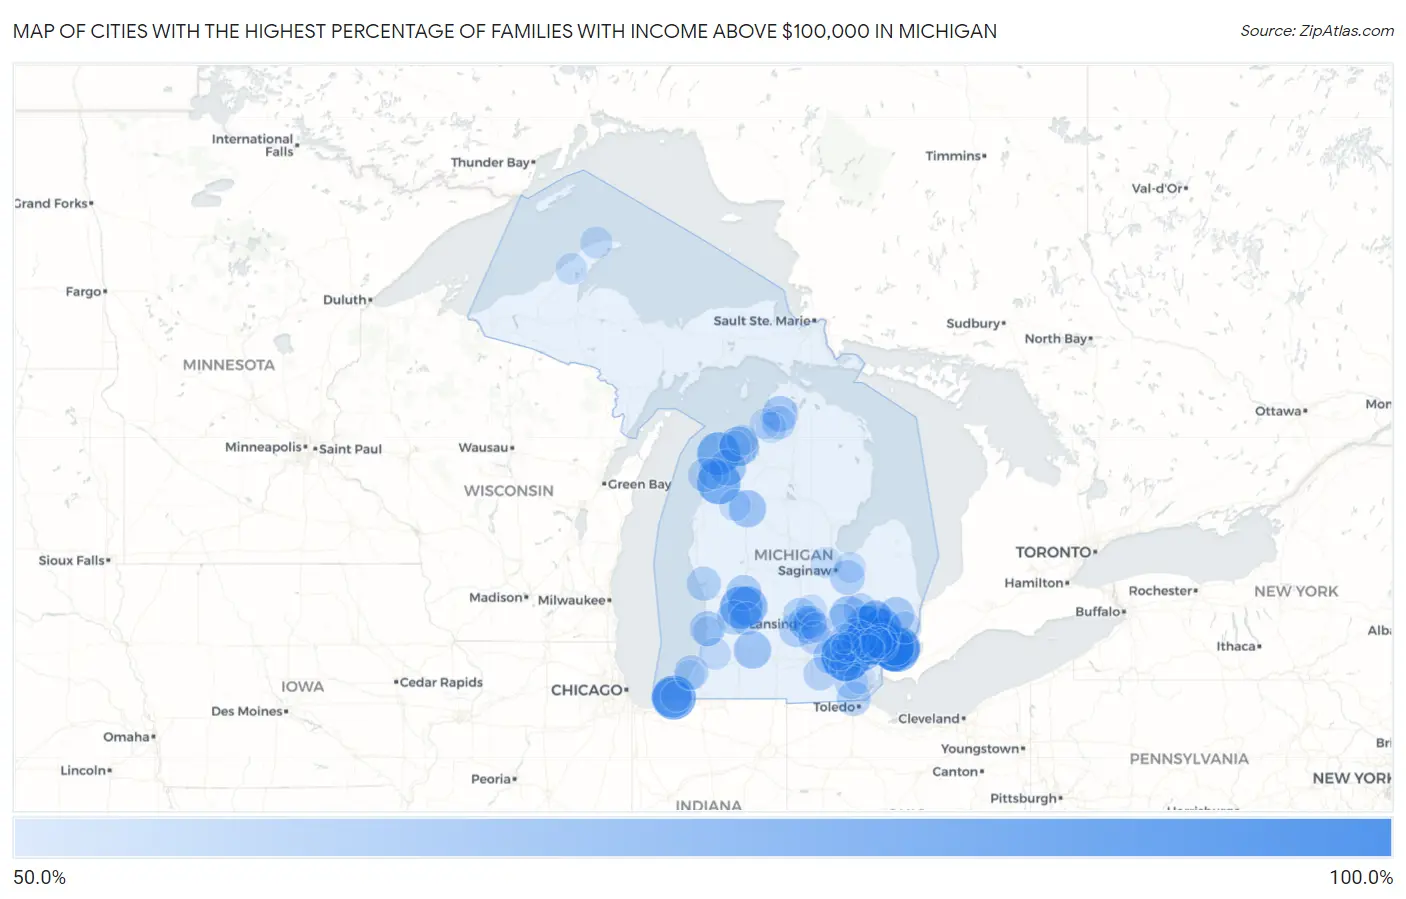
Map of Cities with the Highest Percentage of Families with Income Above $100,000 in Michigan
0.0%
100.0%
Cities with the Highest Percentage of Families with Income Above $100,000 in Michigan
| City | Families with Income > $100k | vs State | vs National | |
| 1. | Pelkie | 100.0% | 42.6%(+57.4)#1 | 46.1%(+53.9)#304 |
| 2. | Barton Hills | 96.5% | 42.6%(+53.9)#2 | 46.1%(+50.4)#438 |
| 3. | Bingham Farms | 86.3% | 42.6%(+43.7)#3 | 46.1%(+40.2)#796 |
| 4. | Bloomfield Hills | 85.3% | 42.6%(+42.7)#4 | 46.1%(+39.2)#868 |
| 5. | Huntington Woods | 84.8% | 42.6%(+42.2)#5 | 46.1%(+38.7)#905 |
| 6. | Grand Beach | 84.4% | 42.6%(+41.8)#6 | 46.1%(+38.3)#949 |
| 7. | Franklin | 84.0% | 42.6%(+41.4)#7 | 46.1%(+37.9)#969 |
| 8. | Pleasant Ridge | 84.0% | 42.6%(+41.4)#8 | 46.1%(+37.9)#970 |
| 9. | Grosse Pointe Farms | 83.7% | 42.6%(+41.1)#9 | 46.1%(+37.6)#998 |
| 10. | Crystal Mountain | 82.8% | 42.6%(+40.2)#10 | 46.1%(+36.7)#1,093 |
| 11. | Glen Arbor | 82.1% | 42.6%(+39.5)#11 | 46.1%(+36.0)#1,163 |
| 12. | Birmingham | 80.8% | 42.6%(+38.2)#12 | 46.1%(+34.7)#1,302 |
| 13. | East Grand Rapids | 80.4% | 42.6%(+37.8)#13 | 46.1%(+34.3)#1,338 |
| 14. | Beverly Hills | 80.0% | 42.6%(+37.4)#14 | 46.1%(+33.9)#1,371 |
| 15. | Lake Angelus | 78.7% | 42.6%(+36.1)#15 | 46.1%(+32.6)#1,552 |
| 16. | Lamont | 77.6% | 42.6%(+35.0)#16 | 46.1%(+31.5)#1,695 |
| 17. | Grosse Pointe | 77.3% | 42.6%(+34.7)#17 | 46.1%(+31.2)#1,731 |
| 18. | Northville | 76.7% | 42.6%(+34.1)#18 | 46.1%(+30.6)#1,809 |
| 19. | Orchard Lake Village | 76.3% | 42.6%(+33.7)#19 | 46.1%(+30.2)#1,879 |
| 20. | Village Of Grosse Pointe Shores | 76.0% | 42.6%(+33.4)#20 | 46.1%(+29.9)#1,922 |
| 21. | Michiana | 75.9% | 42.6%(+33.3)#21 | 46.1%(+29.8)#1,942 |
| 22. | Grosse Pointe Park | 75.3% | 42.6%(+32.7)#22 | 46.1%(+29.2)#2,017 |
| 23. | Forest Hills | 74.7% | 42.6%(+32.1)#23 | 46.1%(+28.6)#2,118 |
| 24. | Plymouth | 74.3% | 42.6%(+31.7)#24 | 46.1%(+28.2)#2,180 |
| 25. | Suttons Bay | 73.9% | 42.6%(+31.3)#25 | 46.1%(+27.8)#2,244 |
| 26. | Grosse Pointe Woods | 73.3% | 42.6%(+30.7)#26 | 46.1%(+27.2)#2,321 |
| 27. | Rochester Hills | 72.9% | 42.6%(+30.3)#27 | 46.1%(+26.8)#2,378 |
| 28. | Berkley | 72.6% | 42.6%(+30.0)#28 | 46.1%(+26.5)#2,445 |
| 29. | Sylvan Lake | 71.9% | 42.6%(+29.3)#29 | 46.1%(+25.8)#2,571 |
| 30. | Rochester | 70.8% | 42.6%(+28.2)#30 | 46.1%(+24.7)#2,743 |
| 31. | Lake Fenton | 70.5% | 42.6%(+27.9)#31 | 46.1%(+24.4)#2,806 |
| 32. | Troy | 69.8% | 42.6%(+27.2)#32 | 46.1%(+23.7)#2,909 |
| 33. | Novi | 69.3% | 42.6%(+26.7)#33 | 46.1%(+23.2)#2,990 |
| 34. | South Gull Lake | 69.3% | 42.6%(+26.7)#34 | 46.1%(+23.2)#3,002 |
| 35. | Lake Orion | 69.1% | 42.6%(+26.5)#35 | 46.1%(+23.0)#3,033 |
| 36. | Wedgewood | 69.0% | 42.6%(+26.4)#36 | 46.1%(+22.9)#3,053 |
| 37. | Maple Grove | 68.0% | 42.6%(+25.4)#37 | 46.1%(+21.9)#3,260 |
| 38. | Village Of Clarkston | 67.6% | 42.6%(+25.0)#38 | 46.1%(+21.5)#3,320 |
| 39. | Armada | 66.2% | 42.6%(+23.6)#39 | 46.1%(+20.1)#3,580 |
| 40. | Bay View | 65.8% | 42.6%(+23.2)#40 | 46.1%(+19.7)#3,677 |
| 41. | Chelsea | 65.1% | 42.6%(+22.5)#41 | 46.1%(+19.0)#3,820 |
| 42. | Hartland | 65.0% | 42.6%(+22.4)#42 | 46.1%(+18.9)#3,847 |
| 43. | Saugatuck | 64.7% | 42.6%(+22.1)#43 | 46.1%(+18.6)#3,901 |
| 44. | Farmington Hills | 64.6% | 42.6%(+22.0)#44 | 46.1%(+18.5)#3,910 |
| 45. | Ann Arbor | 64.3% | 42.6%(+21.7)#45 | 46.1%(+18.2)#3,977 |
| 46. | Rockford | 64.1% | 42.6%(+21.5)#46 | 46.1%(+18.0)#4,027 |
| 47. | Okemos | 64.0% | 42.6%(+21.4)#47 | 46.1%(+17.9)#4,044 |
| 48. | Royal Oak | 63.4% | 42.6%(+20.8)#48 | 46.1%(+17.3)#4,162 |
| 49. | Frankenmuth | 63.2% | 42.6%(+20.6)#49 | 46.1%(+17.1)#4,217 |
| 50. | Dimondale | 62.8% | 42.6%(+20.2)#50 | 46.1%(+16.7)#4,315 |
| 51. | Wixom | 62.6% | 42.6%(+20.0)#51 | 46.1%(+16.5)#4,349 |
| 52. | St Joseph | 62.5% | 42.6%(+19.9)#52 | 46.1%(+16.4)#4,369 |
| 53. | Lambertville | 62.4% | 42.6%(+19.8)#53 | 46.1%(+16.3)#4,400 |
| 54. | North Muskegon | 62.3% | 42.6%(+19.7)#54 | 46.1%(+16.2)#4,427 |
| 55. | Byron Center | 62.2% | 42.6%(+19.6)#55 | 46.1%(+16.1)#4,448 |
| 56. | Dewitt | 62.1% | 42.6%(+19.5)#56 | 46.1%(+16.0)#4,470 |
| 57. | Elberta | 61.6% | 42.6%(+19.0)#57 | 46.1%(+15.5)#4,579 |
| 58. | East Lansing | 61.4% | 42.6%(+18.8)#58 | 46.1%(+15.3)#4,618 |
| 59. | Haslett | 61.1% | 42.6%(+18.5)#59 | 46.1%(+15.0)#4,698 |
| 60. | Goodrich | 60.9% | 42.6%(+18.3)#60 | 46.1%(+14.8)#4,745 |
| 61. | Caledonia | 60.8% | 42.6%(+18.2)#61 | 46.1%(+14.7)#4,768 |
| 62. | Dansville | 60.8% | 42.6%(+18.2)#62 | 46.1%(+14.7)#4,772 |
| 63. | Walloon Lake | 60.8% | 42.6%(+18.2)#63 | 46.1%(+14.7)#4,779 |
| 64. | Dundee | 60.7% | 42.6%(+18.1)#64 | 46.1%(+14.6)#4,796 |
| 65. | Vineyard Lake | 60.6% | 42.6%(+18.0)#65 | 46.1%(+14.5)#4,822 |
| 66. | Milford | 60.5% | 42.6%(+17.9)#66 | 46.1%(+14.4)#4,834 |
| 67. | Wolverine Lake | 59.8% | 42.6%(+17.2)#67 | 46.1%(+13.7)#5,033 |
| 68. | Oxford | 59.0% | 42.6%(+16.4)#68 | 46.1%(+12.9)#5,228 |
| 69. | South Lyon | 58.3% | 42.6%(+15.7)#69 | 46.1%(+12.2)#5,391 |
| 70. | Ferndale | 58.0% | 42.6%(+15.4)#70 | 46.1%(+11.9)#5,458 |
| 71. | New Baltimore | 58.0% | 42.6%(+15.4)#71 | 46.1%(+11.9)#5,463 |
| 72. | Farmington | 57.7% | 42.6%(+15.1)#72 | 46.1%(+11.6)#5,533 |
| 73. | Lathrup Village | 57.7% | 42.6%(+15.1)#73 | 46.1%(+11.6)#5,537 |
| 74. | Eagle Harbor | 57.5% | 42.6%(+14.9)#74 | 46.1%(+11.4)#5,605 |
| 75. | Caberfae | 57.2% | 42.6%(+14.6)#75 | 46.1%(+11.1)#5,669 |
| 76. | Breedsville | 57.1% | 42.6%(+14.5)#76 | 46.1%(+11.0)#5,698 |
| 77. | Hancock | 56.8% | 42.6%(+14.2)#77 | 46.1%(+10.7)#5,766 |
| 78. | Livonia | 56.6% | 42.6%(+14.0)#78 | 46.1%(+10.5)#5,816 |
| 79. | Freeland | 56.3% | 42.6%(+13.7)#79 | 46.1%(+10.2)#5,889 |
| 80. | Winn | 56.3% | 42.6%(+13.7)#80 | 46.1%(+10.2)#5,915 |
| 81. | Saline | 56.0% | 42.6%(+13.4)#81 | 46.1%(+9.90)#5,983 |
| 82. | Reese | 55.8% | 42.6%(+13.2)#82 | 46.1%(+9.70)#6,063 |
| 83. | Beulah | 55.8% | 42.6%(+13.2)#83 | 46.1%(+9.70)#6,075 |
| 84. | Omena | 55.7% | 42.6%(+13.1)#84 | 46.1%(+9.60)#6,091 |
| 85. | Dexter | 55.6% | 42.6%(+13.0)#85 | 46.1%(+9.50)#6,103 |
| 86. | Lake Victoria | 55.6% | 42.6%(+13.0)#86 | 46.1%(+9.50)#6,112 |
| 87. | Advance | 55.6% | 42.6%(+13.0)#87 | 46.1%(+9.50)#6,117 |
| 88. | Lake Leelanau | 55.6% | 42.6%(+13.0)#88 | 46.1%(+9.50)#6,121 |
| 89. | Eureka | 55.5% | 42.6%(+12.9)#89 | 46.1%(+9.40)#6,155 |
| 90. | New Buffalo | 55.3% | 42.6%(+12.7)#90 | 46.1%(+9.20)#6,202 |
| 91. | Ironton | 54.9% | 42.6%(+12.3)#91 | 46.1%(+8.80)#6,321 |
| 92. | Pinckney | 54.8% | 42.6%(+12.2)#92 | 46.1%(+8.70)#6,340 |
| 93. | Maybee | 54.7% | 42.6%(+12.1)#93 | 46.1%(+8.60)#6,366 |
| 94. | Argentine | 54.4% | 42.6%(+11.8)#94 | 46.1%(+8.30)#6,459 |
| 95. | Williamston | 54.3% | 42.6%(+11.7)#95 | 46.1%(+8.20)#6,494 |
| 96. | Three Lakes | 54.1% | 42.6%(+11.5)#96 | 46.1%(+8.00)#6,569 |
| 97. | Brighton | 53.7% | 42.6%(+11.1)#97 | 46.1%(+7.60)#6,674 |
| 98. | Douglas | 53.7% | 42.6%(+11.1)#98 | 46.1%(+7.60)#6,686 |
| 99. | Shoreham | 53.7% | 42.6%(+11.1)#99 | 46.1%(+7.60)#6,687 |
| 100. | Whitmore Lake | 53.6% | 42.6%(+11.0)#100 | 46.1%(+7.50)#6,702 |
Common Questions
What are the Top 10 Cities with the Highest Percentage of Families with Income Above $100,000 in Michigan?
Top 10 Cities with the Highest Percentage of Families with Income Above $100,000 in Michigan are:
#1
96.5%
#2
86.3%
#3
85.3%
#4
84.8%
#5
84.4%
#6
84.0%
#7
84.0%
#8
83.7%
#9
82.8%
#10
82.1%
What city has the Highest Percentage of Families with Income Above $100,000 in Michigan?
Barton Hills has the Highest Percentage of Families with Income Above $100,000 in Michigan with 96.5%.
What is the Percentage of Families with Income Above $100,000 in the State of Michigan?
Percentage of Families with Income Above $100,000 in Michigan is 42.6%.
What is the Percentage of Families with Income Above $100,000 in the United States?
Percentage of Families with Income Above $100,000 in the United States is 46.1%.