Cities with the Highest Percentage of Families with Income Above $100,000 in Minnesota
RELATED REPORTS & OPTIONS
Family Income | $100k+
Minnesota
Compare Cities
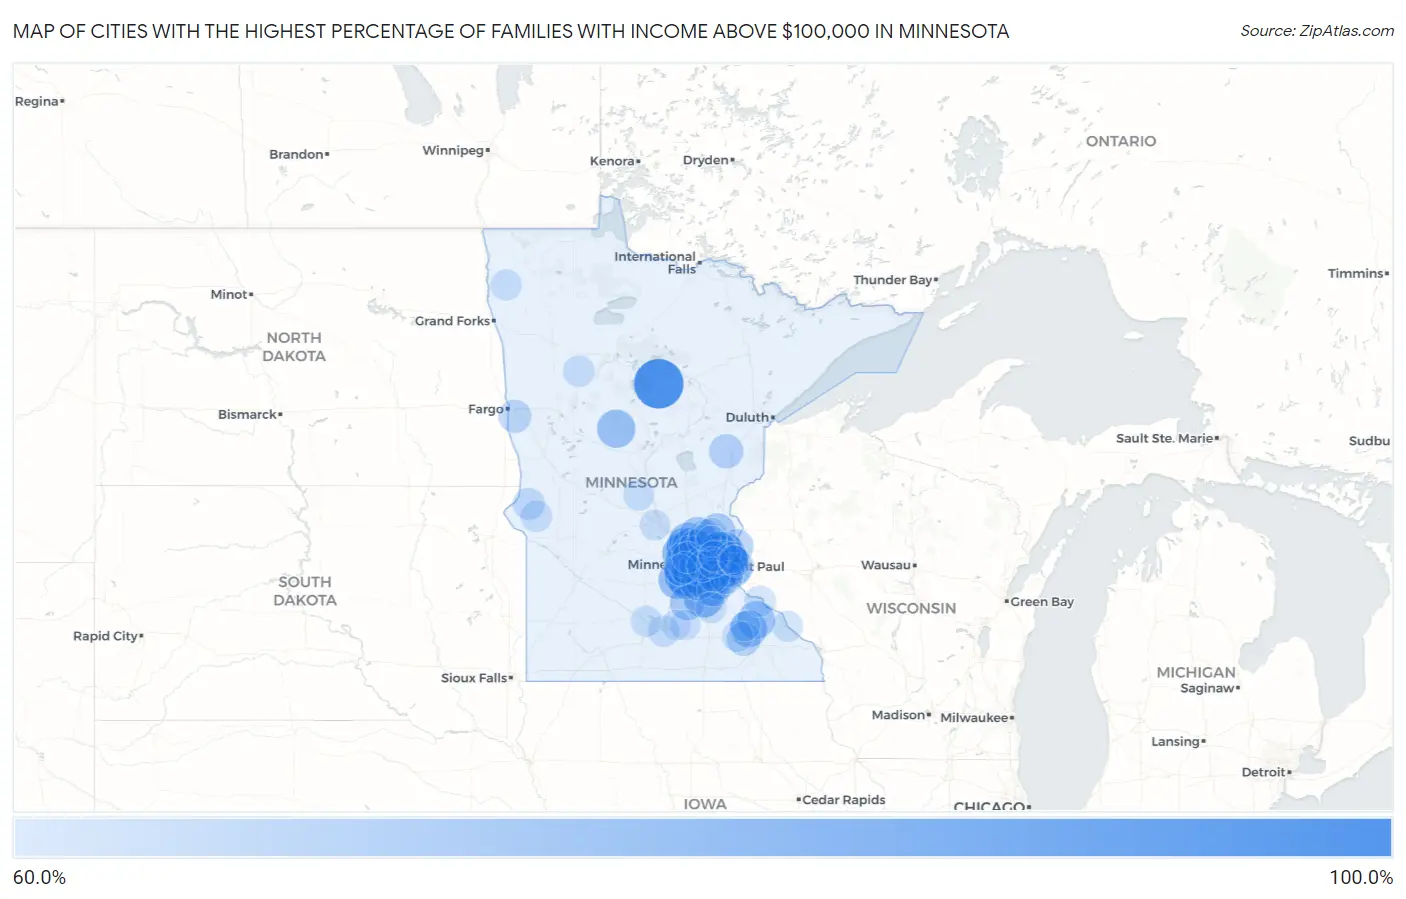
Map of Cities with the Highest Percentage of Families with Income Above $100,000 in Minnesota
0.0%
100.0%
Cities with the Highest Percentage of Families with Income Above $100,000 in Minnesota
| City | Families with Income > $100k | vs State | vs National | |
| 1. | St. John's University | 100.0% | 53.9%(+46.1)#1 | 46.1%(+53.9)#13 |
| 2. | Boy River | 100.0% | 53.9%(+46.1)#2 | 46.1%(+53.9)#418 |
| 3. | Woodland | 92.1% | 53.9%(+38.2)#3 | 46.1%(+46.0)#512 |
| 4. | Minnetonka Beach | 90.3% | 53.9%(+36.4)#4 | 46.1%(+44.2)#573 |
| 5. | Victoria | 89.1% | 53.9%(+35.2)#5 | 46.1%(+43.0)#628 |
| 6. | Deephaven | 89.1% | 53.9%(+35.2)#6 | 46.1%(+43.0)#633 |
| 7. | Medina | 85.0% | 53.9%(+31.1)#7 | 46.1%(+38.9)#892 |
| 8. | Pine Springs | 83.0% | 53.9%(+29.1)#8 | 46.1%(+36.9)#1,072 |
| 9. | Dellwood | 82.8% | 53.9%(+28.9)#9 | 46.1%(+36.7)#1,088 |
| 10. | Sunfish Lake | 82.8% | 53.9%(+28.9)#10 | 46.1%(+36.7)#1,090 |
| 11. | Greenfield | 82.4% | 53.9%(+28.5)#11 | 46.1%(+36.3)#1,117 |
| 12. | Orono | 82.1% | 53.9%(+28.2)#12 | 46.1%(+36.0)#1,153 |
| 13. | North Oaks | 81.5% | 53.9%(+27.6)#13 | 46.1%(+35.4)#1,222 |
| 14. | Elko New Market | 81.5% | 53.9%(+27.6)#14 | 46.1%(+35.4)#1,223 |
| 15. | Greenwood | 79.8% | 53.9%(+25.9)#15 | 46.1%(+33.7)#1,402 |
| 16. | Lake Elmo | 79.3% | 53.9%(+25.4)#16 | 46.1%(+33.2)#1,461 |
| 17. | Credit River | 79.3% | 53.9%(+25.4)#17 | 46.1%(+33.2)#1,465 |
| 18. | Minnetrista | 78.6% | 53.9%(+24.7)#18 | 46.1%(+32.5)#1,560 |
| 19. | Nimrod | 78.6% | 53.9%(+24.7)#19 | 46.1%(+32.5)#1,574 |
| 20. | Hanover | 78.5% | 53.9%(+24.6)#20 | 46.1%(+32.4)#1,581 |
| 21. | Cologne | 78.1% | 53.9%(+24.2)#21 | 46.1%(+32.0)#1,625 |
| 22. | Medicine Lake | 77.9% | 53.9%(+24.0)#22 | 46.1%(+31.8)#1,658 |
| 23. | Zumbro Falls | 77.5% | 53.9%(+23.6)#23 | 46.1%(+31.4)#1,711 |
| 24. | Shorewood | 77.4% | 53.9%(+23.5)#24 | 46.1%(+31.3)#1,715 |
| 25. | St Michael | 76.9% | 53.9%(+23.0)#25 | 46.1%(+30.8)#1,781 |
| 26. | Otsego | 76.6% | 53.9%(+22.7)#26 | 46.1%(+30.5)#1,820 |
| 27. | Oronoco | 76.4% | 53.9%(+22.5)#27 | 46.1%(+30.3)#1,864 |
| 28. | Edina | 75.4% | 53.9%(+21.5)#28 | 46.1%(+29.3)#1,998 |
| 29. | Tonka Bay | 75.4% | 53.9%(+21.5)#29 | 46.1%(+29.3)#2,008 |
| 30. | Rogers | 75.0% | 53.9%(+21.1)#30 | 46.1%(+28.9)#2,054 |
| 31. | Crown College | 75.0% | 53.9%(+21.1)#31 | 46.1%(+28.9)#2,062 |
| 32. | Nowthen | 74.9% | 53.9%(+21.0)#32 | 46.1%(+28.8)#2,094 |
| 33. | Wayzata | 74.9% | 53.9%(+21.0)#33 | 46.1%(+28.8)#2,095 |
| 34. | Gem Lake | 74.9% | 53.9%(+21.0)#34 | 46.1%(+28.8)#2,107 |
| 35. | Corcoran | 74.7% | 53.9%(+20.8)#35 | 46.1%(+28.6)#2,124 |
| 36. | Chanhassen | 74.5% | 53.9%(+20.6)#36 | 46.1%(+28.4)#2,150 |
| 37. | Martin Lake | 74.3% | 53.9%(+20.4)#37 | 46.1%(+28.2)#2,188 |
| 38. | Grant | 74.2% | 53.9%(+20.3)#38 | 46.1%(+28.1)#2,195 |
| 39. | Eden Prairie | 74.1% | 53.9%(+20.2)#39 | 46.1%(+28.0)#2,204 |
| 40. | Carver | 74.0% | 53.9%(+20.1)#40 | 46.1%(+27.9)#2,233 |
| 41. | Plymouth | 73.7% | 53.9%(+19.8)#41 | 46.1%(+27.6)#2,266 |
| 42. | Heidelberg | 73.5% | 53.9%(+19.6)#42 | 46.1%(+27.4)#2,296 |
| 43. | Mendota Heights | 72.8% | 53.9%(+18.9)#43 | 46.1%(+26.7)#2,400 |
| 44. | Lakeville | 72.6% | 53.9%(+18.7)#44 | 46.1%(+26.5)#2,440 |
| 45. | Maple Grove | 72.6% | 53.9%(+18.7)#45 | 46.1%(+26.5)#2,441 |
| 46. | Lakeland Shores | 72.5% | 53.9%(+18.6)#46 | 46.1%(+26.4)#2,473 |
| 47. | Mendota | 72.2% | 53.9%(+18.3)#47 | 46.1%(+26.1)#2,520 |
| 48. | Mahtomedi | 72.0% | 53.9%(+18.1)#48 | 46.1%(+25.9)#2,550 |
| 49. | Marine On St Croix | 71.8% | 53.9%(+17.9)#49 | 46.1%(+25.7)#2,592 |
| 50. | Hugo | 71.7% | 53.9%(+17.8)#50 | 46.1%(+25.6)#2,600 |
| 51. | Centerville | 71.7% | 53.9%(+17.8)#51 | 46.1%(+25.6)#2,604 |
| 52. | Afton | 71.7% | 53.9%(+17.8)#52 | 46.1%(+25.6)#2,606 |
| 53. | Rosemount | 71.6% | 53.9%(+17.7)#53 | 46.1%(+25.5)#2,615 |
| 54. | Woodbury | 71.4% | 53.9%(+17.5)#54 | 46.1%(+25.3)#2,651 |
| 55. | Independence | 71.4% | 53.9%(+17.5)#55 | 46.1%(+25.3)#2,662 |
| 56. | Denham | 71.4% | 53.9%(+17.5)#56 | 46.1%(+25.3)#2,671 |
| 57. | Minnetonka | 71.1% | 53.9%(+17.2)#57 | 46.1%(+25.0)#2,699 |
| 58. | Lino Lakes | 70.8% | 53.9%(+16.9)#58 | 46.1%(+24.7)#2,742 |
| 59. | Byron | 70.8% | 53.9%(+16.9)#59 | 46.1%(+24.7)#2,747 |
| 60. | Birchwood Village | 70.8% | 53.9%(+16.9)#60 | 46.1%(+24.7)#2,753 |
| 61. | Dayton | 70.3% | 53.9%(+16.4)#61 | 46.1%(+24.2)#2,834 |
| 62. | Savage | 69.9% | 53.9%(+16.0)#62 | 46.1%(+23.8)#2,896 |
| 63. | Prior Lake | 69.8% | 53.9%(+15.9)#63 | 46.1%(+23.7)#2,912 |
| 64. | Golden Valley | 69.7% | 53.9%(+15.8)#64 | 46.1%(+23.6)#2,933 |
| 65. | Shoreview | 69.4% | 53.9%(+15.5)#65 | 46.1%(+23.3)#2,973 |
| 66. | Marion | 69.3% | 53.9%(+15.4)#66 | 46.1%(+23.2)#3,004 |
| 67. | Farmington | 69.1% | 53.9%(+15.2)#67 | 46.1%(+23.0)#3,028 |
| 68. | Sabin | 69.1% | 53.9%(+15.2)#68 | 46.1%(+23.0)#3,038 |
| 69. | Cottage Grove | 68.9% | 53.9%(+15.0)#69 | 46.1%(+22.8)#3,056 |
| 70. | Andover | 68.4% | 53.9%(+14.5)#70 | 46.1%(+22.3)#3,162 |
| 71. | Dumont | 67.3% | 53.9%(+13.4)#71 | 46.1%(+21.2)#3,377 |
| 72. | Oak Grove | 67.0% | 53.9%(+13.1)#72 | 46.1%(+20.9)#3,409 |
| 73. | Johnson | 66.7% | 53.9%(+12.8)#73 | 46.1%(+20.6)#3,485 |
| 74. | St Anthony City Hennepin And Ramsey Counties | 66.6% | 53.9%(+12.7)#74 | 46.1%(+20.5)#3,502 |
| 75. | High Forest | 66.6% | 53.9%(+12.7)#75 | 46.1%(+20.5)#3,514 |
| 76. | Roy Lake | 66.6% | 53.9%(+12.7)#76 | 46.1%(+20.5)#3,517 |
| 77. | East Bethel | 66.5% | 53.9%(+12.6)#77 | 46.1%(+20.4)#3,532 |
| 78. | Mound | 66.3% | 53.9%(+12.4)#78 | 46.1%(+20.2)#3,559 |
| 79. | Skyline | 66.2% | 53.9%(+12.3)#79 | 46.1%(+20.1)#3,586 |
| 80. | Frontenac | 66.1% | 53.9%(+12.2)#80 | 46.1%(+20.0)#3,606 |
| 81. | Eagan | 66.0% | 53.9%(+12.1)#81 | 46.1%(+19.9)#3,607 |
| 82. | Argyle | 66.0% | 53.9%(+12.1)#82 | 46.1%(+19.9)#3,621 |
| 83. | St Bonifacius | 65.9% | 53.9%(+12.0)#83 | 46.1%(+19.8)#3,647 |
| 84. | Dundas | 65.9% | 53.9%(+12.0)#84 | 46.1%(+19.8)#3,648 |
| 85. | Elmdale | 65.9% | 53.9%(+12.0)#85 | 46.1%(+19.8)#3,653 |
| 86. | Mantorville | 65.8% | 53.9%(+11.9)#86 | 46.1%(+19.7)#3,670 |
| 87. | Loretto | 65.8% | 53.9%(+11.9)#87 | 46.1%(+19.7)#3,671 |
| 88. | Minneiska | 65.8% | 53.9%(+11.9)#88 | 46.1%(+19.7)#3,678 |
| 89. | Stillwater | 65.7% | 53.9%(+11.8)#89 | 46.1%(+19.6)#3,682 |
| 90. | Courtland | 65.7% | 53.9%(+11.8)#90 | 46.1%(+19.6)#3,696 |
| 91. | St Louis Park | 65.6% | 53.9%(+11.7)#91 | 46.1%(+19.5)#3,709 |
| 92. | Ham Lake | 65.4% | 53.9%(+11.5)#92 | 46.1%(+19.3)#3,748 |
| 93. | Falcon Heights | 65.3% | 53.9%(+11.4)#93 | 46.1%(+19.2)#3,776 |
| 94. | Bayport | 65.3% | 53.9%(+11.4)#94 | 46.1%(+19.2)#3,779 |
| 95. | St Augusta | 65.1% | 53.9%(+11.2)#95 | 46.1%(+19.0)#3,822 |
| 96. | Elysian | 64.8% | 53.9%(+10.9)#96 | 46.1%(+18.7)#3,888 |
| 97. | Arden Hills | 64.7% | 53.9%(+10.8)#97 | 46.1%(+18.6)#3,894 |
| 98. | Madison Lake | 64.2% | 53.9%(+10.3)#98 | 46.1%(+18.1)#4,017 |
| 99. | Pine Island | 64.1% | 53.9%(+10.2)#99 | 46.1%(+18.0)#4,028 |
| 100. | Oak Park Heights | 64.0% | 53.9%(+10.1)#100 | 46.1%(+17.9)#4,051 |
Common Questions
What are the Top 10 Cities with the Highest Percentage of Families with Income Above $100,000 in Minnesota?
Top 10 Cities with the Highest Percentage of Families with Income Above $100,000 in Minnesota are:
#1
100.0%
#2
92.1%
#3
90.3%
#4
89.1%
#5
89.1%
#6
85.0%
#7
83.0%
#8
82.8%
#9
82.8%
#10
82.4%
What city has the Highest Percentage of Families with Income Above $100,000 in Minnesota?
Boy River has the Highest Percentage of Families with Income Above $100,000 in Minnesota with 100.0%.
What is the Percentage of Families with Income Above $100,000 in the State of Minnesota?
Percentage of Families with Income Above $100,000 in Minnesota is 53.9%.
What is the Percentage of Families with Income Above $100,000 in the United States?
Percentage of Families with Income Above $100,000 in the United States is 46.1%.