Cities with the Highest Percentage of Families with Income Above $100,000 in West Virginia
RELATED REPORTS & OPTIONS
Family Income | $100k+
West Virginia
Compare Cities
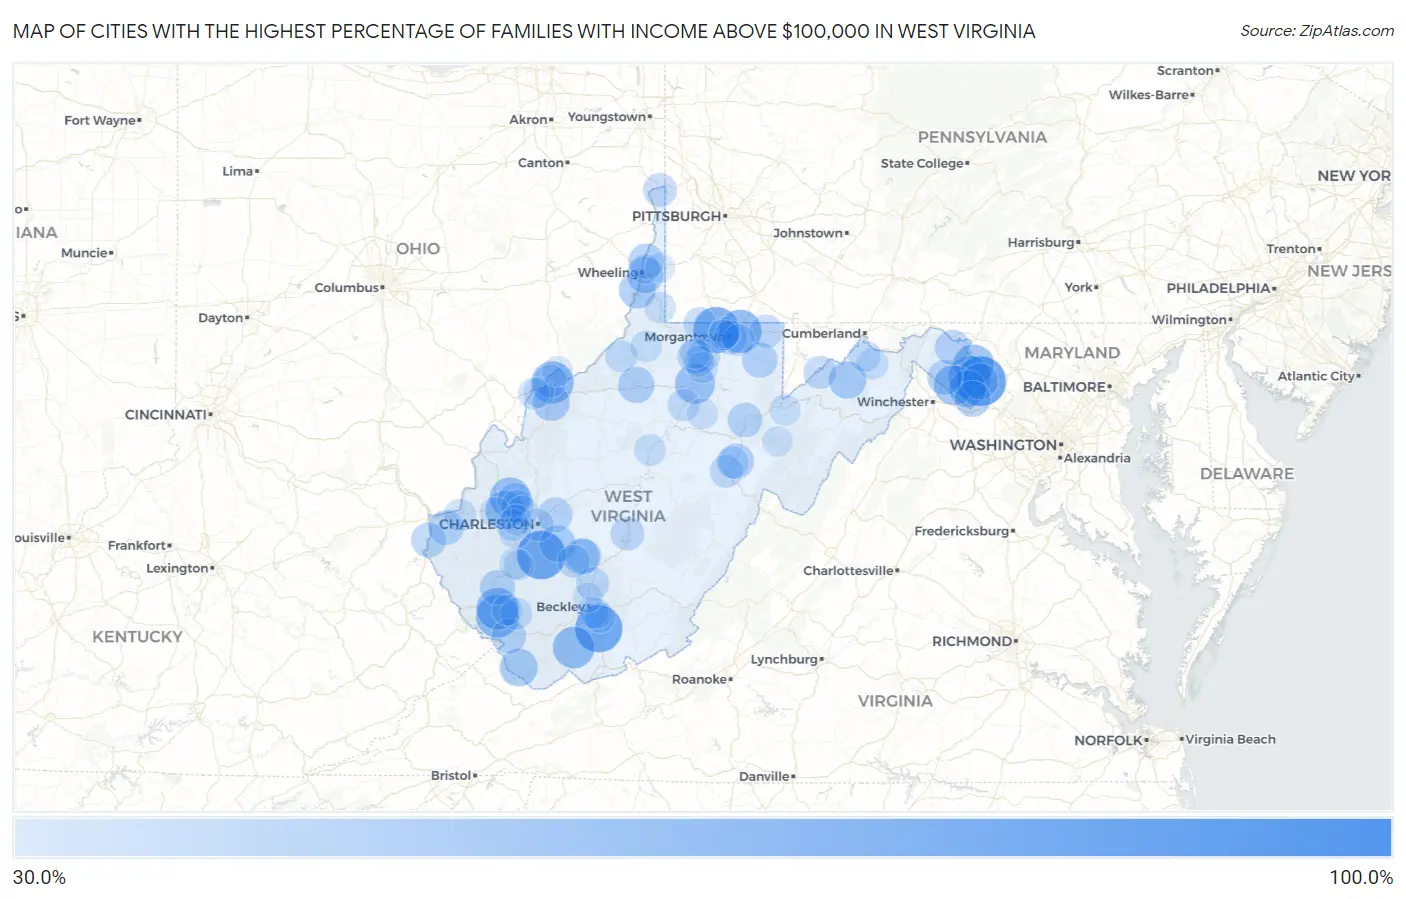
Map of Cities with the Highest Percentage of Families with Income Above $100,000 in West Virginia
0.0%
100.0%
Cities with the Highest Percentage of Families with Income Above $100,000 in West Virginia
| City | Families with Income > $100k | vs State | vs National | |
| 1. | Peach Creek | 100.0% | 32.8%(+67.2)#1 | 46.1%(+53.9)#239 |
| 2. | Harpers Ferry | 85.5% | 32.8%(+52.7)#2 | 46.1%(+39.4)#851 |
| 3. | Comfort | 83.3% | 32.8%(+50.5)#3 | 46.1%(+37.2)#1,043 |
| 4. | Ghent | 79.8% | 32.8%(+47.0)#4 | 46.1%(+33.7)#1,404 |
| 5. | Colcord | 77.3% | 32.8%(+44.5)#5 | 46.1%(+31.2)#1,743 |
| 6. | Cassville | 76.6% | 32.8%(+43.8)#6 | 46.1%(+30.5)#1,831 |
| 7. | Kanawha | 70.3% | 32.8%(+37.5)#7 | 46.1%(+24.2)#2,846 |
| 8. | Cheat Lake | 68.9% | 32.8%(+36.1)#8 | 46.1%(+22.8)#3,061 |
| 9. | Sarah Ann | 68.7% | 32.8%(+35.9)#9 | 46.1%(+22.6)#3,112 |
| 10. | Shenandoah Junction | 68.2% | 32.8%(+35.4)#10 | 46.1%(+22.1)#3,221 |
| 11. | North Hills | 67.0% | 32.8%(+34.2)#11 | 46.1%(+20.9)#3,414 |
| 12. | Greenville | 66.7% | 32.8%(+33.9)#12 | 46.1%(+20.6)#3,462 |
| 13. | Chauncey | 66.0% | 32.8%(+33.2)#13 | 46.1%(+19.9)#3,624 |
| 14. | Covel | 65.7% | 32.8%(+32.9)#14 | 46.1%(+19.6)#3,702 |
| 15. | Shepherdstown | 63.4% | 32.8%(+30.6)#15 | 46.1%(+17.3)#4,174 |
| 16. | Booth | 63.1% | 32.8%(+30.3)#16 | 46.1%(+17.0)#4,248 |
| 17. | Winfield | 62.3% | 32.8%(+29.5)#17 | 46.1%(+16.2)#4,428 |
| 18. | Bridgeport | 61.6% | 32.8%(+28.8)#18 | 46.1%(+15.5)#4,566 |
| 19. | Middleway | 60.8% | 32.8%(+28.0)#19 | 46.1%(+14.7)#4,774 |
| 20. | Teays Valley | 58.9% | 32.8%(+26.1)#20 | 46.1%(+12.8)#5,239 |
| 21. | Dupont | 57.2% | 32.8%(+24.4)#21 | 46.1%(+11.1)#5,666 |
| 22. | Bradshaw | 55.9% | 32.8%(+23.1)#22 | 46.1%(+9.80)#6,037 |
| 23. | Garten | 55.9% | 32.8%(+23.1)#23 | 46.1%(+9.80)#6,040 |
| 24. | Burlington | 54.7% | 32.8%(+21.9)#24 | 46.1%(+8.60)#6,371 |
| 25. | Charles Town | 54.3% | 32.8%(+21.5)#25 | 46.1%(+8.20)#6,487 |
| 26. | Glen Dale | 54.0% | 32.8%(+21.2)#26 | 46.1%(+7.90)#6,590 |
| 27. | Mineralwells | 53.7% | 32.8%(+20.9)#27 | 46.1%(+7.60)#6,680 |
| 28. | Bethlehem | 52.9% | 32.8%(+20.1)#28 | 46.1%(+6.80)#6,922 |
| 29. | Shrewsbury | 52.2% | 32.8%(+19.4)#29 | 46.1%(+6.10)#7,143 |
| 30. | West Union | 52.1% | 32.8%(+19.3)#30 | 46.1%(+6.00)#7,171 |
| 31. | Bolivar | 51.9% | 32.8%(+19.1)#31 | 46.1%(+5.80)#7,230 |
| 32. | Shannondale | 51.8% | 32.8%(+19.0)#32 | 46.1%(+5.70)#7,247 |
| 33. | Falls View | 51.5% | 32.8%(+18.7)#33 | 46.1%(+5.40)#7,336 |
| 34. | Clearview | 50.1% | 32.8%(+17.3)#34 | 46.1%(+4.00)#7,767 |
| 35. | Kingwood | 49.8% | 32.8%(+17.0)#35 | 46.1%(+3.70)#7,968 |
| 36. | Inwood | 49.5% | 32.8%(+16.7)#36 | 46.1%(+3.40)#8,050 |
| 37. | East Dailey | 49.5% | 32.8%(+16.7)#37 | 46.1%(+3.40)#8,059 |
| 38. | Mitchell Heights | 49.2% | 32.8%(+16.4)#38 | 46.1%(+3.10)#8,147 |
| 39. | Idamay | 49.0% | 32.8%(+16.2)#39 | 46.1%(+2.90)#8,206 |
| 40. | Hedgesville | 49.0% | 32.8%(+16.2)#40 | 46.1%(+2.90)#8,210 |
| 41. | Pinch | 48.9% | 32.8%(+16.1)#41 | 46.1%(+2.80)#8,225 |
| 42. | Gilbert Creek | 48.6% | 32.8%(+15.8)#42 | 46.1%(+2.50)#8,323 |
| 43. | Lavalette | 48.5% | 32.8%(+15.7)#43 | 46.1%(+2.40)#8,356 |
| 44. | Prichard | 48.5% | 32.8%(+15.7)#44 | 46.1%(+2.40)#8,363 |
| 45. | Bancroft | 48.2% | 32.8%(+15.4)#45 | 46.1%(+2.10)#8,461 |
| 46. | Charlton Heights | 48.2% | 32.8%(+15.4)#46 | 46.1%(+2.10)#8,463 |
| 47. | Montrose | 48.0% | 32.8%(+15.2)#47 | 46.1%(+1.90)#8,530 |
| 48. | Morgantown | 46.3% | 32.8%(+13.5)#48 | 46.1%(+0.200)#9,130 |
| 49. | Ranson Corporation | 46.2% | 32.8%(+13.4)#49 | 46.1%(+0.100)#9,179 |
| 50. | Chester | 45.5% | 32.8%(+12.7)#50 | 46.1%(-0.600)#9,475 |
| 51. | Summersville | 45.3% | 32.8%(+12.5)#51 | 46.1%(-0.800)#9,549 |
| 52. | Brandonville | 45.3% | 32.8%(+12.5)#52 | 46.1%(-0.800)#9,570 |
| 53. | Barrackville | 44.6% | 32.8%(+11.8)#53 | 46.1%(-1.50)#9,848 |
| 54. | Elk Garden | 44.5% | 32.8%(+11.7)#54 | 46.1%(-1.60)#9,887 |
| 55. | Hilltop | 44.0% | 32.8%(+11.2)#55 | 46.1%(-2.10)#10,078 |
| 56. | Clifton | 43.9% | 32.8%(+11.1)#56 | 46.1%(-2.20)#10,136 |
| 57. | Blacksville | 43.8% | 32.8%(+11.0)#57 | 46.1%(-2.30)#10,180 |
| 58. | Vienna | 43.7% | 32.8%(+10.9)#58 | 46.1%(-2.40)#10,191 |
| 59. | Huttonsville | 43.4% | 32.8%(+10.6)#59 | 46.1%(-2.70)#10,337 |
| 60. | Poca | 43.3% | 32.8%(+10.5)#60 | 46.1%(-2.80)#10,367 |
| 61. | Powellton | 42.9% | 32.8%(+10.1)#61 | 46.1%(-3.20)#10,530 |
| 62. | Norton | 42.9% | 32.8%(+10.1)#62 | 46.1%(-3.20)#10,540 |
| 63. | Charleston | 42.8% | 32.8%(+10.0)#63 | 46.1%(-3.30)#10,557 |
| 64. | Valley Bend | 42.5% | 32.8%(+9.70)#64 | 46.1%(-3.60)#10,706 |
| 65. | Lost Creek | 42.2% | 32.8%(+9.40)#65 | 46.1%(-3.90)#10,820 |
| 66. | Pea Ridge | 42.0% | 32.8%(+9.20)#66 | 46.1%(-4.10)#10,878 |
| 67. | Alum Creek | 42.0% | 32.8%(+9.20)#67 | 46.1%(-4.10)#10,887 |
| 68. | Mallory | 41.9% | 32.8%(+9.10)#68 | 46.1%(-4.20)#10,918 |
| 69. | Middlebourne | 41.8% | 32.8%(+9.00)#69 | 46.1%(-4.30)#10,972 |
| 70. | Tornado | 41.4% | 32.8%(+8.60)#70 | 46.1%(-4.70)#11,142 |
| 71. | Beaver | 41.1% | 32.8%(+8.30)#71 | 46.1%(-5.00)#11,302 |
| 72. | Burnsville | 41.0% | 32.8%(+8.20)#72 | 46.1%(-5.10)#11,369 |
| 73. | Brookhaven | 40.8% | 32.8%(+8.00)#73 | 46.1%(-5.30)#11,444 |
| 74. | Springfield | 40.8% | 32.8%(+8.00)#74 | 46.1%(-5.30)#11,475 |
| 75. | Danville | 40.7% | 32.8%(+7.90)#75 | 46.1%(-5.40)#11,520 |
| 76. | Fort Ashby | 40.6% | 32.8%(+7.80)#76 | 46.1%(-5.50)#11,562 |
| 77. | Pine Grove | 40.6% | 32.8%(+7.80)#77 | 46.1%(-5.50)#11,573 |
| 78. | Washington | 40.4% | 32.8%(+7.60)#78 | 46.1%(-5.70)#11,670 |
| 79. | Davis | 40.3% | 32.8%(+7.50)#79 | 46.1%(-5.80)#11,716 |
| 80. | Cameron | 40.0% | 32.8%(+7.20)#80 | 46.1%(-6.10)#11,841 |
| 81. | Cross Lanes | 39.8% | 32.8%(+7.00)#81 | 46.1%(-6.30)#11,952 |
| 82. | White Hall | 39.7% | 32.8%(+6.90)#82 | 46.1%(-6.40)#12,008 |
| 83. | Star City | 39.5% | 32.8%(+6.70)#83 | 46.1%(-6.60)#12,098 |
| 84. | St Albans | 39.2% | 32.8%(+6.40)#84 | 46.1%(-6.90)#12,219 |
| 85. | Monongah | 39.2% | 32.8%(+6.40)#85 | 46.1%(-6.90)#12,236 |
| 86. | Hurricane | 38.7% | 32.8%(+5.90)#86 | 46.1%(-7.40)#12,470 |
| 87. | Century | 38.7% | 32.8%(+5.90)#87 | 46.1%(-7.40)#12,511 |
| 88. | Blennerhassett | 38.5% | 32.8%(+5.70)#88 | 46.1%(-7.60)#12,568 |
| 89. | Madison | 38.5% | 32.8%(+5.70)#89 | 46.1%(-7.60)#12,571 |
| 90. | Man | 38.5% | 32.8%(+5.70)#90 | 46.1%(-7.60)#12,578 |
| 91. | Daniels | 38.4% | 32.8%(+5.60)#91 | 46.1%(-7.70)#12,634 |
| 92. | Shady Spring | 38.3% | 32.8%(+5.50)#92 | 46.1%(-7.80)#12,668 |
| 93. | Westover | 38.1% | 32.8%(+5.30)#93 | 46.1%(-8.00)#12,775 |
| 94. | Williamstown | 37.7% | 32.8%(+4.90)#94 | 46.1%(-8.40)#12,979 |
| 95. | Harman | 37.5% | 32.8%(+4.70)#95 | 46.1%(-8.60)#13,125 |
| 96. | Wheeling | 37.2% | 32.8%(+4.40)#96 | 46.1%(-8.90)#13,243 |
| 97. | Valley Grove | 37.2% | 32.8%(+4.40)#97 | 46.1%(-8.90)#13,272 |
| 98. | Farmington | 37.1% | 32.8%(+4.30)#98 | 46.1%(-9.00)#13,325 |
| 99. | Reynoldsville | 37.1% | 32.8%(+4.30)#99 | 46.1%(-9.00)#13,329 |
| 100. | Prosperity | 36.9% | 32.8%(+4.10)#100 | 46.1%(-9.20)#13,414 |
Common Questions
What are the Top 10 Cities with the Highest Percentage of Families with Income Above $100,000 in West Virginia?
Top 10 Cities with the Highest Percentage of Families with Income Above $100,000 in West Virginia are:
#1
85.5%
#2
83.3%
#3
79.8%
#4
76.6%
#5
68.9%
#6
68.7%
#7
68.2%
#8
67.0%
#9
66.0%
#10
65.7%
What city has the Highest Percentage of Families with Income Above $100,000 in West Virginia?
Harpers Ferry has the Highest Percentage of Families with Income Above $100,000 in West Virginia with 85.5%.
What is the Percentage of Families with Income Above $100,000 in the State of West Virginia?
Percentage of Families with Income Above $100,000 in West Virginia is 32.8%.
What is the Percentage of Families with Income Above $100,000 in the United States?
Percentage of Families with Income Above $100,000 in the United States is 46.1%.