Cities with the Highest Percentage of Families with Income Above $100,000 in Kansas
RELATED REPORTS & OPTIONS
Family Income | $100k+
Kansas
Compare Cities
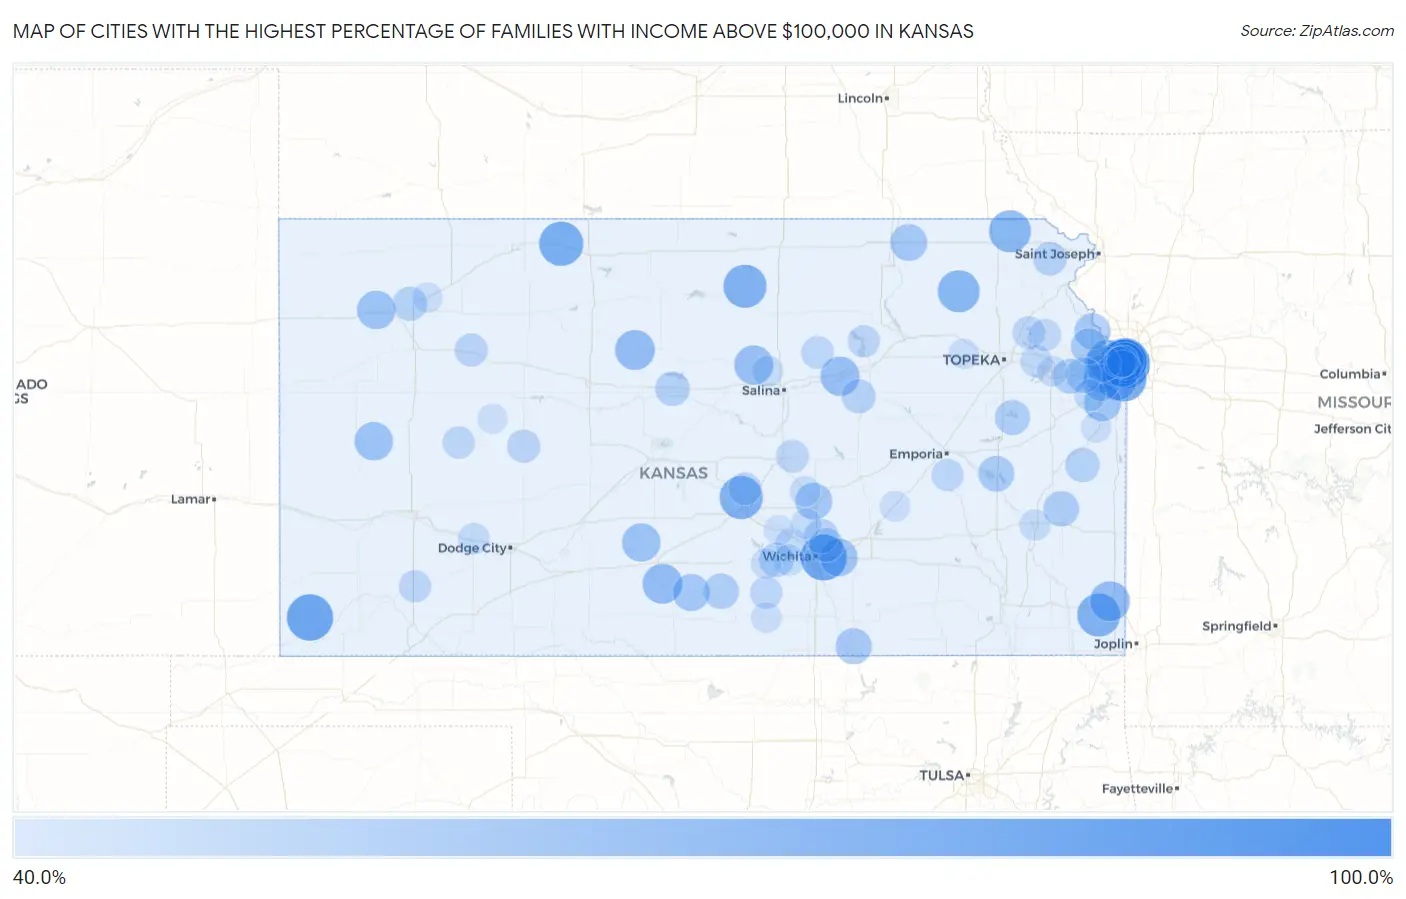
Map of Cities with the Highest Percentage of Families with Income Above $100,000 in Kansas
0.0%
100.0%
Cities with the Highest Percentage of Families with Income Above $100,000 in Kansas
| City | Families with Income > $100k | vs State | vs National | |
| 1. | Elyria | 100.0% | 43.8%(+56.2)#1 | 46.1%(+53.9)#57 |
| 2. | Peck | 100.0% | 43.8%(+56.2)#2 | 46.1%(+53.9)#210 |
| 3. | Hallowell | 100.0% | 43.8%(+56.2)#3 | 46.1%(+53.9)#252 |
| 4. | Furley | 100.0% | 43.8%(+56.2)#4 | 46.1%(+53.9)#265 |
| 5. | Devon | 100.0% | 43.8%(+56.2)#5 | 46.1%(+53.9)#275 |
| 6. | Newbury | 100.0% | 43.8%(+56.2)#6 | 46.1%(+53.9)#290 |
| 7. | Beaumont | 100.0% | 43.8%(+56.2)#7 | 46.1%(+53.9)#292 |
| 8. | Idana | 100.0% | 43.8%(+56.2)#8 | 46.1%(+53.9)#316 |
| 9. | St. Benedict | 100.0% | 43.8%(+56.2)#9 | 46.1%(+53.9)#320 |
| 10. | South Mound | 100.0% | 43.8%(+56.2)#10 | 46.1%(+53.9)#331 |
| 11. | Mont Ida | 100.0% | 43.8%(+56.2)#11 | 46.1%(+53.9)#334 |
| 12. | Big Bow | 100.0% | 43.8%(+56.2)#12 | 46.1%(+53.9)#365 |
| 13. | Woodruff | 100.0% | 43.8%(+56.2)#13 | 46.1%(+53.9)#417 |
| 14. | Mission Hills | 93.3% | 43.8%(+49.5)#14 | 46.1%(+47.2)#487 |
| 15. | Sycamore | 88.4% | 43.8%(+44.6)#15 | 46.1%(+42.3)#671 |
| 16. | Mission Woods | 85.7% | 43.8%(+41.9)#16 | 46.1%(+39.6)#839 |
| 17. | Richfield | 85.7% | 43.8%(+41.9)#17 | 46.1%(+39.6)#844 |
| 18. | Fairway | 85.2% | 43.8%(+41.4)#18 | 46.1%(+39.1)#877 |
| 19. | Eastborough | 85.0% | 43.8%(+41.2)#19 | 46.1%(+38.9)#898 |
| 20. | Leawood | 83.7% | 43.8%(+39.9)#20 | 46.1%(+37.6)#996 |
| 21. | Prairie View | 80.5% | 43.8%(+36.7)#21 | 46.1%(+34.4)#1,335 |
| 22. | Westwood Hills | 79.4% | 43.8%(+35.6)#22 | 46.1%(+33.3)#1,455 |
| 23. | Willowbrook | 78.2% | 43.8%(+34.4)#23 | 46.1%(+32.1)#1,616 |
| 24. | Roseland | 77.8% | 43.8%(+34.0)#24 | 46.1%(+31.7)#1,678 |
| 25. | Scottsville | 77.8% | 43.8%(+34.0)#25 | 46.1%(+31.7)#1,680 |
| 26. | Havensville | 75.0% | 43.8%(+31.2)#26 | 46.1%(+28.9)#2,067 |
| 27. | Hamlin | 75.0% | 43.8%(+31.2)#27 | 46.1%(+28.9)#2,087 |
| 28. | Chicopee | 70.4% | 43.8%(+26.6)#28 | 46.1%(+24.3)#2,827 |
| 29. | Sawyer | 70.0% | 43.8%(+26.2)#29 | 46.1%(+23.9)#2,893 |
| 30. | Paradise | 70.0% | 43.8%(+26.2)#30 | 46.1%(+23.9)#2,895 |
| 31. | Lake Quivira | 69.4% | 43.8%(+25.6)#31 | 46.1%(+23.3)#2,985 |
| 32. | Tescott | 68.4% | 43.8%(+24.6)#32 | 46.1%(+22.3)#3,180 |
| 33. | Detroit | 68.4% | 43.8%(+24.6)#33 | 46.1%(+22.3)#3,184 |
| 34. | Levant | 66.7% | 43.8%(+22.9)#34 | 46.1%(+20.6)#3,468 |
| 35. | Marienthal | 66.7% | 43.8%(+22.9)#35 | 46.1%(+20.6)#3,481 |
| 36. | Byers | 66.7% | 43.8%(+22.9)#36 | 46.1%(+20.6)#3,492 |
| 37. | Overland Park | 65.9% | 43.8%(+22.1)#37 | 46.1%(+19.8)#3,630 |
| 38. | Croweburg | 65.6% | 43.8%(+21.8)#38 | 46.1%(+19.5)#3,728 |
| 39. | Andover | 65.3% | 43.8%(+21.5)#39 | 46.1%(+19.2)#3,767 |
| 40. | Westwood | 65.3% | 43.8%(+21.5)#40 | 46.1%(+19.2)#3,787 |
| 41. | Lenexa | 64.6% | 43.8%(+20.8)#41 | 46.1%(+18.5)#3,912 |
| 42. | Spring Hill | 64.0% | 43.8%(+20.2)#42 | 46.1%(+17.9)#4,048 |
| 43. | Nashville | 63.7% | 43.8%(+19.9)#43 | 46.1%(+17.6)#4,116 |
| 44. | North Newton | 63.4% | 43.8%(+19.6)#44 | 46.1%(+17.3)#4,173 |
| 45. | Home | 63.2% | 43.8%(+19.4)#45 | 46.1%(+17.1)#4,232 |
| 46. | Olathe | 62.8% | 43.8%(+19.0)#46 | 46.1%(+16.7)#4,301 |
| 47. | Prairie Village | 62.8% | 43.8%(+19.0)#47 | 46.1%(+16.7)#4,304 |
| 48. | Shawnee | 62.7% | 43.8%(+18.9)#48 | 46.1%(+16.6)#4,320 |
| 49. | Lansing | 61.2% | 43.8%(+17.4)#49 | 46.1%(+15.1)#4,678 |
| 50. | Parkerfield | 61.2% | 43.8%(+17.4)#50 | 46.1%(+15.1)#4,691 |
| 51. | Piedmont | 61.1% | 43.8%(+17.3)#51 | 46.1%(+15.0)#4,717 |
| 52. | New Strawn | 60.8% | 43.8%(+17.0)#52 | 46.1%(+14.7)#4,775 |
| 53. | Basehor | 60.4% | 43.8%(+16.6)#53 | 46.1%(+14.3)#4,857 |
| 54. | Spivey | 60.0% | 43.8%(+16.2)#54 | 46.1%(+13.9)#4,968 |
| 55. | Mildred | 60.0% | 43.8%(+16.2)#55 | 46.1%(+13.9)#4,995 |
| 56. | De Soto | 59.7% | 43.8%(+15.9)#56 | 46.1%(+13.6)#5,054 |
| 57. | Bremen | 59.3% | 43.8%(+15.5)#57 | 46.1%(+13.2)#5,162 |
| 58. | Vassar | 59.2% | 43.8%(+15.4)#58 | 46.1%(+13.1)#5,180 |
| 59. | Eudora | 58.4% | 43.8%(+14.6)#59 | 46.1%(+12.3)#5,372 |
| 60. | Garden Plain | 57.5% | 43.8%(+13.7)#60 | 46.1%(+11.4)#5,599 |
| 61. | Parker | 57.5% | 43.8%(+13.7)#61 | 46.1%(+11.4)#5,602 |
| 62. | Dorrance | 57.5% | 43.8%(+13.7)#62 | 46.1%(+11.4)#5,603 |
| 63. | Gem | 57.1% | 43.8%(+13.3)#63 | 46.1%(+11.0)#5,704 |
| 64. | Kechi | 57.0% | 43.8%(+13.2)#64 | 46.1%(+10.9)#5,731 |
| 65. | Woodbine | 56.7% | 43.8%(+12.9)#65 | 46.1%(+10.6)#5,814 |
| 66. | Bel Aire | 56.0% | 43.8%(+12.2)#66 | 46.1%(+9.90)#5,984 |
| 67. | Denton | 55.9% | 43.8%(+12.1)#67 | 46.1%(+9.80)#6,039 |
| 68. | Ness City | 54.6% | 43.8%(+10.8)#68 | 46.1%(+8.50)#6,388 |
| 69. | Park | 54.2% | 43.8%(+10.4)#69 | 46.1%(+8.10)#6,543 |
| 70. | Galva | 53.9% | 43.8%(+10.1)#70 | 46.1%(+7.80)#6,626 |
| 71. | Manchester | 53.8% | 43.8%(+10.00)#71 | 46.1%(+7.70)#6,661 |
| 72. | The Highlands | 53.7% | 43.8%(+9.90)#72 | 46.1%(+7.60)#6,690 |
| 73. | Milton | 53.1% | 43.8%(+9.30)#73 | 46.1%(+7.00)#6,874 |
| 74. | Ozawkie | 53.0% | 43.8%(+9.20)#74 | 46.1%(+6.90)#6,897 |
| 75. | Sublette | 52.7% | 43.8%(+8.90)#75 | 46.1%(+6.60)#6,991 |
| 76. | Dighton | 52.7% | 43.8%(+8.90)#76 | 46.1%(+6.60)#6,998 |
| 77. | Olpe | 52.5% | 43.8%(+8.70)#77 | 46.1%(+6.40)#7,044 |
| 78. | Milford | 52.5% | 43.8%(+8.70)#78 | 46.1%(+6.40)#7,048 |
| 79. | Lecompton | 52.1% | 43.8%(+8.30)#79 | 46.1%(+6.00)#7,169 |
| 80. | Oskaloosa | 51.8% | 43.8%(+8.00)#80 | 46.1%(+5.70)#7,253 |
| 81. | Gardner | 51.0% | 43.8%(+7.20)#81 | 46.1%(+4.90)#7,478 |
| 82. | Cimarron | 51.0% | 43.8%(+7.20)#82 | 46.1%(+4.90)#7,493 |
| 83. | Colwich | 50.9% | 43.8%(+7.10)#83 | 46.1%(+4.80)#7,522 |
| 84. | Mission | 50.6% | 43.8%(+6.80)#84 | 46.1%(+4.50)#7,597 |
| 85. | Roeland Park | 50.6% | 43.8%(+6.80)#85 | 46.1%(+4.50)#7,601 |
| 86. | Goddard | 50.2% | 43.8%(+6.40)#86 | 46.1%(+4.10)#7,729 |
| 87. | Radley | 50.0% | 43.8%(+6.20)#87 | 46.1%(+3.90)#7,843 |
| 88. | Culver | 50.0% | 43.8%(+6.20)#88 | 46.1%(+3.90)#7,869 |
| 89. | Bassett | 50.0% | 43.8%(+6.20)#89 | 46.1%(+3.90)#7,918 |
| 90. | Lawrence | 49.1% | 43.8%(+5.30)#90 | 46.1%(+3.00)#8,152 |
| 91. | Hesston | 49.1% | 43.8%(+5.30)#91 | 46.1%(+3.00)#8,162 |
| 92. | Sedgwick | 49.1% | 43.8%(+5.30)#92 | 46.1%(+3.00)#8,168 |
| 93. | Cassoday | 48.9% | 43.8%(+5.10)#93 | 46.1%(+2.80)#8,236 |
| 94. | Paola | 48.7% | 43.8%(+4.90)#94 | 46.1%(+2.60)#8,282 |
| 95. | Argonia | 48.7% | 43.8%(+4.90)#95 | 46.1%(+2.60)#8,293 |
| 96. | Cheney | 48.5% | 43.8%(+4.70)#96 | 46.1%(+2.40)#8,350 |
| 97. | Maple Hill | 48.3% | 43.8%(+4.50)#97 | 46.1%(+2.20)#8,434 |
| 98. | Rexford | 48.2% | 43.8%(+4.40)#98 | 46.1%(+2.10)#8,468 |
| 99. | Mount Hope | 47.8% | 43.8%(+4.00)#99 | 46.1%(+1.70)#8,589 |
| 100. | Utica | 47.6% | 43.8%(+3.80)#100 | 46.1%(+1.50)#8,675 |
Common Questions
What are the Top 10 Cities with the Highest Percentage of Families with Income Above $100,000 in Kansas?
Top 10 Cities with the Highest Percentage of Families with Income Above $100,000 in Kansas are:
#1
93.3%
#2
85.7%
#3
85.7%
#4
85.2%
#5
85.0%
#6
83.7%
#7
80.5%
#8
79.4%
#9
78.2%
#10
77.8%
What city has the Highest Percentage of Families with Income Above $100,000 in Kansas?
Mission Hills has the Highest Percentage of Families with Income Above $100,000 in Kansas with 93.3%.
What is the Percentage of Families with Income Above $100,000 in the State of Kansas?
Percentage of Families with Income Above $100,000 in Kansas is 43.8%.
What is the Percentage of Families with Income Above $100,000 in the United States?
Percentage of Families with Income Above $100,000 in the United States is 46.1%.