Cities with the Highest Percentage of Families with Income Above $100,000 in Illinois
RELATED REPORTS & OPTIONS
Family Income | $100k+
Illinois
Compare Cities
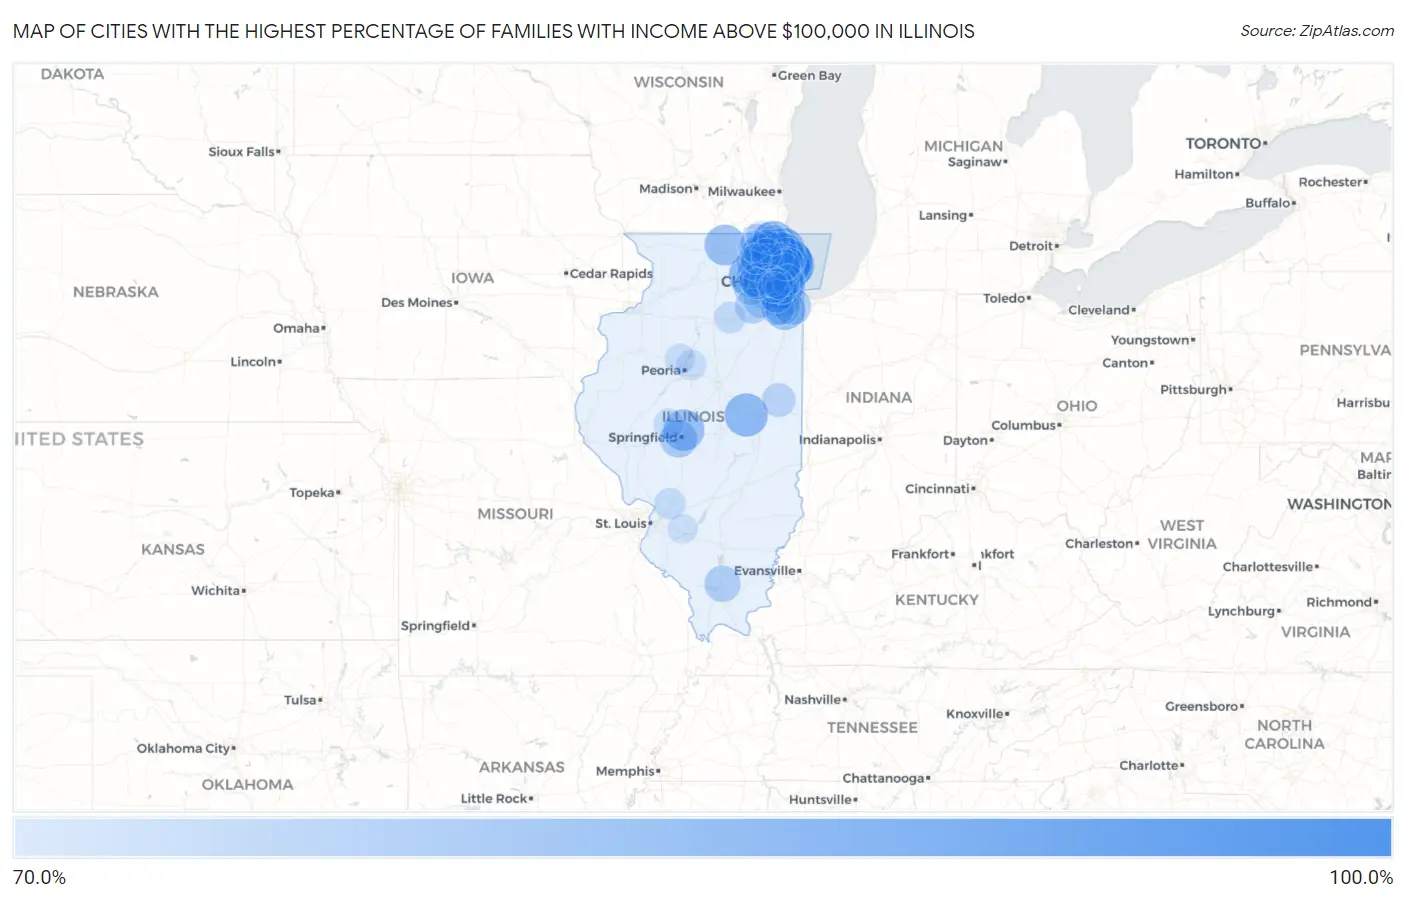
Map of Cities with the Highest Percentage of Families with Income Above $100,000 in Illinois
0.0%
100.0%
Cities with the Highest Percentage of Families with Income Above $100,000 in Illinois
| City | Families with Income > $100k | vs State | vs National | |
| 1. | Trilla | 100.0% | 49.7%(+50.3)#1 | 46.1%(+53.9)#133 |
| 2. | Bloomfield | 100.0% | 49.7%(+50.3)#2 | 46.1%(+53.9)#172 |
| 3. | Triumph | 100.0% | 49.7%(+50.3)#3 | 46.1%(+53.9)#202 |
| 4. | Unity | 100.0% | 49.7%(+50.3)#4 | 46.1%(+53.9)#258 |
| 5. | Marley | 100.0% | 49.7%(+50.3)#5 | 46.1%(+53.9)#315 |
| 6. | Lynn Center | 100.0% | 49.7%(+50.3)#6 | 46.1%(+53.9)#345 |
| 7. | Golf | 91.3% | 49.7%(+41.6)#7 | 46.1%(+45.2)#533 |
| 8. | Custer Park | 90.4% | 49.7%(+40.7)#8 | 46.1%(+44.3)#567 |
| 9. | Kildeer | 88.1% | 49.7%(+38.4)#9 | 46.1%(+42.0)#689 |
| 10. | Lincolnshire | 87.8% | 49.7%(+38.1)#10 | 46.1%(+41.7)#702 |
| 11. | Kenilworth | 87.6% | 49.7%(+37.9)#11 | 46.1%(+41.5)#710 |
| 12. | Glencoe | 87.4% | 49.7%(+37.7)#12 | 46.1%(+41.3)#721 |
| 13. | Long Grove | 87.2% | 49.7%(+37.5)#13 | 46.1%(+41.1)#730 |
| 14. | Winnetka | 87.1% | 49.7%(+37.4)#14 | 46.1%(+41.0)#737 |
| 15. | Plum Valley | 87.1% | 49.7%(+37.4)#15 | 46.1%(+41.0)#742 |
| 16. | Wayne | 86.7% | 49.7%(+37.0)#16 | 46.1%(+40.6)#766 |
| 17. | Deer Park | 86.3% | 49.7%(+36.6)#17 | 46.1%(+40.2)#790 |
| 18. | Campton Hills | 86.1% | 49.7%(+36.4)#18 | 46.1%(+40.0)#810 |
| 19. | North Barrington | 85.8% | 49.7%(+36.1)#19 | 46.1%(+39.7)#828 |
| 20. | East Lynn | 85.3% | 49.7%(+35.6)#20 | 46.1%(+39.2)#873 |
| 21. | Western Springs | 85.0% | 49.7%(+35.3)#21 | 46.1%(+38.9)#890 |
| 22. | White Heath | 84.8% | 49.7%(+35.1)#22 | 46.1%(+38.7)#914 |
| 23. | Third Lake | 84.7% | 49.7%(+35.0)#23 | 46.1%(+38.6)#923 |
| 24. | Hinsdale | 84.5% | 49.7%(+34.8)#24 | 46.1%(+38.4)#936 |
| 25. | Deerfield | 84.0% | 49.7%(+34.3)#25 | 46.1%(+37.9)#967 |
| 26. | Riverwoods | 83.8% | 49.7%(+34.1)#26 | 46.1%(+37.7)#988 |
| 27. | Mettawa | 83.6% | 49.7%(+33.9)#27 | 46.1%(+37.5)#1,007 |
| 28. | Inverness | 83.5% | 49.7%(+33.8)#28 | 46.1%(+37.4)#1,013 |
| 29. | Indian Creek | 83.4% | 49.7%(+33.7)#29 | 46.1%(+37.3)#1,028 |
| 30. | Lake Bluff | 83.3% | 49.7%(+33.6)#30 | 46.1%(+37.2)#1,035 |
| 31. | Libertyville | 83.1% | 49.7%(+33.4)#31 | 46.1%(+37.0)#1,059 |
| 32. | Hawthorn Woods | 82.8% | 49.7%(+33.1)#32 | 46.1%(+36.7)#1,084 |
| 33. | Sherman | 82.7% | 49.7%(+33.0)#33 | 46.1%(+36.6)#1,096 |
| 34. | Timberlane | 82.2% | 49.7%(+32.5)#34 | 46.1%(+36.1)#1,144 |
| 35. | Wilmette | 81.8% | 49.7%(+32.1)#35 | 46.1%(+35.7)#1,190 |
| 36. | Trout Valley | 81.8% | 49.7%(+32.1)#36 | 46.1%(+35.7)#1,195 |
| 37. | South Barrington | 81.7% | 49.7%(+32.0)#37 | 46.1%(+35.6)#1,204 |
| 38. | Palos Park | 81.7% | 49.7%(+32.0)#38 | 46.1%(+35.6)#1,205 |
| 39. | River Forest | 81.6% | 49.7%(+31.9)#39 | 46.1%(+35.5)#1,214 |
| 40. | Frankfort | 81.4% | 49.7%(+31.7)#40 | 46.1%(+35.3)#1,233 |
| 41. | Lake Forest | 81.3% | 49.7%(+31.6)#41 | 46.1%(+35.2)#1,250 |
| 42. | Riverside | 81.3% | 49.7%(+31.6)#42 | 46.1%(+35.2)#1,253 |
| 43. | Highland Park | 81.1% | 49.7%(+31.4)#43 | 46.1%(+35.0)#1,277 |
| 44. | Westlake | 80.4% | 49.7%(+30.7)#44 | 46.1%(+34.3)#1,346 |
| 45. | Solon Mills | 79.7% | 49.7%(+30.0)#45 | 46.1%(+33.6)#1,416 |
| 46. | Burr Ridge | 79.3% | 49.7%(+29.6)#46 | 46.1%(+33.2)#1,462 |
| 47. | Smithville | 79.2% | 49.7%(+29.5)#47 | 46.1%(+33.1)#1,487 |
| 48. | Northbrook | 79.1% | 49.7%(+29.4)#48 | 46.1%(+33.0)#1,491 |
| 49. | Leland Grove | 78.8% | 49.7%(+29.1)#49 | 46.1%(+32.7)#1,539 |
| 50. | Flossmoor | 78.6% | 49.7%(+28.9)#50 | 46.1%(+32.5)#1,559 |
| 51. | Barrington Hills | 78.4% | 49.7%(+28.7)#51 | 46.1%(+32.3)#1,589 |
| 52. | Whiteash | 77.5% | 49.7%(+27.8)#52 | 46.1%(+31.4)#1,710 |
| 53. | Naperville | 77.3% | 49.7%(+27.6)#53 | 46.1%(+31.2)#1,728 |
| 54. | Lake Barrington | 77.3% | 49.7%(+27.6)#54 | 46.1%(+31.2)#1,732 |
| 55. | Port Barrington | 76.8% | 49.7%(+27.1)#55 | 46.1%(+30.7)#1,801 |
| 56. | Plainfield | 76.6% | 49.7%(+26.9)#56 | 46.1%(+30.5)#1,819 |
| 57. | Lake Zurich | 76.6% | 49.7%(+26.9)#57 | 46.1%(+30.5)#1,821 |
| 58. | Prestbury | 76.4% | 49.7%(+26.7)#58 | 46.1%(+30.3)#1,863 |
| 59. | Burton | 76.2% | 49.7%(+26.5)#59 | 46.1%(+30.1)#1,895 |
| 60. | Sleepy Hollow | 76.1% | 49.7%(+26.4)#60 | 46.1%(+30.0)#1,911 |
| 61. | Plattville | 76.0% | 49.7%(+26.3)#61 | 46.1%(+29.9)#1,930 |
| 62. | Mokena | 75.9% | 49.7%(+26.2)#62 | 46.1%(+29.8)#1,932 |
| 63. | Gilberts | 75.9% | 49.7%(+26.2)#63 | 46.1%(+29.8)#1,935 |
| 64. | Ringwood | 75.7% | 49.7%(+26.0)#64 | 46.1%(+29.6)#1,965 |
| 65. | Elmhurst | 75.4% | 49.7%(+25.7)#65 | 46.1%(+29.3)#1,999 |
| 66. | Prairie Grove | 75.0% | 49.7%(+25.3)#66 | 46.1%(+28.9)#2,056 |
| 67. | Dundas | 75.0% | 49.7%(+25.3)#67 | 46.1%(+28.9)#2,065 |
| 68. | Penfield | 75.0% | 49.7%(+25.3)#68 | 46.1%(+28.9)#2,066 |
| 69. | La Grange | 74.9% | 49.7%(+25.2)#69 | 46.1%(+28.8)#2,091 |
| 70. | Winfield | 74.7% | 49.7%(+25.0)#70 | 46.1%(+28.6)#2,122 |
| 71. | Lake Villa | 74.7% | 49.7%(+25.0)#71 | 46.1%(+28.6)#2,123 |
| 72. | New Lenox | 74.6% | 49.7%(+24.9)#72 | 46.1%(+28.5)#2,135 |
| 73. | Green Oaks | 74.6% | 49.7%(+24.9)#73 | 46.1%(+28.5)#2,142 |
| 74. | Geneva | 74.5% | 49.7%(+24.8)#74 | 46.1%(+28.4)#2,151 |
| 75. | La Grange Park | 74.4% | 49.7%(+24.7)#75 | 46.1%(+28.3)#2,171 |
| 76. | Northfield | 74.3% | 49.7%(+24.6)#76 | 46.1%(+28.2)#2,182 |
| 77. | Park Ridge | 74.2% | 49.7%(+24.5)#77 | 46.1%(+28.1)#2,192 |
| 78. | Lemont | 74.1% | 49.7%(+24.4)#78 | 46.1%(+28.0)#2,212 |
| 79. | Volo | 74.1% | 49.7%(+24.4)#79 | 46.1%(+28.0)#2,219 |
| 80. | Ridgefield | 73.8% | 49.7%(+24.1)#80 | 46.1%(+27.7)#2,262 |
| 81. | Barrington | 73.1% | 49.7%(+23.4)#81 | 46.1%(+27.0)#2,351 |
| 82. | Dayton | 72.9% | 49.7%(+23.2)#82 | 46.1%(+26.8)#2,391 |
| 83. | Buffalo Grove | 72.6% | 49.7%(+22.9)#83 | 46.1%(+26.5)#2,443 |
| 84. | Batavia | 72.5% | 49.7%(+22.8)#84 | 46.1%(+26.4)#2,465 |
| 85. | Hamel | 72.5% | 49.7%(+22.8)#85 | 46.1%(+26.4)#2,470 |
| 86. | Oak Park | 72.4% | 49.7%(+22.7)#86 | 46.1%(+26.3)#2,476 |
| 87. | Indian Head Park | 72.4% | 49.7%(+22.7)#87 | 46.1%(+26.3)#2,482 |
| 88. | Glenview | 72.2% | 49.7%(+22.5)#88 | 46.1%(+26.1)#2,507 |
| 89. | Glen Ellyn | 72.2% | 49.7%(+22.5)#89 | 46.1%(+26.1)#2,508 |
| 90. | Bull Valley | 72.0% | 49.7%(+22.3)#90 | 46.1%(+25.9)#2,557 |
| 91. | Downers Grove | 71.9% | 49.7%(+22.2)#91 | 46.1%(+25.8)#2,562 |
| 92. | Spring Grove | 71.9% | 49.7%(+22.2)#92 | 46.1%(+25.8)#2,566 |
| 93. | Germantown Hills | 71.8% | 49.7%(+22.1)#93 | 46.1%(+25.7)#2,583 |
| 94. | Dunlap | 71.6% | 49.7%(+21.9)#94 | 46.1%(+25.5)#2,625 |
| 95. | Lake Petersburg | 71.6% | 49.7%(+21.9)#95 | 46.1%(+25.5)#2,626 |
| 96. | Lindenhurst | 71.5% | 49.7%(+21.8)#96 | 46.1%(+25.4)#2,636 |
| 97. | Algonquin | 71.4% | 49.7%(+21.7)#97 | 46.1%(+25.3)#2,654 |
| 98. | Oak Brook | 71.3% | 49.7%(+21.6)#98 | 46.1%(+25.2)#2,676 |
| 99. | Tower Lakes | 71.3% | 49.7%(+21.6)#99 | 46.1%(+25.2)#2,682 |
| 100. | Albers | 71.2% | 49.7%(+21.5)#100 | 46.1%(+25.1)#2,692 |
Common Questions
What are the Top 10 Cities with the Highest Percentage of Families with Income Above $100,000 in Illinois?
Top 10 Cities with the Highest Percentage of Families with Income Above $100,000 in Illinois are:
#1
91.3%
#2
88.1%
#3
87.8%
#4
87.6%
#5
87.4%
#6
87.2%
#7
87.1%
#8
86.7%
#9
86.3%
#10
86.1%
What city has the Highest Percentage of Families with Income Above $100,000 in Illinois?
Golf has the Highest Percentage of Families with Income Above $100,000 in Illinois with 91.3%.
What is the Percentage of Families with Income Above $100,000 in the State of Illinois?
Percentage of Families with Income Above $100,000 in Illinois is 49.7%.
What is the Percentage of Families with Income Above $100,000 in the United States?
Percentage of Families with Income Above $100,000 in the United States is 46.1%.