Zip Codes with the Highest Percentage of Families with Income Above $100,000 in Los Angeles, CA
RELATED REPORTS & OPTIONS
Family Income | $100k+
Los Angeles
Compare Zip Codes
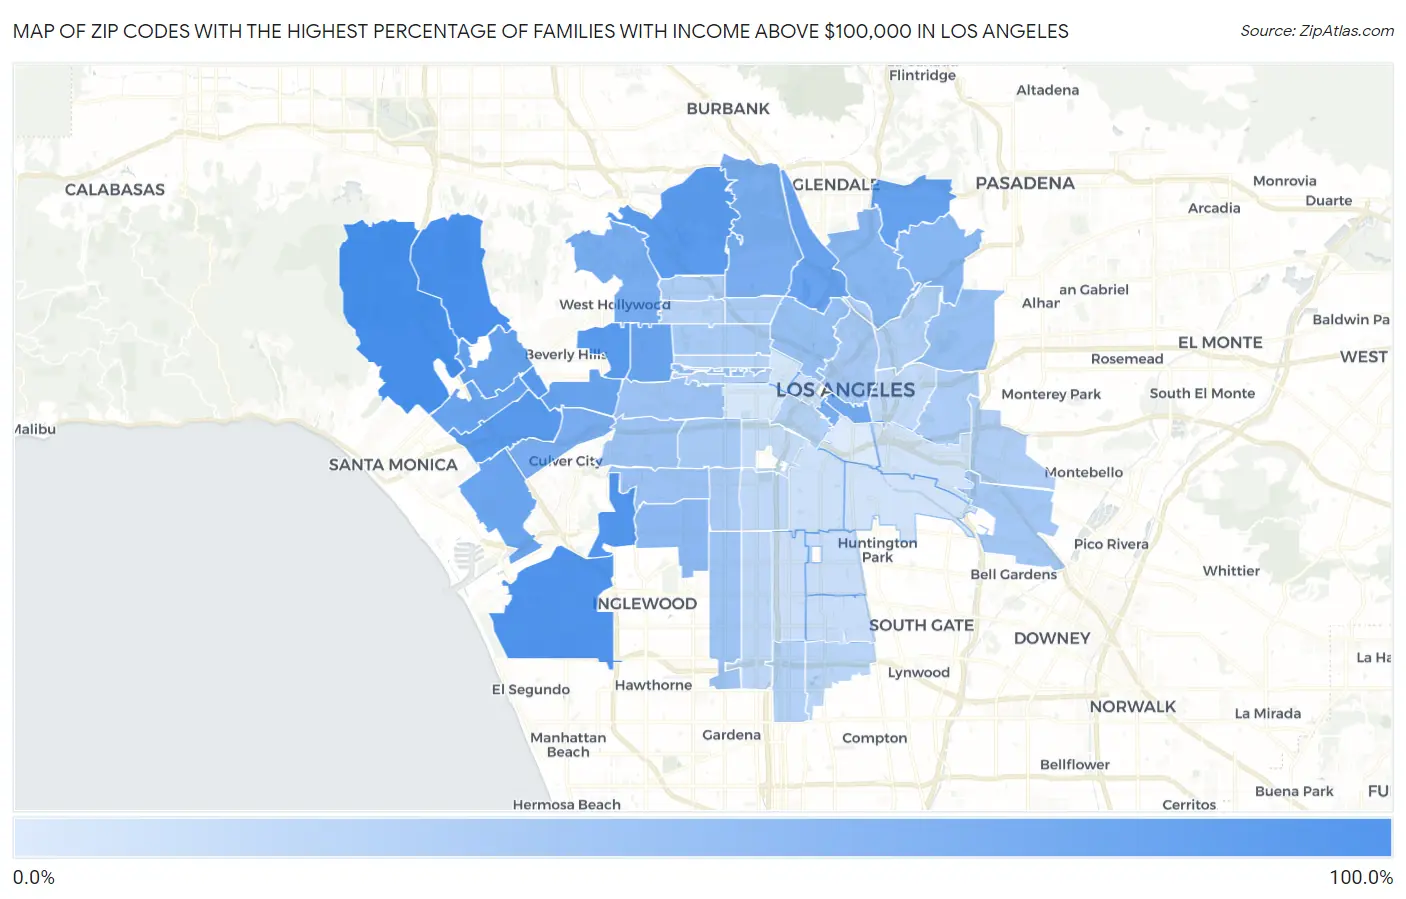
Map of Zip Codes with the Highest Percentage of Families with Income Above $100,000 in Los Angeles
12.4%
81.2%
Zip Codes with the Highest Percentage of Families with Income Above $100,000 in Los Angeles, CA
| Zip Code | Families with Income > $100k | vs State | vs National | |
| 1. | 90049 | 81.2% | 52.2%(+29.0)#100 | 46.1%(+35.1)#898 |
| 2. | 90077 | 79.5% | 52.2%(+27.3)#122 | 46.1%(+33.4)#1,085 |
| 3. | 90045 | 76.3% | 52.2%(+24.1)#170 | 46.1%(+30.2)#1,498 |
| 4. | 90056 | 74.2% | 52.2%(+22.0)#211 | 46.1%(+28.1)#1,843 |
| 5. | 90067 | 72.7% | 52.2%(+20.5)#250 | 46.1%(+26.6)#2,105 |
| 6. | 90048 | 72.6% | 52.2%(+20.4)#252 | 46.1%(+26.5)#2,118 |
| 7. | 90064 | 72.4% | 52.2%(+20.2)#255 | 46.1%(+26.3)#2,153 |
| 8. | 90068 | 71.0% | 52.2%(+18.8)#292 | 46.1%(+24.9)#2,407 |
| 9. | 90024 | 64.9% | 52.2%(+12.7)#455 | 46.1%(+18.8)#3,757 |
| 10. | 90041 | 64.4% | 52.2%(+12.2)#477 | 46.1%(+18.3)#3,898 |
| 11. | 90039 | 63.0% | 52.2%(+10.8)#512 | 46.1%(+16.9)#4,278 |
| 12. | 90025 | 62.5% | 52.2%(+10.3)#524 | 46.1%(+16.4)#4,407 |
| 13. | 90036 | 62.2% | 52.2%(+10.00)#529 | 46.1%(+16.1)#4,487 |
| 14. | 90035 | 61.8% | 52.2%(+9.60)#541 | 46.1%(+15.7)#4,599 |
| 15. | 90066 | 61.3% | 52.2%(+9.10)#547 | 46.1%(+15.2)#4,737 |
| 16. | 90013 | 57.8% | 52.2%(+5.60)#635 | 46.1%(+11.7)#5,841 |
| 17. | 90046 | 54.8% | 52.2%(+2.60)#713 | 46.1%(+8.70)#6,867 |
| 18. | 90034 | 54.7% | 52.2%(+2.50)#715 | 46.1%(+8.60)#6,905 |
| 19. | 90014 | 53.9% | 52.2%(+1.70)#737 | 46.1%(+7.80)#7,199 |
| 20. | 90027 | 53.8% | 52.2%(+1.60)#741 | 46.1%(+7.70)#7,230 |
| 21. | 90042 | 48.0% | 52.2%(-4.20)#871 | 46.1%(+1.90)#9,730 |
| 22. | 90065 | 48.0% | 52.2%(-4.20)#872 | 46.1%(+1.90)#9,734 |
| 23. | 90043 | 45.7% | 52.2%(-6.50)#931 | 46.1%(-0.400)#10,972 |
| 24. | 90010 | 42.6% | 52.2%(-9.60)#1,028 | 46.1%(-3.50)#12,763 |
| 25. | 90026 | 41.5% | 52.2%(-10.7)#1,053 | 46.1%(-4.60)#13,393 |
| 26. | 90032 | 39.7% | 52.2%(-12.5)#1,102 | 46.1%(-6.40)#14,596 |
| 27. | 90019 | 39.5% | 52.2%(-12.7)#1,106 | 46.1%(-6.60)#14,722 |
| 28. | 90016 | 39.3% | 52.2%(-12.9)#1,113 | 46.1%(-6.80)#14,856 |
| 29. | 90008 | 38.0% | 52.2%(-14.2)#1,154 | 46.1%(-8.10)#15,743 |
| 30. | 90047 | 37.1% | 52.2%(-15.1)#1,174 | 46.1%(-9.00)#16,425 |
| 31. | 90040 | 34.9% | 52.2%(-17.3)#1,230 | 46.1%(-11.2)#17,967 |
| 32. | 90012 | 33.7% | 52.2%(-18.5)#1,258 | 46.1%(-12.4)#18,772 |
| 33. | 90018 | 33.1% | 52.2%(-19.1)#1,275 | 46.1%(-13.0)#19,219 |
| 34. | 90004 | 32.8% | 52.2%(-19.4)#1,284 | 46.1%(-13.3)#19,425 |
| 35. | 90029 | 31.9% | 52.2%(-20.3)#1,303 | 46.1%(-14.2)#20,089 |
| 36. | 90062 | 31.9% | 52.2%(-20.3)#1,304 | 46.1%(-14.2)#20,090 |
| 37. | 90028 | 31.4% | 52.2%(-20.8)#1,313 | 46.1%(-14.7)#20,412 |
| 38. | 90063 | 31.3% | 52.2%(-20.9)#1,315 | 46.1%(-14.8)#20,478 |
| 39. | 90022 | 30.0% | 52.2%(-22.2)#1,344 | 46.1%(-16.1)#21,395 |
| 40. | 90005 | 29.7% | 52.2%(-22.5)#1,350 | 46.1%(-16.4)#21,619 |
| 41. | 90031 | 29.6% | 52.2%(-22.6)#1,353 | 46.1%(-16.5)#21,700 |
| 42. | 90015 | 28.7% | 52.2%(-23.5)#1,378 | 46.1%(-17.4)#22,308 |
| 43. | 90061 | 28.4% | 52.2%(-23.8)#1,382 | 46.1%(-17.7)#22,508 |
| 44. | 90020 | 27.6% | 52.2%(-24.6)#1,393 | 46.1%(-18.5)#23,032 |
| 45. | 90038 | 27.6% | 52.2%(-24.6)#1,395 | 46.1%(-18.5)#23,034 |
| 46. | 90059 | 25.2% | 52.2%(-27.0)#1,451 | 46.1%(-20.9)#24,587 |
| 47. | 90044 | 24.9% | 52.2%(-27.3)#1,457 | 46.1%(-21.2)#24,770 |
| 48. | 90037 | 23.3% | 52.2%(-28.9)#1,480 | 46.1%(-22.8)#25,645 |
| 49. | 90033 | 23.1% | 52.2%(-29.1)#1,485 | 46.1%(-23.0)#25,735 |
| 50. | 90007 | 22.1% | 52.2%(-30.1)#1,497 | 46.1%(-24.0)#26,242 |
| 51. | 90002 | 20.0% | 52.2%(-32.2)#1,520 | 46.1%(-26.1)#27,214 |
| 52. | 90001 | 19.9% | 52.2%(-32.3)#1,523 | 46.1%(-26.2)#27,284 |
| 53. | 90003 | 19.6% | 52.2%(-32.6)#1,525 | 46.1%(-26.5)#27,408 |
| 54. | 90017 | 19.3% | 52.2%(-32.9)#1,529 | 46.1%(-26.8)#27,556 |
| 55. | 90011 | 18.5% | 52.2%(-33.7)#1,546 | 46.1%(-27.6)#27,885 |
| 56. | 90058 | 16.5% | 52.2%(-35.7)#1,576 | 46.1%(-29.6)#28,640 |
| 57. | 90023 | 16.3% | 52.2%(-35.9)#1,578 | 46.1%(-29.8)#28,689 |
| 58. | 90006 | 15.2% | 52.2%(-37.0)#1,588 | 46.1%(-30.9)#29,031 |
| 59. | 90057 | 14.8% | 52.2%(-37.4)#1,593 | 46.1%(-31.3)#29,167 |
| 60. | 90021 | 12.4% | 52.2%(-39.8)#1,610 | 46.1%(-33.7)#29,864 |
1
Common Questions
What are the Top 10 Zip Codes with the Highest Percentage of Families with Income Above $100,000 in Los Angeles, CA?
Top 10 Zip Codes with the Highest Percentage of Families with Income Above $100,000 in Los Angeles, CA are:
What zip code has the Highest Percentage of Families with Income Above $100,000 in Los Angeles, CA?
90049 has the Highest Percentage of Families with Income Above $100,000 in Los Angeles, CA with 81.2%.
What is the Percentage of Families with Income Above $100,000 in Los Angeles, CA?
Percentage of Families with Income Above $100,000 in Los Angeles is 44.0%.
What is the Percentage of Families with Income Above $100,000 in California?
Percentage of Families with Income Above $100,000 in California is 52.2%.
What is the Percentage of Families with Income Above $100,000 in the United States?
Percentage of Families with Income Above $100,000 in the United States is 46.1%.